
Transcriptomic Analysis of Flower Color Changes in Impatiens uliginosa in Response to Copper Stress
Abstract
:1. Introduction
2. Materials and Methods
2.1. Plant Materials and Treatments
2.2. Experimental Methods
2.2.1. Transcriptome Sequencing and Analysis
2.2.2. IuGT and IuGST Gene Cloning and Sequence Analysis
2.2.3. Related Gene Expression and Analysis
2.2.4. Data Processing
3. Results
3.1. Transcriptome Sequencing and Assembly from De Novo
3.2. Physical and Chemical Properties and Physiological Analysis of Candidate Genes
3.3. qRT-PCR Validation of the Candidate Genes
4. Discussion
5. Conclusions
Supplementary Materials
Author Contributions
Funding
Data Availability Statement
Acknowledgments
Conflicts of Interest
References
- Li, B.; Dao, J.R.; Zhu, R.Y.; He, H.; Meng, X.Q.; Han, F.X. Distribution, accumulation and risk assessment of heavy metal pollution in Dianchi Lake. Environ. Chem. 2021, 40, 1808–1818. [Google Scholar]
- Zhang, G.H.; Xie, Q.; Yan, K.; Li, Z.Y.; Su, T.; Yang, Y.L. Pollution Characteristics and Ecological Risk Assessment of Heavy Metals in Sediments of Dianchi Outer Lake During the ‘13th Five-Year Plan Period’. J. Soil Water Conserv. 2023, 37, 240–247. [Google Scholar]
- Peng, G.Y.; Hu, L.; Huang, C.; Yang, K.; Wan, W.; Huang, C.G. Transcriptome Analysis of Response to Heavy Metal Copper Stress in Setcreasea purpurea Root Tissue. Biotechnol. Bull. 2022, 38, 83–94. [Google Scholar]
- Zhang, C.; Tang, C.C.; Wang, J.Y.; Guo, L.; Wang, L.; Li, W. Advances on transcriptome of plants under stresses. J. Biol. 2017, 34, 86–90. [Google Scholar]
- García-Vico, L.; Sánchez, R.; Fernández, G.; Sanz, C.; Pérez, A.G. Study of the olive β-glucosidase gene family putatively involved in the synthesis of phenolic compounds of virgin olive oil. J. Sci. Food Agric. 2021, 101, 5409–5418. [Google Scholar] [CrossRef]
- Gachon, C.M.; Langlois-Meurinne, M.; Saindrenan, P. Plant secondary metabolism glycosyl transferases: The emerging functional analysis. Trends Plant Sci. 2005, 10, 542–549. [Google Scholar] [CrossRef]
- Li, P.; Li, Y.J.; Zhang, F.J.; Zhang, G.Z.; Jiang, X.Y.; Yu, H.M.; Hou, B.K. The Arabidopsis UDP-glycosyltransferases UGT79B2 and UGT79B3, contribute to cold, salt and drought stress tolerance via modulating anthocyanin accumulation. Plant J. 2017, 89, 85–103. [Google Scholar] [CrossRef]
- Hu, Z.; He, J.; Chen, K.; Wang, Z.; Liu, J.; Qiao, X.; Ye, M. Molecular cloning and biochemical characterization of a new flavonoid glycosyltransferase from the aquatic plant lotus. Biochem. Biophys. Res. Commun. 2019, 510, 315–321. [Google Scholar] [CrossRef]
- Cheng, J.; Wei, G.; Zhou, H.; Gu, C.; Vimolmangkang, S.; Liao, L.; Han, Y. Unraveling the mechanism underlying the glycosylation and methylation of anthocyanins in peach. Plant Physiol. 2014, 166, 1044–1058. [Google Scholar] [CrossRef]
- Young, L.; Akhov, L.; Kulkarni, M.; You, F.; Booker, H. Fine-mapping of a putative glutathione S-transferase (GST) gene responsible for yellow seed colour in flax (Linum usitatissimum). BMC Res. Notes 2022, 15, 72. [Google Scholar] [CrossRef]
- Lu, S.W.; Zheng, X.A.; Wang, J.Y.; Fang, J.G. Research Progress on the Metabolism of Flavonoids in Grape. Acta Hortic. Sin. 2021, 48, 2506–2524. [Google Scholar]
- Kim, S.H.; Sung, S.Y.; Kim, Y.S.; Jo, Y.D.; Kang, S.Y.; Kim, J.B.; Ahn, J.W.; Ha, B.K.; Kim, D.S. Isolation and characterization of differentially expressed genes in petals of Chrysanthemum mutant cultivars developed by irradiation. Sci. Hortic. 2015, 189, 132–138. [Google Scholar] [CrossRef]
- Cao, Y.; Xu, L.; Xu, H.; Yang, P.; He, G.; Tang, Y.; Qi, X.; Song, M.; Ming, J. LhGST is an anthocyanin-related glutathione S-transferase gene in Asiatic hybrid lilies (Lilium spp.). Plant Cell Rep. 2021, 40, 85–95. [Google Scholar] [CrossRef]
- Jin, X.H.; Hong, Y.; Huang, H.; Dai, S.L.; Zhu, Y. Isolation and Expression Analysis of GST Gene Encoding Glutathione S-transferase from Senecio cruentus. Acta Hortic. Sin. 2013, 40, 1129–1138. [Google Scholar]
- Yu, S.X. Balsaminaceae of China; Peking University Press: Beijing, China, 2012; p. 147. [Google Scholar]
- Li, Y.; Huang, W.L.; Lin, Y.F.; Luo, C.; Li, X.Y.; Liu, Y.L.; Zhu, J.P.; Feng, Z.X.; Huang, M.J.; Huang, H.Q. Cloning and Expression Analysis of CHI Genes in Impatiens uliginosa. Acta Agric. Univ. Jiangxiensis 2020, 42, 468–474. [Google Scholar]
- Liu, Y.L.; Feng, Z.X.; Zhu, J.P.; Luo, C.; Liang, Y.; Li, Y.; Tong, Z.K.; Huang, H.Q.; Huang, M.J. Cloning and Expression Analysis of AP3/DEF Homologous Genes Associated with Floral Development in Impatiens uliginosa. Mol. Plant Breed. 2020, 18, 6626–6632. [Google Scholar]
- Guo, J.W.; Huang, Q.; Ma, M.L.; Sun, Z.H.; Wen, Y.H.; Huang, H.Q.; Huang, M.J.; Wang, Q. Determination of Metal Elements in the Petals of Yunnan Wild Impatiens in Different Colors. J. Anhui Agric. Sci. 2019, 47, 179–181. [Google Scholar]
- Li, Y.; Wei, C.M.; Li, X.Y.; Meng, D.C.; Gu, Z.J.; Qu, S.P.; Huang, M.J.; Huang, H.Q. De novo transcriptome sequencing of Impatiens uliginosa and the analysis of candidate genes related to spur development. BMC Plant Biol. 2022, 22, 553. [Google Scholar] [CrossRef]
- Li, Y.; Huang, W.L.; Li, X.Y.; Zhang, Y.D.; Meng, D.C.; Wei, C.M.; Huang, M.J.; Huang, H.Q. The cellular and molecular basis of the spur development in Impatiens uliginosa. Hortic. Res. 2024, 11, uhae015. [Google Scholar] [CrossRef]
- Li, R.H. Effects of Copper and Aluminum on Growth and Flower Color of Impatiens hawkeri. Master’s Thesis, Hebei Agricultural University, Baoding, China, 2005. [Google Scholar]
- Li, Q.M.; Li, W.X.; Cao, M.H.; Liu, S.; Zhang, T.Y.; Wang, Q.; Huang, M.J.; Huang, H.Q. Physiological and Biochemical Correlations between Color of Impatiens uliginosa Flower and Nutrient Supply on Copper. Fujian J. Agric. Sci. 2021, 36, 1323–1329. [Google Scholar]
- Li, Q.M.; Li, W.X.; Li, X.Y.; Li, Y.; Qu, S.P.; Huang, M.J.; Huang, H.Q. Effects of Copper Stress on Flower Development and Physiological and Biochemical Characteristics of Impatiens uliginosa. Shandong Agric. Sci. 2022, 54, 74–79. [Google Scholar]
- Matsui, K.; Tomatsu, T.; Kinouchi, S.; Suzuki, T.; Sato, T. Identification of a gene encoding glutathione S-transferase that is related to anthocyanin accumulation in buckwheat (Fagopyrum esculentum). J. Plant Physiol. 2018, 231, 291–296. [Google Scholar] [CrossRef] [PubMed]
- Sui, X.; Zhao, M.; Han, X.; Zhao, L.; Xu, Z. RrGT1, a key gene associated with anthocyanin biosynthesis, was isolated from Rosa rugosa and identified via overexpression and VIGS. Plant Physiol. Biochem. 2019, 135, 19–29. [Google Scholar] [CrossRef]
- Yonekura-Sakakibara, K.; Fukushima, A.; Nakabayashi, R.; Hanada, K.; Matsuda, F.; Sugawara, S.; Inoue, E.; Kuromori, T.; Ito, T.; Shinozaki, K.; et al. Two glycosyltransferases involved in anthocyanin modification delineated by transcriptome independent component analysis in Arabidopsis thaliana. Plant J. 2012, 69, 154–167. [Google Scholar] [CrossRef] [PubMed]
- Hassani, D.; Liu, H.L.; Chen, Y.N.; Wan, Z.B.; Zhuge, Q.; Li, S.X. Analysis of biochemical compounds and differentially expressed genes of the anthocyanin biosynthetic pathway in variegated peach flowers. Genet. Mol. Res. 2015, 14, 13425–13436. [Google Scholar] [CrossRef]
- Tasaki, K.; Yoshida, M.; Nakajima, M.; Higuchi, A.; Watanabe, A.; Nishihara, M. Molecular characterization of an anthocyanin-related glutathione S-transferase gene in Japanese gentian with the CRISPR/Cas9 system. BMC Plant Biol. 2020, 20, 370. [Google Scholar] [CrossRef]


| Primer Name | Primer Sequence (5′-3′) |
|---|---|
| IuGTF | GATCCAGTGCCACTCTGAAACAAAGAAAG |
| IuGTR | TTAGACATGAGACAGTAAGACACTTATGAGC |
| IuGSTF | ATGGCAGGAAGAGATTCTTCCGTC |
| IuGSTR | TTAGTTCTTAGCTTGAGATTCAACCATGGC |
| qIuGTF | GTCACCTTCGTCAACACCGA |
| qIuGTR | AGTCCATCGGGAATGGCTTG |
| qIuGSTF | CACTTAATCCTCCCCTCGG |
| qIuGSTR | TCAACCACCCCAAGAAGCAT |
| IuActinF | TGAATGTCCCTGCTGTTTG |
| IuActinR | ACCTTCCGCATAACTTTACC |
| Attributes | Cu0 | Cu10 | Cu20 |
|---|---|---|---|
| Raw reads | 55,657,964 | 58,102,838 | 55,994,622 |
| Clean reads | 55,287,682 | 57,653,418 | 55,597,734 |
| Clean bases | 8,188,113,484 | 8,477,755,077 | 8,199,632,407 |
| Q30 (%) | 94.57 | 94.58 | 94.5 |
| GC content (%) | 44.55 | 44.69 | 44.82 |
| Total mapped | 22,954,371 (83.04%) | 24,066,941 (83.49%) | 23,599,843 (84.89%) |
| Attributes | Unigenes | Transcripts |
|---|---|---|
| Total number | 40,610 | 70,319 |
| Total base | 44,193,278 | 84,620,119 |
| Largest length (bp) | 15,701 | 15,701 |
| Smallest length (bp) | 201 | 201 |
| Average length (bp) | 1088.24 | 1203.37 |
| N50 length (bp) | 1812 | 1810 |
| Unigene Number | Unigene Percent | |
|---|---|---|
| GO | 20,926 | 52.38% |
| KEGG | 10,945 | 27.40% |
| COG | 22,343 | 55.93% |
| NR | 24,238 | 60.67% |
| Swiss-Prot | 19,456 | 48.70% |
| Pfam | 19,695 | 49.30% |
| Total | 39,949 | 100% |
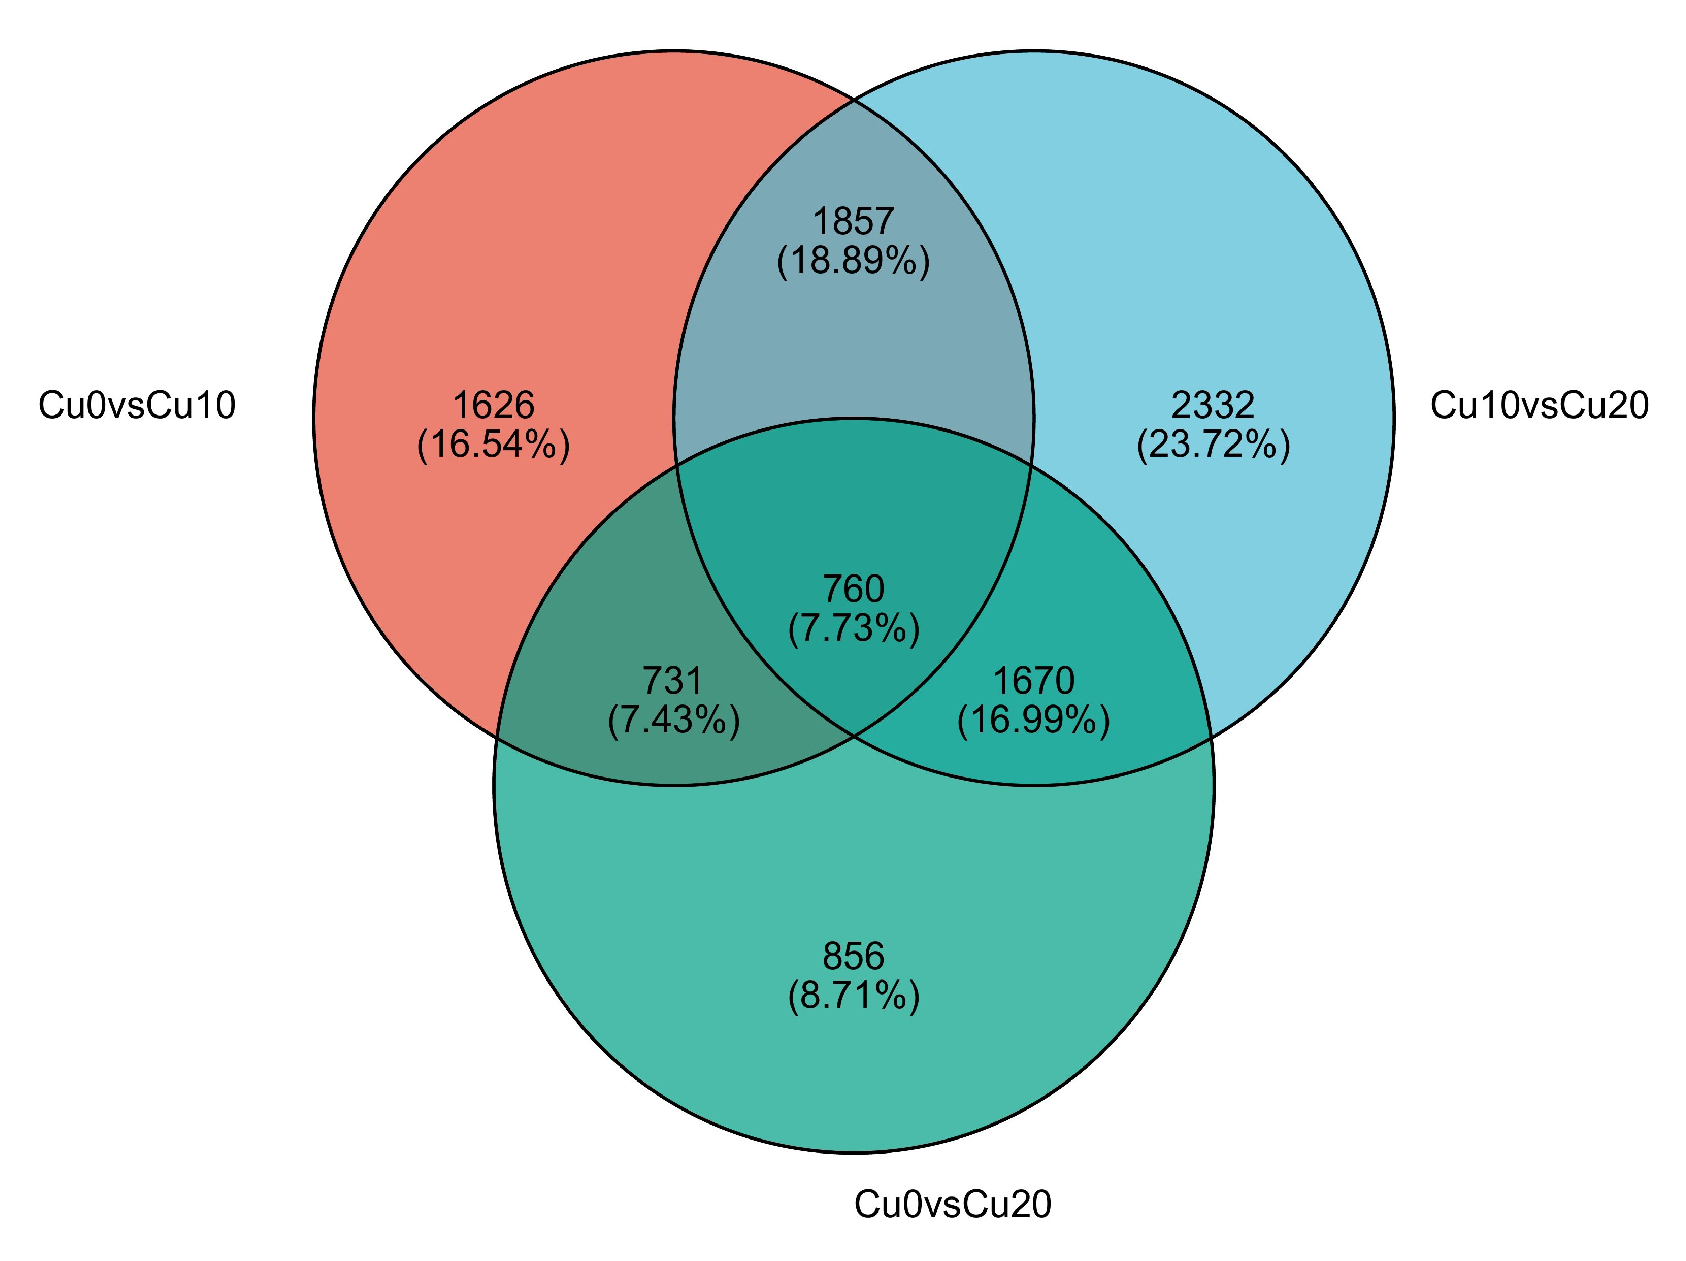
| Diff_Group | Total DEG | Up | Down |
|---|---|---|---|
| Cu0 vs. Cu10 | 4974 | 3290 | 1684 |
| Cu0 vs. Cu20 | 4017 | 1699 | 2318 |
| Cu10 vs. Cu20 | 6619 | 1846 | 4773 |
| Basic Physicochemical Properties | IuGT | IuGST |
|---|---|---|
| Molecular formula | C2469H3808N654O718S21 | C1202H1859N293O335S6 |
| Theoretical isoelectric point | 5.41 | 5.42 |
| Molecular weight | 54,814.61 Da | 25,967.10 Da |
| Total number of atoms | 7670 | 3695 |
| Negatively charged residue (Asp + Glu) | 60 | 31 |
| Positively charged residue (Arg + Lys) | 44 | 25 |
| Instability index | 44.99 | 40.86 |
| Total average hydrophilicity index | −0.151 | 0.015 |
Disclaimer/Publisher’s Note: The statements, opinions and data contained in all publications are solely those of the individual author(s) and contributor(s) and not of MDPI and/or the editor(s). MDPI and/or the editor(s) disclaim responsibility for any injury to people or property resulting from any ideas, methods, instructions or products referred to in the content. |
© 2024 by the authors. Licensee MDPI, Basel, Switzerland. This article is an open access article distributed under the terms and conditions of the Creative Commons Attribution (CC BY) license (https://creativecommons.org/licenses/by/4.0/).
Share and Cite
Tan, Y.; Zhang, X.; Li, Q.; Li, X.; Luo, L.; He, H.; Liang, G.; Huang, H.; Huang, M. Transcriptomic Analysis of Flower Color Changes in Impatiens uliginosa in Response to Copper Stress. Horticulturae 2024, 10, 412. https://doi.org/10.3390/horticulturae10040412
Tan Y, Zhang X, Li Q, Li X, Luo L, He H, Liang G, Huang H, Huang M. Transcriptomic Analysis of Flower Color Changes in Impatiens uliginosa in Response to Copper Stress. Horticulturae. 2024; 10(4):412. https://doi.org/10.3390/horticulturae10040412
Chicago/Turabian StyleTan, Yi, Xiaoli Zhang, Qinmei Li, Xinyi Li, Liang Luo, Haihao He, Guangrong Liang, Haiquan Huang, and Meijuan Huang. 2024. "Transcriptomic Analysis of Flower Color Changes in Impatiens uliginosa in Response to Copper Stress" Horticulturae 10, no. 4: 412. https://doi.org/10.3390/horticulturae10040412