Article

LbHSP17.9 Participated in the Regulation of Cold Stress in Cut Lily Flowers

1
Faculty of Architecture and City Planning, Kunming University of Science and Technology, Kunming 650021, China
2
College of Agronomy and Life Sciences, Kunming College, Kunming 650021, China
3
Key Laboratory of Vegetable Biology of Yunnan Province, College of Landscape and Horticulture, Yunnan Agricultural University, Kunming 650201, China
*
Authors to whom correspondence should be addressed.
Horticulturae 2024, 10(3), 287; https://doi.org/10.3390/horticulturae10030287
Submission received: 8 February 2024 / Revised: 6 March 2024 / Accepted: 14 March 2024 / Published: 17 March 2024
(This article belongs to the Section Biotic and Abiotic Stress)

Abstract

:
Heat shock proteins (HSPs) play important roles in plant stress resistance, but it is not clear whether small molecular HSPs (sHSPs) are involved in the cold stress resistance of lily flowers. In this study, we cloned LbHSP17.9 and found that its expression was up-regulated under cold stress. When LbHSP17.9 was silenced (TRV2::LbHSP17.9) using virus-induced gene silencing in cut lily flowers, the content of malondialdehyde was increased under 4 °C stress treatment. The catalase (CAT) activity in TRV2::LbHSP17.9 was significantly lower than in TRV2 in the first 7 days, and the peroxidase (POD) activity in TRV2::LbHSP17.9 was significantly lower than in TRV2 after 4 days of 4 °C stress. Further analysis showed that the transcription levels of LbCu/ZnSOD, LbMnSOD and LbCAT in TRV2::LbHSP17.9 were lower than those of TRV2 under 4 °C stress. When LbHSP17.9 was overexpressed in lily petal disks, the OE-LbHSP17.9 disks faded later than the controls at 4 °C and the relative conductivity decreased significantly. Overexpression of LbHSP17.9 in Arabidopsis thaliana resulted in fewer injury symptoms and lower MDA content than wild type under 4 °C stress. Therefore, we speculate that LbHSP17.9 can improve the resistance of lily flowers to cold stress.

1. Introduction

Lilium spp. are perennial herbs in the family Liliaceae, with high ornamental, edible and medicinal value. Lily flowers are harvested at the green bud stage and transported from fields to market through cold chain transportation. During this process, low temperature leads to slow bud development, abnormal flower opening, flower deformity and premature aging [1], which shortens the vase life and reduces commercial value. Therefore, studying the cold-stress resistance mechanism of cut lilies has important practical significance for their breeding, production and sales.
Environmental stress factors greatly threaten plant growth and development. In the long-term evolutionary process, a series of defense mechanisms of plants have been generated to adapt to environmental stress, including an increase in the content of heat shock proteins (HSPs) and free proline in plant tissues [2,3,4]. According to molecular weight and sequence homology, HSPs are divided into five subfamilies: sHSP, HSP60, HSP70, HSP90 and HSP100 [5]. The subfamily sHSP are low molecular-weight HSPs (12–40 kDa), named because of their high expression in the process of stress. They are widely found in prokaryotic and eukaryotic cells and contain a conservative α-crystallin domain, an N-terminal domain and a carboxyl-terminal extension domain [6]. The sHSPs cannot refold unnatural proteins by themselves, but they have a high ability to bind, stabilize and prevent aggregation of unnatural proteins through hydrophobic interactions, thereby promoting the refolding of ATP-dependent chaperone proteins such as the DNAK system or ClpB/DNAK [7].
In plants, sHSPs are more diverse than other chaperone protein families in terms of sequence similarity, cellular location and function [8]. In plant cells, sHSPs cannot be detected under normal physiological conditions, but their expression can be induced under drought, saline–alkali, oxidative, low temperature and biological stresses, to safeguard other proteins from stress-induced damage and maintain the integrity and dynamic balance of cells, thereby improving the tolerance of plants [9,10].
Many studies have shown that increasing the expression of HSP genes can improve the ability of plants to resist low-temperature stress. For example, the overexpression of SLHSP17.7 improved the cold tolerance of transgenic tomatoes [11]. The overexpression of sHSPs in Arabidopsis thaliana can induce high levels of antioxidant enzymes, thereby improving their tolerance to high temperature, salt, osmotic pressure and oxidative stress [12]. As a sHSP of cytoplasmic class I, HSP17.4 showed high levels of expression in A. thaliana infected with the biotrophic pathogen Pseudomonas lilacin [13]. Sato and Yokoya [14] showed that the survival rate of transgenic rice seedlings with high expression of sHSP17.7 after 6 days of drought treatment was significantly higher than that of wild type (WT). After 14 days of rehydration, 53.3% of transgenic seedlings were regenerated, but all WT seedlings died.
Through the previous transcriptome sequencing of lilies, we obtained the gene LbHSP17.9 and found that its expression increased under temperature stress. We further silenced and overexpressed LbHSP17.9 in cut lilies and heterologously overexpressed it in A. thaliana to study its function under low-temperature stress. This study is of great significance for exploring the cold stress resistance of lily petals.

2. Materials and Methods

2.1. Materials and Treatment

The experimental material was Lilium cultivar ‘Manissa’. The lily bulbs were purchased from Dounan Flower Market (Kunming, China) and planted in the greenhouse of Kunming University of Science and Technology. The lily flowers harvested at the green bud stage were cut in distilled water with stems 5 cm long. For the control treatment, the cut flowers were cultured in a flask with distilled water and put in an artificial climate box (23 °C, 14 h light/21 °C, 10 h dark treatment light flux density 400 µmol·m−2·s−1 and relative humidity 55%). For the abscisic acid (ABA) and γ-aminobutyric acid (GABA) treatments, the cut flowers were inserted into a flask with 100 µmol·L−1 ABA solution or 40 mmol·L−1 GABA solution, and then placed in an artificial climate box (same conditions as the control). For low-/high-temperature stress treatment, the cut flowers were inserted into a flask with distilled water and then placed in an artificial climate box (4 °C/42 °C, light flux density 400 µmol·m−2·s−1 and relative humidity 55%). All materials were collected after 3 h of treatment, immediately stored in liquid nitrogen and then stored at −80 °C for the next physiological and molecular analyses.

2.2. Extraction and Reverse Transcription of mRNA

Using lily petals as materials, RNA was extracted using the Trizol method according to Yin et al. [15], reverse transcribed with a Thermo Scientific RevertAid First Strand cDNA Synthesis Kit (Thermo Fisher Scientific, Waltham, MA, USA) and the cDNA was stored at −20 °C.

2.3. Reverse Transcription RT-PCR

According to the transcriptome sequencing results and the homologous sequences retrieved from the NCBI database (https://www.ncbi.nlm.nih.gov/ (accessed on 11 May 2023)), the Primer Premier 5.0 software was used to design the specific primers LbHSP17.9-F and LbHSP17.9-R (Supplementary Table S1), and the cDNA of lily at the yellow-bud stage was used as a template for RT-PCR amplification. The PCR reaction procedure was 94 °C pre-denaturation for 3 min, denaturation at 98 °C for 10 s, annealing for 30 s at 54.5 °C, extension at 72 °C for 1 min/1000 bp and 35 cycles. The PCR products were detected by 1% agarose gel electrophoresis. If bright bands were obtained and the position size was accurate, they were sent to the Kunming Branch of Beijing Qingke Biotechnology Co., Ltd. (Beijing, China) for sequencing.

2.4. Real-Time Fluorescence Quantitative PCR (qPCR)

The Primer Premier 5.0 software was used to design the primers (Supplementary Table S1). The reaction system was Hieff® qPCR SYBR® Green Master Mix (Shanghai Yisheng Biotechnology Co., Ltd., Shanghai, China), 10 µL; positive and negative primers, 0.4 µL each; template DNA, 2 µL; and sterile ultrapure water, 7.2 µL. The amplification procedure was 95 °C pre-denaturation for 5 min, 95 °C denaturation for 10 s, 60 °C annealing for 30 s, extension at 72 °C for 30 s and 40 cycles. The qPCR analysis was performed with Lbction as the internal reference gene. The relative expression was calculated using the 2−ΔΔCT method [16].

2.5. Bioinformatics Analysis of LbHSP17.9

The amino acid sequences were aligned by DNAMAN 6.0 (LynnonBiosoft, San Ramon, CA, USA). The second-order protein structure was predicted by the online software SOPM (http://npsa-pbil.ibcp.fr/, accessed on 11 August 2023). The third-order protein structure was predicted by SWISS-MODEL (http://swissmodel.expasy.org/, accessed on 11 August 2023). The isoelectric point (pI), molecular weight (Mw) and protein instability were calculated using EXPASY (http://us.expasy.org/tools/pi_tool.htm, accessed on 11 August 2023). The transmembrane structure was predicted by TMHMM-2.0 (http://www.cbs.dtu.dk/services/TMHMM-2.0/, accessed on 11 August 2023). Motif analysis of protein was performed by MEME-5.5.5 (http://meme-suite.org/tools/meme, accessed on 11 August 2023). The phylogenetic tree was produced using MEGA7.0.

2.6. Construction of Silencing Vector and Virus-Induced Gene Silencing (VIGS) Treatment

The primers LbHSP17.9-F and LbHSP17.9-R were designed according to the LbHSP17.9 sequence (Supplementary Table S1). The interference fragment of HSP17.9 was amplified by using the cDNA sample of ‘Manissa’ as a template. The PTRV2 vector was digested by SacI and BamHI double enzymes, recovered and recombined with the above PCR product LbHSP17.9. The recombinant product was transformed into E. coli, with specific steps according to Liu et al. [16].
For VIGS, the transformation solution containing TRV1, TRV2 and the TRV2::LbHSP17.9 plasmid was adjusted to OD600 of 1.1, respectively, and then was mixed in a volume ratio of 1:1 to obtain the TRV1/TRV2 and TRV1/TRV2::LbHSP17.9 infection solution. The stem of a cut lily was immersed into the infection solution, using the vacuum infection method of Liu et al. [16]. Samples were collected every 72 h to measure the relative expression of antioxidant enzyme genes, MDA content and the activities of superoxide dismutase (SOD), catalase (CAT) and peroxidase (POD).

2.7. Construction of Overexpression Vector

The coding sequence of LbHSP17.9 was cloned (primers shown in Supplementary Table S1) into the overexpression vector PC2300S, and the overexpression vector OE-LbHSP17.9 was constructed based on the procedure of Liu et al. [16].

2.8. Transient Overexpression of LbHSP17.9 in Lily Petal Disks

The bacterial culture of the overexpression vector OE-LbHSP17.9 was resuspended in the infiltration buffer (10 mM MES, 200 M acetylsyringone, 10 mM MgCl, pH 5.6) and cultured in darkness at 22 °C for 5 h. Disks with a diameter of 1 cm were taken from the lily petals and soaked in the bacterial solution under negative pressure (−0.07 MPa) for 15 min. The soaked disks were washed with sterile water, placed on filter paper in a Petri dish and incubated at 22 °C for 96 h. Finally, the Petri dishes were placed in an artificial climate box (control 24 °C/cold stress 4 °C, 14 h light/10 h dark, light flux density of 400 µmol·m−2·s−1 and relative humidity of 55%). Distilled water was sprayed into the Petri dish regularly every day to maintain the humidity of the disk. All materials were collected on days 0, 2, 4 and 6, immediately stored in liquid nitrogen and then stored at −80 °C.

2.9. Acquisition of OE-LbHSP17.9 Transgenic A. thaliana

The A. thaliana Col-0 was transformed using the floral dip method (Liu et al., 2023) [16]. Positive plants were selected through kanamycin (50 mg·L−1) screening (Supplementary Figure S1) and PCR confirmation (Supplementary Figure S2).

2.10. Cold Stress Treatment of A. thaliana

The WT and the third-generation transgenic A. thaliana seeds were sterilized and germinated in pots with special substrates and cultured in a greenhouse. After 8 weeks of growth, the plants were treated with 15 days of 4 °C stress in a chamber (4 °C, 14 h light/10 h dark, light flux density 400 µmol·m−2·s−1 and relative humidity 55%).

2.11. Determination of MDA Content and SOD, CAT and POD Activities

Using a scalpel, 0.2 g samples of the petals were taken. These samples were used to determine the MDA content and antioxidant enzyme activities according to the instructions of the kits: MDA analysis kit (A003-1-2, Nanjing Jiancheng, Nanjing, China), SOD analysis kit (S0102, Beyotime, Shanghai, China), POD analysis kit (A084-3, Nanjing Jiancheng, Nanjing, China) and CAT analysis kit (S0051, Beyotime, Shanghai, China).

2.12. Determination of Relative Electrical Conductivity

Samples of 1 cm diameter discs were taken from 10 petals and immersed in 10 mL of deionized water for 12 h. The conductivity (RI) of the extract was measured by A DDBJ-350 common box portable conductivity meter (Shanghai Yidian Scientific Instrument, Shanghai, China) and then the extract was heated in a boiling water bath for 30 min, cooled to room temperature, shaken, and the conductivity (R2) of the extract measured again. The relative electrical conductivity (REC) was calculated using the equation REC = R1/R2 × 100%.

2.13. Data Analysis

All experiments were repeated three times, and statistical analysis was conducted using SPSS 18.0 (SPSS Inc., Chicago, IL, USA). Duncan’s multiple range test was performed to assess the differences among treatments. Differences in means among treatments were considered significant at p < 0.05.

3. Results and Analysis

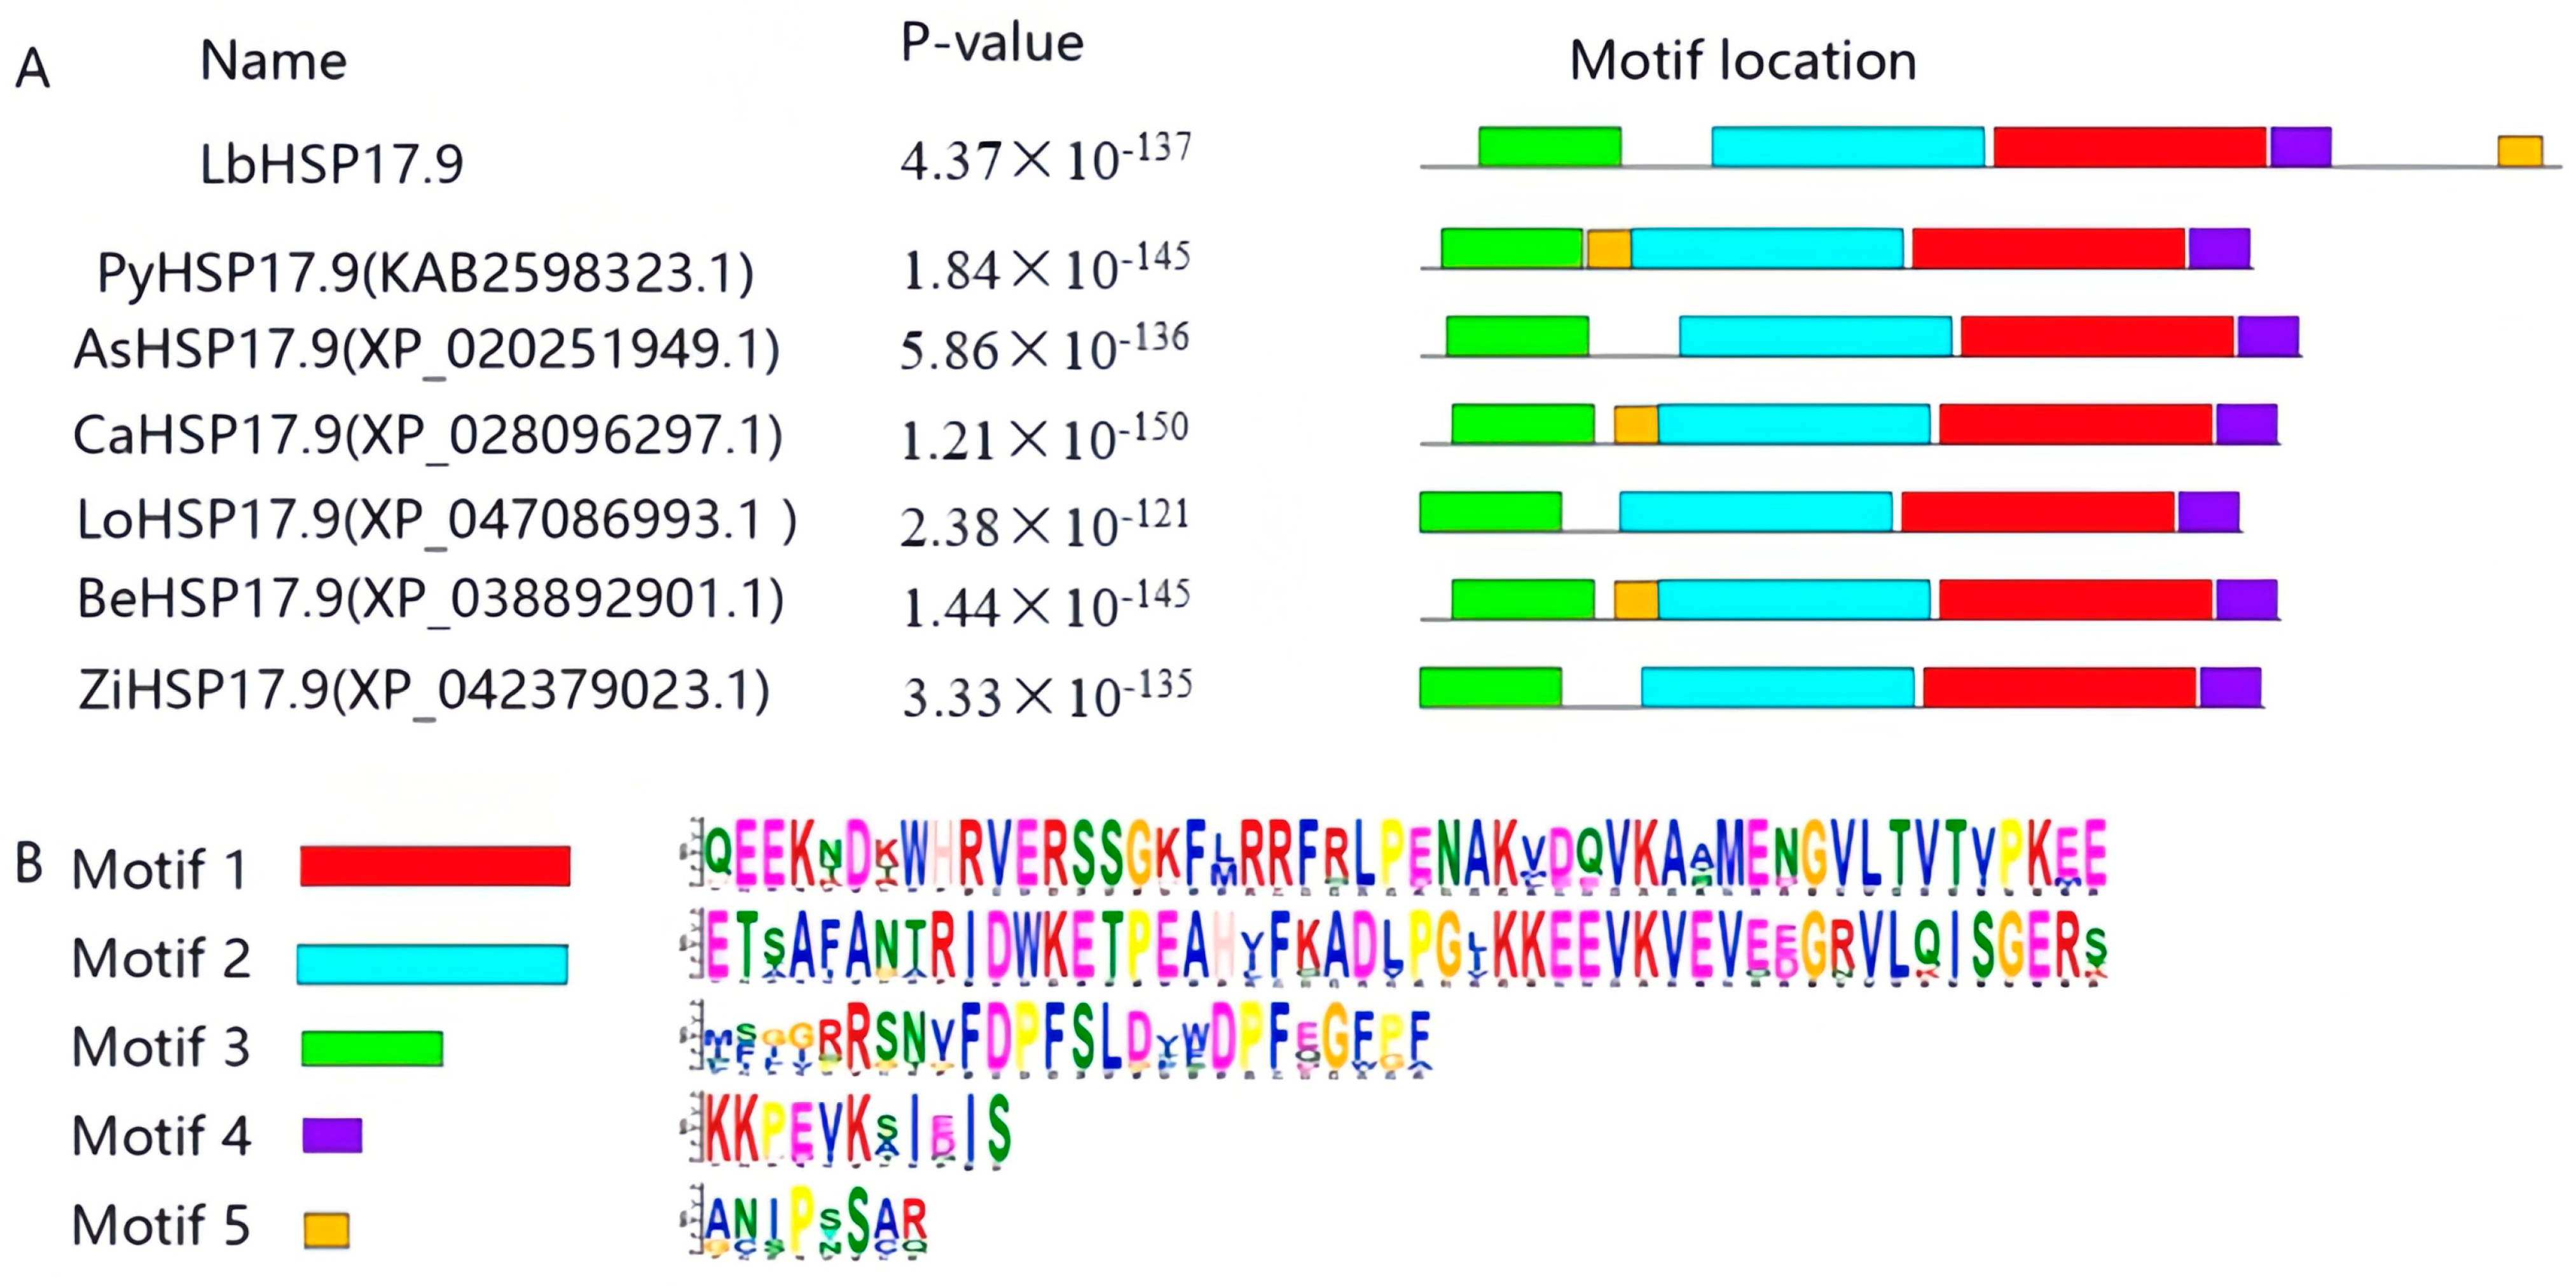
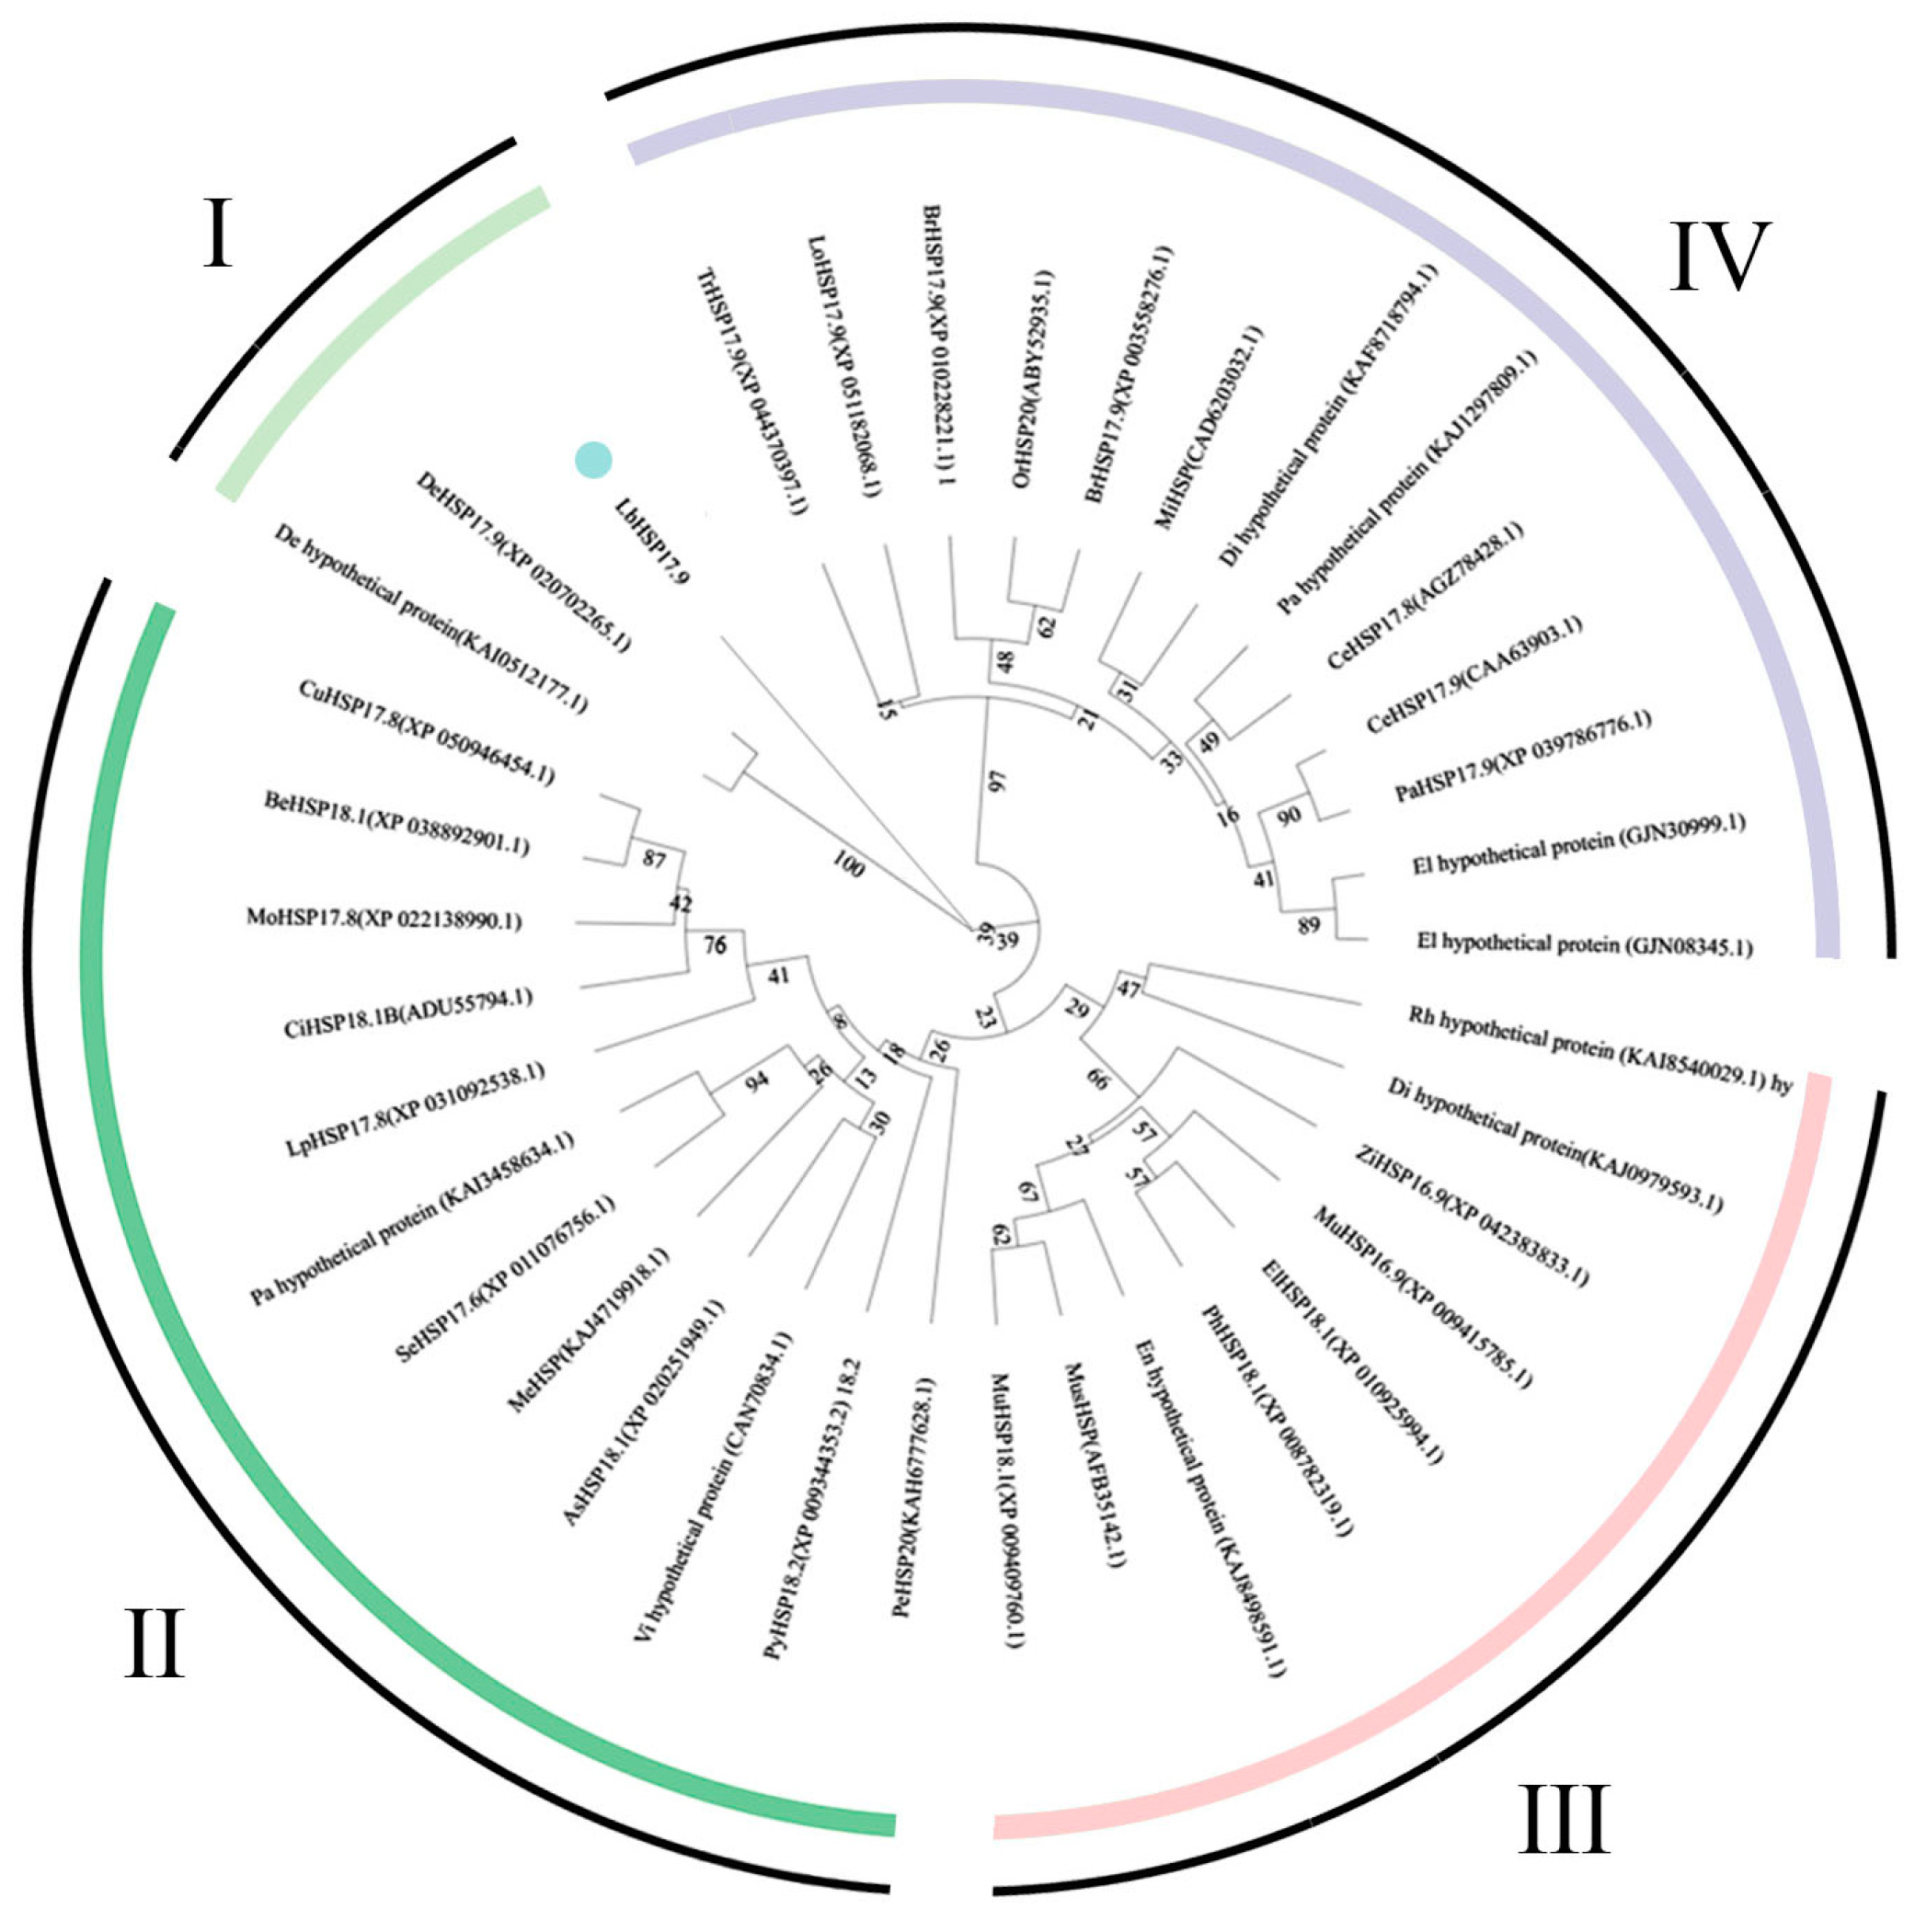
3.1. Cloning and Bio-Information Analysis of LbHSP17.9

The cDNA of ‘Manissa’ petals was used as a template for PCR amplification, and a product of about 470 bp was obtained (Figure 1).
Pront Param V1.1 software was used for open reading frame prediction. The length of LbHSP17.9 was 468 bp, encoding 153 amino acid residues, with a molecular formula of C793H1247N221O238S2, relative Mw of 17.749 kDa and theoretical pI of 6.34. It was an acidic unstable protein (instability coefficient of 42.36). The ProtScale website showed that the lipid solubility coefficient of the LbHSP17.9 protein was 68.48, and the total average hydrophilicity evaluation value was −0.610, indicating that it was hydrophilic (Figure 2A).
The secondary structure prediction carried out using SOPM software showed that the α-helix of LbHSP17.9 accounted for 32.57% of the total number of amino acid residues, β-turn angle accounted for 13.3%, irregular curl accounted for 36.7% and extending chain accounted for 17.43% (Figure 2B). The MODELING results also showed that the tertiary structure of the LbHSP17.9 protein was mainly composed of α-helix and irregular curl (Figure 2C).
Protein motif analysis was performed using the online software MEME and showed that the LbHSP17.9 protein had four similar motifs to HSP17.9 in six other plant species (Figure 3A). Both motif1 and motif2 contained 50 amino acids, with 36 and 37 highly conserved amino acids, respectively (Figure 3B).
The blast sequence alignment (Figure 4) showed that LbHSP17.9 had the highest similarity with the sequences of toy pumpkin (Cucurbita pepo subsp. pepo), ginger (Zingiber officinale) and Momordica charantia, with 79.11%, 75% and 73%, respectively.
The phylogenetic tree showed that LbHSP17.9 was evolutionarily close to Dendrobium and in the same branch, and was far from Plantaginiaceae (Figure 5).

3.2. Different Treatments Increased Expression Level of LbHSP17.9 in Cut Lily Flowers

The expression levels of LbHSP17.9 under different environmental treatments are shown in Figure 6. The expression level was the highest under high-temperature stress, followed by low-temperature stress, GABA and ABA treatments.

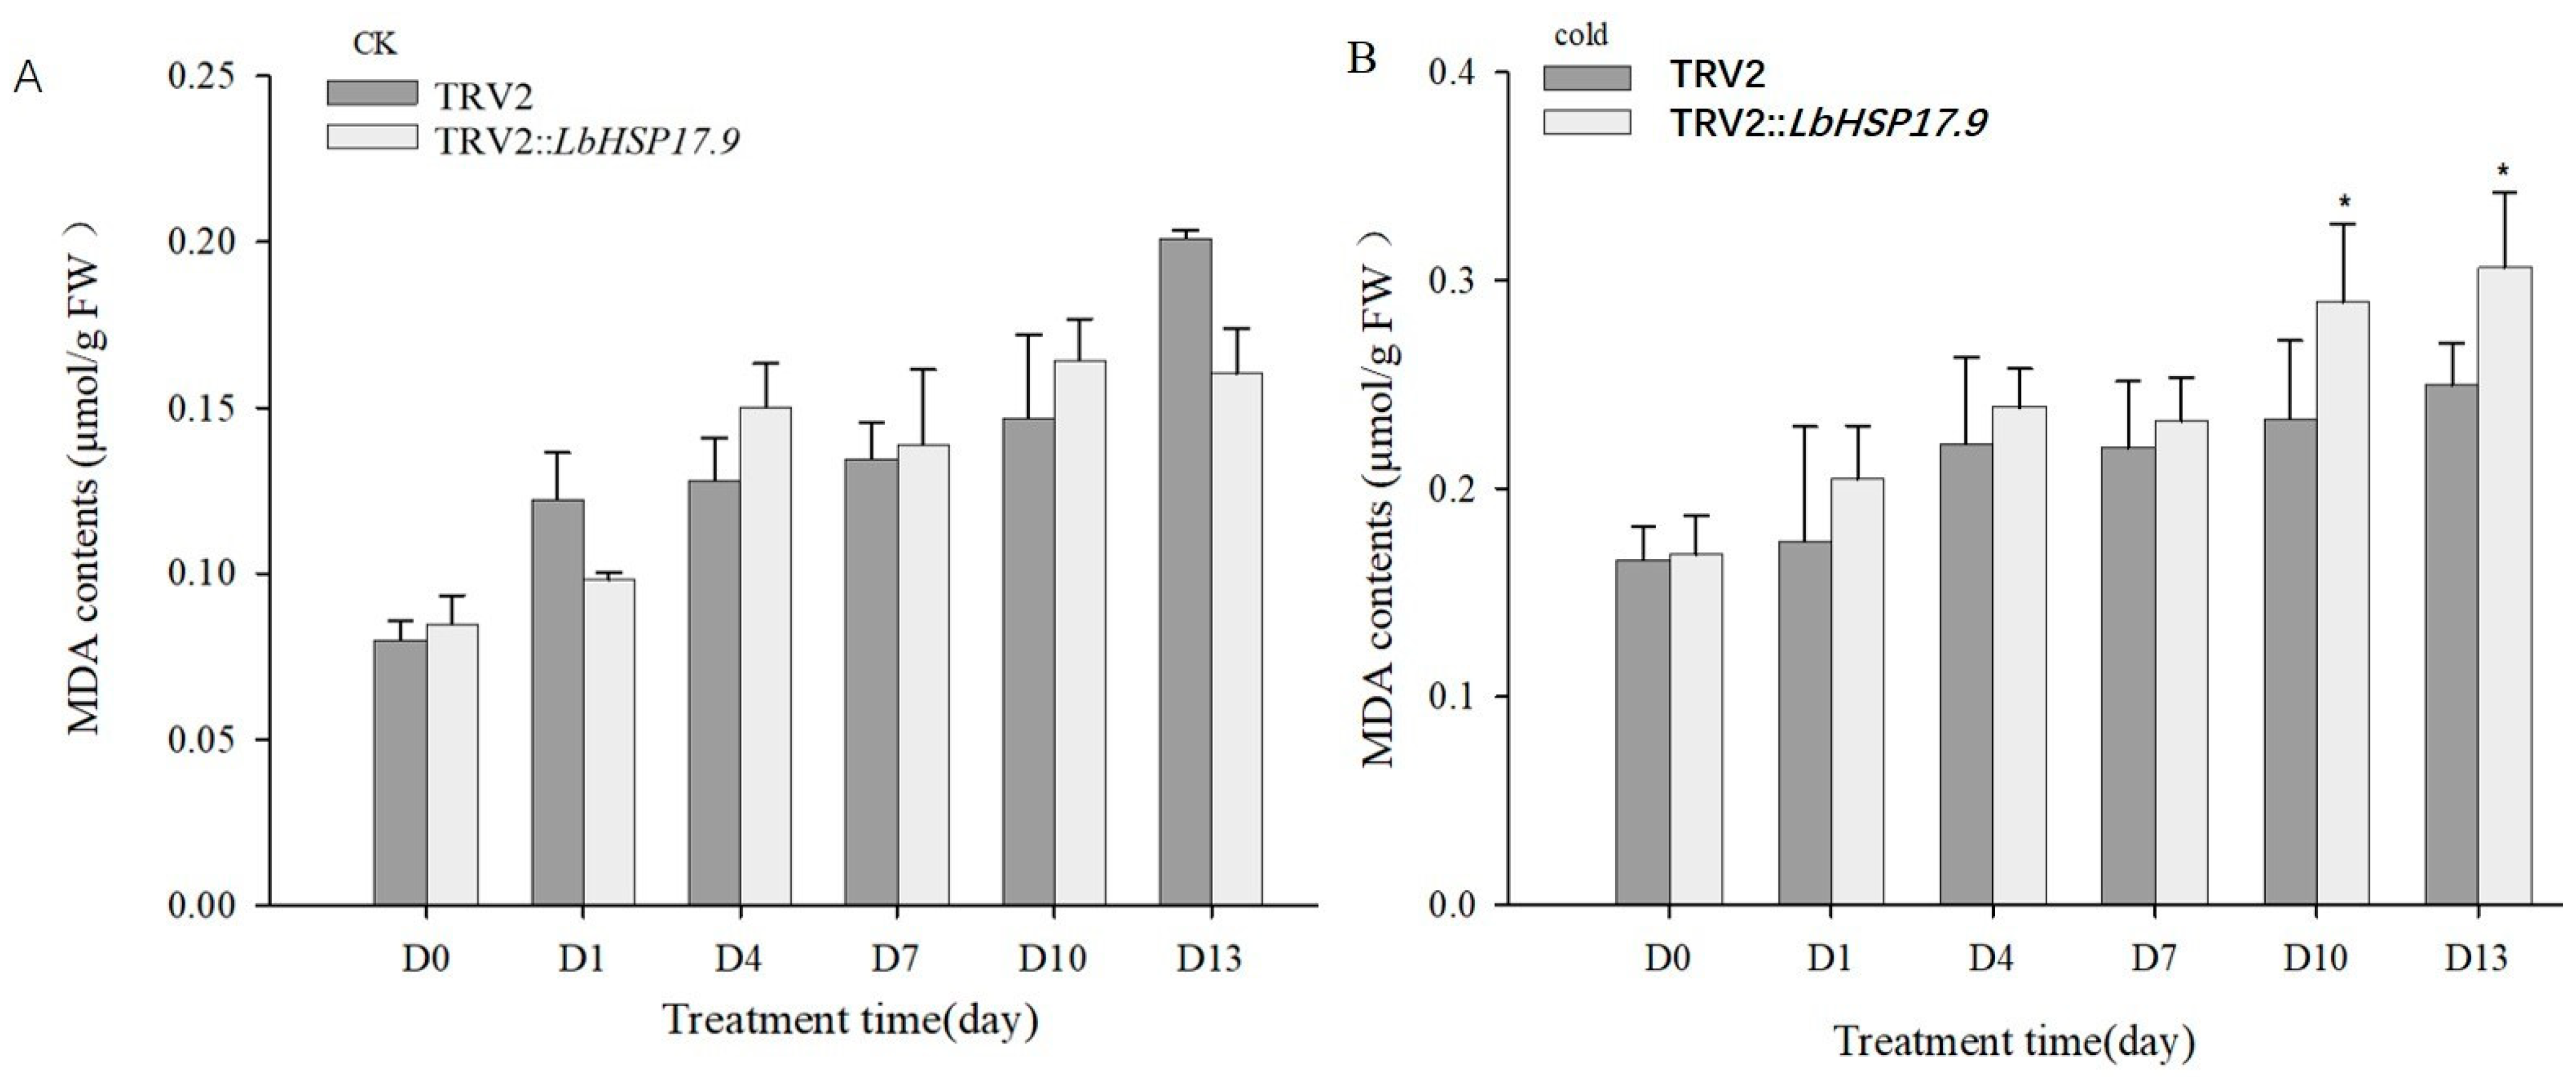
3.3. Silencing LbHSP17.9 Weakened the Cold Stress Resistance, Down-Regulated LbHSP17.9 Expression and Promoted MDA Content

In order to study the role of LbHSP17.9 in resisting cold stress, LbHSP17.9 was transiently silenced in cut lily flowers using VIGS. The TRV2::LbHSP17.9 plants flowered 2 days later than the TRV2 plants (Figure 7). On day 13, the TRV2::LbHSP17.9 flowers began to fade, while the TRV2 petals had not yet fallen off. Under 4 °C treatment, the TRV2 flowers started to open on day 13, and the TRV2::LbHSP17.9 flowers had not yet opened.
For the control and cold treatment, the expression of LbHSP17.9 in TRV2::LbHSP17.9 was significantly lower than in TRV2 for days 4–7 (Figure 8A,B). The results also showed that the 4 °C treatment significantly promoted LbHSP17.9 expression in both materials.
The MDA content in both materials increased for both treatments (Figure 9A,B). Under the two temperature treatments, the MDA content in TRV2::LbHSP17.9 was significantly higher than in TRV2 on days 4 and 10.

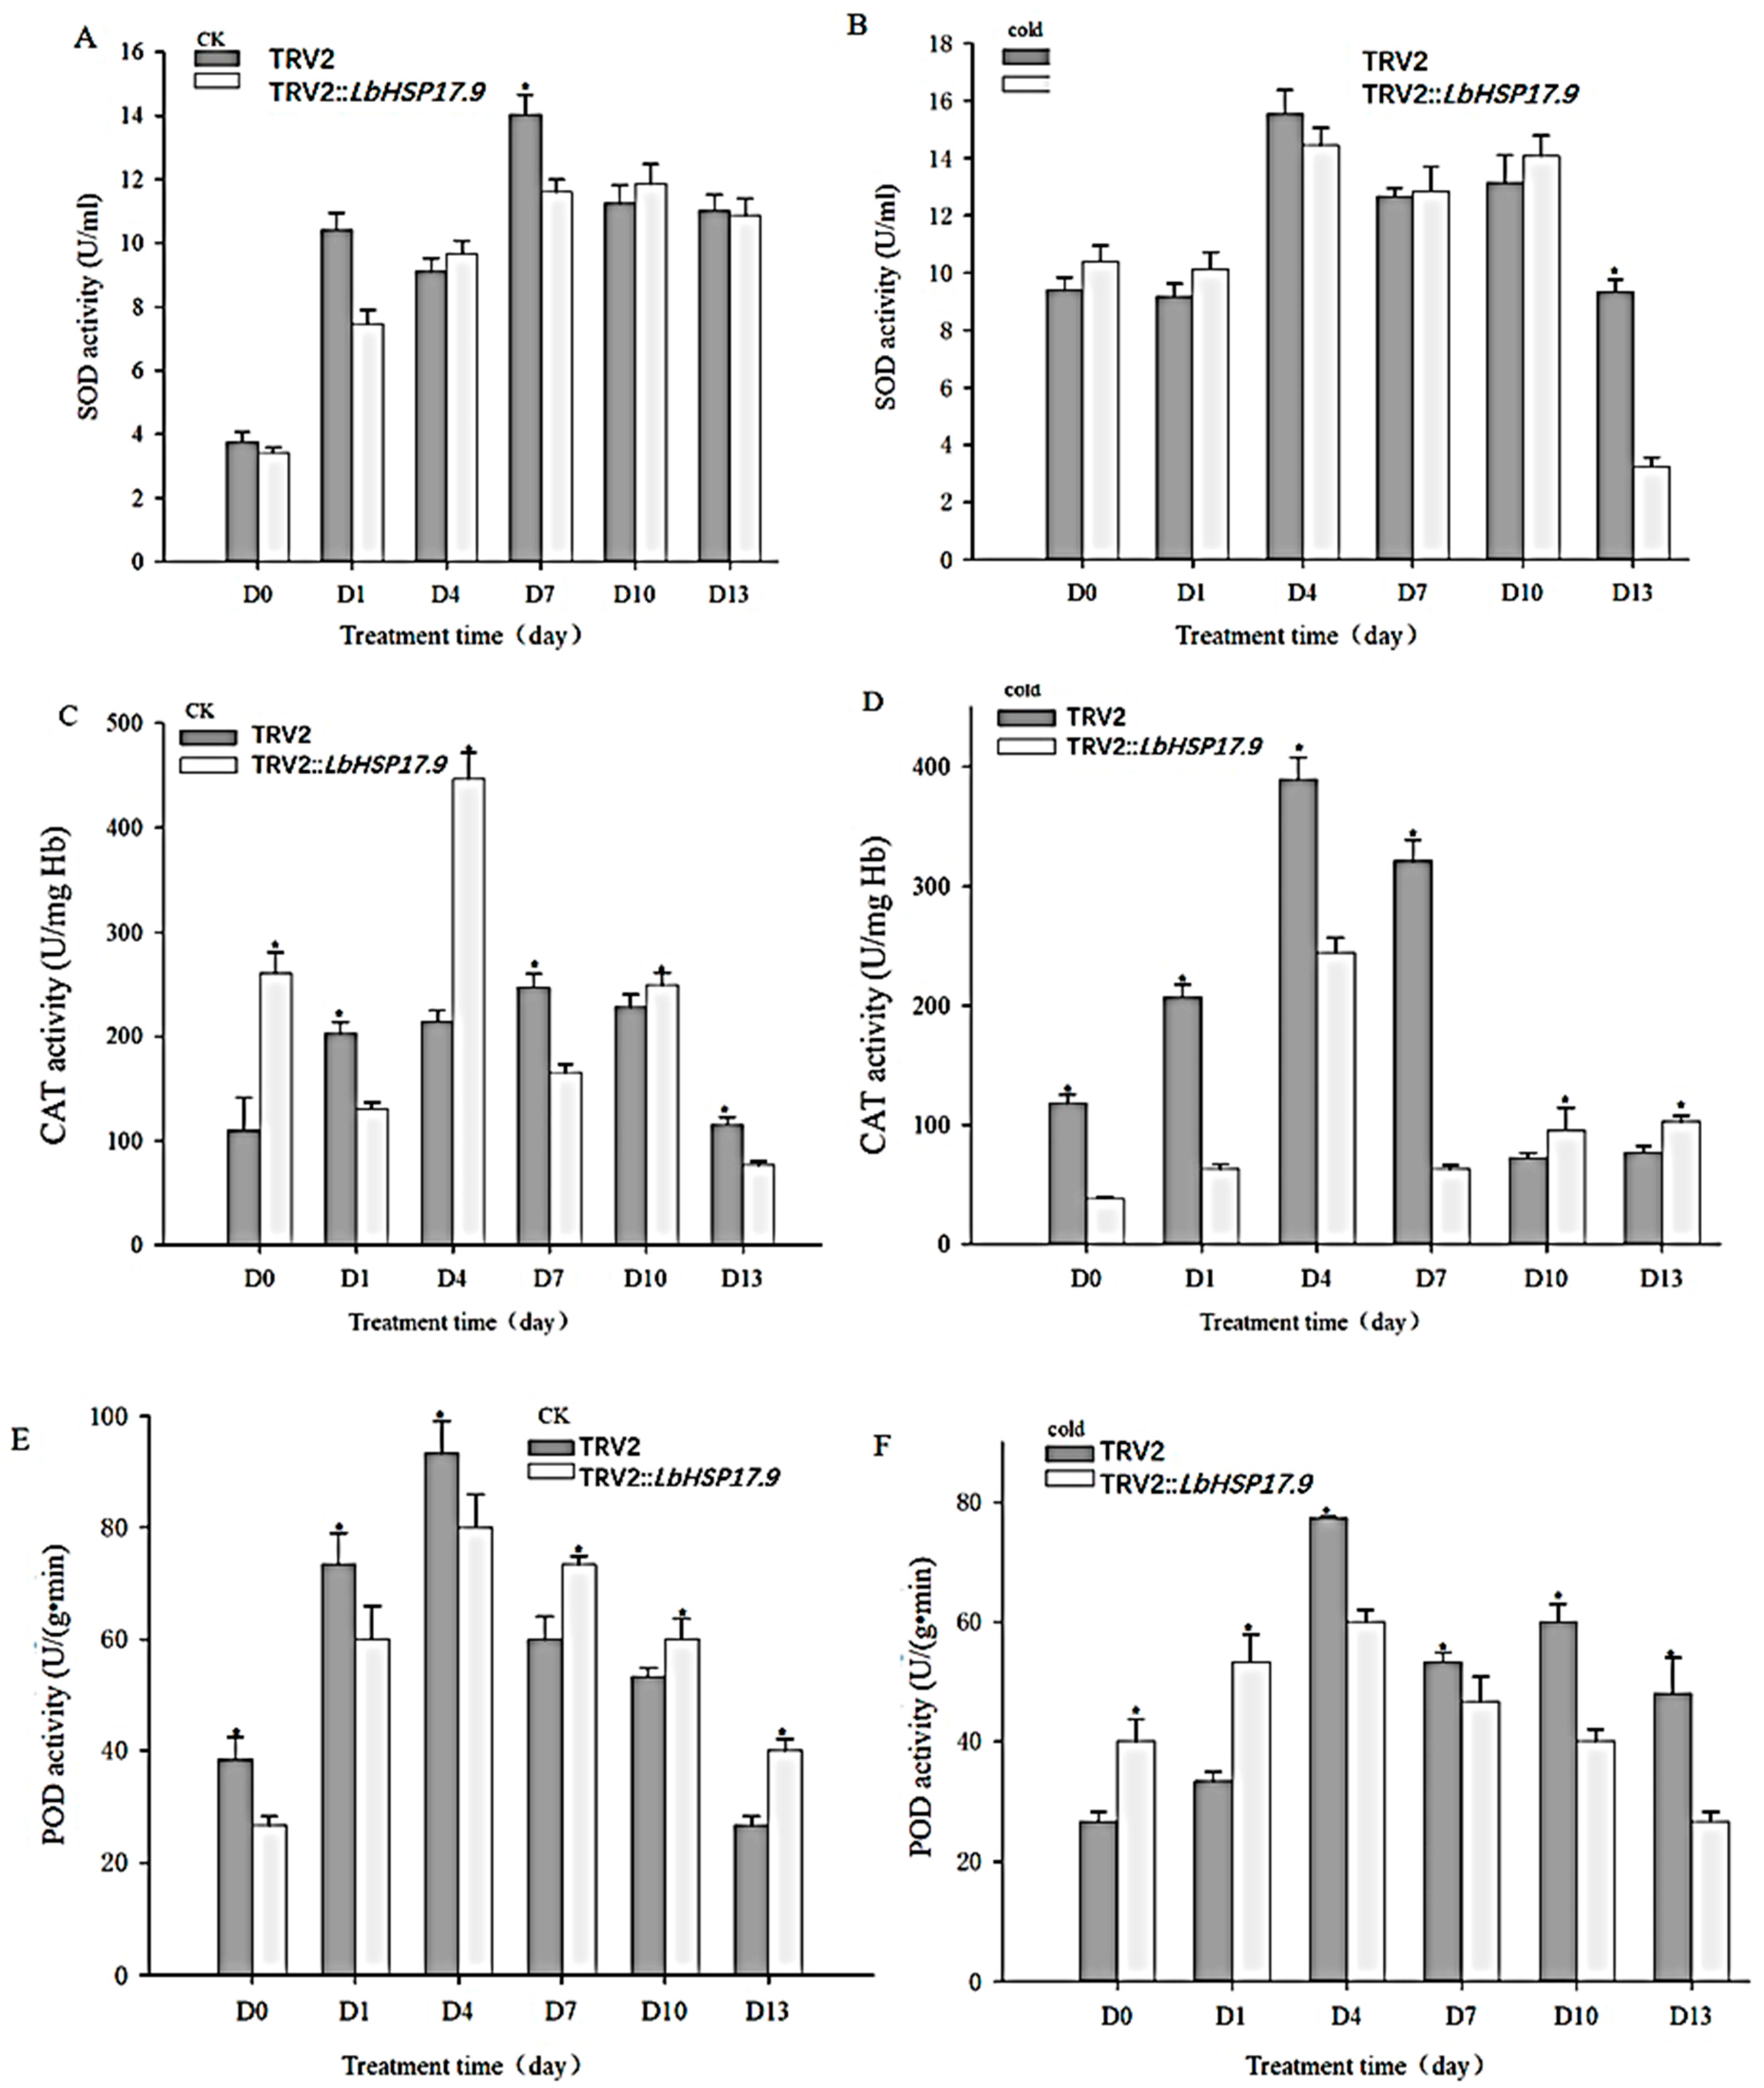
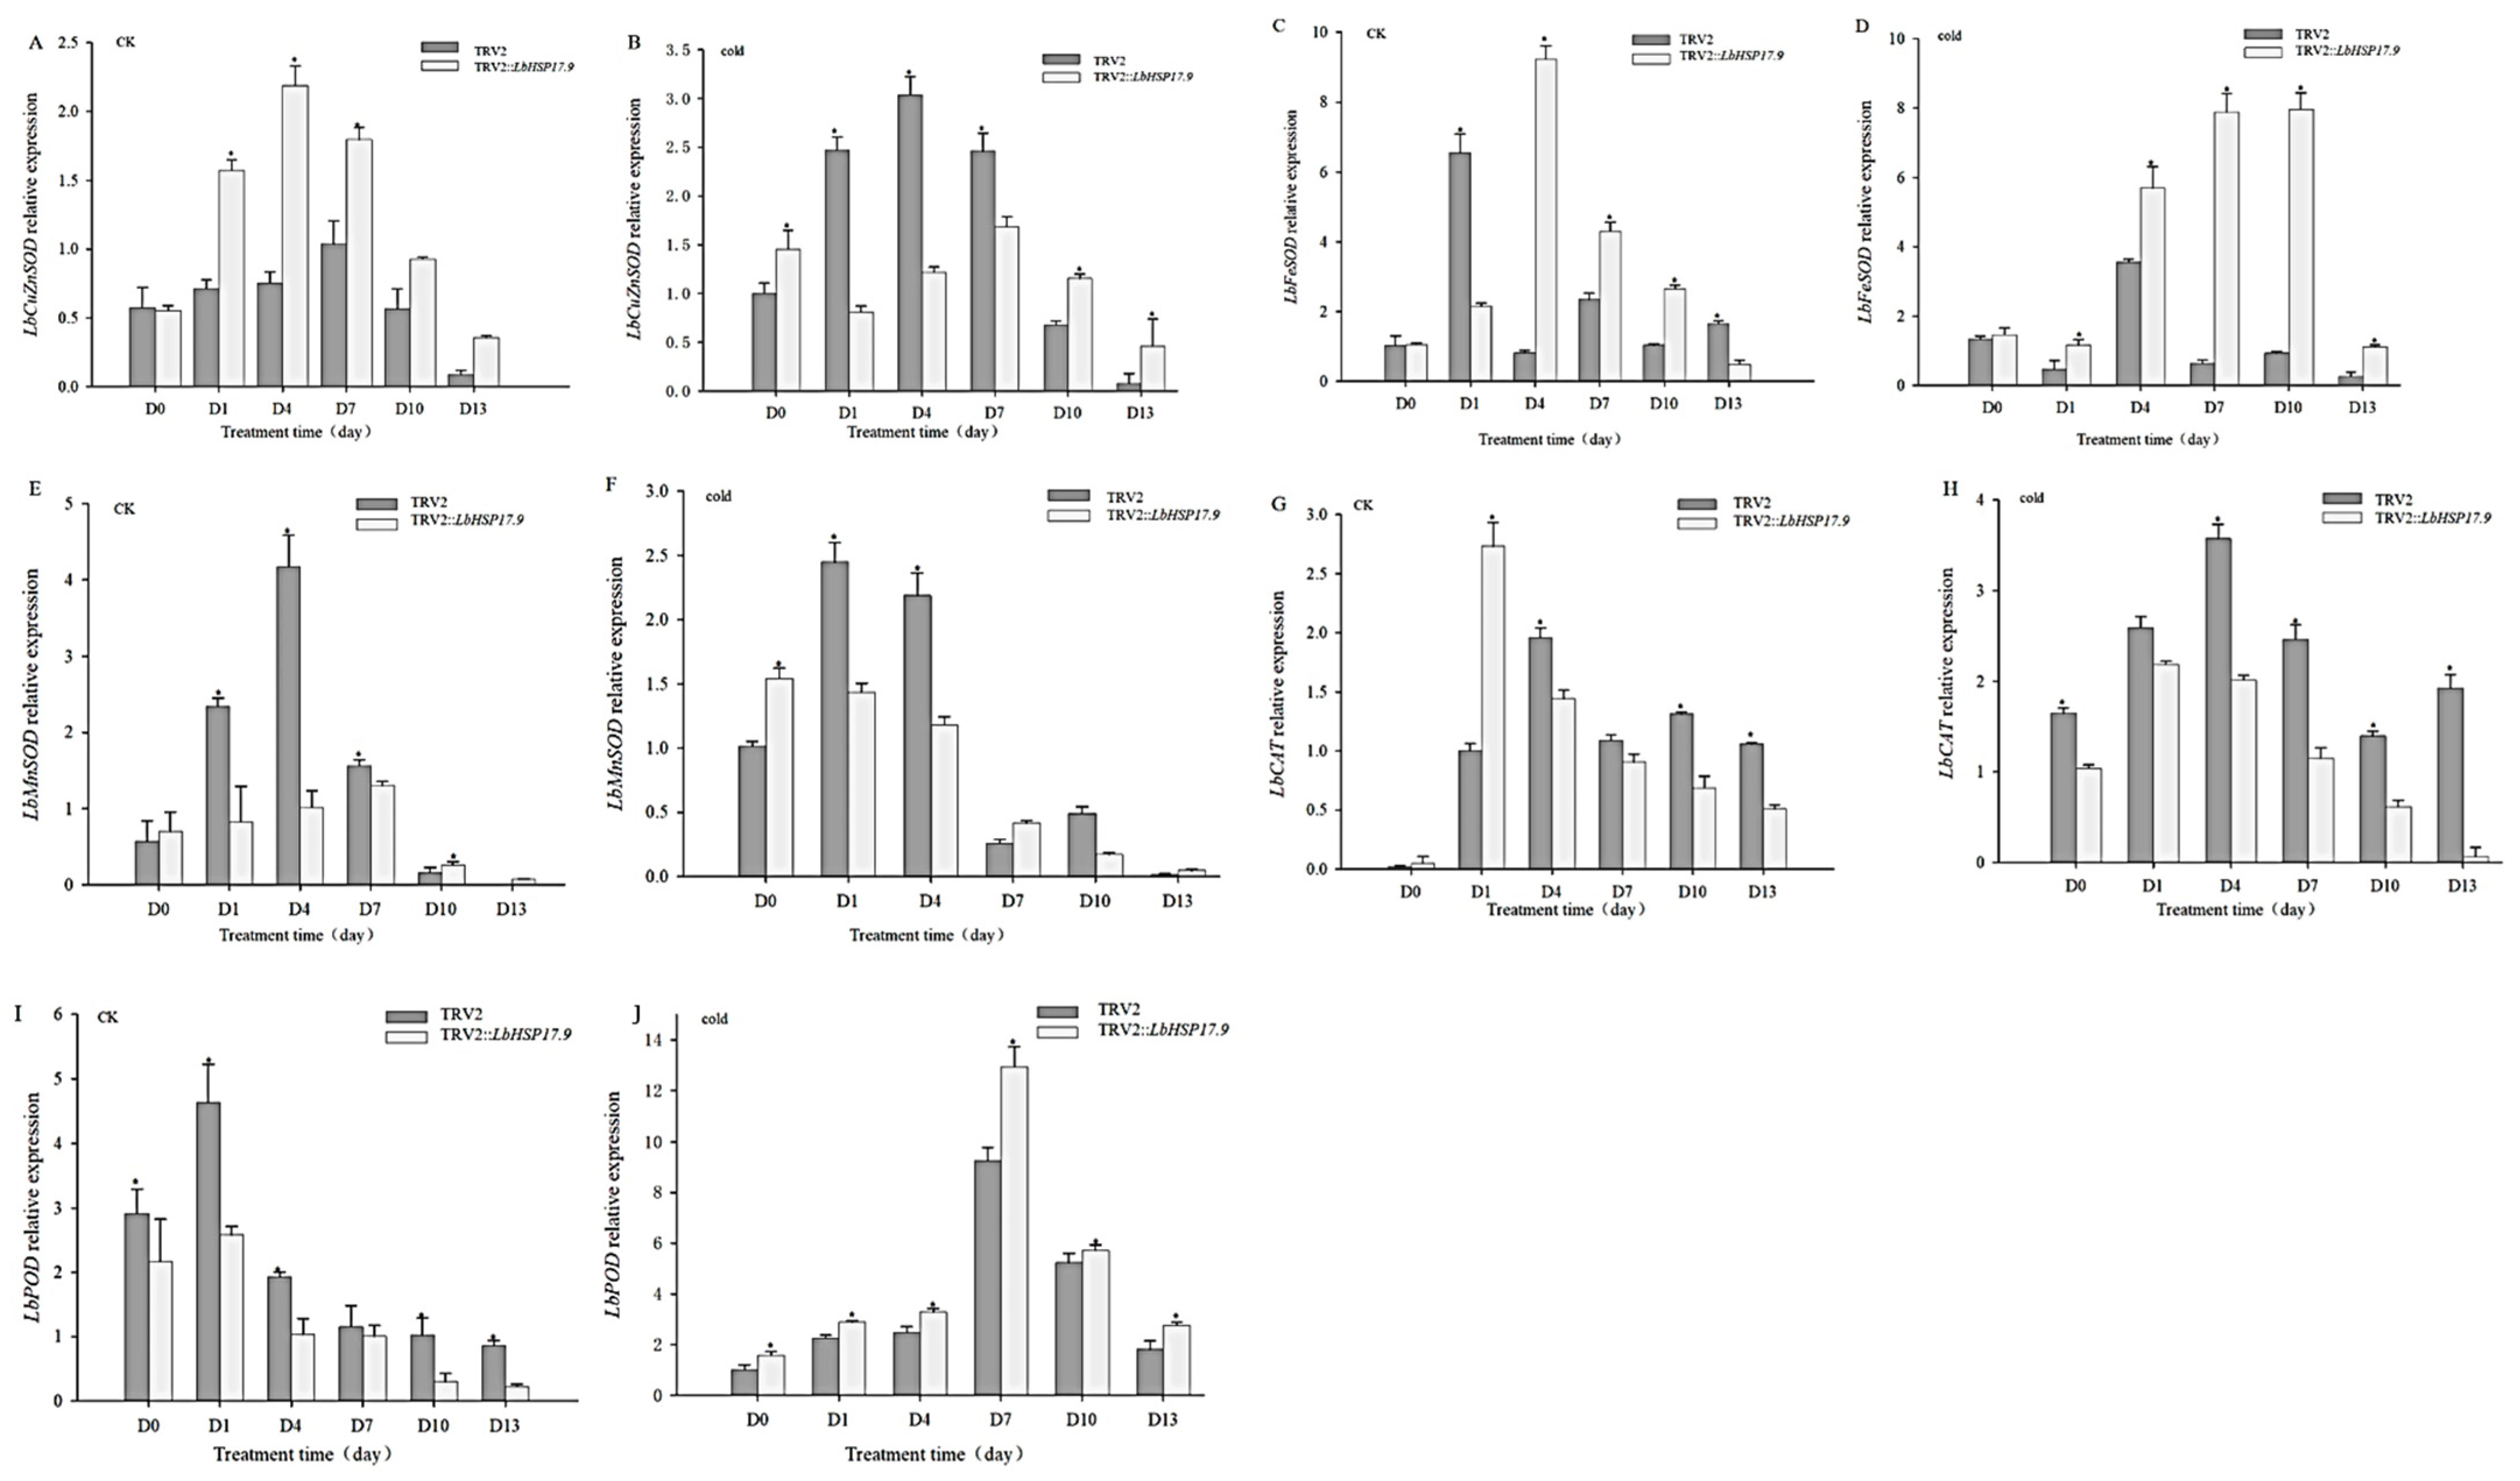
3.4. Silencing LbHSP17.9 Lowered Activities and Transcription of Antioxidant Enzymes

To further explore the mechanism of stress resistance change after the LbHSP17.9 silencing of cut lily flowers, the activities of SOD (Figure 10A,B), CAT (Figure 10C,D) and POD (Figure 10E,F) were determined. Whether under 24 °C or 4 °C treatment, the SOD activities of the two materials showed an increasing trend (Figure 10A,B). At 24 °C, the SOD activity in TRV2 was significantly higher than in TRV2::LbHSP17.9 on day 7 (Figure 10A). The SOD activity in TRV2::LbHSP17.9 was significantly lower than in TRV2 on day 13 under 4 °C treatment (Figure 10B).
The CAT activity of TRV2 initially increased and then decreased under both control and low-temperature stress (Figure 10C,D). The CAT activity of TRV2::LbHSP17.9 was significantly lower than TRV2 at 0–7 days under 4 °C stress (Figure 10D).
Similar to the trends of SOD and CAT, the POD activity of TRV2::LbHSP17.9 and TRV2 showed an initial increasing trend and then decreased under both treatments, both reaching peaks at day 4 (Figure 10E,F). The POD activity of TRV2::LbHSP17.9 was significantly lower than TRV2 after day 4 under 4 °C stress (Figure 10F).
Cold stress promoted LbCu/ZnSOD expression (Figure 11A,B), and its expression in TRV2::LbHSP17.9 was lower than in TRV2 during days 1–7 under 4 °C stress (Figure 11B).
The expressions of LbFeSOD and LbMnSOD initially increased and then decreased for both treatments (Figure 11C–F). The LbFeSOD transcription level was significantly higher for TRV2::LbHSP17.9 than TRV2 for days 1–10 under 4 °C stress (Figure 11D). The 4 °C stress induced LbMnSOD transcription, with LbMnSOD transcription significantly lower in TRV2::LbHSP17.9 than TRV2 (Figure 11F). The 4 °C stress induced LbCAT transcription in the controls, and the LbCAT expression in TRV2::LbHSP17.9 was significantly lower than in TRV2 (Figure 11G,H).
In the control, LbPOD expression showed a short-term increase followed by a decrease. The 4 °C stress strongly induced LbPOD transcription, which rose during days 0–7 and began to decline on day 10. The expression of LbPOD in TRV2::LbHSP17.9 was significantly higher than that of TRV2 at 4 °C (Figure 11I,J).

3.5. LbHSP17.9 Overexpression Enhances Resistance to Cold Stress of Lily Petal Segments and Enhances Resistance to Low-Temperature Stress

To further study the function of LbHSP17.9 under low-temperature stress, the transient transformation method was used to overexpress LbHSP17.9 in lily petal segments (Figure 12). Compared with the control, cold stress delayed the senescence of the lily petal segments; the segments that transiently overexpressed LbHSP17.9 were more brightly colored than the control group under 4 °C stress.
The transcription level of LbHSP17.9 in OE-LbHSP17.9 was significantly higher than in the WT for both temperature treatments (Figure 13).
The 4 °C stress led to an increased relative electrolytic leakage, which was significantly higher in the WT than in OE-LbHSP17.9 (Figure 14).

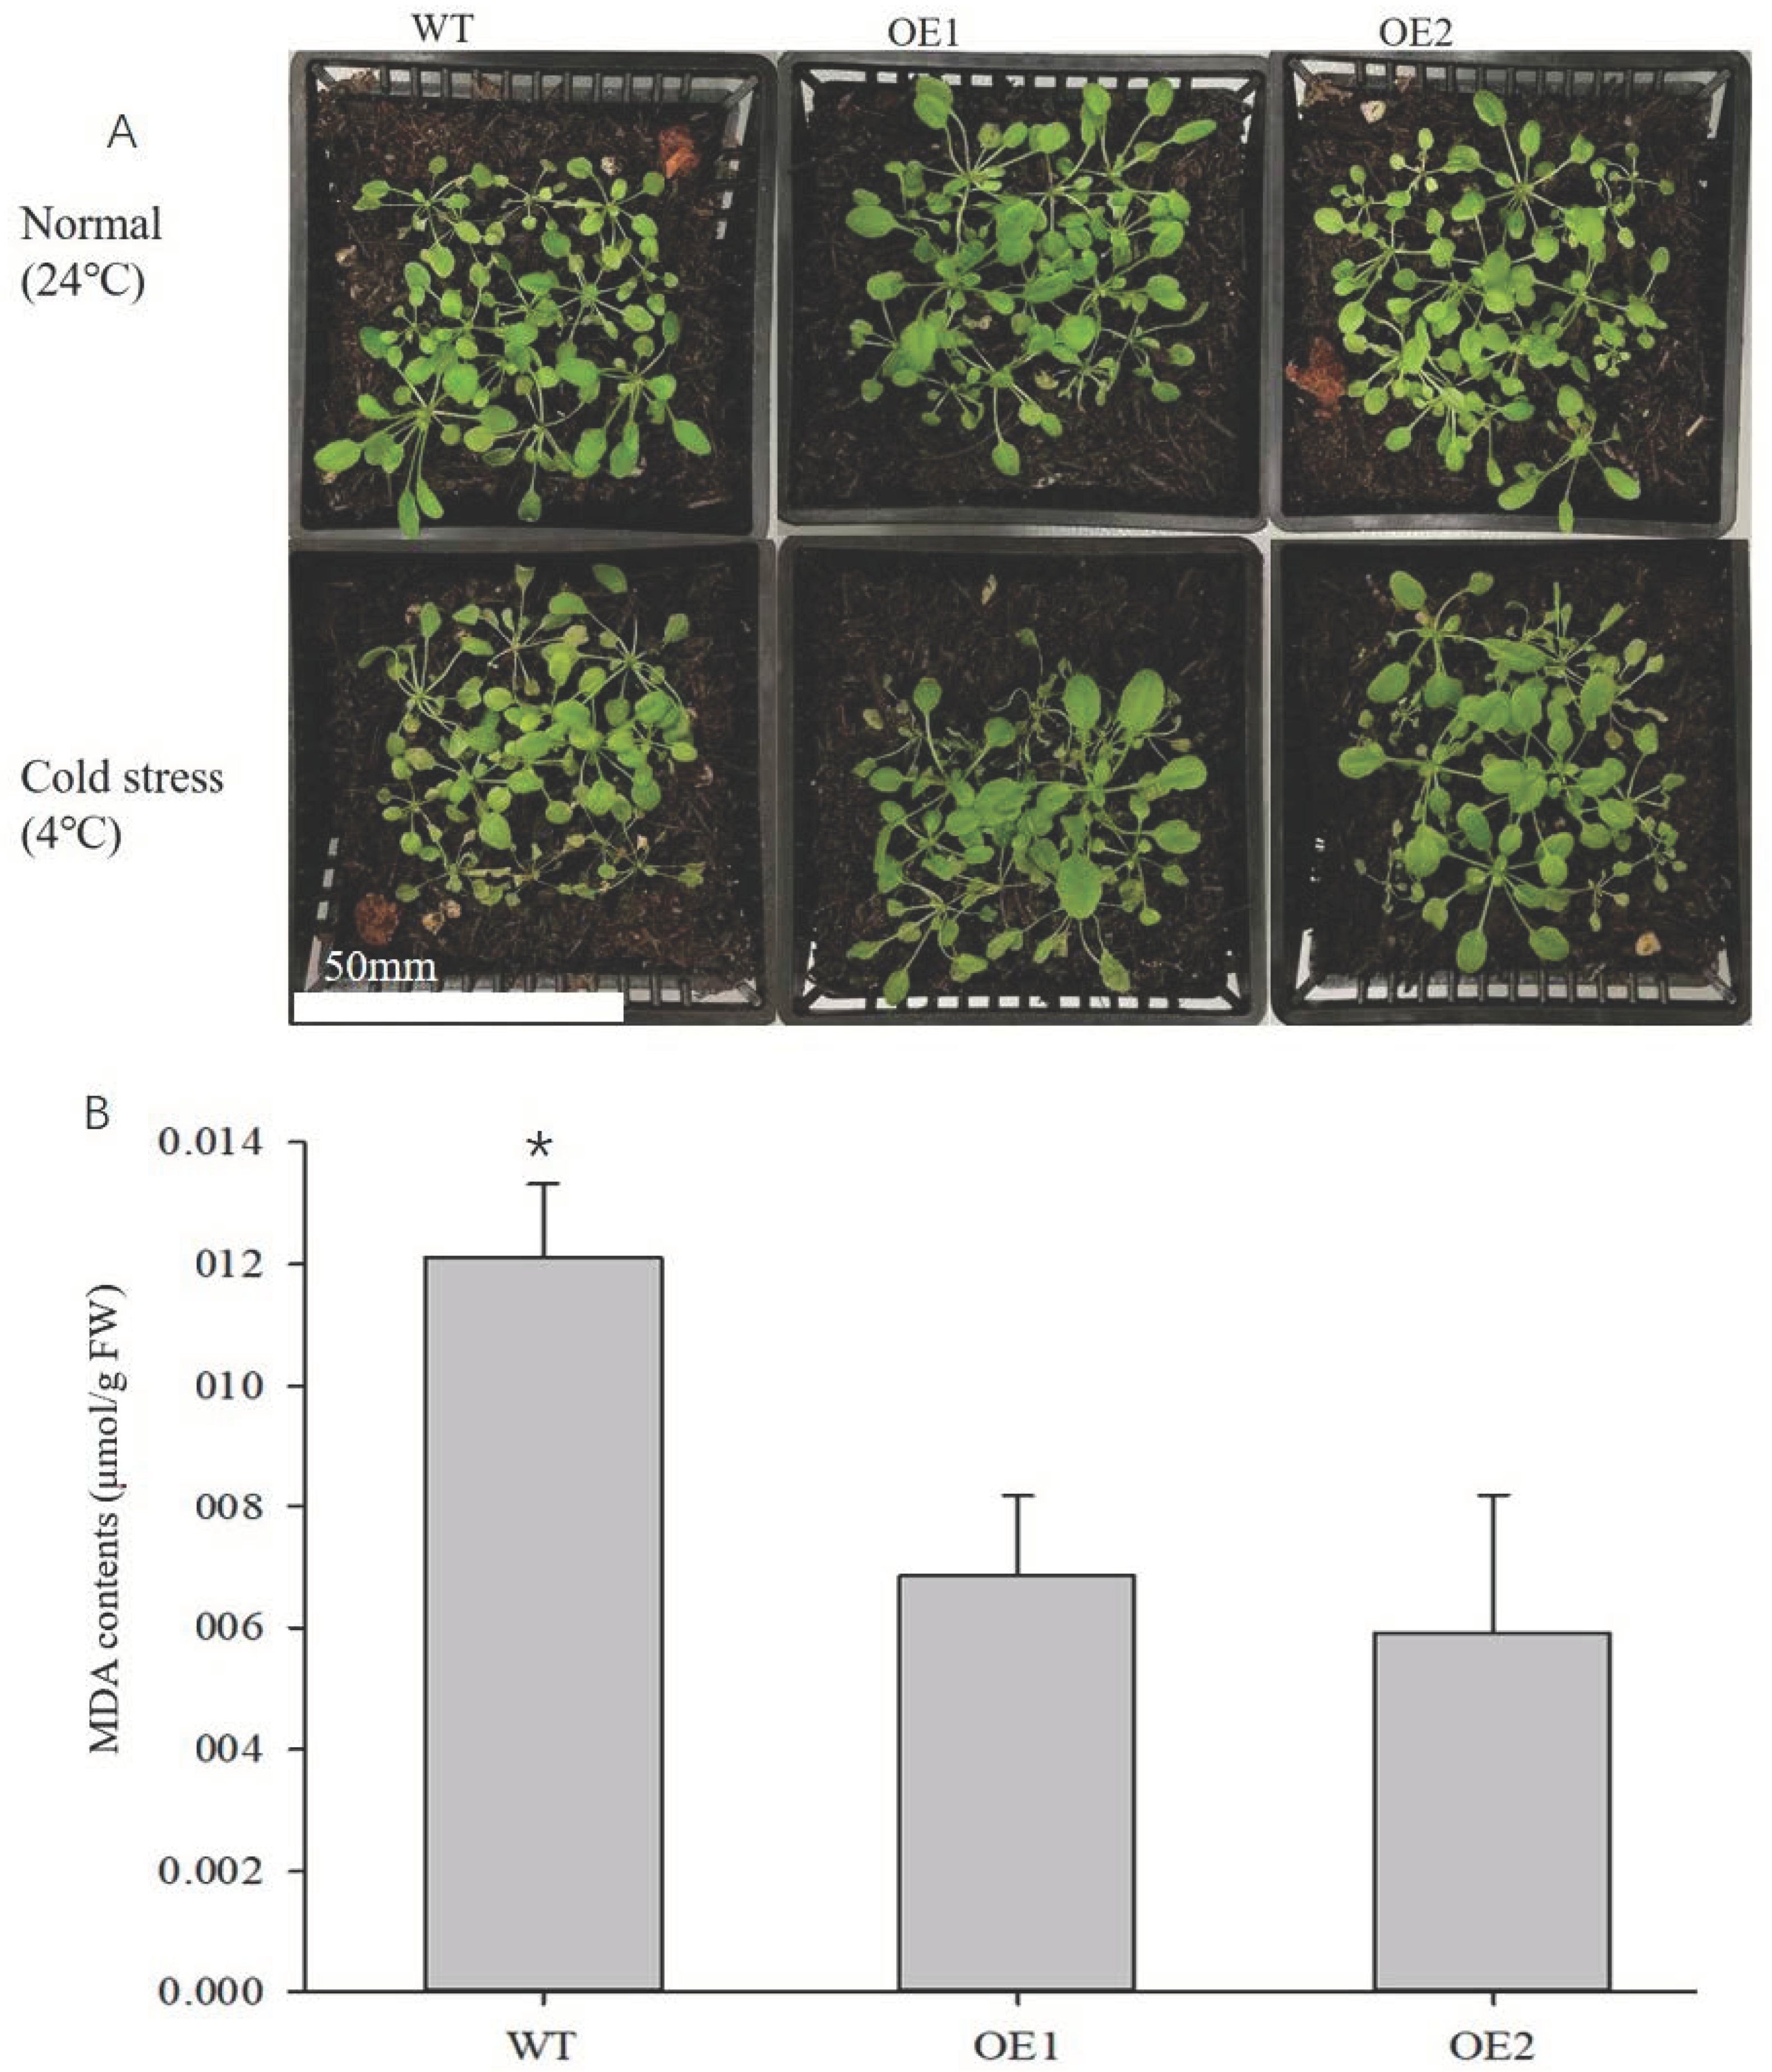
3.6. Overexpression of LbHSP17.9 in A. thaliana Enhances Resistance to Low-Temperature Stress

Under cold stress, the leaves of both the OE1-LbHSP17.9 and the OE2-LbHSP17.9 A. thaliana plants were greener than those of the WT (Figure 15A), and the MDA contents of the leaves were significantly lower than those of the WT (Figure 15B).

4. Discussion

The sHSPs are a group of proteins in all organisms that are induced by heat-shock stress and other stress conditions [17]. In this study, using lily petals we cloned a sHSP gene, LbHSP17.9, which is a member of the same class III sHSPs in the plant cytoplasm as the PmHSP17.9 gene obtained from ryegrass [18].
As widely existing molecular chaperones in cells, sHSPs are involved in the regulation of many biological processes, such as oxidative stress, cell cycle and plant development [19]. Yang et al. [20] found that GmHSP17.9 expression increased with the development of soybean nodules and that the loss of function of GmHSP17.9 in nodules led to a decrease in the number of nodules, the fresh weight of the nodules and their nitrogenase activity, and the ultrastructure showed that the nodule symbiotic body was damaged. In A. thaliana, sHSP21 interacted with pTAC5 in the chloroplast and was involved in chloroplast development under heat stress [21]. In addition, SlHSP17.7 is involved in sugar metabolism to improve fruit quality in tomatoes [22]. When LbHSP17.9 was silenced in the buds of lilies in the present study, the buds opened later than the controls and the flowers faded earlier.
The sHSPs are involved in the regulation of biological and abiotic stresses in plants [17]. In plums, PmHSP17.9 was up-regulated after being treated with heat stress, salt, dehydration, oxidative stress or ABA [18]. In this study, when cut lily flowers were treated with high temperature, low temperature, GABA and ABA, LbHSP17.9 transcription was induced; when LbHSP17.9 was silenced in cut lily flowers, the MDA content was higher than in TRV2; and when LbHSP17.9 was overexpressed in lily petal segments, the OE-LbHSP17.9 segments were brighter in color and had lower relative conductivity than the control under 4 °C stress. The gene LimHSP16.45 from Lilium davidii was cloned into A. thaliana and improved plant resistance to high temperature, high salt and oxidative stresses [23]. In this study, the leaves of two overexpressing A. thaliana lines under 4 °C treatment were greener than those of the WT, and the MDA content in the leaves was also significantly lower than that of the WT, indicating that overexpressing LbHSP17.9 improved the ability of A. thaliana to withstand cold stress. Overexpressing LimHSP16.45 improved the abiotic stress tolerance of A. thaliana plants [23]. The expression of TaHSP17.6 in A. thaliana improved plant tolerance to salt stress and reduced plant sensitivity to exogenous ABA; after removing the leaves, the hydration was superior in the transgenic compared to the WT leaves [24]. Transgenic tobacco plants expressing OsHsp17.4 and OsHsp17.9A proteins and Arabidopsis plants ectopically expressing OsHsp17.4 protein showed improved thermotolerance to the respective trans-hosts during the post-stress recovery process [25].
The sHSPs play decisive roles in the defense of organisms during physiological stress by protecting natural proteins from irreversible aggregation and oxidative inactivation [26]. In Lilium davidii, LimHSP16.45 has a protective effect on pollen mother cells and tapetal cells under extreme temperatures in meiosis I from the late even-line to the coarse-line stage [27]. In this study, when TRV2::LbHSP17.9 plants were subjected to 4 °C stress, CAT and POD activities were lower in these plans than in the TRV2 plants, and the SOD activity in the late stage was significantly lower than that of the controls. Further analysis of the transcription level of antioxidant enzyme genes showed that the transcription levels of LbCu/ZnSOD, LbMnSOD and LbCAT in TRV2::LbHSP17.9 were lower than those of TRV2. In transgenic seeds expressing Nelumbo nucifera NnHsp17.5 in A. thaliana, the SOD activity was increased after accelerated aging treatment [28]. Transgenic A. thaliana plants overexpressing poplar PtsHsp17.8 also showed higher tolerance to high temperature and salt stress than control plants due to the increase in activity of antioxidant enzymes [29].

5. Conclusions

The results showed that silencing LbHSP17.9 in cut lily flowers reduced their cold stress resistance, while LbHSP17.9 overexpression in A. thaliana resulted in stronger cold resistance than that of the WT, which was related to the activity of antioxidant enzymes and the transcription level of their genes. Our study aimed to enhance the cold stress resistance of cut lilies after harvest and long-distance transportation by regulating LbHSP17.9 expression, thereby avoiding the bud deformity and premature aging caused by stress and finally extending the bottle insertion period of cut lilies, which could improve the quality of cut lilies.

Supplementary Materials

The following supporting information can be downloaded at: https://www.mdpi.com/article/10.3390/horticulturae10030287/s1, Figure S1: PCR detection of colony; Figure S2: PCR positive detection of transformed plants (Hpt gene); Table S1: Genetic primers and their uses.

Author Contributions

Conceptualization, J.W., M.D. and J.Z.; formal analysis, J.Z. and J.W.; investigation, J.Z., X.Y., W.H., C.L., X.H. and C.G.; data curation, J.Z.; writing, J.Z. and J.W. All authors have read and agreed to the published version of the manuscript.

Funding

This project is supported by the National Natural Science Foundation of China (No. 32160721) to Jin-fen Wen of Kunming University of Science and Technology.

Data Availability Statement

All available data are presented in the manuscript.

Conflicts of Interest

The authors declare no conflicts of interest. The funders had no role in the design of the study; in data collection, data analyses, or interpretation of data; in the writing of the manuscript; or in the decision to publish the results.

References

  1. Zhao, Z.; Zhao, J.; Peng, C.; Duan, X.; Deng, M.; Wen, J. Comparative analysis of petal epidermal wax composition and loss-water resistance in five cut lily cultivars (lilium spp). Sci. Hortic. 2023, 311, 11805. [Google Scholar] [CrossRef]
  2. Yu, T.; Zhou, H.; Liu, Z.; Zhai, H.; Liu, Q. The sweet potato transcription factor IbbHLH33 enhances chilling tolerance in transgenic tobacco. Czech J. Genet. Plant Breed. 2022, 58, 210–222. [Google Scholar] [CrossRef]
  3. Lopez-Matas, M.A.; Nuez, P.; Soto, A.; Allona, I.; Gomez, L. Protein cryoprotective activity of a cytosolic small heat shock protein that accumulates constitutively in chestnut stems and is up-regulated by low and high temperatures. Plant Physiol. 2004, 134, 1708–1717. [Google Scholar] [CrossRef]
  4. Kalousek, P.; Holátko, J.; Schreiber, P.; Pluháček, T.; Lónová1, K.; Radziemska, M.; Tarkowski, P.; Vyhnánek, T.; Hammerschmiedt, T.; Brtnický, M. The effect of chelating agents on the Zn-phytoextraction potential of hemp and soil microbial activity. Chem. Biol. Technol. Agric. 2024, 11, 23. [Google Scholar] [CrossRef]
  5. Park, C.J.; Seo, Y.S. Heat shock proteins: A review of the molecular chaperones for plant immunity. Plant Pathol. 2015, 31, 323–333. [Google Scholar] [CrossRef]
  6. Candido, E.P.M.; Grber, S.; Gaestel, M.; Buchner, J. Binding of non-native protein to hsp25 during heat shock creates a reservoir of folding intermediates for reactivation. Chemtracts 1998, 11, 166–172. [Google Scholar]
  7. Mogk, A.; Schlieker, C.; Friedrich, K.L.; Schnfeld, H.J.; Bukau, B. Refolding of substrates bound to small hsps relies on a disaggregation reaction mediated most efficiently by clpb/dnak. J. Biol.Chem. 2003, 278, 31033–31042. [Google Scholar] [CrossRef] [PubMed]
  8. Waters, E.R.; Lee, G.J.; Vierling, E. Evolution, structure and function of the small heat shock proteins in plants. J. Exp. Bot. 1996, 47, 325–338. [Google Scholar] [CrossRef]
  9. Zhang, J.H.; Wang, L.J.; Pan, Q.H.; Wang, Y.Z.; Zhan, J.C.; Huang, W.D. Accumulation and subcellular localization of heat shock proteins in young grape leaves during cross-adaptation to temperature stresses. Sci. Hortic. 2008, 117, 231–240. [Google Scholar] [CrossRef]
  10. González-Gordo, S.; Palma, J.M.; Corpas, F.J. Small Heat Shock Protein (sHSP) Gene Family from Sweet Pepper (Capsicum annuum L.) Fruits: Involvement in Ripening and Modulation by Nitric Oxide (NO). Plants 2023, 12, 389. [Google Scholar] [CrossRef]
  11. Zhang, N.; Zhao, H.; Shi, J.; Wu, Y.; Jiang, J. Functional characterization of class i slhsp17.7 gene responsible for tomato cold-stress tolerance. Plant Sci. 2020, 298, 110568. [Google Scholar] [CrossRef]
  12. Neto, V.G.; Barbosa, R.R.; Carosio, M.G.A.; Ferreira, A.G.; Fernandez, L.G.; De Castro, R.D.; Ligterink, W.; Hilhorst, H.; Ribeiro, P.R. Sequence analysis of ricinus communis small heat-shock protein (shsp) subfamily and its role in abiotic stress responses. Ind. Crop. Prod. 2020, 152, 112541. [Google Scholar] [CrossRef]
  13. Sewelam, N.; Kazan, K.; Hüdig, M.; Maurino, V.G.; Schenk, P.M. The athsp17.4c1 gene expression is mediated by diverse signals that link biotic and abiotic stress factors with ros and can be a useful molecular marker for oxidative stress. Int. J. Mol. Sci. 2019, 20, 3201. [Google Scholar] [CrossRef]
  14. Sato, Y.; Yokoya, S. Enhanced tolerance to drought stress in transgenic rice plants overexpressing a small heat-shock protein, shsp17.7. Plant Cell Rep. 2008, 27, 329–334. [Google Scholar] [CrossRef]
  15. Yin, H.; Chen, L.; Li, X.; Chen, Q.; Yi, M. Analysis and improvement of high-quality RNA extraction in leaves of lily. J. CAU 2008, 13, 41–45. [Google Scholar]
  16. Liu, L.; Xie, T.; Zhao, Z.; Zhao, J.; Deng, M.; Wen, J. Involvement of a novel nap member lbnap in flower senescence and dehydration stress in cut lily. Sci. Hortic. 2023, 308, 111482. [Google Scholar] [CrossRef]
  17. Carra, S.; Alberti, S.; Arrigo, P.A.; Benesch, J.L.; Benjamin, I.J.; Boelens, W.; Bartelt-Kirbach, B.; Brundel, B.J.; Buchner, J.; Bukau, B.; et al. The growing world of small heat shock proteins: From structure to functions. Cell Stress. Chaperon. 2017, 22 Pt 13, 601–611. [Google Scholar] [CrossRef]
  18. Wan, X.; Yang, J.; Li, X.; Zhou, Q.; Guo, C.; Bao, M. Over-expression of pmhsp17.9 in transgenic arabidopsis thaliana confers thermotolerance. Plant Mol. Biol. Rep. 2016, 34, 899–908. [Google Scholar] [CrossRef]
  19. Basha, E.; Lee, G.J.; Breci, L.A.; Hausrath, A.C.; Buan, N.R.; Giese, K.C.; Vierling, E. The identity of proteins associated with a small heat shock protein during heat stress in vivo indicates that these chaperones protect a wide range of cellular functions. J. Biol. Chem. 2004, 279, 7566–7575. [Google Scholar] [CrossRef]
  20. Yang, Z.; Du, H.; Xing, X.; Li, W.; Kong, Y.; Li, X.; Zhang, C. A small heat shock protein, GmHSP17. 9, from nodule confers symbiotic nitrogen fixation and seed yield in soybean. Plant biotechnol. J. 2022, 20, 103. [Google Scholar] [CrossRef]
  21. Zhong, L.; Zhou, W.; Wang, H.; Ding, S.; Lu, Q.; Wen, X.; Peng, L.; Zhang, L.; Lu, C. Chloroplast small heat shock protein HSP21 interacts with plastid nucleoid protein pTAC5 and is essential for chloroplast development in Arabidopsis under heat stress. Plant Cell 2013, 25, 2925–2943. [Google Scholar] [CrossRef] [PubMed]
  22. Zhang, N.; Shi, J.; Zhao, H.; Jiang, J. Activation of small heat shock protein (SlHSP17. 7) gene by cell wall invertase inhibitor (SlCIF1) gene involved in sugar metabolism in tomato. Gene 2018, 679, 90–99. [Google Scholar] [CrossRef] [PubMed]
  23. Yang, R.; Yu, G.; Li, H.; Li, X.; Mu, C. Overexpression of small heat shock protein LimHSP16. 45 in Arabidopsis hsp17. 6II mutant enhances tolerance to abiotic stresses. Russ. J. Plant Physiol. 2020, 67, 231–241. [Google Scholar] [CrossRef]
  24. Ma, P.; Li, J.; Qi, L.; Dong, X. The archaeal small heat shock protein hsp17. 6 protects proteins from oxidative inactivation. Int. J. Mol. Sci. 2021, 22, 2591. [Google Scholar] [CrossRef]
  25. Sarkar, N.K.; Kotak, S.; Agarwal, M.; Kim, Y.K.; Grover, A. Silencing of class I small heat shock proteins affects seed-related attributes and thermotolerance in rice seedlings. Planta 2020, 251, 1–16. [Google Scholar] [CrossRef]
  26. Wu, J.; Gao, T.; Hu, J.; Zhao, L.; Chang, Y.; Ma, F. Research advances in function and regulation mechanisms of plant small heat shock proteins (sHSPs) under environmental stresses. Sci. Total Environ. 2022, 825, 154054. [Google Scholar] [CrossRef]
  27. Mu, C.; Zhang, S.; Yu, G.; Chen, N.; Li, X.; Liu, H.; Misra, R. Overexpression of small heat shock protein LimHSP16. 45 in Arabidopsis enhances tolerance to abiotic stresses. PLoS ONE 2013, 8, e82264. [Google Scholar] [CrossRef] [PubMed]
  28. Zhou, Y.; Chen, H.; Chu, P.; Li, Y.; Tan, B.; Ding, Y.; Tsang, E.W.T.; Jiang, L.; Wu, K.; Huang, S. NnHsp17.5, a cytosolic class II small heat shock protein gene from Nelumbo nucifera, contributes to seed germination vigor and seedling thermotolerance in transgenic Arabidopsis. Plant Cell Rep. 2012, 31, 379–389. [Google Scholar] [CrossRef]
  29. Li, J.; Zhang, J.; Jia, H.; Li, Y.; Xu, X.; Wang, L.; Lu, M. The Populus trichocarpa PtHsp17.8 involved in heat and salt stress tolerances. Plant Cell Rep. 2016, 35, 1587–1599. [Google Scholar] [CrossRef] [PubMed]
Figure 1. Detection of PCR products of LbHSP17.9 (M1. DNA Maker 2000; 1: LbHSP17.9).
Horticulturae 10 00287 g001
Figure 2. Prediction of LbHSP17.9 protein hydrophobicity, secondary structure and tertiary stru-ture. (A) Prediction hydrophobicity of LbHSP17.9 protein; (B) prediction of secondary structure of LbHSP17.9 protein; (C) prediction tertiary structure of LbHSP17.9 protein.
Horticulturae 10 00287 g002
Figure 3. Motif analysis of HSP17.9 proteins in different plants. (A) Location of motifs in HSP17.9 proteins; (B) amino acid sequence of motifs. Lb. Lilium brownii var. viridulum Baker; Py. Pyrus spp.; As. Asparagusofficinalis L. Ca. Camellia assamica; Lo. Lolium perenne L.; Be. Benincasa hispida (Thunb.) Cogn.; Zi. Zingiber officinale Roscoe.
Horticulturae 10 00287 g003
Figure 4. Sequence alignment of LbHSP17.9 with other plants’ HSP17.9 Ni. Nicotiana tabacum L.; Mo. Momordica charantia L.; Cu. Cucurbita pepo subsp. ovifera (L.) D.S. Decker; Zi. Zingiber officinale Roscoe; Py. Pyrus spp.
Horticulturae 10 00287 g004
Figure 5. Phylogenetic tree of HSP17.9 Lb. Lilium brownii var. viridulum Baker; Tr. Triticum aestivum Linn.; Lo. Lolium perenne Linn.; Br. Brachypodium distachyon (L.) P. Beauv.; Or. Oryza sativa subsp. japonica Kato.; Mi. Miscanthus lutarioriparius L. Liu ex Renvoize et S. L. Chen.; Ce. Cenchrus americanus (L.) Morrone.; Pa. Panicum virgatum L.; El. Eleusine coracana (Linn.) Gaertn.; Rh. Rhododendron molle (Bl.) G. Don.; Di. Dioscorea zingiberensis C. H. Wright.; Zi. Zingiber officinale Rosc.; Mu. Musa acuminata Colla.; El. Elaeis guineensis Jacq.; Ph. Phoenix dactylifera Linn.; En. Ensete ventricosum (Welw.) Cheesman.; Pe. Perilla frutescens (L.) Britton.; Vi. Vitis vinifera L.; As. Asparagus officinalis Linn.; Me. Melia azedarach Linn.; Se. Sesamum indicum Linn.; Pa. Paulownia fortunei (Seem.) Hemsl.; Lp. Ipomoea triloba Linn.; Ci. Citrullus lanatus (Thunb.) Matsum. et Nakai.; Mo. Momordica charantia Linn.; Be. Benincasa hispida (Thunb.) Cogn.; Cu. Cucumis melo Linn.; De. Dendrobium nobile Lindl.
Horticulturae 10 00287 g005
Figure 6. Relative expression of LbHSP17.9 under different treatments. Each value represents the mean ± SD (n = 3) with different letters indicating significant differences in relative expression between the five treatments.
Horticulturae 10 00287 g006
Figure 7. Phenotype of TRV2::LbHSP17.9 lily flowers. Bud and flowers were photographed from the side view and above at various time points (days), respectively.
Horticulturae 10 00287 g007
Figure 8. Relative expression of LbHSP17.9 under control and cold stress. (A) Relative expression of LbHSP17.9 under control; (B) relative expression of LbHSP17.9 under cold stress. Each value represents the mean ± SD (n = 3) with star mark indicating significant difference in relative expression between two groups on the same day.
Horticulturae 10 00287 g008
Figure 9. MDA contents in lily petals under control and cold stress. (A) MDA content under control; (B) MDA concentration under cold stress. Each value represents the mean ± SD (n = 3) with star mark indicating significant difference in MDA content between two groups on the same day.
Horticulturae 10 00287 g009
Figure 10. Antioxidant oxidase activity in lily petals under control and cold stress. (A) SOD activity in lily petals under control; (B) SOD activity in lily petals under cold stress; (C) CAT activity in lily petals under control; (D) CAT activity in lily petals under cold stress; (E) POD activity in lily petals under control; (F) POD activity in lily petals under cold stress. Each value represents the mean ± SD (n = 3) with star mark indicating significant difference between two groups on the same day.
Horticulturae 10 00287 g010
Figure 11. Relative expression levels of antioxidant enzyme genes in lily petals under control and cold stress. (A) Relative expression of LbCu/ZnSOD in lily petals under control; (B) relative expression of LbCu/ZnSOD in lily petals under cold stress; (C) relative expression of LbFeSOD in lily petals under control; (D) relative expression of LbFeSOD in lily petals under cold stress; (E) relative expression of LbMnSOD in lily petals under control; (F) relative expression of LbMnSOD in lily petals under cold stress; (G) relative expression of LbCAT in lily petals under control; (H) relative expression of LbCAT in lily petals under cold stress; (I) relative expression of LbPOD in lily petals under control; (J) relative expression of LbPOD in lily petals under cold stress. Each value represents the mean ± SD (n = 3) with star mark indicating significant difference in antioxidant enzyme gene expressions between two groups on the same day.
Horticulturae 10 00287 g011
Figure 12. Phenotypic changes of OE-LbHSP17.9 lily petal disc under control and cold stress.
Horticulturae 10 00287 g012
Figure 13. Relative expression of LbHSP17.9 in OE-LbHSP17.9 under control (A) and cold stress (B). Each value represents the mean ± SD (n = 3) with star mark indicating significant difference in relative expression of LbHSP17.9 between two groups on the same day.
Horticulturae 10 00287 g013
Figure 14. Relative electrolytic leakage of OE-LbHSP17.9 petal disc under cold stress. Each value represents the mean ± SD (n = 3) with star mark indicating significant difference in relative electrolytic leakage between two groups on the same day.
Horticulturae 10 00287 g014
Figure 15. Phenotype and MDA content of OE-LbHSP17.9 and WT under cold stress. (A) Phenotype of OE-LbHSP17.9 and WT under cold stress; (B) MDA content in OE-LbHSP17.9 and WT under cold stress. Each value represents the mean ± SD (n = 3) with star mark indicating significant difference in MDA contents between three groups.
Horticulturae 10 00287 g015
Disclaimer/Publisher’s Note: The statements, opinions and data contained in all publications are solely those of the individual author(s) and contributor(s) and not of MDPI and/or the editor(s). MDPI and/or the editor(s) disclaim responsibility for any injury to people or property resulting from any ideas, methods, instructions or products referred to in the content.

