Article

The Effect of the Daily Light Integral and Spectrum on Mesembryanthemum crystallinum L. in an Indoor Plant Production Environment

Department of Vegetable Sciences and Floriculture, Faculty of Horticulture, Mendel University in Brno, Valticka 337, 691 44 Lednice, Czech Republic
*
Author to whom correspondence should be addressed.
Horticulturae 2024, 10(3), 266; https://doi.org/10.3390/horticulturae10030266
Submission received: 17 November 2023 / Revised: 18 February 2024 / Accepted: 5 March 2024 / Published: 11 March 2024

Abstract

:
The effect of artificial lighting with different light spectra and photoperiods/daily light integrals (DLIs) on the yield, bioactive compounds and antioxidant capacity of the common ice plant (Mesembryanthemum crystallinum) was studied. Four-week-old seedlings were selected and subjected to four different light spectra made up of different combinations of blue (400–500 nm), green (500–600 nm) and red light (600–700 nm), with a total photosynthetic photon flux density (PPFD) of 180 µmol.m−2.s−1. Concurrently, the effect of the daily light integral (DLI) was also studied, with the light treatment photoperiod set at 18 h and 21 h. Biometric parameters such as fresh mass weight, leaf area, leaf width, and dry mass, together with plant metabolite contents such as total antioxidant capacity (TAC), vitamin C, chlorophyll a and b content, and total carotenoids and nitrates, were investigated. It was found that the plants grew better when exposed to light with a higher proportion of the red and blue spectrum, with the highest fresh mass of 68 g observed at a photoperiod of 18 h. On the other hand, green spectrum light was not found to yield any significant improvement in shoot weight, leaf area, or leaf size. It was also found that dry mass, chlorophyll b and nitrates were not influenced by the light spectrum but were influenced by the photoperiod duration. While both the dry mass and nitrate content increase as the photoperiod increases, a longer photoperiod had a negative effect on chlorophyll a, chlorophyll b and total carotenoids, with their content decreasing by as much 29% for chlorophyll a, 59% for chlorophyll b and 29% for total carotenoids. TAC content was seen to increase by more than 24% under the influence of 66% more green light, and 38% more under the 21 h photoperiod.

1. Introduction

Recent improvements in technology and a reduction in the cost, coupled with an increase in the energy and photometric output efficiency, have made LED lights more advantageous as an alternative to traditional growth lights such as day lights, high-pressure sodium lamps and high-intensity discharge metal halide lamps. This has resulted in LED lights finding their way into commercial indoor farming, where their use has gained widespread acceptance [1]. In the controlled environment of a plant factory, the control and regulation of the pre-harvest factors can have a great influence on growth and morphology, as well as postharvest quality [2]. Within the controlled environment of such a farm, with a requirement for year-round production, artificial lighting is the primary source of energy for plants and the dominant light source [3]. The effect of LED lights on plant growth has commonly been investigated in species (or crops) such as basil [4], lettuce [5,6], spinach and microgreens [7]. However, the effects of the light spectrum, intensity PPFD and photoperiod (DLI) have been found to be species-dependent [8,9].
The quality and quantity of light can be manipulated to improve yield and the phytonutrient contents of leafy greens. Applying an appropriate LED spectral wavelength significantly increases antioxidant enzyme activity in plants [10], thereby enhancing cell defence systems and providing protection from oxidative damage. It is possible to optimize productivity and quality through the optimization of the lighting to align with the sensitivity curve of the photosensitive pigments in plants.
Artificial lighting, such as mercury or sodium lamps, has been employed to supplement a lack of sunlight and extend the period of photosynthetic activity during the winter [11]; however, LED lights only came into use at the beginning of the 21st century, and previous research into LED lighting has mainly focused on more popular crops such as lettuce, basil and tomatoes. Leafy vegetables and herbs are often the crops of choice in studies into plant lighting, primarily due to their fast growth, low plant height, and short harvesting cycle. However, recent studies have shown that not all leafy vegetables exhibit optimal growth in the same conditions and accumulate specific metabolites under specific lighting conditions. It is not possible to generalize and address the needs of every plant in terms of the spatial and spectral distribution, intensity, and duration for the light source [12]. Since different plant species respond differently to lighting in the cultivation environment, it is necessary to evaluate specific spectrum wavelengths in specific plant species before the application of large-scale LED lighting to the cultivation of a particular plant [13]. As the responses of leafy greens to light are dependent on the genotype and developmental stage, a light receipt that targets the different developmental stages should be formulated for each species to maximize yield [11]. Although they have a high retail value and are gradually gaining popularity as a newly introduced nutritious vegetable crop, existing research on the response of ice plants to light quantity and quality has been inadequate. Little information is available on the yield response of ice plants to various light parameters such as the spectral range, intensity, and photoperiod duration, which have an impact on the yield and quality in a plant factory system [14].
In this work, Mesembryanthemum crystallinum L. (the common ice plant) was investigated. Also known as the crystalline ice plant, it is a prostrate succulent plant, native to the Namibian desert in southern Africa, that has been utilized as a vegetable in Europe and Asia, including Japan and Taiwan [15]. As a nutritious food, M. crystallinum is a gastronomic delight, due to its soft texture, fresh and slightly salty tasting leaves and young shoots. It is also regarded as a delicious cool-flavoured salad green with a high water content and compounds that have health benefits. In Europe, it is also known as a quickly cooked tender vegetable [15]. On the other hand, M. crystallinum has also been classified as a highly functional food [16]. Its high salt tolerance and content of bioactive compounds, coupled with its excellent capacity for phytoremediation, makes the common ice plant an important candidate for use both as a human food source and within medical care, as well for the decontamination of polluted sites [17].
This study aimed to investigate whether different spectral wavelengths at fixed intensities (PPFD) and photoperiods have significant effects on the growth and internal parameters of common ice plants. The hypothesis was based on the expectation that a longer DLI will allow the shortening of the growing cycle.

2. Materials and Methods

2.1. Plant Growing Condition

This study was conducted in Lednice, Czech Republic, the geographical coordinates of which are 48°48′0″ north and 16°48′0″ east. Common ice plant seeds were sown in pre-soaked rockwool. Seeds were placed in a phytotron chamber and the germinated seedlings were grown for 21 days at a temperature of 25 °C ± 1 °C and a relative humidity of 60% ± 10% with a photosynthetic photon flux density (PPFD) of 120 µmol.m−2.s−1. The day/night photoperiod was set to 14 h/10 h (light/dark). When 3 to 4 true leaves appeared, the seedlings were transplanted into 9 × 9 × 10 cm plastic pots, using Klasmann TS-1 propagation substrate peat moss (Klasmann-Deilmann GmbH, Geeste, Germany) as the growing medium. For each treatment, 16 pots were placed in the growth chambers with the following conditions: air temperature, 25 °C; relative air humidity, 60%. Two sets of experiments were conducted, with a photoperiod duration (DLI) of 18 and 21 h. Plants were irrigated twice a week with Solinure 7 fertilizer (ICL-growing solutions, Geldermalsen, The Netherlands), with a composition (ratio) as follows: 18 N, 11 P2O5, 11 K2O, 2 MgO, with the trace elements 0.01% B, 0.02% Cu, 0.04% Fe, 0.01% Mn, 0.002% Mo, and 0.002% Zn in chelated form, with EC 1.3 mS and pH 6.0.

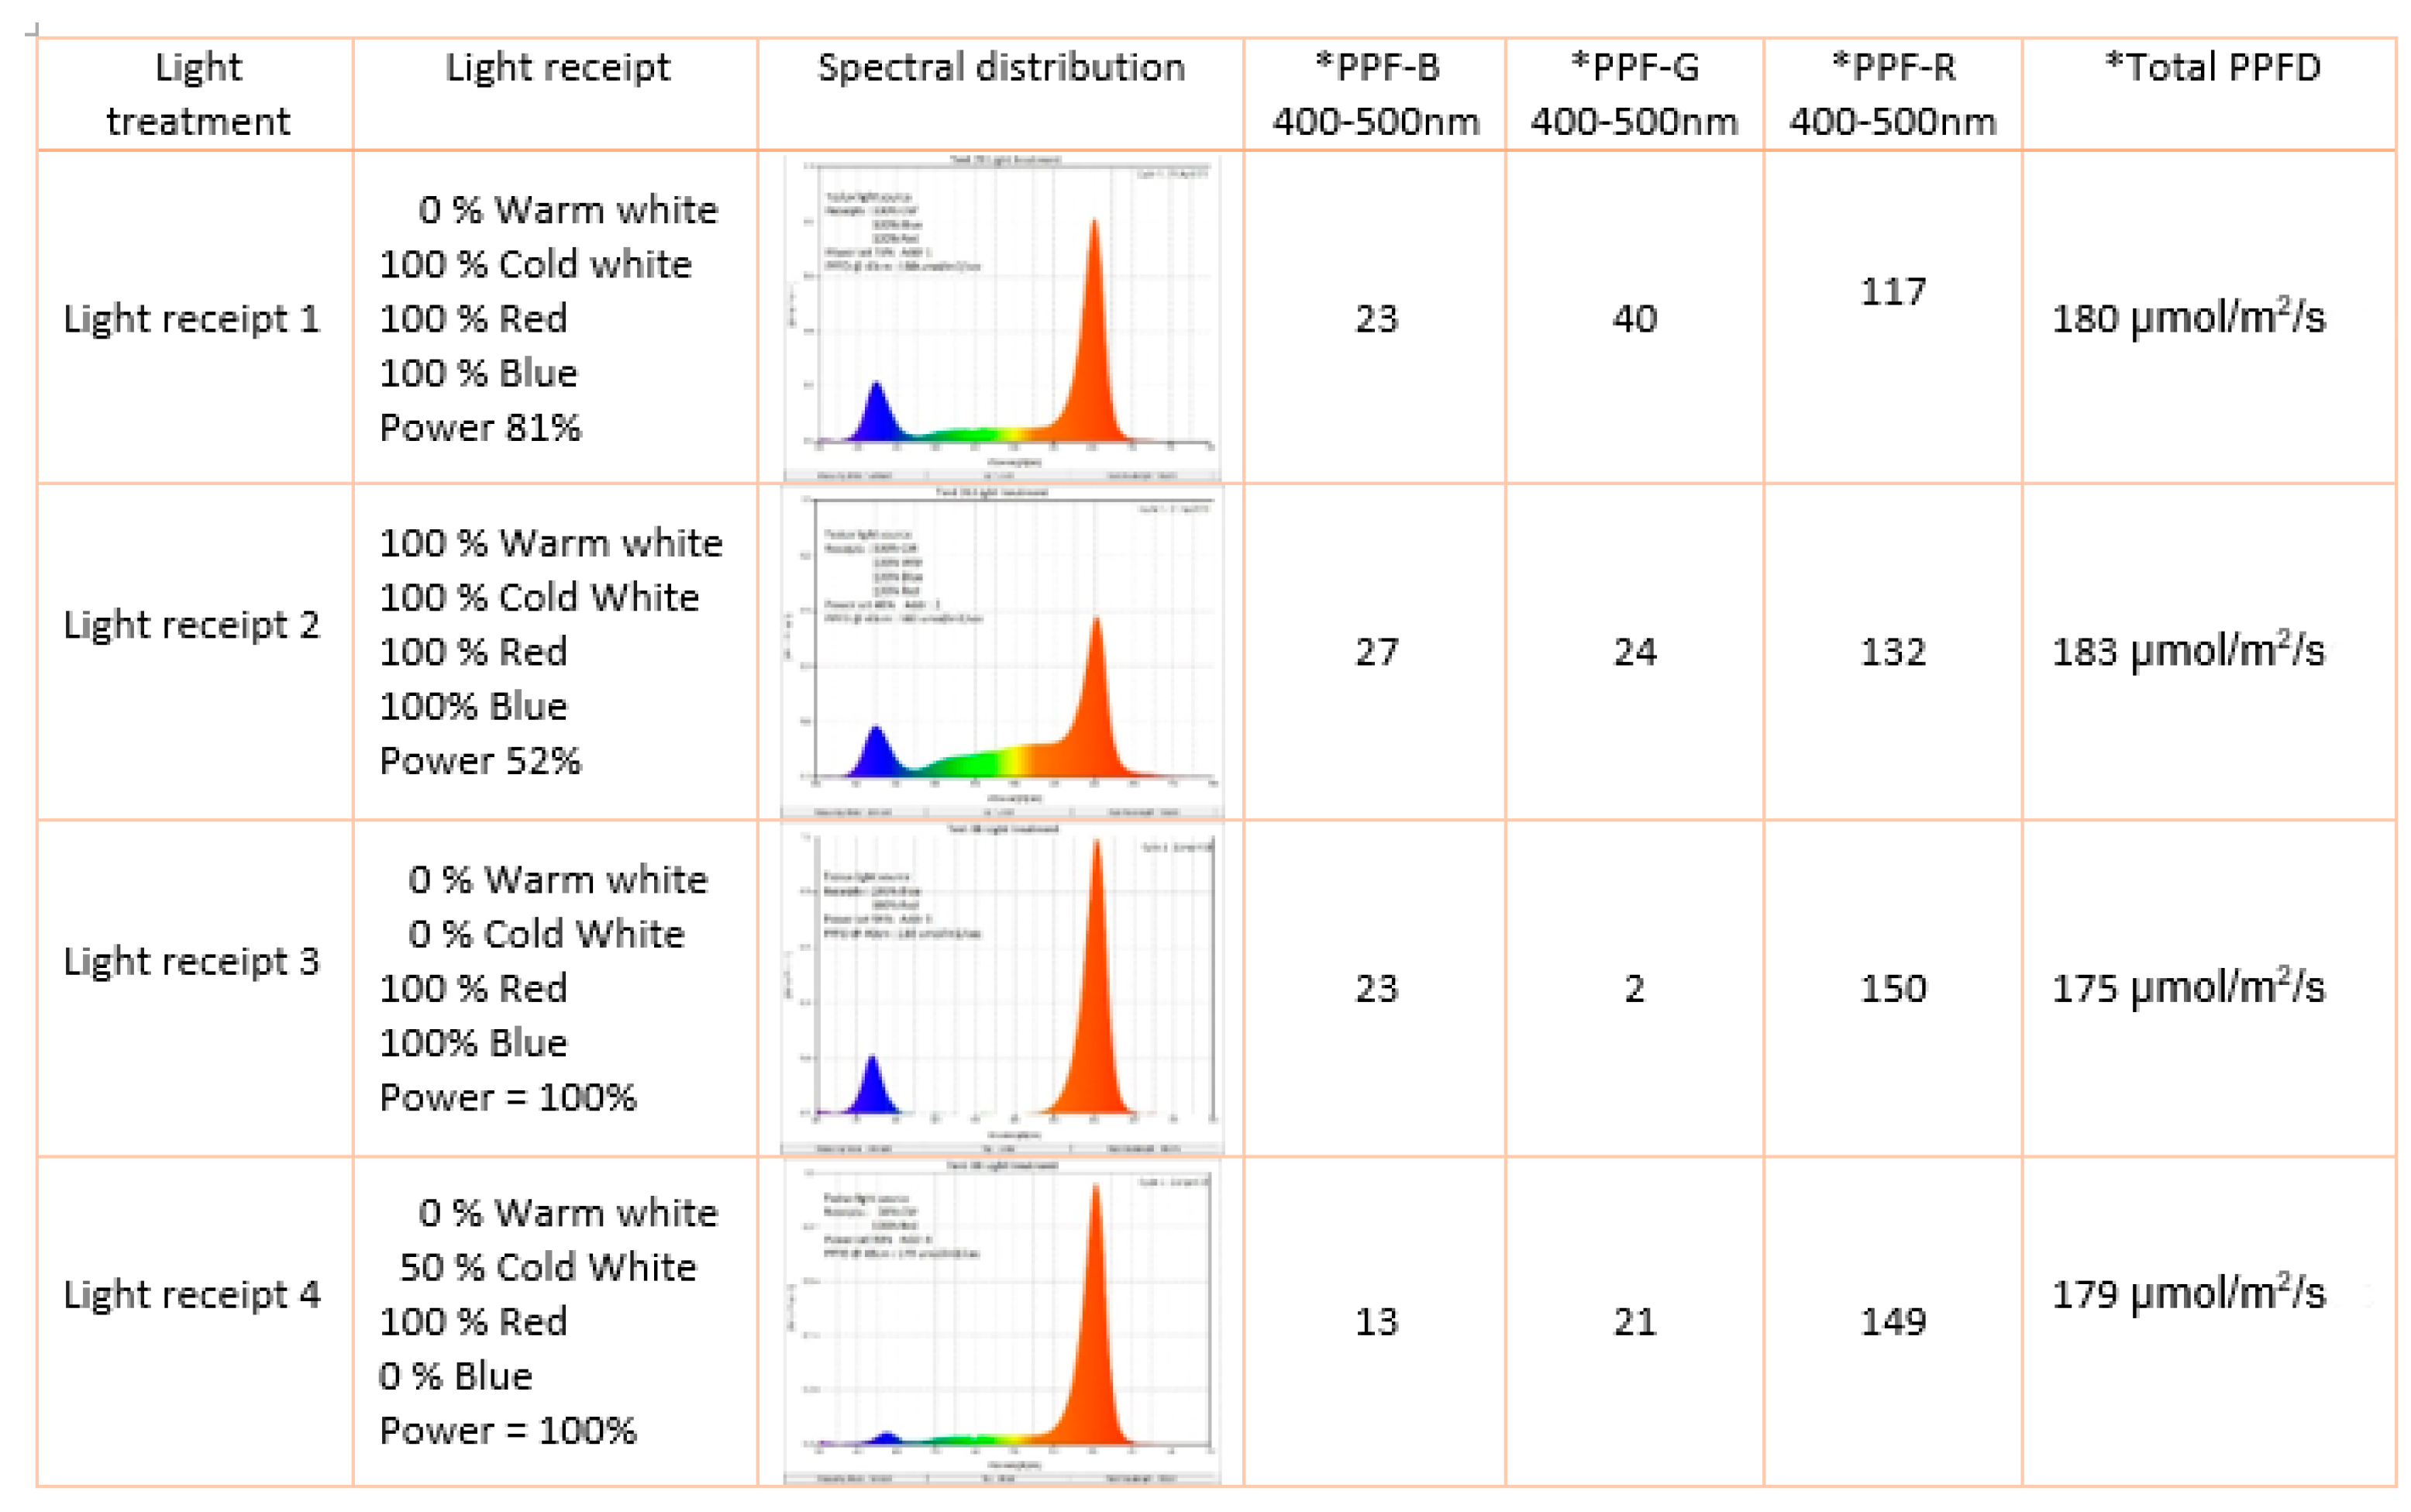
2.2. Light Treatment

A customized LED growth light module was used (TESLUX Lighting Ltd., Hodonin, Czech Republic). It consisted of 4 LED modules mounted on a 102 × 125 cm aluminium frame. The spectrum with their composition is shown in Figure 1. The growth light consisted of pre-programmed light receipts with various combination of warm white, cool white, red and blue spectra, and individual adjustable power outputs. The distance of the light modules from the growth tray was fixed at a vertical distance of 60 cm, and the intensity of the light at tray level was measured using a Sekonic C7000 PPFD light meter. For each treatment, the intensity of the light was set to 180 ± 10 µmol.m−2.s−1 by adjusting the power output setting.

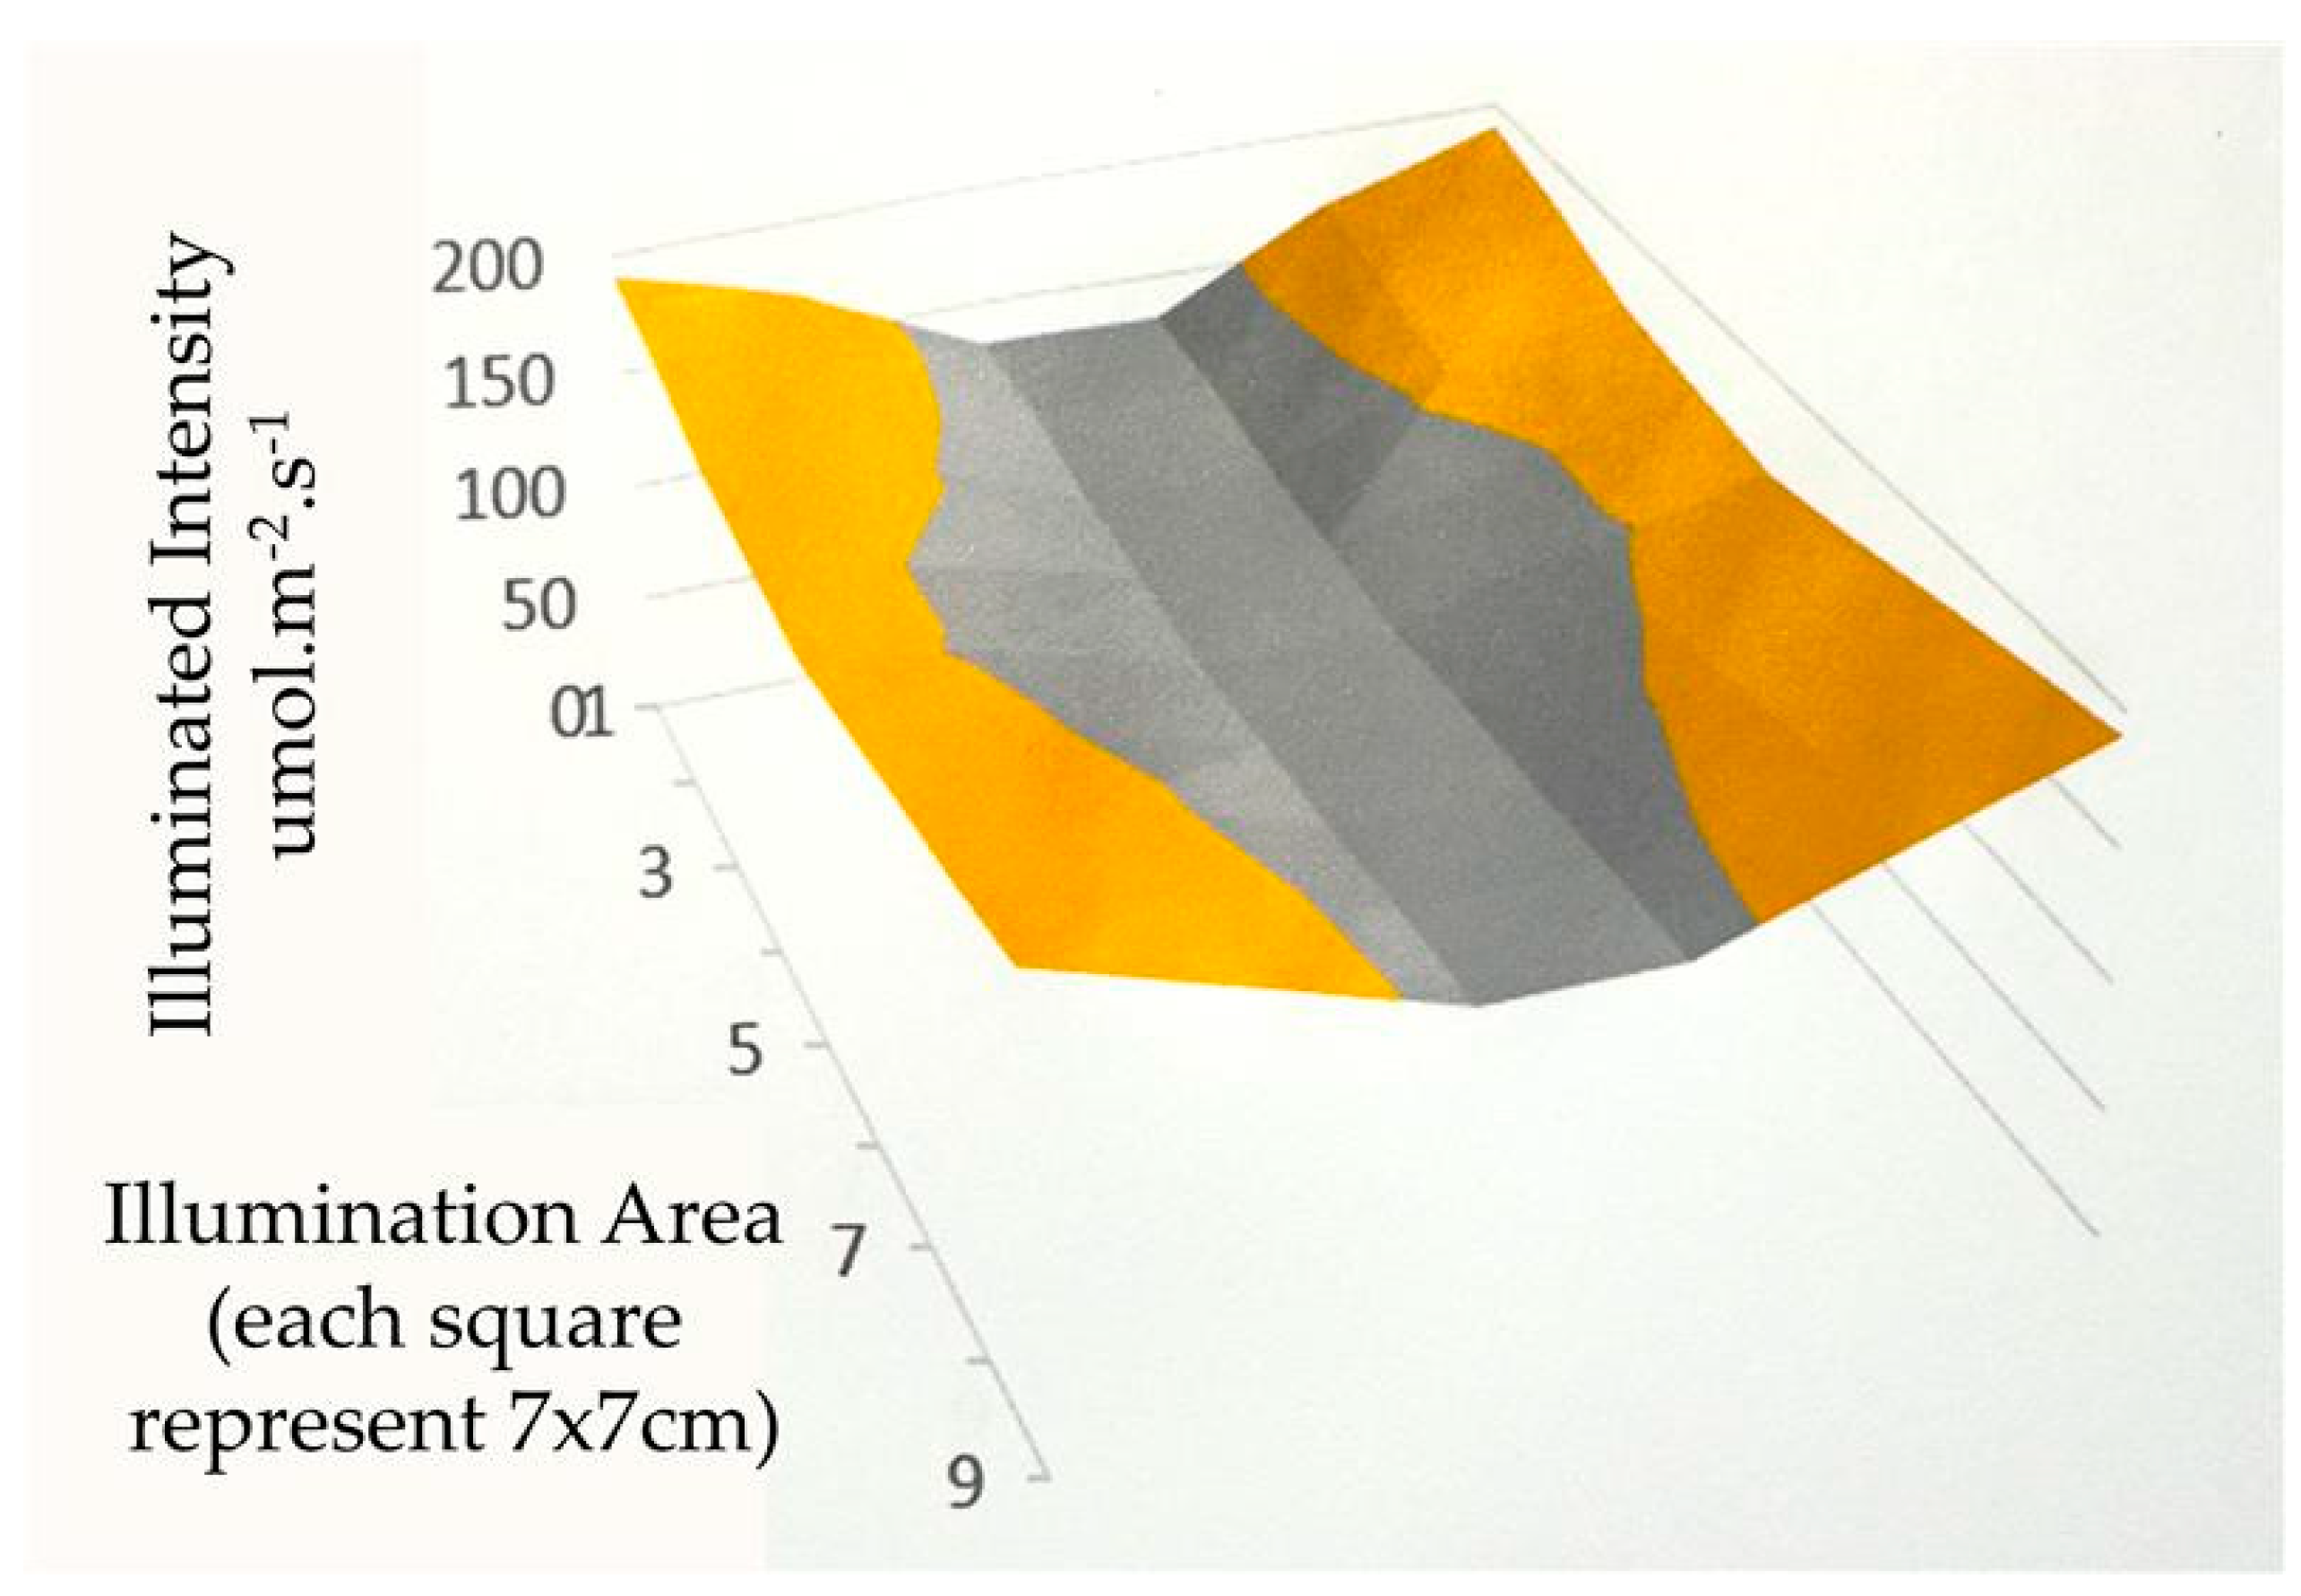
2.3. Homogeneity of the Light Distribution

To allow the study of the effect of variations in the light spectrum on the growth of plants, it is necessary to eliminate other contributory factors such as variations in the light intensity received by each individual plant. Thus, optimization of the overall homogeneity of the light distribution over the growing area is deemed essential. Using a 7 × 7 cm grid, the photosynthetic photon flux density (PPFD) of each grid was measured using a Sekonic C-7000 spectrometer (Sekonic Corporation, Tokyo, Japan). A 3D map of the intensity of the incident light on each grid within the growth area was then plotted and is shown in Figure 2. To minimize the variation in light intensity, the position of the 4 light modules relative to each other was varied until the variation in PPFD was a maximum of ±10% of the average across the whole growing area.

2.4. Testing Parameters

2.4.1. Sampling and Statistical Analysis

Five biological replicates were taken for each light treatment, and each replicate consisted of 3 randomly selected individual plant samples. With 4 different light treatments, that were a total of 20 test samples which were subsequently evaluated for the following parameters: shoot weight, dry weight, vitamin C, total antioxidant capacity, chlorophyll a, chlorophyll b, total carotenoids and nitrates. Data were processed using TIBCO Statistica 14.0.0.15 software (Databon Ltd., Prague, Czech Republic). First, basic statistics were generated for all data, and the normality of data distribution was tested using the Shapiro–Wilk test. Data that met the condition of normal distribution at α = 0.05 were evaluated using multifactorial ANOVA and subsequent post hoc analysis, Tukey’s HSD test (α = 0.05). Data that did not meet the condition of normal distribution were evaluated using a non-parametric test, Kruskal–Wallis analysis, followed by post hoc analysis, the multiple comparison of mean ranks for all groups (α = 0.05). Both the correlation and pairwise differences of the test parameters in relation to the light receipts and DLI was also established.

2.4.2. Growth Characteristics

To compare the growth characteristics of the plants for the different light treatments, the plant height, fresh weight of whole plant and leaf width were measured during harvesting. The fresh weight of shoots was measured using a precise digital analytical balance (DLT Series, Denver Instruments, Denver, CO, USA). The plant height and the width of the leaves were measured manually using a flexible ruler with an accuracy of +/−1 mm.

2.4.3. Dry Matter

The dry matter content was determined by means of sample weight loss after drying to a constant weight. The procedure was conducted as per Zbíral et al. (2005) [18]; samples (~5–10 g) were placed in an aluminium dish and weighed using a high-precision analytical balance (Denver Instruments, DLT Series) to four decimal places, then placed in a hot air dryer (Memmert, Schwabach, Germany) and heated to 105 °C for 4 h. After drying, the dish was placed in a desiccator and allowed to cool. After cooling, it was again weighed to 4 decimal places. The dry matter in percentage (%) was calculated by calculating the difference between the weight of the sample tray after drying and the weight of the empty dish and dividing this by the weight of the sample before drying.

2.4.4. Total Antioxidant Capacity

The total antioxidant capacity was determined using the DPPH method [19], which is based on the quenching of the radical cation DPPH+. A 5 g fresh ice plant shoot sample was weighed on an analytical balance (Denver Instruments, DLT Series) to 4 decimal places. Then, 20 mL of 75% methanol was added to the sample and mixed using a stick mixer. It was allowed to settle for 24 h, before filtration through a paper filter. A stock solution was prepared using 0.07866 g of DPPH (2,2-diphenyl-1-pyrcylhydrazyl) in a 50 mL volumetric flask, added to the given volume of 75% methanol solution. The reaction solution was prepared using 2.5 mL of DPPH stock solution in a 100 mL volumetric flask, added to the given volume of 75% methanol. The resulting concentration was 100 µM/L. With a pipette, 200 µL of the diluted sample was added to 3.8 mL of the solution. The absorbance was measured after 30 min using a spectrophotometric method (SPECORD 50 plus, Analytik Jena, Jena, Germany) with the reading taken at a wavelength of 515 nm.

2.4.5. Vitamin C

The vitamin C content was determined using high-performance liquid chromatography in the reversed phase mode with detection at 254 nm [20]. Samples delivered to the laboratory were kept at 4 °C until analysis. In the analysis process, 5–10 g of each sample was weighed using a precise digital analytical balance and mixed with 20–40 mL of oxalic acid solution. It was then filtered through gauze and transferred into a volumetric flask with a volume of 100 mL and made up to the required volume with the oxalic acid solution. A 20 mL sample was taken and centrifuged (Hettich EBA12, Hettich GmbH & Co., Tuttlingen, Germany) for 10 min at 4000 revolutions per minute. Before injection (Analytical pump ECP2000 ECOM ECOM Ltd., Praha, Czech Republic) into the HPLC system, the homogenate was filtered through a 0.45 µm Teflon microfilter with a diameter of 13 mm. This was followed by chromatographic analysis with a C18 column at Knauer Analytical HPLC, Berlin, Germany.

2.4.6. Chlorophyll and Carotenoids

The chlorophyll a, chlorophyll b and total carotenoid levels were determined by means of the following method. A 0.2000 g shoot sample (using a Denver Instrument DLT Series analytical balance) was extracted. Then, 11 mL of the extraction agent (acetone) was added, and the resulting solution was placed in a reaction vessel. This solution was then placed in a microwave extractor with the power set to 250 W and a temperature setting of 60 °C. The extract was then transferred into a 50 mL volumetric flask and topped up to the mark with acetone and heated for 10 min. After cooling to room temperature, spectrophotometric measurement (SPECORD 50 plus, Analytik Jena, Jena, Germany) was performed at a wavelength of 662 nm, where chlorophyll a exhibits its maximum absorption level, at a wavelength of 644 nm for chlorophyll b, and at 440 nm for carotenoids (Rai, 1973).
The Holm equation [21] was used for the calculation of:
Chlorophyll a = 9.784 × A662 − 0.990 × A644
Chlorophyll b = 21.426 × A644 − 4.650 × A662
Total carotenoids = 4.685 × A440 − 0.268 × (chlorophyll a + chlorophyll b)

3. Results

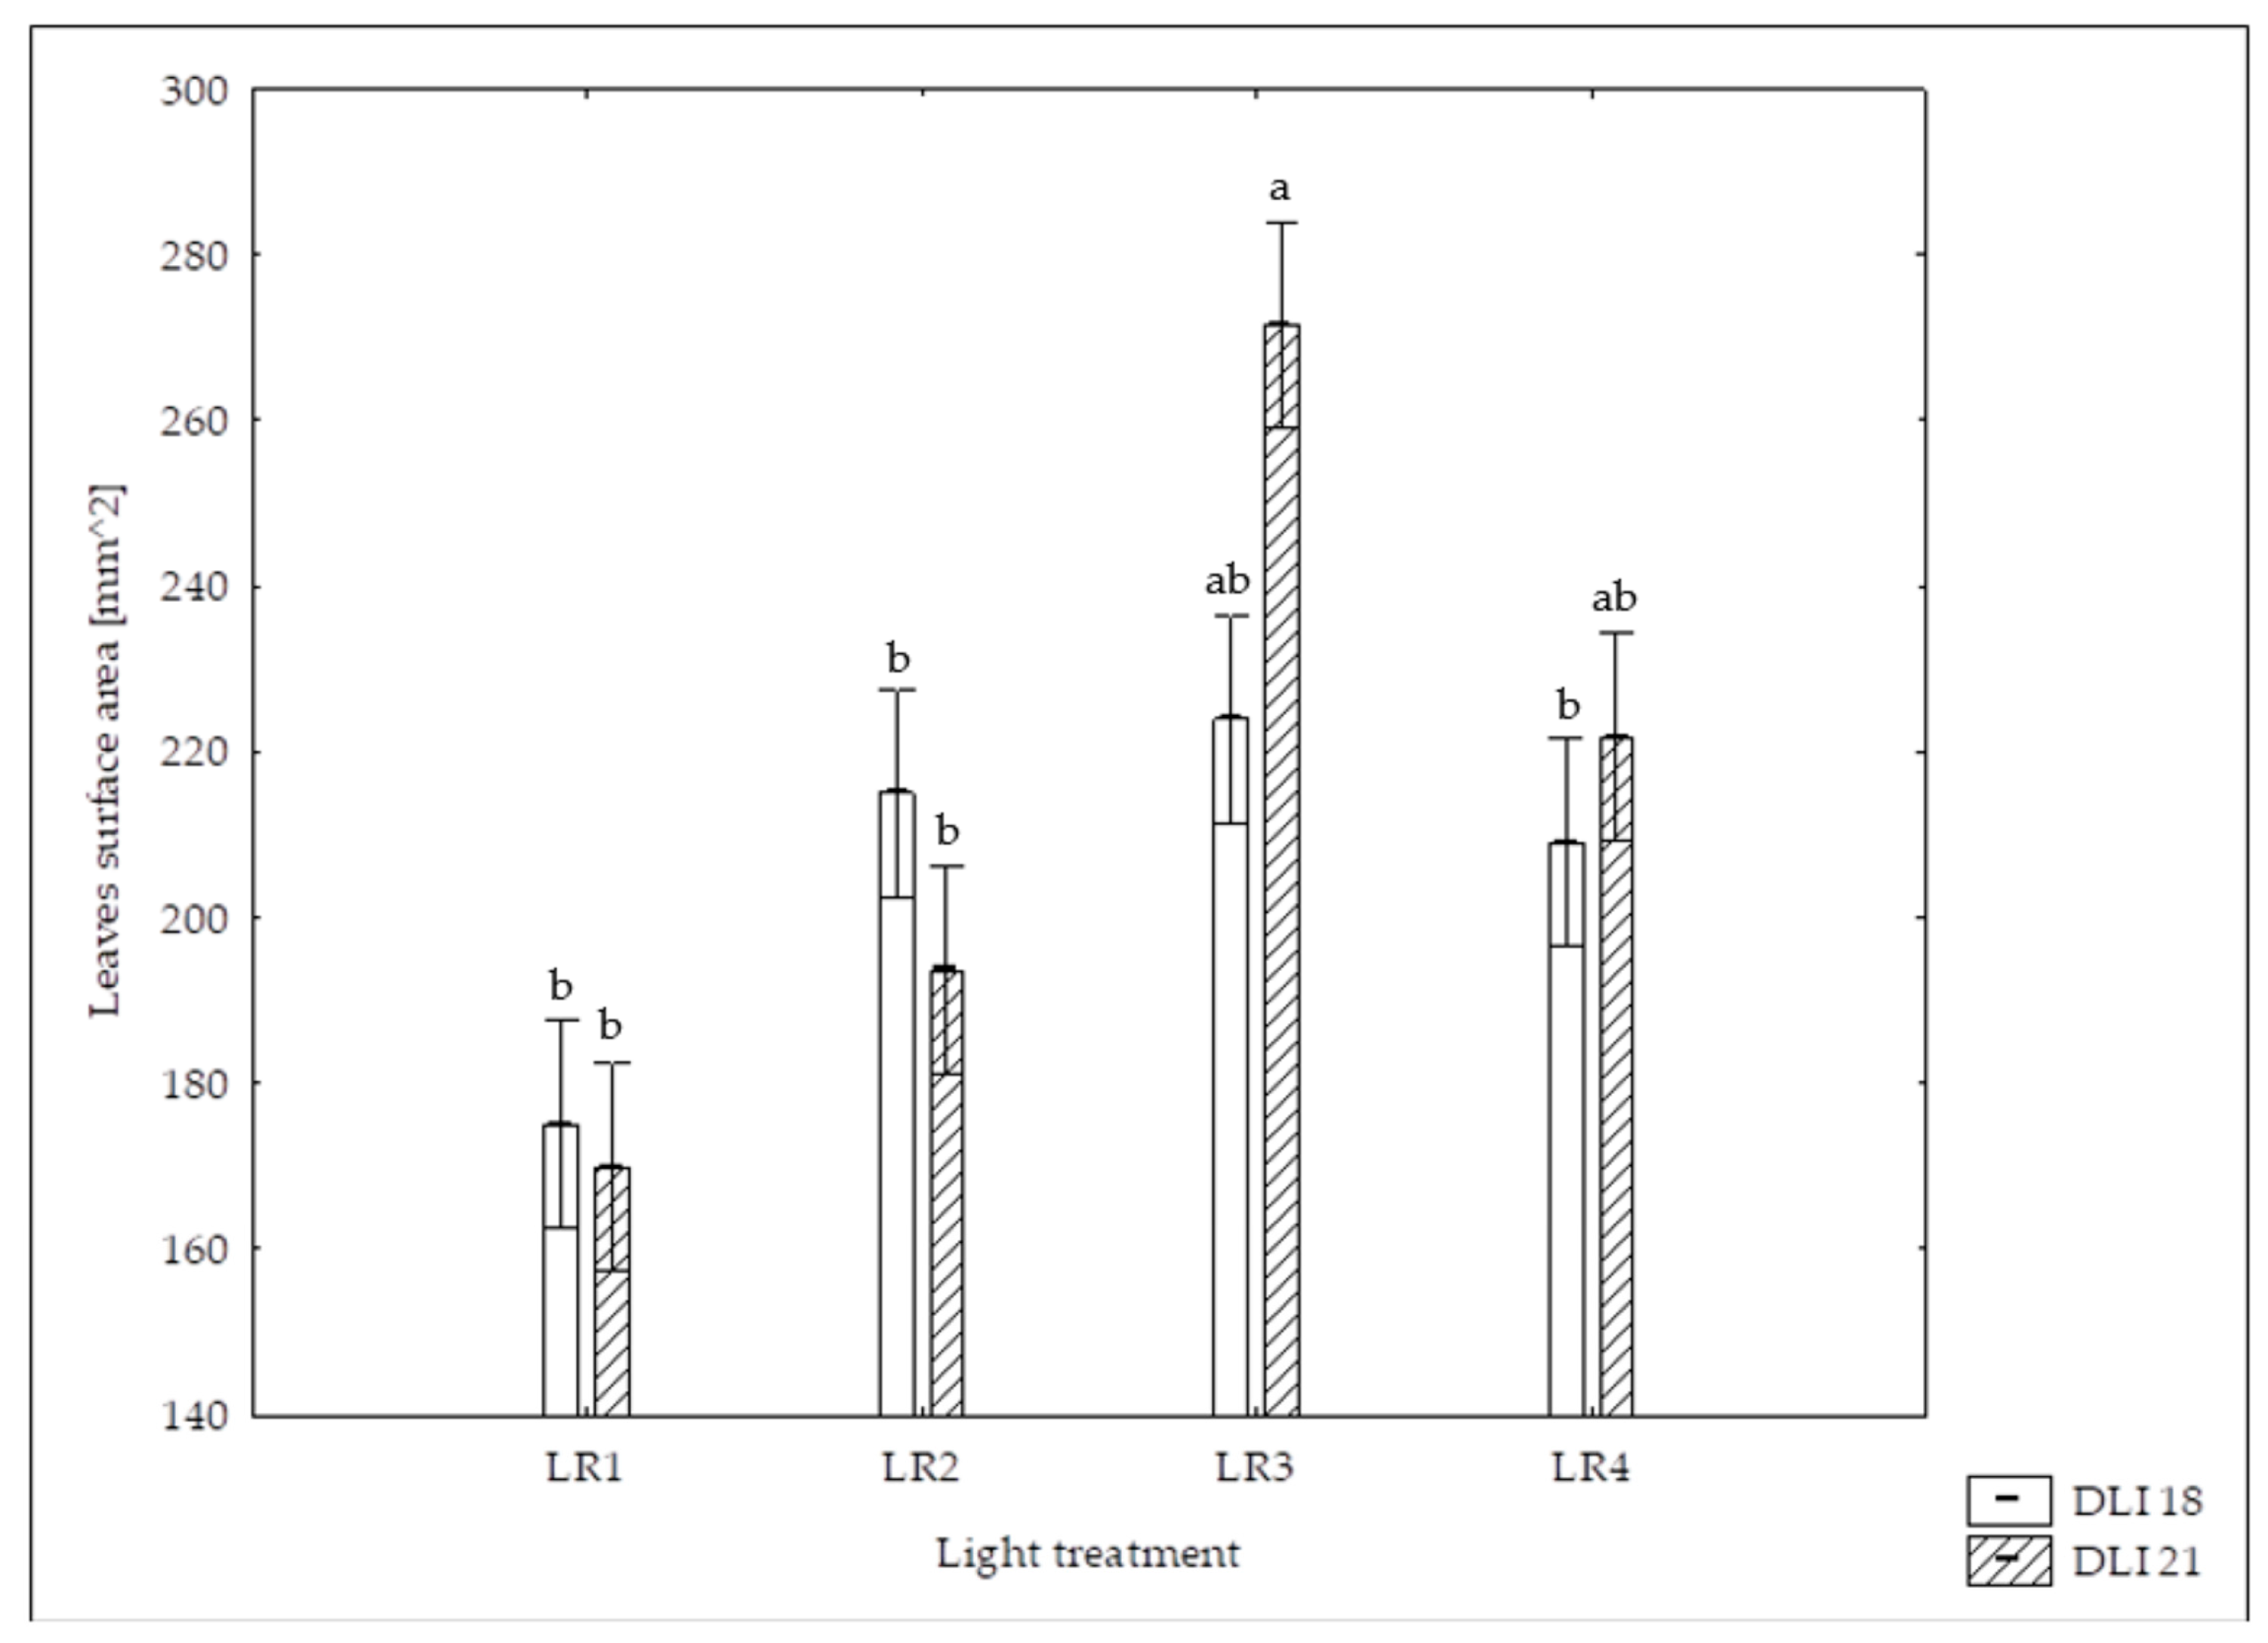
3.1. Morphological Parameters

Data (Table 1) such as plant weight, leaf area and leaf width were measured at harvest. Correlation analysis (Table 2) showed that the shoot weight, leaf area and mean leaf width of the plants exhibited significant differences depending on the light spectrum, but not the photoperiod. The highest yield and leaf area were obtained from plants which were exposed to the spectrum treatment with the highest proportion of blue/red light (Figure 3 and Figure 4). The highest mean shoot weights were 66.1 ± 1.9 g from light receipt 3 with the highest proportion of blue/red spectra and 54.6 ± 2.6 g from the second highest proportion of blue/red light (light receipt 4). The correlation data (Table 2) show that the photoperiod does not contribute to any significant changes in shoot weight, leaf area nor leaf width. Figure 1 shows various light treatments and their respective spectrum constitution. Post hoc Tukey tests found that spectrum 3, with the highest proportion of blue/red light, produced the biggest differences, as much as 84% with a DLI of 18 h and 73% with a DLI of 21 h, when compared to light receipt 1 and receipt 2, which have a much lower blue/red light spectra.
It was found (Figure 4) that for 21 h DLI, the leaf area is influenced by the light receipt with the highest proportion of blue/red light (light receipt 3), with an average area of 271.5.0 ± 8.2 cm2, which is significantly different from plants under light receipts 1 and 2. The second largest leaf area was obtained from light receipt 4, which had the next highest proportion of blue/red light. The leaf area coincided with the shoot weight of the plants, though in this case, there was no significant difference between plants under light receipts 1, 2 and 4. There is also no significant difference in leaf area at 18 h DLI.
The leaf width under 18 h DLI does not show any significant influence from light treatment. Under 21 h DLI, the highest mean leaf width of 26.3 ± 1.7 mm was measured at light receipt 3, with the highest proportion of blue/red light. Further analysis shows that there is a significant correlation between shoot weight, leaf area and leaf width, as shown in Figure 5.

3.2. Dry Matter

The dry mass is affected by photoperiod duration. In our experiment, at 21 h DLI, all light receipts experienced over a 20% higher mean content when compared to 18 h DLI. The highest pairwise difference in the dry matter was shown in light receipt 3, measuring 4.3 ± 0.1 (18 h DLI) vs. 2.9 ± 0.1 g (21 h DLI) (Table 3, Figure 6). Although there is also a significant pairwise difference between DLIs, there is no significant difference between the light receipts with the same DLI regarding dry matter.

3.3. Total Antioxidant Capacity

There is no significant difference in the TAC among different light treatments at 18 h DLI (Table 3) and 21 h DLI. At 21 h DLI, the content of TAC is affected by the light receipt with a higher green light content (500–600 nm). Light treatment with the highest proportion of green light (light receipt 1) produced a 24–56% higher value compared to the other light treatments. Statistical analyses recorded a mean of 151.0 ± 4.8 mg/kg at 21 h DLI compared to 73.4 ± 11.0 mg/kg at 18 h, which is over 105% higher. This is further verified by the second highest mean for TAC (114.3 ± 13.6 mg/kg), which was obtained with light receipt 2 (with the 2nd highest proportion of green light) at 21 h.

3.4. Vitamin C

No significant differences in vitamin C content were found between different light receipts at 18 h DLI (Table 3). Under 21 h DLI, light receipt 1, consisting of the highest portion of green light, produced a mean value of 105.8 ± 16.3 mg/kg, which was over 60% higher than light receipt 3. Separately under 21 h DLI, light receipts 1, 2 and 4 were found to have no significant differences in the mean vitamin C content as compared to light receipt 3.

3.5. Chlorophyll a and b

There were no significant differences between the interactions of the light treatments and DLI in the chlorophyll a and b contents. The daily light integral was the primary factor which had a significant effect on both chlorophyll a (Figure 7) and chlorophyll b (Table 3). Chlorophyll a under 18 h DLI ranged from 144.5 ± 8.4 to 160.1 ± 9.5 mg/kg, and from 95.3 ± 6.1 to 1220.3 ± 4.1 mg/kg under 21 h DLI, while chlorophyll b under 18 h DLI ranged from 57.9 ± 3.4 to 63.3 ± 3.7 mg/kg, and from 20.8 ± 2.2 to 29.9 ± 1.8 mg/kg under 21 h DLI. Comparing chlorophyll content between photoperiod durations shows that there was a 29% decrease in the average chlorophyll a content and a 58% decrease in the average chlorophyll b content between 18 h and 21 h DLI. The photoperiod has a negative effect to chlorophyll content across all light receipts, yielding an average reduction of over 25%.

3.6. Total Carotenoids

The total carotenoid content was found to be primarily affected by DLI and not light receipts. As shown in Figure 8, there was no significant difference in total carotenoid content among light receipts under 18 h DLI. For 21 h DLI, light receipts 2, 3 and 4, which consist of a lower proportion of the green spectrum, yield lower carotenoid contents as compared to light receipt 1. In addition, the photoperiod duration has a negative effect on the total carotenoid content. The statistical results indicating significant differences across all light receipts, with an overall decrease ranging between 22.1% and 36.5% between the two DLIs.

3.7. Nitrates

The experimental results show that higher photoperiod durations yield a higher mean nitrate content. At 18 h DLI, the light receipt is found to have no significant effect (Table 3) to nitrate content. However, the data indicate that at 21 h DLI, a high nitrate content was obtained under light receipts 4 and 3 (with the highest and the second highest red spectrum proportion), with nitrate contents of 2020 ± 350 mg/kg and 1579 ± 160 mg/kg, respectively.

4. Discussion

Various combinations of blue, green and red spectra were utilized in this study on both the physical characteristics and phytochemical contents of the common ice plant. Light treatment with the highest proportion of the blue/red spectra tends to yield the highest shoot weight, the largest leaf area and the greatest leaf width. This finding confirmed reports suggesting that red light effectively induces shoot weight growth in common ice plants [22]. The statistical data support other reports citing the effect of red light serving an important factor that promotes shoot weight in ice plants, which also increases area [23]. Other reports have also demonstrated the positive effects of red light on plant growth for leafy vegetables such as lettuce and perilla [24,25,26]. Though there was a significant difference in the leaf area of the plants due to the light spectrum [27], the results were not conclusive for the daily light integral. The scattering plots found low correlation between the shoot weight, leaf area and leaf width and the photoperiod DLI.
Our study found that a longer photoperiod had a positive effect on the mean dry weight, which is supported by other studies [28]. At 21 h DLI, the dry weight increases by over 20%, suggesting that this mirrors the plant’s native growth conditions, and it is adaptive to a longer photoperiod or higher PPDF for higher yield. With a longer photoperiod, plants have more time available for photosynthesis, allowing them to produce more assimilates and accumulate more dry weight. The results also show that there were no significant differences between the dry matter mass at different light spectra, suggesting that dry matter was not affected by light spectra but was affected by photoperiod duration. The low correlation factor also provides further evidence of these findings.
Several phytochemical parameters, such as TAC and vitamin C, were more affected by the light spectra than the total carotenoid, chlorophyll a, chlorophyll b and nitrate contents. The results for TAC and vitamin C at 21 h DLI suggest that light receipt 1 (Table 3), with the high proportion of blue and green light spectra, tended to yield higher TAC and vitamin C contents when compared to the other light treatments. It was reported in [29] that when plants experience various stresses, the antioxidant content increases because of the accumulation of secondary metabolites. Blue light has a shorter wavelength and thus possesses more energy than red light, and therefore can be considered as a stress factor, resulting in higher phytochemical contents of antioxidants, and vitamin C especially. Antioxidants act as scavengers, neutralizing harmful free radicals generated by the excess light energy of the shorter spectra. However, when comparing photoperiod duration, it was found that a higher photoperiod duration had a negative effect on TAC, vitamin C and carotenoid content, suggesting that the 21 h duration might be the threshold. Thus, further studies need to be completed for these observations to be considered, as the levels are also dependent on a wide range of multicomponent factors and growing conditions [30].
It was observed that chlorophyll a and b content was not affected by light spectra treatment but was affected by photoperiod duration. These results indicate that too much light can stress ice plants. Excessive light decreased the photosynthetic efficiency. This could be a consequence of the upper threshold limit for the maximum daily light integral that the plants can tolerate before they experience light stress [31,32]. It was also noted that most of the plant leaves (independent of light treatments) lost colour in the group exposed to a DLI of 21 h, suggesting that excessive light energy is unfavourable for the growth of ice plants and results in discolouration due to long-term exposure and stress.
While the total carotenoid and vitamin C content tended to be higher when under light treatments that included a higher proportion of shorter wavelengths (such as blue and/or green light spectra, as in light receipt 1) [33], it was also found that a longer photoperiod duration had a negative effect. This suggests that a greater proportion of shorter-wavelength spectra is beneficial for the production of carotenoids. However, both vitamin C and total carotenoid contents for all light receipts at 21 h DLI were significantly lower in comparison to those at 18 h DLI. The negative effect of a longer photoperiod duration suggested that the plants are likely to experience light stress, which is in line with the findings published [34], suggesting that an extended photoperiod can affect the plants and produce a negative response.
A higher photoperiod DLI has a positive effect on nitrate content, while also promoting the shoot weight in the plant, which also increases leaf area and width [22]. Other reports have also demonstrated the positive effect of nitrates on plant growth for leafy vegetables such as lettuce and perilla [22,23,24]. While no differences in nitrate contents were observed among the light treatment receipts under 18 h DLI, it was seen that a light spectrum with a higher proportion of blue/red spectra leads to a higher nitrate content, as observed for light receipts 3 and 4 under 21 h DLI. The increase in the uptake of nitrate due to the photoperiod also positively affect the physical and morphological parameters such as the shoot weight, leaf area and leaf width [27].

5. Conclusions

Red light boosted ice plant growth (shoot weight) due to its role in photosynthesis. Meanwhile, blue and green light increased phytochemical contents (TAC, vitamin C, and carotenoids).
The photoperiod affected various compounds, including dry matter, TAC, chlorophyll (a and b), carotenoids, and nitrates. A higher DLI increased dry matter and the content of antioxidants and nitrates, but surprisingly lowered chlorophyll and carotenoid content at the highest level (21 h), suggesting potential light stress.
Red light spectra (LR3 and LR4) maximized productivity, while most spectra achieved similar nutritional values. Extending photoperiod beyond 18 h offered no significant benefit for economical production.

Author Contributions

Conceptualization, J.W.C. and R.P.; formal analysis, K.P.; funding acquisition, J.W.C.; investigation, J.W.C.; methodology, J.W.C., R.P. and K.P.; project administration, J.W.C. and R.P.; supervision, R.P.; visualisation, K.P.; writing—original draft, J.W.C.; writing—review & editing, J.W.C. and K.P. All authors have read and agreed to the published version of the manuscript.

Funding

This work was supported by Mendel University in Brno, Faculty of Horticulture, Internal Grant Agency project IGA/ZF/2023-SI1-014 and by the project No. CZ.02.1.01/0.0/0.0/16_017/0002334 Research infrastructure for young scientists, which was financed with the support of the Ministry of Education, Youth and Sports of the Czech Republic.

Data Availability Statement

The original contributions presented in the study are included in the article, further inquiries can be directed to the corresponding author.

Acknowledgments

The author would like to thank all technical supporting staff from Mendel University in Brno, Faculty of Horticulture for their assistance in the experiments.

Conflicts of Interest

The authors declare no conflicts of interest.

References

  1. Wang, J.; Lu, W.; Tong, Y.; Yang, Q. Leaf morphology, photosynthetic performance, chlorophyll fluorescence, stomatal development of lettuce (Lactuca sativa L.) exposed to different ratios of red light to blue light. Front. Plant Sci. 2016, 7, 250. [Google Scholar] [CrossRef]
  2. Sale, A.I.; Uthairatanakij, A.; Laohakunjit, N.; Jitareerat, P.; Kaisangsri, N. Pre-harvest supplemental LED treatments led to improved postharvest quality of sweet basil leaves. J. Photochem. Photobiol. B Biol. 2023, 248, 112788. [Google Scholar] [CrossRef]
  3. Pattison, M.; Hansen, M.; Bardsley, N.; Elliott, C.; Lee, K.; Pattison, L.; Tsao, J. Lighting R&D Opportunities; US Department of Energy: Washington, DC, USA, 2020. [CrossRef]
  4. Larsen, D.H.; Woltering, E.J.; Nicole, C.C.S.; Marcelis, L.F.M. Response of Basil Growth and Morphology to Light Intensity and Spectrum in a Vertical Farm. Front. Plant Sci. 2020, 11, 597906. [Google Scholar] [CrossRef] [PubMed]
  5. Kim, H.H.; Wheeler, R.M.; Sager, J.C.; Goins, G.D.; Norikane, J.H. Evaluation of lettuce growth using supplemental green light with red and blue light-emitting diodes in a controlled environment: A review of research at Kennedy space center. Acta Hortic. 2006, 711, 111–119. [Google Scholar] [CrossRef]
  6. Li, Q.; Kubota, C. Effects of supplemental light quality on growth and phytochemicals of baby leaf lettuce. J. Environ. Exp. Bot. 2009, 67, 59–64. [Google Scholar] [CrossRef]
  7. Colonna, E.; Rouphael, Y.; Barbieri, G.; De Pascale, S. Nutritional quality of ten leafy vegetables harvested at two light intensities. Food Chem. 2016, 199, 702–710. [Google Scholar] [CrossRef] [PubMed]
  8. Snowden, M.C.; Cope, K.R.; Bugbee, B. Sensitivity of seven diverse species to blue and green light: Interactions with photon flux. PLoS ONE 2016, 11, e0163121. [Google Scholar] [CrossRef] [PubMed]
  9. Cope, K.R.; Bugbee, B. Spectral effects of three types of white light emitting diodes on plant growth and development: Absolute versus relative amounts of blue light. HortScience 2013, 48, 504–509. [Google Scholar] [CrossRef]
  10. Zhang, H.; Tu, Y.; Kang, J.; Song, W.; Zheng, L. Blue light dosage affects photosynthesis, chlorophyll, and antioxidant properties of Mesembryanthemum crystallinum. Photosynthetica 2021, 59, 547–556. [Google Scholar] [CrossRef]
  11. Castilla, N. Greenhouse Technology and Management, 2nd ed.; CABI: Wallingford, UK, 2013; ISBN 1780641036. [Google Scholar]
  12. Durmus, D. Real-Time Sensing and Control of Integrative Horticultural Lighting Systems. J 2020, 3, 266–274. [Google Scholar] [CrossRef]
  13. Morrow, R.C. Led lighting in horticulture. HortScience 2008, 43, 1947–1950. [Google Scholar] [CrossRef]
  14. Xia, J.Q.; Mattson, N. Response of Common Ice Plant (Mesembryanthemum crystallinum L.) to Sodium Chloride Concentration in Hydroponic Nutrient Solution. HortScience 2022, 57, 750–756. [Google Scholar] [CrossRef]
  15. Lee, J.W.; Son, K.H.; Lee, J.H.; Kim, Y.J. Growth and biochemical responses of ice plant irradiated by various visible light spectra in plant factories. HortScience Technol. 2019, 37, 598–608. [Google Scholar] [CrossRef]
  16. Lee, B.H.; Lee, C.C.; Wu, S.C. Ice plant (Mesembryanthemum crystallinum) improves hyperglycaemia and memory impairments in a Wistar rat model of streptozotocin-induced diabetes. J. Sci. Food Agric. 2014, 94, 2266–2273. [Google Scholar] [CrossRef] [PubMed]
  17. Herppich, W.B.; Huyskens-Keil, S.; Schreiner, M. Effects of saline irrigation on growth, physiology and quality of Mesembryanthemum crystallinum L., a rare vegetable crop. J. Appl. Bot. Food Qual. 2008, 82, 47–54. [Google Scholar]
  18. Zbíral, J. Analysis of Plant Material; Czech National Reference Laboratory, UKZUZ: Brno, Czech Republic, 2005. [Google Scholar]
  19. Re, R.; Pellegrini, N.; Proteggente, A.; Pannala, A.; Yang, M.; Rice-Evans, C. Antioxidant activity applying an improved ABTS radical cation decolorization assay. Free Radic. Biol. Med. 1999, 26, 1231–1237. [Google Scholar] [CrossRef] [PubMed]
  20. Tang, Y.; Wu, M. A quick method for the simultaneous determination of ascorbic acid and sorbic acid in fruit juices by capillary zone electrophoresis. Talanta 2005, 65, 794–798. [Google Scholar] [CrossRef] [PubMed]
  21. Holm-Hansen, O.; Bo, R. Chlorophyll a Determination: Improvements in Methodology. Oikos 1978, 30, 438–447. [Google Scholar] [CrossRef]
  22. Son, K.H.; Oh, M.M. Growth, photosynthetic and antioxidant parameters of two lettuce cultivars as affected by red, green and blue light emitting diode. Korean J. Hortic. Sci. Technol. 2015, 30, 664–672. [Google Scholar] [CrossRef]
  23. Young, J.K.; Hye, M.K.; Hyeon, M.K.; Hye, R.L.; Byoung, R.J.; Hyeon, J.L.; Hyun, J.K.; Seung, J.H. Growth and phytochemicals of ice plant (Mesembryanthemum crystallinum L.) as affected by various combined ratios of red and blue LEDs in a closed-type plant production system. J. Appl. Res. Med. Aromat. Plants 2021, 20, 100267. [Google Scholar]
  24. Nishimura, T.; Ohyama, K.; Goto, E.; Inagaki, N. Concentrations of perillaldehyde, limonene, and anthocyanin of Perilla plants as affected by light quality under controlled environments. Sci. Hortic. 2009, 122, 134–137. [Google Scholar] [CrossRef]
  25. Johkan, M.; Shoji, K.; Goto, F.; Hashida, S.; Yoshihara, T. Blue light-emitting diode light irradiation of seedlings improves seedling quality and growth after transplanting in red leaf lettuce. HortScience 2010, 45, 1809–1814. [Google Scholar] [CrossRef]
  26. Shimizu, H.; Saito, Y.; Nakashima, H.; Miyasaka, J.; Ohdoi, K. Light environment optimization for lettuce growth in plant factory. In Proceedings of the 18th IFAC World Congress, Milano, Italy, 28 August–2 September 2011; pp. 605–609. [Google Scholar]
  27. Xia, J.; Mattson, N. Response of Common Ice Plant (Mesembryanthemum crystallinum L.) to Photoperiod/Daily Light Integral in Vertical Hydroponic Production. Horticulturae 2022, 8, 653. [Google Scholar] [CrossRef]
  28. Liu, K.; Gao, M.; Jiang, H.; Ou, S.; Li, X.; He, R.; Li, Y.; Liu, H. Light Intensity and Photoperiod Affect Growth and Nutritional Quality of Brassica Microgreens. Molecules 2022, 27, 883. [Google Scholar] [CrossRef] [PubMed]
  29. Kurucz, E.; Antal, G.; Kincses, I.; Sipos, M.; Miklós, G.F.; Holb, I.J. Effect of Light Treatment and Maturity Stage on Biomass Production and Bioactive Compounds of Two Pepper Cultivars under a Deep Water Culture Hydroponic System. Sustainability 2023, 15, 13205. [Google Scholar] [CrossRef]
  30. Samuoliene, G.; Sirtautas, R.; Brazaityte, A.; Duchovskis, P. LED lighting and seasonality effects antioxidant properties of baby leaf lettuce. Food Chem. 2012, 134, 1494–1499. [Google Scholar] [CrossRef] [PubMed]
  31. Barber, J.; Andersson, B. Too much of a good thing: Light can be bad for photosynthesis. Trends Biochem. Sci. 1992, 17, 61–66. [Google Scholar] [CrossRef]
  32. Muller, P.; Li, X.P.; Niyogi, K.K. No photochemical quenching. A response to excess light energy. Plant Physiol. 2001, 125, 1558–1566. [Google Scholar] [CrossRef]
  33. Abdullah, A.A.; Abdulaziz, S.A.; Ibrahim, M.A.; Hail, Z.R.; Michael, P.F.; Abdullah, A.A.; Abdullah, A.I. The Effect of LED Light Spectra on the Growth, Yield and Nutritional Value of Red and Green Lettuce (Lactuca sativa). Plants 2023, 12, 463. [Google Scholar] [CrossRef]
  34. Xu, D.Q.; Shen, Y.K. Light stress: Photoinhibition of photosynthesis in plants under natural conditions. In Handbook of Plant and Crop Stress, 4th ed.; Mohammad, P., Ed.; Marcel Dekker, Inc.: New York, NY, USA, 1999; pp. 483–497. [Google Scholar]
Figure 1. Spectrum distribution of each light treatments. * Unit in µmol.m−2.s−1, together with their composition of BGR in absolute PPFD value.
Horticulturae 10 00266 g001
Figure 2. Three-dimensional surface plot of the light intensity (µmol.m−2.s−1) illuminated on the planting area. The yellow colour shows area of the light intensity above minimum limit of 140 µmol.m−2.s−1. Variation was adjusted to within ±10% of the average measurements.
Horticulturae 10 00266 g002
Figure 3. Mean plant shoot weight (g) under different light treatment receipts at DLI 18 h and 21 h; error bars represent the standard error (n = 16); different letters above the columns correspond to a significant difference according to ANOVA followed by Tukey’s HSD test (α = 0.05).
Horticulturae 10 00266 g003
Figure 4. Leaf surface area (cm2) of plants under different light treatment receipts at 18 h and 21 h DLI; error bars represent the standard error (n = 16); different letters above the columns correspond to a significant difference according to ANOVA followed by Tukey’s HSD test (α = 0.05).
Horticulturae 10 00266 g004
Figure 5. Scatterplot for correlation between (A) leaf width and biomass; (B) leaf area and leaf width; the blue circles represent the values of both variables in individual graphs; the red dashed lines represent the 95% confidence interval.
Horticulturae 10 00266 g005
Figure 6. Dry matter (%) of plants under different light treatment receipts at 18 h and 21 h DLI; error bars represent the standard error (n = 5); different letters above the columns correspond to a significant difference according to ANOVA followed by Tukey’s HSD test (α = 0.05).
Horticulturae 10 00266 g006
Figure 7. Chlorophyll a (mg/kg) under different light treatment receipts at 18 h and 21 h DLI; error bars represent the standard error (n = 5); different letters above the columns correspond to a significant difference according to ANOVA followed by Tukey’s HSD test (α = 0.05).
Horticulturae 10 00266 g007
Figure 8. Total carotenoids (mg/kg) under different light treatment receipts at 18 h and 21 h DLI; error bars represent the standard error (n = 5); different letters above the columns correspond to a significant difference according to ANOVA followed by Tukey’s HSD test (α = 0.05).
Horticulturae 10 00266 g008
Table 1. Morphological parameters under different light treatments: mean value (±standard deviation) for n = 16 in the case of the leaf width parameter and for n = 5 in the case of other parameters; different letters (small for light receipt, capital for DLI) in the columns correspond to multiple comparisons of mean ranks for all groups (α = 0.05).
Light Receipt 1Light Receipt 2Light Receipt 3Light Receipt 4
Morphological ParametersDLI 18 h DLI 21 h DLI 18 h DLI 21 h DLI 18 h DLI 21 h DLI 18 h DLI 21 h
Plant shoot weight [g]39.3 (±4.5) eE37.1 (±10.8) eE37.1 (±5.5) eE42.0 (±17.6) deDE68.0 (±5.9) aA64.2 (±10.0) abA57.2 (±6.7) bcBC52.0 (±9.9) cdCD
Leaves surface area [cm2]175.0 (±46.7) bB169.9 (±35.3) bB215.0 (±38.2) bAB193.6 (±78.1) bB224.0 (±41.8) abA271.5 (±33.8) aA209.0 (±60.9) bB221.7 (±49.5) abAB
Leaves width [mm]23.7 (±2.5) aAB21.9 (±2.9) cB25.1 (±2.5) aAB23.8 (±4.0) bcB24.6 (±2.6) aAB28.0 (±1.9) aA24.1 (±3.8) aAB26.9 (±1.9) abB
Table 2. Correlation of morphological and phytochemical parameters under different light treatments and photoperiods; correlations marked as * are significant at α = 0.05.
Plant Shoot Weight [g]Leaves Surface Area [cm2]Leaves Width [mm]Dry Matter [%]TAC [mg/kg]Vitamin C [mg/kg]Chlorophyll a [mg/kg]Chlorophyll b [mg/kg]Total
Carotenoids [mg/kg]
Nitrates [mg/kg]
Light treatment0.565 *0.338 *0.342 *0.009−0.562 *−0.314 *−0.245−0.142−0.2370.251
DLI−0.0520.0740.1220.712 *0.547 *−0.086−0.818 *−0.941 *−0.797 *0.752 *
Table 3. Phytochemical parameters under different light treatments: mean value (±standard deviation) for n = 5 in the case of phytochemical parameters; different letters in the columns correspond to a significant difference (α = 0.05)—small letters for light receipts and capital letters for the DLI effect.
Light Receipt 1Light Receipt 2Light Receipt 3Light Receipt 4
Phytochemical ParametersDLI 18 h DLI 21 h DLI 18 h DLI 21 h DLI 18 h DLI 21 h DLI 18 h DLI 21 h
Dry matter [%]3.4 (±0.3) bcdCDE3.9 (±0.5) abABC3.1 (±0.2) cdE3.7 (±0.6) abcBCD2.9 (±0.3) dE4.3 (±0.3) aA3.2 (±0.4) bcdDE4.0 (±0.4) abAB
TAC [mg/kg]73.4 (±24.7) aC151.0 (±10.8) aA68.2 (±10.9) aC114.3 (±30.3) abB57.9 (±13.7) aC72.8 (±10.8) bC53.4 (±25.7) aC69.8 (±13.9) bC
Vitamin C [mg/kg]83.4 (±19.2) aBC105.8 (±16.3) aA72.2 (±11.6) aC79.1 (±10.3) abC102.2 (±20.0) aAB64.0 (±9.7) bC76.3 (±19.4) aC71.7 (±8.0) abC
Chlorophyll a [mg/kg]160.1 (±21.2) aA120.3 (±9.1) bcB144.5 (±18.9) abA111.4 (±17.2) cBC152.5 (±9.9) aA98.9 (±10.0) cC147.0 (±14.6) abA95.3 (±13.7) cC
Chlorophyll b [mg/kg]63.3 (±8.3) aA29.9 (±4.0) aB62.5 (±9.6) aA26.3 (±8.1) aB59.9 (±2.4) aA23.9 (±2.2) aB58.0 (±7.7) aA20.8 (±4.9) aB
Total carotenoids [mg/kg]49.7 (±5.2) aA38.7 (±2.8) bcB43.7 (±7.1) abAB30.5 (±5.1) cdC45.0 (±3.8) abA28.5 (±2.9) dC45.1 (±3.3) abA31.6 (±4.2) cdC
Nitrates [mg/kg]325.0 (±224.4) aE994.3 (±406.4) aCD607.5 (±358.9) aDE1161.0 (±391.7) aBC250.0 (±157.0) aE1579.4 (±359) aAB334.4 (±82.4) aE2020.0 (±782.9) aA
Disclaimer/Publisher’s Note: The statements, opinions and data contained in all publications are solely those of the individual author(s) and contributor(s) and not of MDPI and/or the editor(s). MDPI and/or the editor(s) disclaim responsibility for any injury to people or property resulting from any ideas, methods, instructions or products referred to in the content.

