
Dendropanax morbifera Leveille Extract-Induced Alteration of Metabolic Profile in Whitening Effects


Abstract
:1. Introduction
2. Materials and Methods
2.1. Extract Preparation
2.2. Analysis of Total Phenols and Total Flavonoids
2.3. Cell Culture
2.4. Cell Viability Assay
2.5. Melanin Content Measurement
2.6. Tyrosinase Activity Detection
2.7. Sample Preparation for Metabolomics
2.8. GC-MS Detection and Data Processing
3. Results and Discussion
3.1. Total Phenol and Total Flavonoid Concentrations
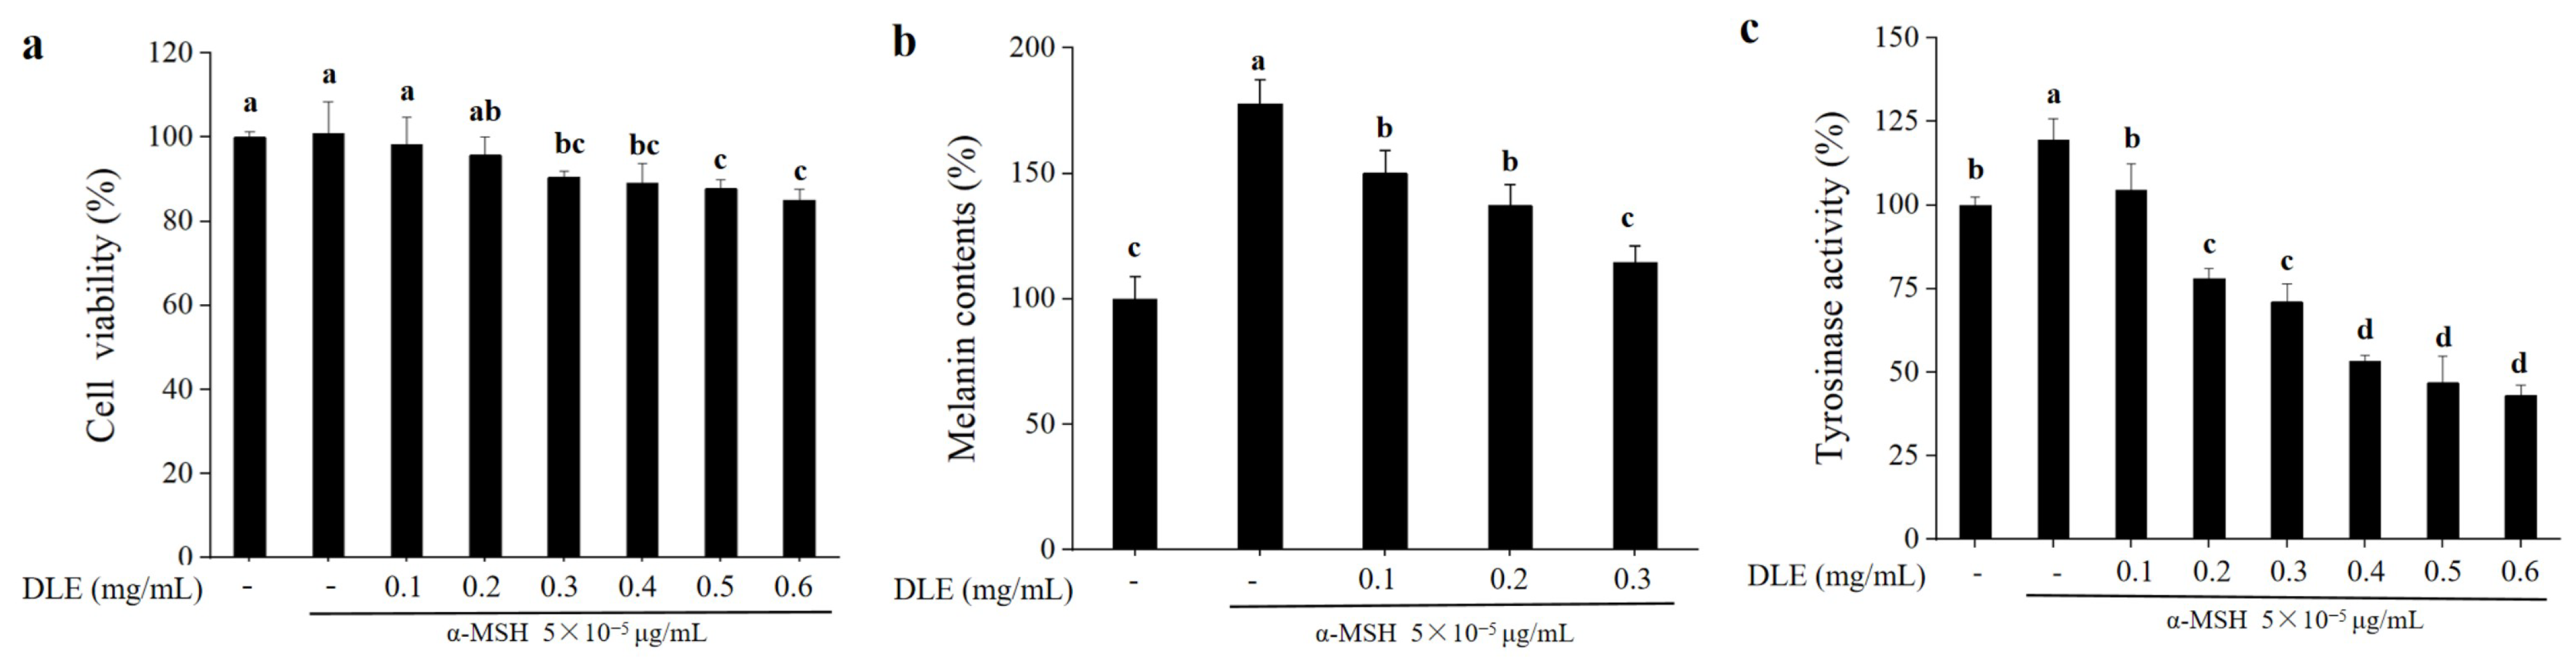
3.2. Whitening Effects of D. morbifera Extract
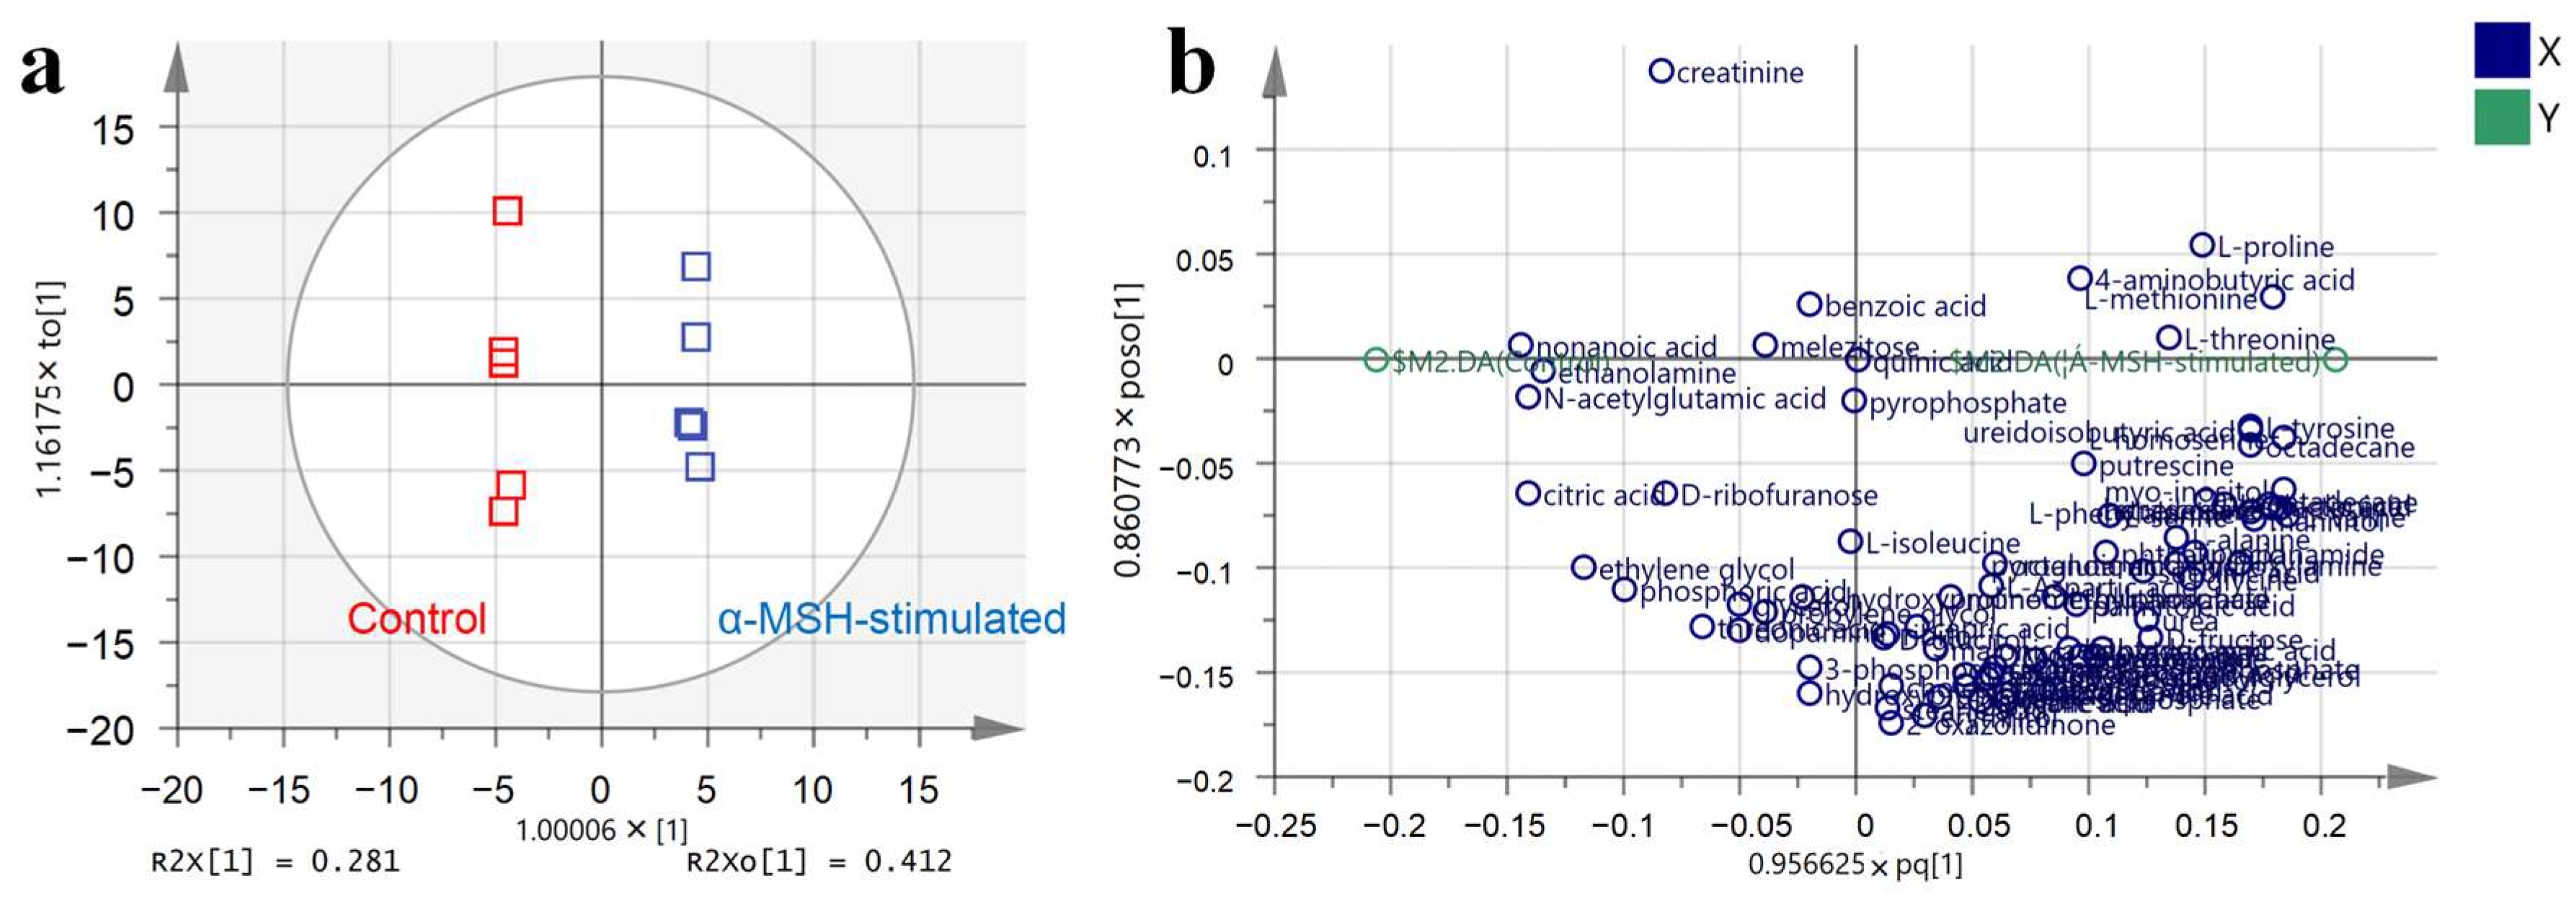
3.3. Metabolic Profile of α-MSH-Stimulated B16-F10 Cells
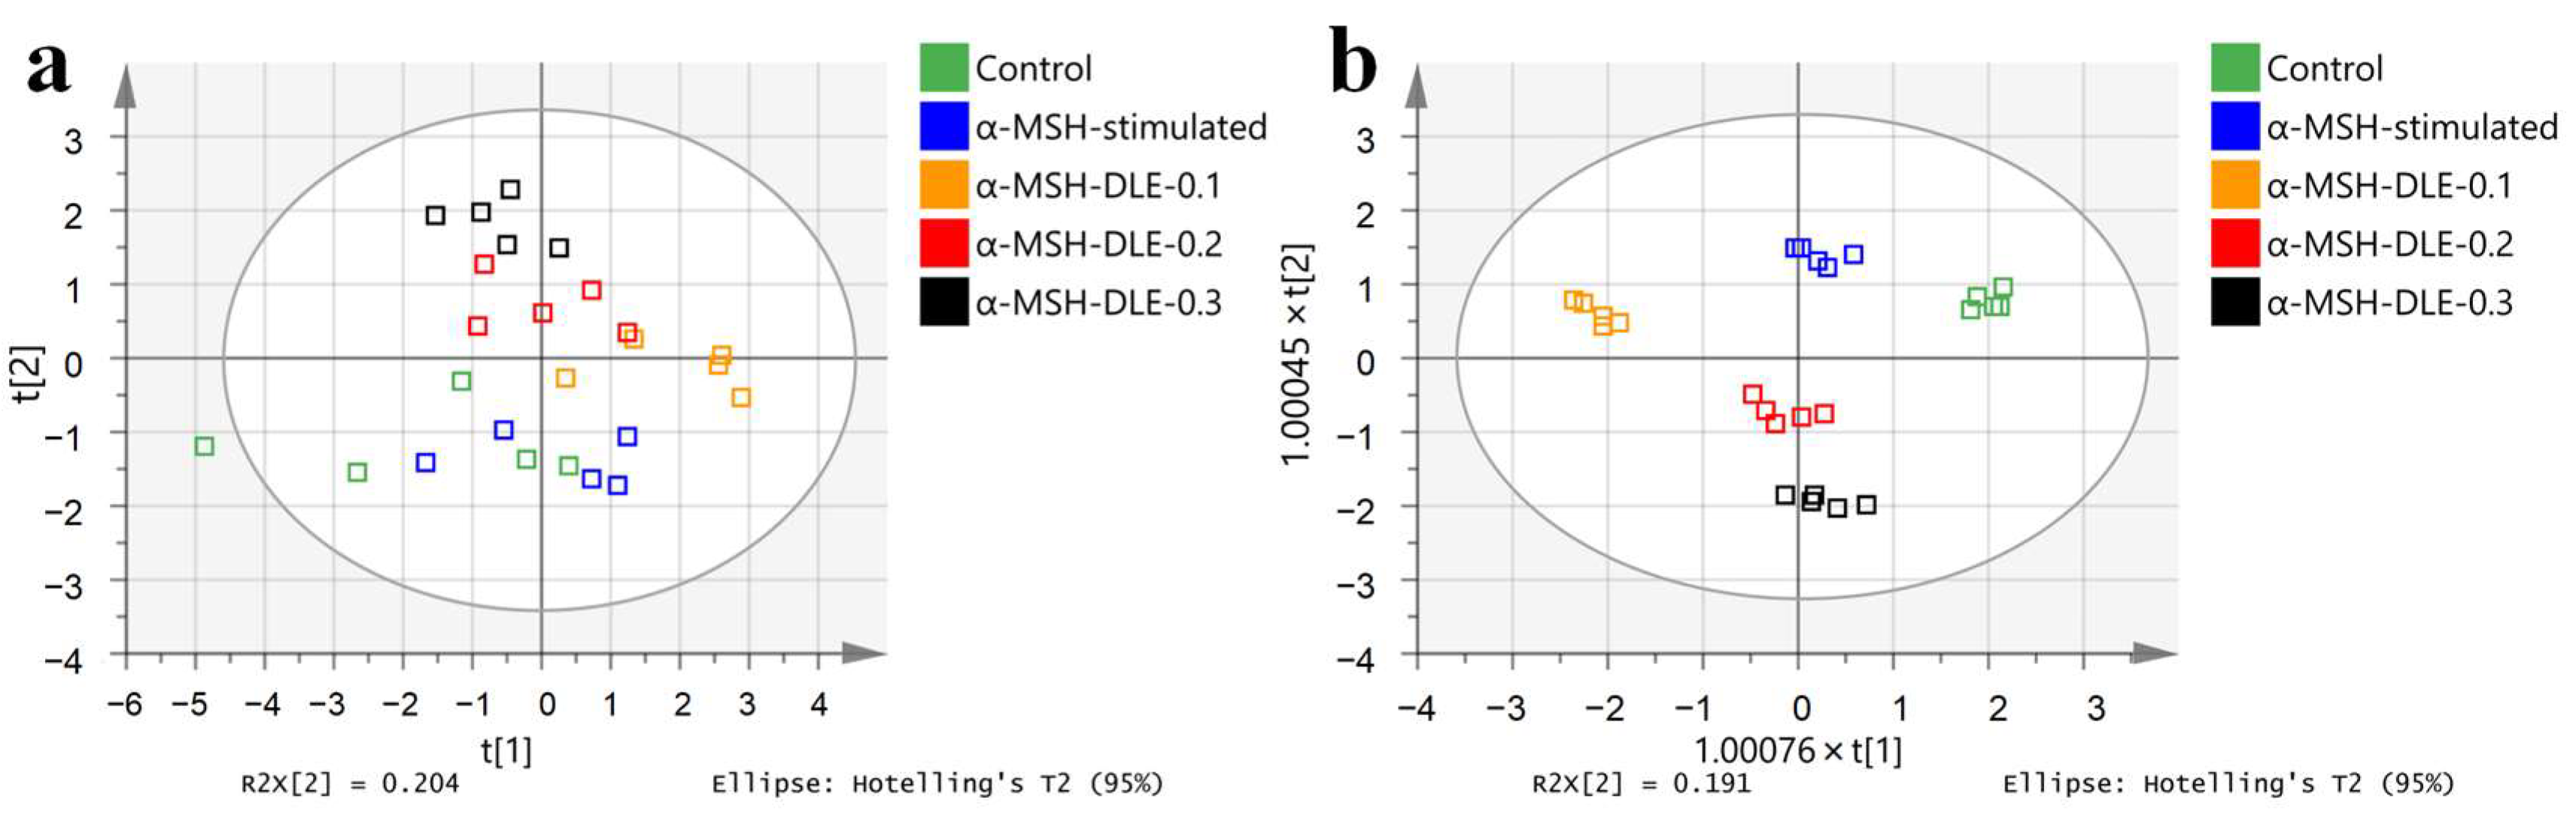
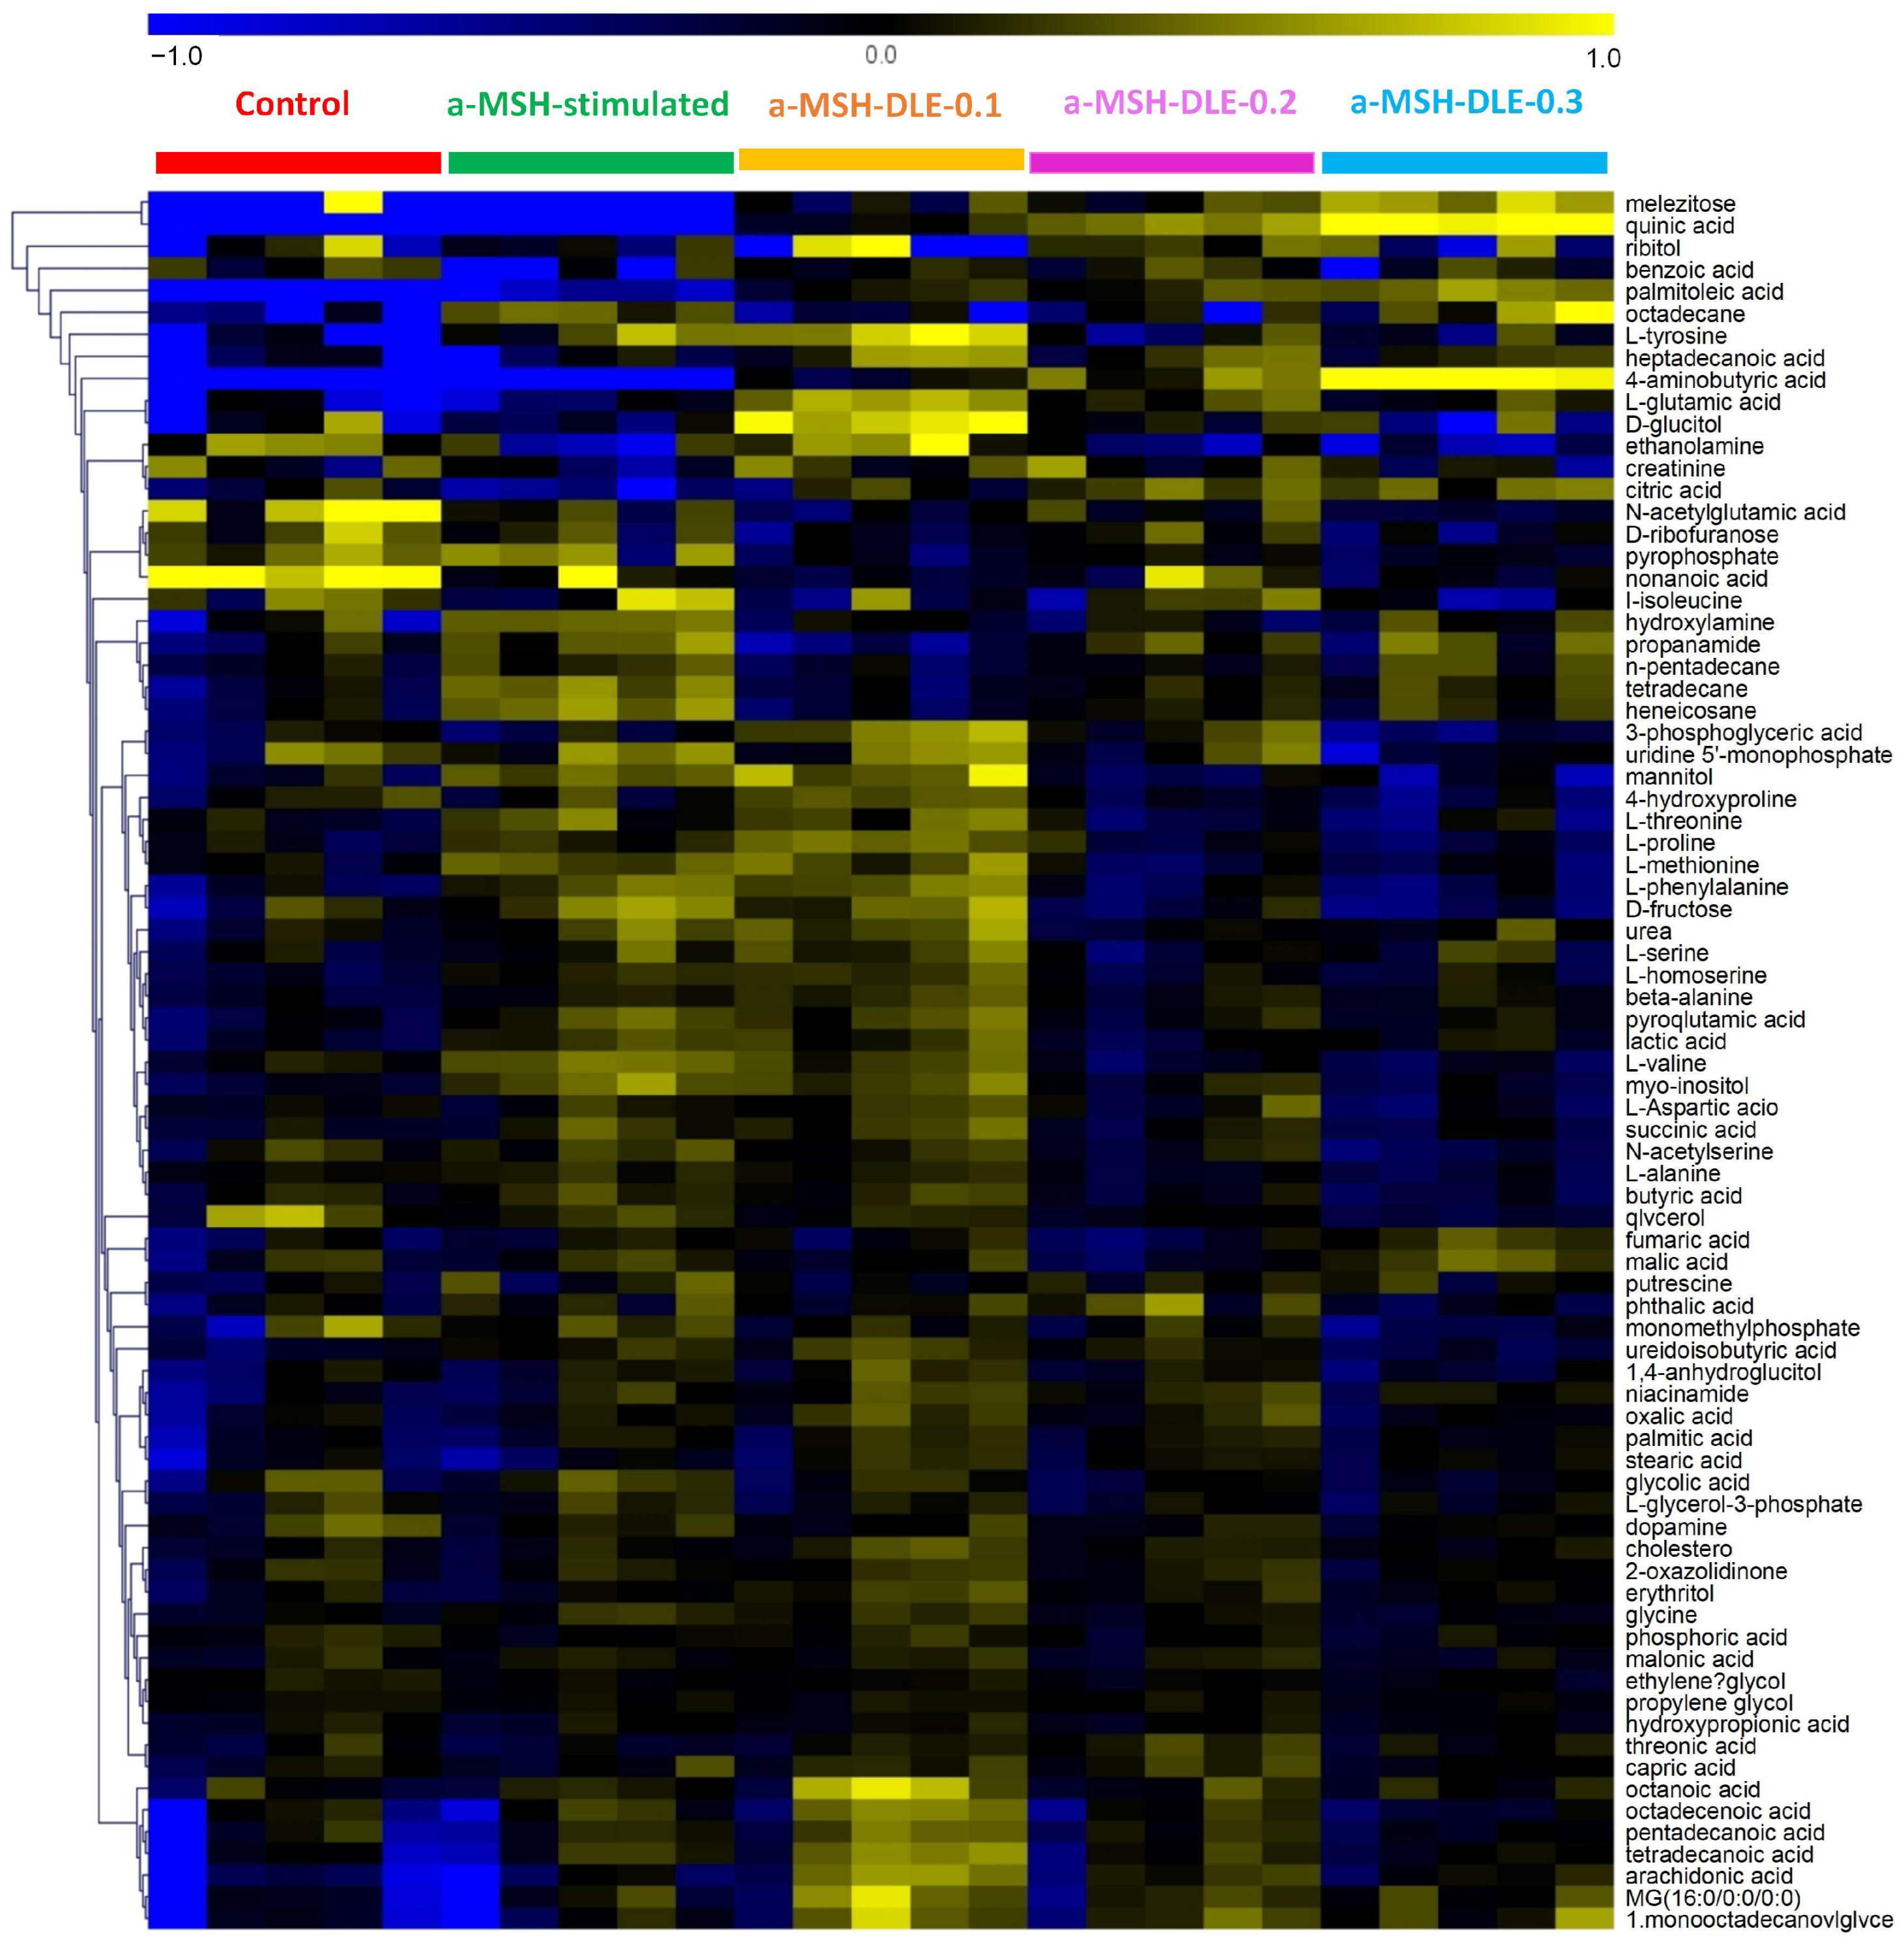
3.4. D. morbifera Extract Reversed the α-MSH-Stimulation-Induced Altered Metabolic Profile of B16-F10 Cells
3.5. Treatment of α-MSH-Stimulated B16-F10 Cells with D. morbifera Extract Showed Metabolic Differences Compared with the Control
4. Conclusions
Supplementary Materials
Author Contributions
Funding
Data Availability Statement
Conflicts of Interest
References
- Biyashev, D.; Siwicka, Z.E.; Onay, U.V.; Demczuk, M.; Xu, D.; Ernst, M.K.; Evans, S.T.; Nguyen, C.V.; Son, F.A.; Paul, N.K.; et al. Topical application of synthetic melanin promotes tissue repair. NPJ Regen. Med. 2023, 8, 61–74. [Google Scholar] [CrossRef]
- Díaz, D.F.Z.; Busch, L.; Kröger, M.; Klein, A.L.; Lohan, S.B.; Mewes, K.R.; Vierkotten, L.; Witzel, C.; Rohn, S.; Meinke, M.C. Significance of melanin distribution in the epidermis for the protective effect against UV light. Sci. Rep. 2024, 14, 3488. [Google Scholar] [CrossRef]
- Matoba, Y.; Kihara, S.; Bando, N.; Yoshitsu, H.; Sakaguchi, M.; Kayama, K.; Yanagisawa, S.; Ogura, T.; Sugiyama, M. Catalytic mechanism of the tyrosinase reaction toward the Tyr98 residue in the caddie protein. PLoS Biol. 2018, 16, e3000077–e3000098. [Google Scholar] [CrossRef]
- Zhao, Y.; Zhang, T.R.; Ning, Y.Z.; Wang, D.; Li, F.; Fan, Y.P.; Yao, J.Y.; Ren, G.Y.; Zhang, B. Identification and molecular mechanism of novel tyrosinase inhibitory peptides from the hydrolysate of ‘Fengdan’ peony (Paeonia ostii) seed meal proteins: Peptidomics and in silico analysis. LWT-Food Sci. Technol. 2023, 180, 114695–114704. [Google Scholar] [CrossRef]
- D’Mello, S.A.N.; Finlay, G.J.; Baguley, B.C.; Askarian-Amiri, M.E. Signaling pathways in melanogenesis. Int. J. Mol. Sci. 2016, 17, 1144. [Google Scholar] [CrossRef] [PubMed]
- Lee, S.E.; Park, S.H.; Oh, S.W.; Yoo, J.A.; Kwon, K.; Park, S.J.; Kim, J.; Lee, H.S.; Cho, J.Y.; Lee, J. Beauvericin inhibits melanogenesis by regulating cAMP/PKA/CREB and LXR-α/p38 MAPK-mediated pathways. Sci. Rep. 2018, 8, 14958–14969. [Google Scholar] [CrossRef] [PubMed]
- Bourhim, T.; Villareal, M.O.; Gadhi, C.; Isoda, H. Elucidation of melanogenesis-associated signaling pathways regulated by argan press cake in B16 melanoma cells. Nutrients 2021, 13, 2697. [Google Scholar] [CrossRef] [PubMed]
- Liu-Smith, F.; Meyskens, F.L. Molecular mechanisms of flavonoids in melanin synthesis and the potential for the prevention and treatment of melanoma. Mol. Nutr. Food Res. 2016, 60, 1264–1274. [Google Scholar] [CrossRef] [PubMed]
- Sattar, M.A.; Patnaik, A. Molecular insights into antioxidant efficiency of melanin: A sustainable antioxidant for natural rubber formulations. J. Phys. Chem. B 2023, 127, 8242–8256. [Google Scholar] [CrossRef] [PubMed]
- Lu, Y.; Xu, Y.; Song, M.T.; Qian, L.L.; Liu, X.L.; Gao, R.Y.; Han, R.M.; Skibsted, L.H.; Zhang, J.P. Promotion effects of flavonoids on browning induced by enzymatic oxidation of tyrosinase: Structure-activity relationship. RSC Adv. 2021, 11, 13769–13779. [Google Scholar] [CrossRef] [PubMed]
- Monmai, C.; Kim, J.S.; Chin, J.H.; Lee, S.H.Y.; Baek, S.H. Inhibitory effects of polyphenol- and flavonoid-enriched rice seed extract on melanogenesis in melan-a cells via MAPK signaling-mediated MITF downregulation. Int. J. Mol. Sci. 2023, 24, 11841. [Google Scholar] [CrossRef]
- Wang, Y.; Yu, J.; Chen, Y.K.; Wang, Z.C. Complete chloroplast genome sequence of the endemic and endangered plant Dendropanax oligodontus: Genome structure, comparative and phylogenetic analysis. Genes 2022, 13, 2028. [Google Scholar] [CrossRef] [PubMed]
- Hyun, T.K.; Ko, Y.-J.; Kim, E.-H.; Chung, I.-M.; Kim, J.-S. Anti-inflammatory activity and phenolic composition of Dendropanax morbifera leaf extracts. Ind. Crop. Prod. 2015, 74, 263–270. [Google Scholar] [CrossRef]
- Youn, J.S.; Kim, Y.-J.; Na, H.J.; Jung, H.R.; Song, C.K.; Kang, S.Y.; Kim, J.Y. Antioxidant activity and contents of leaf extracts obtained from Dendropanax morbifera LEV are dependent on the collecting season and extraction conditions. Food Sci. Biotechnol. 2019, 28, 201–207. [Google Scholar] [CrossRef] [PubMed]
- Zhang, M.; Bu, T.; Liu, S.; Kim, S. Optimization of caffeic acid extraction from Dendropanax morbifera leaves using response surface methodology and determination of polyphenols and antioxidant properties. Horticulturae 2021, 7, 491. [Google Scholar] [CrossRef]
- Lee, J.-Y.; Park, T.-H.; Park, S.-H.; Yang, S.-A.; Jhee, K.-H. The antimicrobial activity of fermented extracts from Korean Dendropanax morbifera. J. Life Sci. 2019, 29, 29–36. [Google Scholar]
- Moon, H.-I. Antidiabetic effects of dendropanoxide from leaves of Dendropanax morbifera Leveille in normal and streptozotocin-induced diabetic rats. Hum. Exp. Toxicol. 2011, 30, 870–875. [Google Scholar] [CrossRef] [PubMed]
- An, N.Y.; Kim, J.-E.; Hwang, D.; Ryu, H.K. Anti-diabetic effects of aqueous and ethanol extract of Dendropanax morbifera Leveille in streptozotocin-induced diabetes model. J. Nutr. Health 2014, 47, 394–402. [Google Scholar] [CrossRef]
- Wang, C.; Mathiyalagan, R.; Kim, Y.J.; Castro-Aceituno, V.; Singh, P.; Ahn, S.; Wang, D.; Yang, D.C. Rapid green synthesis of silver and gold nanoparticles using Dendropanax morbifera leaf extract and their anticancer activities. Int. J. Nanomed. 2016, 11, 3691. [Google Scholar]
- Bae, D.; Kim, J.; Lee, S.Y.; Choi, E.J.; Jung, M.A.; Jeong, C.S.; Na, J.R.; Kim, J.J.; Kim, S. Hepatoprotective effects of aqueous extracts from leaves of Dendropanax morbifera leveille against alcohol-induced hepatotoxicity in rats and in vitro anti-oxidant effects. Food Sci. Biotechnol. 2015, 24, 1495–1503. [Google Scholar] [CrossRef]
- Park, B.-Y.; Min, B.-S.; Oh, S.-R.; Kim, J.-H.; Kim, T.-J.; Kim, D.-H.; Bae, K.-H.; Lee, H.-K. Isolation and anticomplement activity of compounds from Dendropanax morbifera. J. Ethnopharmacol. 2004, 90, 403–408. [Google Scholar] [CrossRef] [PubMed]
- Lee, S.-H.; Lee, H.-S.; Park, Y.-S.; Hwang, B.; Kim, J.-H.; Lee, H.-Y. Screening of immune activation activities in the leaves of Dendropanax morbifera Lev. Korean J. Med. Crop Sci. 2002, 10, 109–115. [Google Scholar]
- Park, Y.J.; Kim, D.M.; Choi, H.B.; Jeong, M.H.; Kwon, S.H.; Kim, H.; Kwak, J.H.; Chung, K.H. Dendropanoxide, a triterpenoid from Dendropanax morbifera, ameliorates hepatic fibrosis by inhibiting activation of hepatic stellate cells through autophagy inhibition. Nutrients 2022, 14, 98. [Google Scholar] [CrossRef] [PubMed]
- Chung, I.M.; Kim, S.H.; Kwon, C.; Kim, S.Y.; Yang, Y.J.; Kim, J.S.; Ali, M.; Ahmad, A. New chemical constituents from the bark of Dendropanax morbifera Leveille and their evaluation of antioxidant activities. Molecules 2019, 24, 3967. [Google Scholar] [CrossRef] [PubMed]
- Lee, J.W.; Ryu, H.W.; Lee, S.U.; Son, T.H.; Park, H.A.; Kim, M.O.; Yuk, H.J.; Ahn, K.S.; Oh, S.R. Protective effect of polyacetylene from Dendropanax morbifera Leveille leaves on pulmonary inflammation induced by cigarette smoke and lipopolysaccharide. J. Funct. Foods 2017, 32, 358–366. [Google Scholar] [CrossRef]
- Kim, M.; Park, Y.J.; Lim, H.-S.; Lee, H.-H.; Kim, T.-H.; Lee, B. The clinical effects of Dendropanax morbifera on postmenopausal symptoms. J. Menopausal Med. 2017, 23, 146–155. [Google Scholar] [CrossRef]
- Yang, H.Y.; Kim, K.S.; Lee, Y.H.; Park, J.H.; Kim, J.H.; Lee, S.Y.; Kim, Y.M.; Kim, I.S.; Kacew, S.; Lee, B.M.; et al. Dendropanax morbifera ameliorates thioacetamide-induced hepatic fibrosis via TGF-β1/Smads pathways. Int. J. Biol. Sci. 2019, 15, 800–811. [Google Scholar] [CrossRef]
- Shin, D.-C.; Kim, G.-C.; Song, S.-Y.; Kim, H.-J.; Yang, J.-C.; Kim, B.-A. Antioxidant and antiaging activities of complex supercritical fluid extracts from Dendropanax morbifera, Corni fructus and Lycii fructus. Korea J. Herbol. 2013, 28, 95–100. [Google Scholar] [CrossRef]
- Hoang, H.T.; Park, J.S.; Kim, S.H.; Moon, J.Y.; Lee, Y.C. Microwave-assisted Dendropanax morbifera extract for cosmetic applications. Antioxidants 2022, 11, 998. [Google Scholar] [CrossRef]
- Lee, K.Y.; Jung, H.Y.; Yoo, D.Y.; Kim, W.; Kim, J.W.; Kwon, H.J.; Kim, D.W.; Yoon, Y.S.; Hwang, I.K.; Choi, J.H. Dendropanax morbifera Léveille extract ameliorates D-galactose-induced memory deficits by decreasing inflammatory responses in the hippocampus. Lab Anim. Res. 2017, 33, 283–290. [Google Scholar] [CrossRef]
- Choo, G.S.; Lim, D.P.; Kim, S.M.; Yoo, E.S.; Kim, S.H.; Kim, C.H.; Woo, J.S.; Kim, H.J.; Jung, J.Y. Anti-inflammatory effects of Dendropanax morbifera in lipopolysaccharide-stimulated RAW264.7 macrophages and in an animal model of atopic dermatitis. Mol. Med. Rep. 2019, 19, 2087–2096. [Google Scholar] [CrossRef]
- Chen, Y.; Wang, M.; Li, X. Positive significance of confucianism on moral construction of college counselors. Chin. Med. J. 2015, 517–519. [Google Scholar]
- Roshanak, S.; Rahimmalek, M.; Goli, S.A.H. Evaluation of seven different drying treatments in respect to total flavonoid, phenolic, vitamin C content, chlorophyll, antioxidant activity and color of green tea (Camellia sinensis or C. assamica leaves. J. Food Sci. Technol. 2016, 53, 721–729. [Google Scholar] [CrossRef]
- Masson, P.; Spagou, K.; Nicholson, J.K.; Want, E.J. Technical and biological Variation in UPLC−MS-based untargeted metabolic profiling of liver extracts: Application in an experimental toxicity study on galactosamine. Anal. Chem. 2011, 83, 1116–1123. [Google Scholar] [CrossRef]
- Davies, T. The new automated mass spectrometry deconvolution and identification system (AMDIS). Spectrosc. Eur. 1998, 10, 24–27. [Google Scholar]
- Styczynski, M.P.; Moxley, J.F.; Tong, L.V.; Walther, J.L.; Jensen, K.L.; Stephanopoulos, G.N. Systematic identification of conserved metabolites in GC/MS data for metabolomics and biomarker discovery. Anal. Chem. 2007, 79, 966–973. [Google Scholar] [CrossRef]
- Carvalho, T.G.C.; dos Santos, I.M.; Bedor, C.N.G.; de Alencar, E.B. Principal component analysis (PCA) and construction of a SIMCA classification model to monoterpenes and analogs with larvicidal activity in Aedes aegypti. Rev. Virtual Quim. 2019, 11, 411–424. [Google Scholar] [CrossRef]
- Agbo, M.; Uzor, P.; Akazie-Nneji, U.; Eze-Odurukwe, C.; Ogbatue, U.; Mbaoji, E. Antioxidant, total phenolic and flavonoid content of selected Nigerian medicinal plants. Dhaka Univ. J. Pharm. Sci. 2015, 14, 35–41. [Google Scholar] [CrossRef]
- Park, J.U.; Yang, S.Y.; Guo, R.H.; Li, H.X.; Kim, Y.H.; Kim, Y.R. Anti-melanogenic effect of Dendropanax morbiferus and its active components via protein kinase A/Cyclic adenosine monophosphate-responsive binding protein- and p38 mitogen-activated protein kinase-mediated microphthalmia−associated transcription factor downregulation. Front. Pharmacol. 2020, 11, 507–516. [Google Scholar] [CrossRef] [PubMed]
- Bu, T.; Zhang, M.; Lee, S.-H.; Cheong, Y.E.; Park, Y.; Kim, K.H.; Kim, D.; Kim, S. GC-TOF/MS-based metabolomics for comparison of volar and non-volar skin types. Metabolites 2022, 12, 717. [Google Scholar] [CrossRef] [PubMed]
- Ahmad, S.; Mohammed, M.; Mekala, L.P.; Chintalapati, S.; Chintalapati, V.R. Tryptophan, a non-canonical melanin precursor: New L-tryptophan based melanin production by Rubrivivax benzoatilyticus JA2. Sci. Rep. 2020, 10, 8925–8936. [Google Scholar] [CrossRef] [PubMed]
- Li, Y.; Xiang, H.; Xue, X.; Chen, Y.; He, Z.; Yu, Z.; Zhang, L.; Miao, X. Dual antimelanogenic effect of nicotinamide-stabilized phloretin nanocrystals in larval zebrafish. Pharmaceutics 2022, 14, 1825. [Google Scholar] [CrossRef] [PubMed]
- Marzabani, R.; Rezadoost, H.; Choopanian, P.; Kolahdooz, S.; Mozafari, N.; Mirzaie, M.; Karimi, M.; Nieminen, A.I.; Jafari, M. Metabolomic signature of amino acids in plasma of patients with non-segmental Vitiligo. Metabolomics 2021, 17, 92–102. [Google Scholar] [CrossRef] [PubMed]
- Jeon, G.; Kim, C.; Cho, U.M.; Hwang, E.T.; Hwang, H.S.; Min, J. Melanin-decolorizing activity of antioxidant enzymes, glutathione peroxidase, thiol peroxidase, and catalase. Mol. Biotechnol. 2021, 63, 150–155. [Google Scholar] [CrossRef]
- Boo, Y.C. Metabolic basis and clinical evidence for skin lightening effects of thiol compounds. Antioxidants 2022, 11, 503. [Google Scholar] [CrossRef]
- Lu, S.C. Glutathione synthesis. Biochim. Biophys. Acta 2013, 1830, 3143–3153. [Google Scholar] [CrossRef]
- Flam, B.R.; Eichler, D.C.; Solomonson, L.P. Endothelial nitric oxide production is tightly coupled to the citrulline-NO cycle. Nitric Oxide-Biol. Chem. 2007, 17, 115–121. [Google Scholar] [CrossRef]
- Marek, L.; Tam, I.; Kurkiewicz, S.; Dzierzega-Lecznar, A. The pigmentation phenotype of melanocytes affects their response to nitric oxide in vitro. Postepy Dermatol. Alergol. 2023, 40, 150–158. [Google Scholar] [CrossRef]


| Sample | Dendropanax morbifera Leveille Extract |
|---|---|
| Total phenolic content (mg GAE g−1) | 95.20 ± 3.15 |
| Total flavonoid content (mg QE g−1) | 79.75 ± 3.47 |
| No. | Metabolites | p-Value | VIP Score | No. | Metabolites | p-Value | VIP Score |
|---|---|---|---|---|---|---|---|
| 1 | L-Valine | p < 0.001 | 1.440 | 16 | propanamide | 0.009 | 1.219 |
| 2 | heneicosane | p < 0.001 | 1.419 | 17 | L-proline | 0.010 | 1.195 |
| 3 | L-homoserine | p < 0.001 | 1.425 | 18 | glycine | 0.014 | 1.196 |
| 4 | tetradecane | p < 0.001 | 1.391 | 19 | citric acid | 0.014 | 1.142 |
| 5 | L-methionine | p < 0.001 | 1.378 | 20 | L-alanine | 0.020 | 1.130 |
| 6 | lactic acid | p < 0.001 | 1.398 | 21 | ethanolamine | 0.021 | 1.075 |
| 7 | ureidoisobutyric acid | 0.001 | 1.319 | 22 | nonanoic acid | 0.021 | 1.124 |
| 8 | L-phenylalanine | 0.002 | 1.349 | 23 | N-acetylglutamic acid | 0.023 | 1.193 |
| 9 | myo-inositol | 0.002 | 1.419 | 24 | hydroxylamine | 0.024 | 1.129 |
| 10 | mannitol | 0.002 | 1.342 | 25 | D-fructose | 0.025 | 1.125 |
| 11 | pyroglutamic acid | 0.003 | 1.323 | 26 | L-threonine | 0.032 | 1.080 |
| 12 | β-alanine | 0.005 | 1.277 | 27 | urea | 0.033 | 1.103 |
| 13 | octadecane | 0.007 | 1.305 | 28 | ethylene glycol | 0.041 | 1.025 |
| 14 | L-tyrosine | 0.007 | 1.371 | 29 | succinic acid | 0.046 | 1.040 |
| 15 | n-pentadecane | 0.008 | 1.212 |
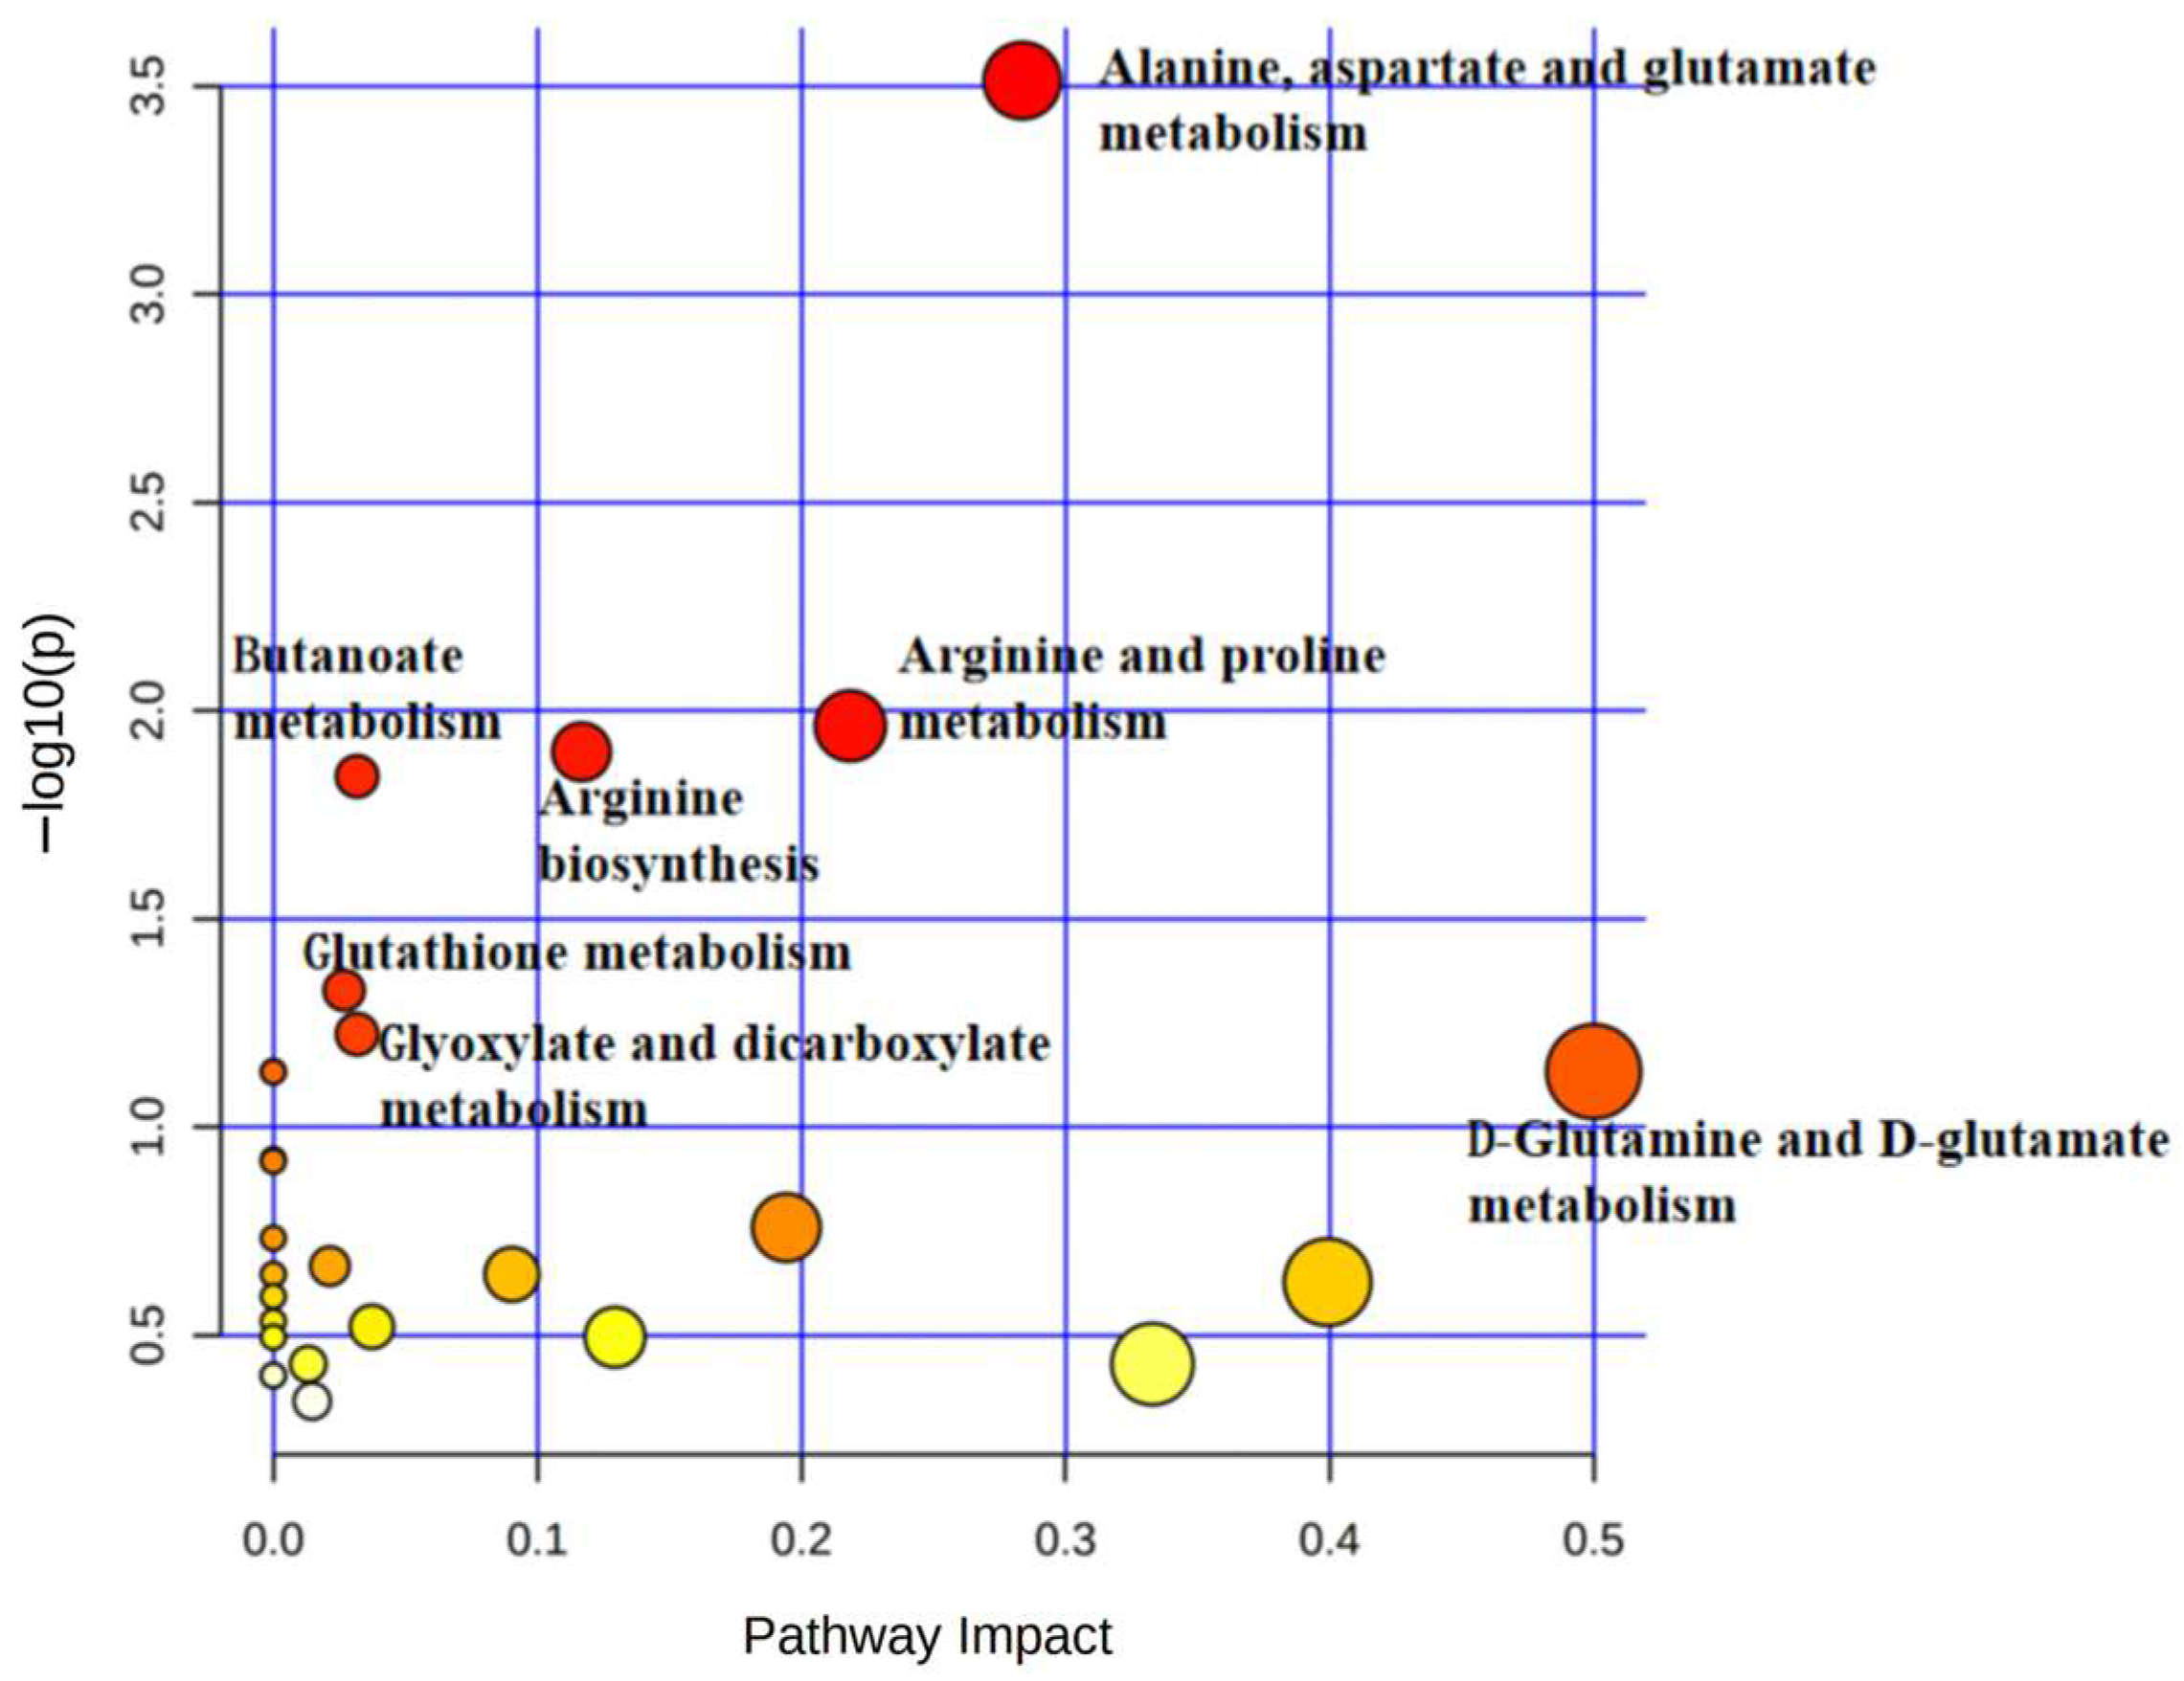
| Pathway Name | −Log (p) | Impact |
|---|---|---|
| Phenylalanine, tyrosine, and tryptophan biosynthesis | 2.8812 | 1 |
| Phenylalanine metabolism | 1.8722 | 0.35714 |
| Pantothenate and CoA biosynthesis | 1.4869 | 0.02143 |
| Citrate cycle (TCA cycle) | 1.4451 | 0.12311 |
| Glutathione metabolism | 1.1784 | 0.09582 |
| Glyoxylate and dicarboxylate metabolism | 1.0763 | 0.13757 |
| Glycine, serine, and threonine metabolism | 1.0308 | 0.29525 |
| Metabolites | Control | α-MSH-Stimulated | α-MSH-DLE-0.1 | α-MSH-DLE-0.2 | α-MSH-DLE-0.3 |
|---|---|---|---|---|---|
| Metabolites upregulated by α-MSH stimulation | |||||
| octadecane | 1.000 ± 0.930 | 2.650 ± 0.250 ** | 1.440 ± 0.860 | 1.690 ± 1.000 | 1.300 ± 8.610 |
| hydroxylamine | 1.000 ± 0.380 | 1.480 ± 0.050 * | 1.050 ± 0.120 | 1.010 ± 0.190 | 1.170 ± 0.200 |
| L-phenylalanine | 1.000 ± 0.170 | 1.470 ± 0.190 ** | 1.550 ± 0.150 ** | 1.080 ± 0.160 | 0.950 ± 0.140 |
| mannitol | 1.000 ± 0.190 | 1.430 ± 0.080 ** | 1.650 ± 0.370 ** | 0.970 ± 0.120 | 0.920 ± 0.220 |
| D-fructose | 1.000 ± 0.270 | 1.380 ± 0.250 * | 1.350 ± 0.240 * | 0.940 ± 0.160 | 0.800 ± 0.090 |
| propanamide | 1.000 ± 0.210 | 1.380 ± 0.210 ** | 0.800 ± 0.120 | 1.220 ± 0.160 | 1.230 ± 0.330 |
| pyroglutamic acid | 1.000 ± 0.130 | 1.360 ± 0.170 ** | 1.380 ± 0.170 ** | 1.140 ± 0.140 | 1.120 ± 0.090 |
| lactic acid | 1.000 ± 0.110 | 1.330 ± 0.100 ** | 1.340 ± 0.170 ** | 1.060 ± 0.110 | 1.150 ± 0.100 * |
| L-Valine | 1.000 ± 0.090 | 1.310 ± 0.080 ** | 1.200 ± 0.120 ** | 0.900 ± 0.090 | 0.850 ± 0.080 * |
| L-methionine | 1.000 ± 0.100 | 1.300 ± 0.090 ** | 1.340 ± 0.190 ** | 0.920 ± 0.130 | 0.900 ± 0.110 |
| urea | 1.000 ± 0.160 | 1.260 ± 0.220 ** | 1.390 ± 0.200 ** | 1.010 ± 0.090 | 1.120 ± 0.160 |
| L-homoserine | 1.000 ± 0.070 | 1.260 ± 0.080 ** | 1.360 ± 0.110 ** | 1.090 ± 0.120 | 1.080 ± 0.150 |
| L-threonine | 1.000 ± 0.110 | 1.240 ± 0.210 * | 1.310 ± 0.180 ** | 0.940 ± 0.130 | 0.890 ± 0.200 |
| n-pentadecane | 1.000 ± 0.120 | 1.240 ± 0.120 ** | 0.930 ± 0.120 | 1.070 ± 0.070 | 1.170 ± 0.220 |
| L-proline | 1.000 ± 0.120 | 1.190 ± 0.070 * | 1.440 ± 0.070 ** | 1.040 ± 0.140 | 0.890 ± 0.100 |
| succinic acid | 1.000 ± 0.100 | 1.180 ± 0.180 * | 1.260 ± 0.150 ** | 1.060 ± 0.130 | 0.960 ± 0.110 |
| glycine | 1.000 ± 0.060 | 1.140 ± 0.090 * | 1.160 ± 0.080 ** | 1.040 ± 0.070 | 0.980 ± 0.050 |
| palmitoleic acid | 1.000 ± 1.390 | 4.140 ± 0.780 ** | 7.340 ± 0.780 ** | 8.000 ± 0.990 ** | 9.700 ± 0.880 ** |
| L-tyrosine | 1.000 ± 1.010 | 2.740 ± 0.680 ** | 3.700 ± 0.620 ** | 2.100 ± 0.540 * | 2.060 ± 0.450 * |
| heneicosane | 1.000 ± 0.160 | 1.570 ± 0.150 ** | 0.970 ± 0.110 | 1.170 ± 0.070 * | 1.210 ± 0.180 * |
| tetradecane | 1.000 ± 0.180 | 1.560 ± 0.150 ** | 1.000 ± 0.120 | 1.190 ± 0.100 * | 1.270 ± 0.160 * |
| myo-inositol | 1.000 ± 0.080 | 1.460 ± 0.190 ** | 1.400 ± 0.150 ** | 1.140 ± 0.140 * | 0.980 ± 0.090 * |
| ureidoisobutyric acid | 1.000 ± 0.090 | 1.230 ± 0.080 ** | 1.300 ± 0.140 ** | 1.210 ± 0.070 ** | 0.970 ± 0.060 |
| β-alanine | 1.000 ± 0.080 | 1.160 ± 0.070 ** | 1.320 ± 0.100 ** | 1.130 ± 0.110 * | 1.110 ± 0.090 * |
| L-alanine | 1.000 ± 0.040 | 1.080 ± 0.060 * | 1.060 ± 0.050 * | 0.920 ± 0.060 * | 0.850 ± 0.070 ** |
| Metabolites downregulated by α-MSH stimulation | |||||
| ethylene glycol | 1.000 ± 0.040 | 0.950 ± 0.030 * | 0.980 ± 0.040 | 0.940 ± 0.040 * | 0.910 ± 0.050 ** |
| citric acid | 1.000 ± 0.210 | 0.690 ± 0.150 * | 1.040 ± 0.220 | 1.320 ± 0.150 ** | 1.340 ± 0.190 ** |
| ethanolamine | 1.000 ± 0.210 | 0.640 ± 0.250 * | 1.110 ± 0.310 | 0.630 ± 0.140 ** | 0.530 ± 0.120 ** |
| nonanoic acid | 1.000 ± 0.270 | 0.580 ± 0.280 * | 0.400 ± 0.030 ** | 0.550 ± 0.190 ** | 0.410 ± 0.050 ** |
| N-acetylglutamic acid | 1.000 ± 0.340 | 0.580 ± 0.090 * | 0.470 ± 0.070 * | 0.580 ± 0.100 * | 0.470 ± 0.020 * |
| benzoic acid | 1.000 ± 0.150 | 0.400 ± 0.550 * | 0.940 ± 0.070 | 0.980 ± 0.140 | 0.760 ± 0.440 |
| No. | Metabolites | p-Value | VIP Score | No. | Metabolites | p-Value | VIP Score |
|---|---|---|---|---|---|---|---|
| Metabolites upregulated by α-MSH-DLE-0.2 | |||||||
| 1 | palmitoleic acid | p < 0.001 | 1.193 | 11 | phthalic acid | 0.026 | 1.138 |
| 2 | 4-aminobutyric acid | p < 0.001 | 1.675 | 12 | β-alanine | 0.035 | 1.124 |
| 3 | ureidoisobutyric acid | 0.002 | 1.422 | 13 | tetradecane | 0.038 | 1.153 |
| 4 | niacinamide | 0.006 | 1.367 | 14 | putrescine | 0.038 | 1.121 |
| 5 | arachidonic acid | 0.011 | 1.244 | 15 | heneicosane | 0.039 | 1.166 |
| 6 | citric acid | 0.012 | 1.283 | 16 | MG (16:0/0:0/0:0) | 0.041 | 1.119 |
| 7 | L-glutamic acid | 0.014 | 1.246 | 17 | myo-inositol | 0.042 | 1.139 |
| 8 | heptadecanoic acid | 0.022 | 1.529 | 18 | palmitic acid | 0.045 | 1.131 |
| 9 | L-alanine | 0.025 | 1.208 | 19 | threonic acid | 0.046 | 1.122 |
| 10 | 1-monooctadecanoylglycerol | 0.025 | 1.183 | 20 | oxalic acid | 0.047 | 1.145 |
| Metabolites downregulated by α-MSH-DLE-0.2 | |||||||
| 21 | ethanolamine | 0.007 | 1.352 | 24 | N-acetylglutamic acid | 0.024 | 1.275 |
| 22 | nonanoic acid | 0.008 | 1.338 | 25 | ethylene glycol | 0.030 | 1.165 |
| 23 | pyrophosphate | 0.014 | 1.391 | ||||
Disclaimer/Publisher’s Note: The statements, opinions and data contained in all publications are solely those of the individual author(s) and contributor(s) and not of MDPI and/or the editor(s). MDPI and/or the editor(s) disclaim responsibility for any injury to people or property resulting from any ideas, methods, instructions or products referred to in the content. |
© 2024 by the authors. Licensee MDPI, Basel, Switzerland. This article is an open access article distributed under the terms and conditions of the Creative Commons Attribution (CC BY) license (https://creativecommons.org/licenses/by/4.0/).
Share and Cite
Bu, T.; Kim, D.; Kim, S. Dendropanax morbifera Leveille Extract-Induced Alteration of Metabolic Profile in Whitening Effects. Horticulturae 2024, 10, 219. https://doi.org/10.3390/horticulturae10030219
Bu T, Kim D, Kim S. Dendropanax morbifera Leveille Extract-Induced Alteration of Metabolic Profile in Whitening Effects. Horticulturae. 2024; 10(3):219. https://doi.org/10.3390/horticulturae10030219
Chicago/Turabian StyleBu, Ting, Dongwon Kim, and Sooah Kim. 2024. "Dendropanax morbifera Leveille Extract-Induced Alteration of Metabolic Profile in Whitening Effects" Horticulturae 10, no. 3: 219. https://doi.org/10.3390/horticulturae10030219