Article

Enhancing the Yield of Mature Olive Trees via Comparative Fertilization Strategies, including a Foliar Application with Fulvic and Humic Acids, in Non-Irrigated Orchards with Calcareous and Non-Calcareous Soils

by
Stavros Sotiropoulos
1,*,
Christos Chatzissavvidis
2,
Ioannis E. Papadakis
3,
Victor Kavvadias
4,
Christos Paschalidis
1,
Chrysovalantou Antonopoulou
2 and
Sotirios Kiriakopoulos
1
1
School of Agriculture and Food, University of Peloponnese, Antikalamos, 24100 Kalamata, Greece
2
Laboratory of Pomology, Vegetable Crops and Floriculture, Department of Agricultural Development, Democritus University of Thrace, Pantazidou 193, 68200 Orestiada, Greece
3
Laboratory of Pomology, Department of Crop Science, Agricultural University of Athens, Iera Odos 75, 11855 Athens, Greece
4
Institute of Soil and Water Resources, Department of Soil Science, Hellenic Agricultural Organization (ELGO) ‘DIMITRA’, Lycovrisi, 14123 Athens, Greece
*
Author to whom correspondence should be addressed.
Horticulturae 2024, 10(2), 167; https://doi.org/10.3390/horticulturae10020167
Submission received: 29 December 2023 / Revised: 2 February 2024 / Accepted: 8 February 2024 / Published: 12 February 2024
(This article belongs to the Section Fruit Production Systems)

Abstract

:
This study investigated the impact of fertilization treatments on mature, forty-year-old, fully productive olive trees (Olea europaea L. cv. Koroneiki) in two non-irrigated orchards featuring contrasting soil types: non-calcareous–acidic and calcareous–alkaline. Over three years (2019–2021), seven distinct treatments were applied, involving inorganic soil fertilizers (traditional strategy) and foliar applications of a liquid organic product containing fulvic and humic acids. Fertilization significantly influenced physiological parameters, such as mineral nutrition, photosynthetic pigments of olive leaves, fruit yield, and oil production per tree, revealing noteworthy effects influenced by soil types and their interactions with treatments. Statistical analysis highlighted specific treatments, indicating that the foliar application of the organic product once a year in alkaline soil or biannually in acidic soil resulted in the highest observed fruit yield and oil production per tree. Indeed, contrary to the control–unfertilized trees, specific fertilization strategies resulted in an average increase of up to 47% and 73% in fruit yield per tree and up to 96% and 100% in oil production per tree in acidic and alkaline soil, respectively. Furthermore, consistently high yields were correlated with constant high values of the chlorophyll a/chlorophyll b ratio (2.3–3.3 in August for acidic soil) and leaf chlorophyll a concentration (55–66 mg/100 g f.w. in August for alkaline soil). This novel finding underscores the crucial role of these factors as prerequisites for achieving superior fruit production. Our results emphasize the potential of integrating foliar organic fertilization as a complementary strategy to traditional soil-based approaches. This is particularly relevant under non-irrigated/rainfed cultural conditions, emphasizing the significance of considering alternative fertilization practices for optimized olive orchard management.

1. Introduction

One of the most crucial factors for producing olive oil and fruits is the fertilization of olive trees. Derived from natural substances, such as compost, manure, and other organic residues, organic fertilizers enhance soil fertility by providing vital nutrients and promoting microbial activity, thereby supporting sustainable soil health in the long term. Conversely, industrially synthesized, inorganic fertilizers deliver nutrients quickly and precisely; however, their improper application can pose risks of soil degradation and environmental harm. This underscores the importance of adopting balanced and informed fertilization practices in agriculture. Each fertilizer type therefore has strengths and weaknesses. The selection of organic or inorganic fertilizers is contingent upon various criteria, including, but not limited to, soil composition, crop needs, crop phenological phase, climate conditions, and other ecological concerns.
Like any other plant, olive trees remove a remarkable amount of nutrients from the soil, used both for vegetation and fruiting. These quantities need to be replenished via fertilization, the cost of which is high. Organic fertilizers help plants reach their full potential for productivity and quality, and currently, they are considered essential in light of climate change [1,2], as well as in the frame of organic and sustainable agriculture, with a primary goal of reducing excessive use of inorganic fertilizers, preserving the environment, and lowering production costs for farmers [3]. In fact, the application of organic fertilizers attempts to increase plant tolerance to stress conditions, improve mineral consumption, and lower input costs for growing. Increased yield, total antioxidants, phenols, sugars, and oil content have been recorded in olive trees when organic foliar fertilizers, including amino acids, humic acids, and antioxidants, were applied [4,5,6].
According to several investigations [7,8,9], olive trees that received foliar sprays exhibited an increase in production due to improved blooming, fruit set, fruit quality, and biochemical parameters [7,8,9]. When applied topically, seaweed extracts (SWEs) with growth regulators also boosted olive yield and oil content, enhanced oil quality, and hastened fruit ripening [10]. Related studies [1] involving the foliar or soil administration of leonardite extract preparations to young or adult olive trees are also interesting. Foliar spraying of nutrients is highly efficient, especially in nutrient-fixing soils or in dry areas with a lack of water, where the absorption of soil nutrients is drastically depressed [11]. Moreover, according to Mengel [12], this method has the advantage of uniform distribution, low application rates, and quick plant responses to applied nutrients. Even though, in recent years, great emphasis has been placed on the foliar nutrition of trees, tests with organic products have mainly been carried out with soil applications, while the published data from experiments with foliar applications are very limited and insufficient.
Despite the wealth of knowledge on olive tree fertilization, a significant research gap exists in understanding the comparative efficacy of organic foliar fertilization, particularly in non-irrigated olive orchards with distinct soil types. The current body of literature lacks comprehensive investigations that specifically evaluate the impact of organic foliar applications when combined with conventional soil fertilization practices. Additionally, the available studies often lack in-depth assessments of the phytochemical status, including mineral nutrition and leaf pigmentation, in response to such integrated fertilization strategies. This 3-year study addresses this gap, undertaking a detailed exploration in non-irrigated orchards, aiming to provide valuable insights into the efficiency of foliar organic fertilization and its potential synergies with soil fertilization in enhancing fruit yield and oil production. In other words, this 3-year study was undertaken in two distinct non-irrigated olive (Olea europaea L. cv. Koroneiki) orchards, characterized by non-calcareous–acidic and calcareous–alkaline soils, respectively. The primary focus of this investigation was to assess and compare the efficiency of foliar organic fertilization, in addition to soil fertilization, concerning the enhancement of fruit yield, oil production, mineral nutrition, and leaf pigmentation in olive trees. The central objective of this study was to evaluate the impact of applying a foliar organic product containing fulvic and humic acids on various aspects, including olive fruit and oil production, as well as the phytochemical status reflected in the leaves. The study specifically aimed to uncover any potential benefits or alterations brought about by this organic foliar application when combined with conventional soil fertilization practices.

2. Materials and Methods

2.1. Experimental Location and Plan

Two non-irrigated olive orchards located in Messinia (Peloponnese, Greece) were used for the investigation, one with non-calcareous–acidic (AC) soil and the other with calcareous–alkaline (AL) soil. The olive (Olea europaea L. cv. Koroneiki) trees selected for the study were self-rooted and forty years old, of similar yield potential (approximately 50 kg fruit per tree, based on the expected yield in 2018) and tree size (trunk and crown diameter approximately 35 cm and 4 m, respectively). The olive orchard in non-calcareous (acidic; AC) soil had a planting density of 8 m × 8.5 m at longitude E 21°54′47.022″, latitude N 37°02′20.283″, and an altitude of 152 m. The second studied olive orchard (E 21°54′27.110″, N 37°02′10.963″, altitude 178 m) in limestone–alkaline (AL) soil had a planting density of 6 m × 7 m.
Olive trees received inorganic fertilizers applied through the soil and/or a liquid organic product containing fulvic and humic acids, which was applied foliarly. The experiment conducted over the years 2019, 2020, and 2021 included seven fertilizer treatments applied to either the soil or foliage, as detailed below:
  • Treatments AC1 and AL1: no fertilizer application (control);
  • Treatments AC2 and AL2: nitrogen (N) application at a rate of 0.8 kg N per tree;
  • Treatments AC3 and AL3: N application and foliar application of organic product (0.5%, v/v) at the petal fall stage (PFS);
  • Treatments AC4 and AL4: N application and foliar applications of organic product (0.5%, v/v) at the PFS and after 20 days;
  • Treatments AC5 and AL5: Ν application and foliar applications of organic product at the PFS, and repeated after 20 and 40 days;
  • Treatments AC6 and AL6: N and potassium (K) application at a rate of 0.5 kg K2O per tree;
  • Treatments AC7 and AL7: N and K application at a rate of 1 kg K2O per tree.
In all treatments apart from the control, a dose of 0.8 kg N per tree was applied as granular fertilizer type 26-0-0 (calcareous nitric ammonium) for non-calcareous–acidic (AC) soil; type 21-0-0 (ammonium sulfate) for alkaline (AL) soil; and type 0-0-50 (potassium sulfate) for both types of soil in AC6, AL6, AC7, and AL7 treatments, in the second half of January of each year of the study (2019–2021). The organic product contained the following: humic and fulvic acids 26%, organic carbon 10.5%, N 0.1%, P2O5 0.06%, K2O 5.0%, CaO 0.05%, MgO 0.03%, Si 0.13%, and trace elements (Fe 0.45%, Mn 1 ppm, Cu 1 ppm, Zn 1 ppm, B 1 ppm, and Mo 0.40 ppm). The selection of specific dates for the three foliar applications was guided by a combination of factors. Firstly, we adhered to the recommendations outlined on the product label, which provided guidelines on optimal application timing. Additionally, we strategically timed the foliar applications to coincide with critical stages in the olive tree’s growth cycle. The application at the petal leaf stage aimed to support the tree during the period of fruit set. The subsequent applications at 20 and 40 days after the PFS were chosen to correspond with key developmental phases (cell division). By varying the timing and number of applications, the aim was to assess how these factors influenced nutrient uptake, physiological processes, and overall productivity, thus providing valuable insights into the optimization of fertilization strategies for enhanced olive orchard management.

2.2. Laboratory Soil and Plant Analyses

At the beginning of the study, soil samples were taken in December 2018 from each orchard to determine their physicochemical characteristics before any fertilization treatments were applied. Samples of 80 mature and healthy leaves per tree were also collected from the middle part of non-bearing current season shoots on 1 August and 10 December in the years 2019, 2020, and 2021. Some leaves of the same sample were randomly selected and used for the foliar diagnostic analysis, and others for the determination of pigments concentration.
The soil texture was determined by the Bouyoucos [13] method. The pH and the electrical conductivity (EC) were measured in paste extract using a pH/EC meter equipped with a glass electrode. The total CaCO3 was determined by the Bernard method, the organic matter was determined by the Walkey–Black method, the cation exchange capacity (CEC) was determined by the CH3COONH4 method, the total N was determined by the Kjeldahl method, and available P was determined by the Olsen method [13,14,15,16,17]. Exchangeable K, Ca, and Mg were determined after extraction by adding ammonium acetate to the substrate, shaking the mixture, and then centrifugation. The K, Ca, and Mg concentrations were determined using atomic absorption spectrophotometry (AAS) [14,15,17]. Available soil B content was extracted with 0.02 M hot CaCl2 solution and was estimated spectrophotometrically by the azomethine-H procedure [14,15,17,18,19].
Leaf mineral analysis was performed according to internationally accepted methods. The leaf samples, after being washed with distilled water and 0.001% HCl, were then dried at 70 °C, ground, and finally ashed at 500 °C for 10–12 h [20]. Their ash was diluted in a solution of 1:1 v/v HCl/H2O. Leaf samples were analyzed for total N, P, K, Ca, Mg, and B. Total N was determined by the Kjeldahl method; P was determined by the vanadomolybdophosphoric yellow color method; total K, Ca, and Mg via atomic absorption spectrophotometry (AAS); and B by the azomethine-H method [17,21,22,23,24].
Olive production was determined after harvesting the olive fruits on 20 December in each year of experimentation. The olive oil was extracted in the laboratory using a blender (Moulinex), which crushed the olives and kneaded them into a paste. The kneading of the olive dough, which lasted 30 min, was carried out without adding water. The olive oil was then separated from the olive paste by centrifugation at 11.200 rpm (revolutions per minute) (Hettich Universal 320). The oil content was calculated by dividing the amount of olive oil produced by the corresponding amount of olive fruit.
In regard to leaf chlorophyll (chl) and carotenoids, some of the sample leaves (randomly selected, while the rest were used for leaf diagnostic analysis) were ground with a 100% acetone solution until discoloration occurred, and then their pigment concentrations were determined spectrophotometrically [25,26].

2.3. Experimental Design and Statistical Analysis

The experimental layout was a randomized block design with seven fertilizer treatments, two soil types, and four trees (replicates) per treatment (i.e., the total number of experimental trees was 56). It is important to note that the same experimental trees were utilized consistently across all years of the study, maintaining consistency in treatment application and data collection for meaningful observations and analysis. The data were subjected to analysis of variance (ANOVA) using the SPSS 23.0 statistical package for Windows. For a comparison of means between fertilizer treatments within the same soil type (AC or AL), the Duncan multiple range test for p ≤ 0.05 was used. A two-way analysis was also conducted to reveal potential interactions between years, soil types, and/or fertilization treatments.

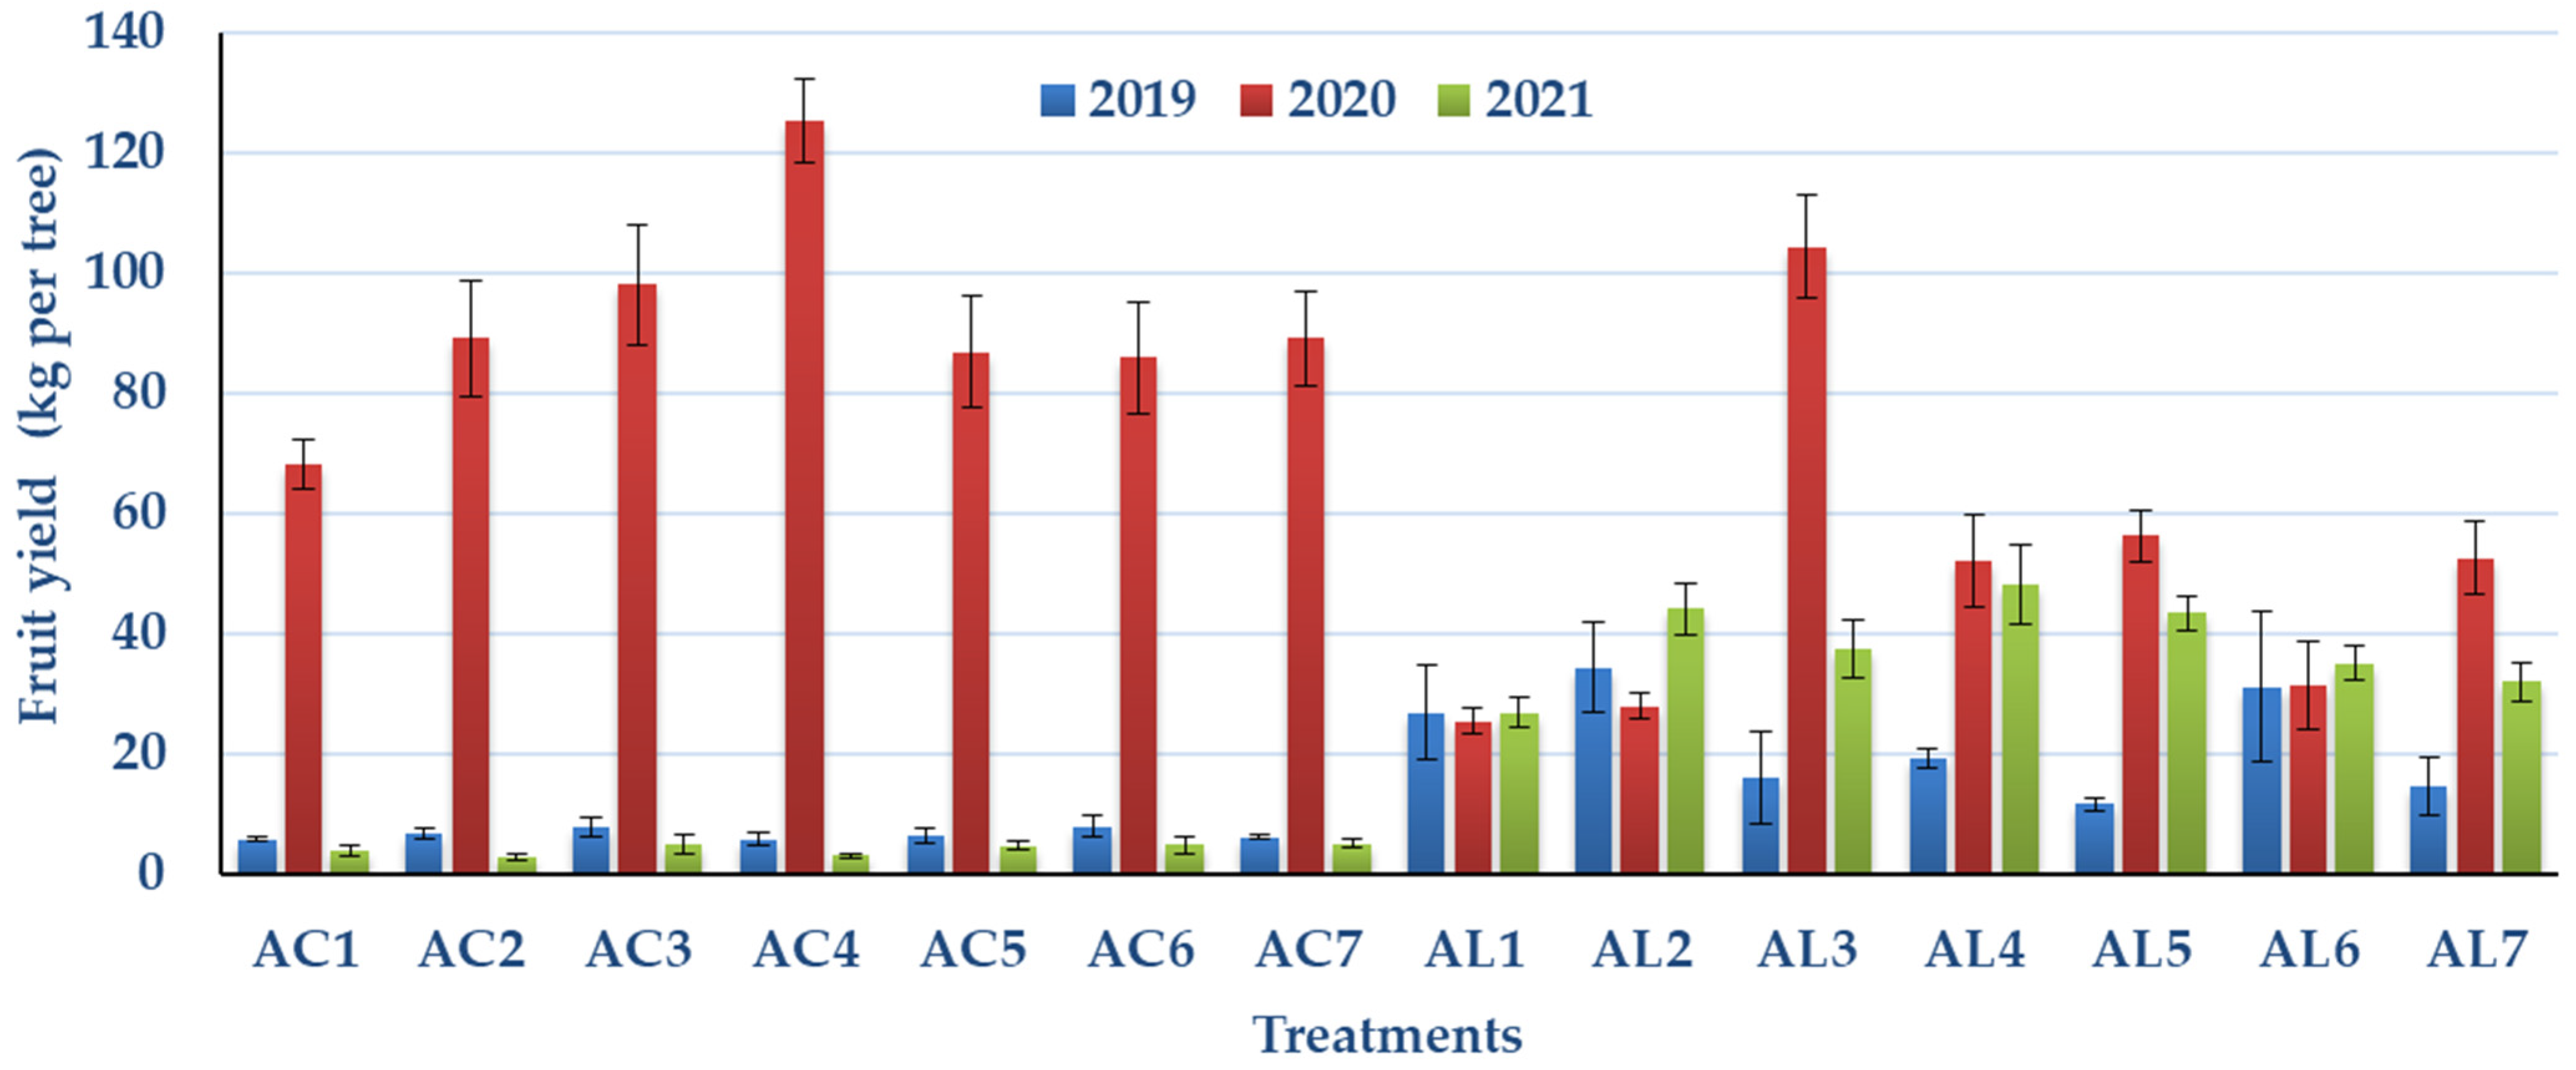
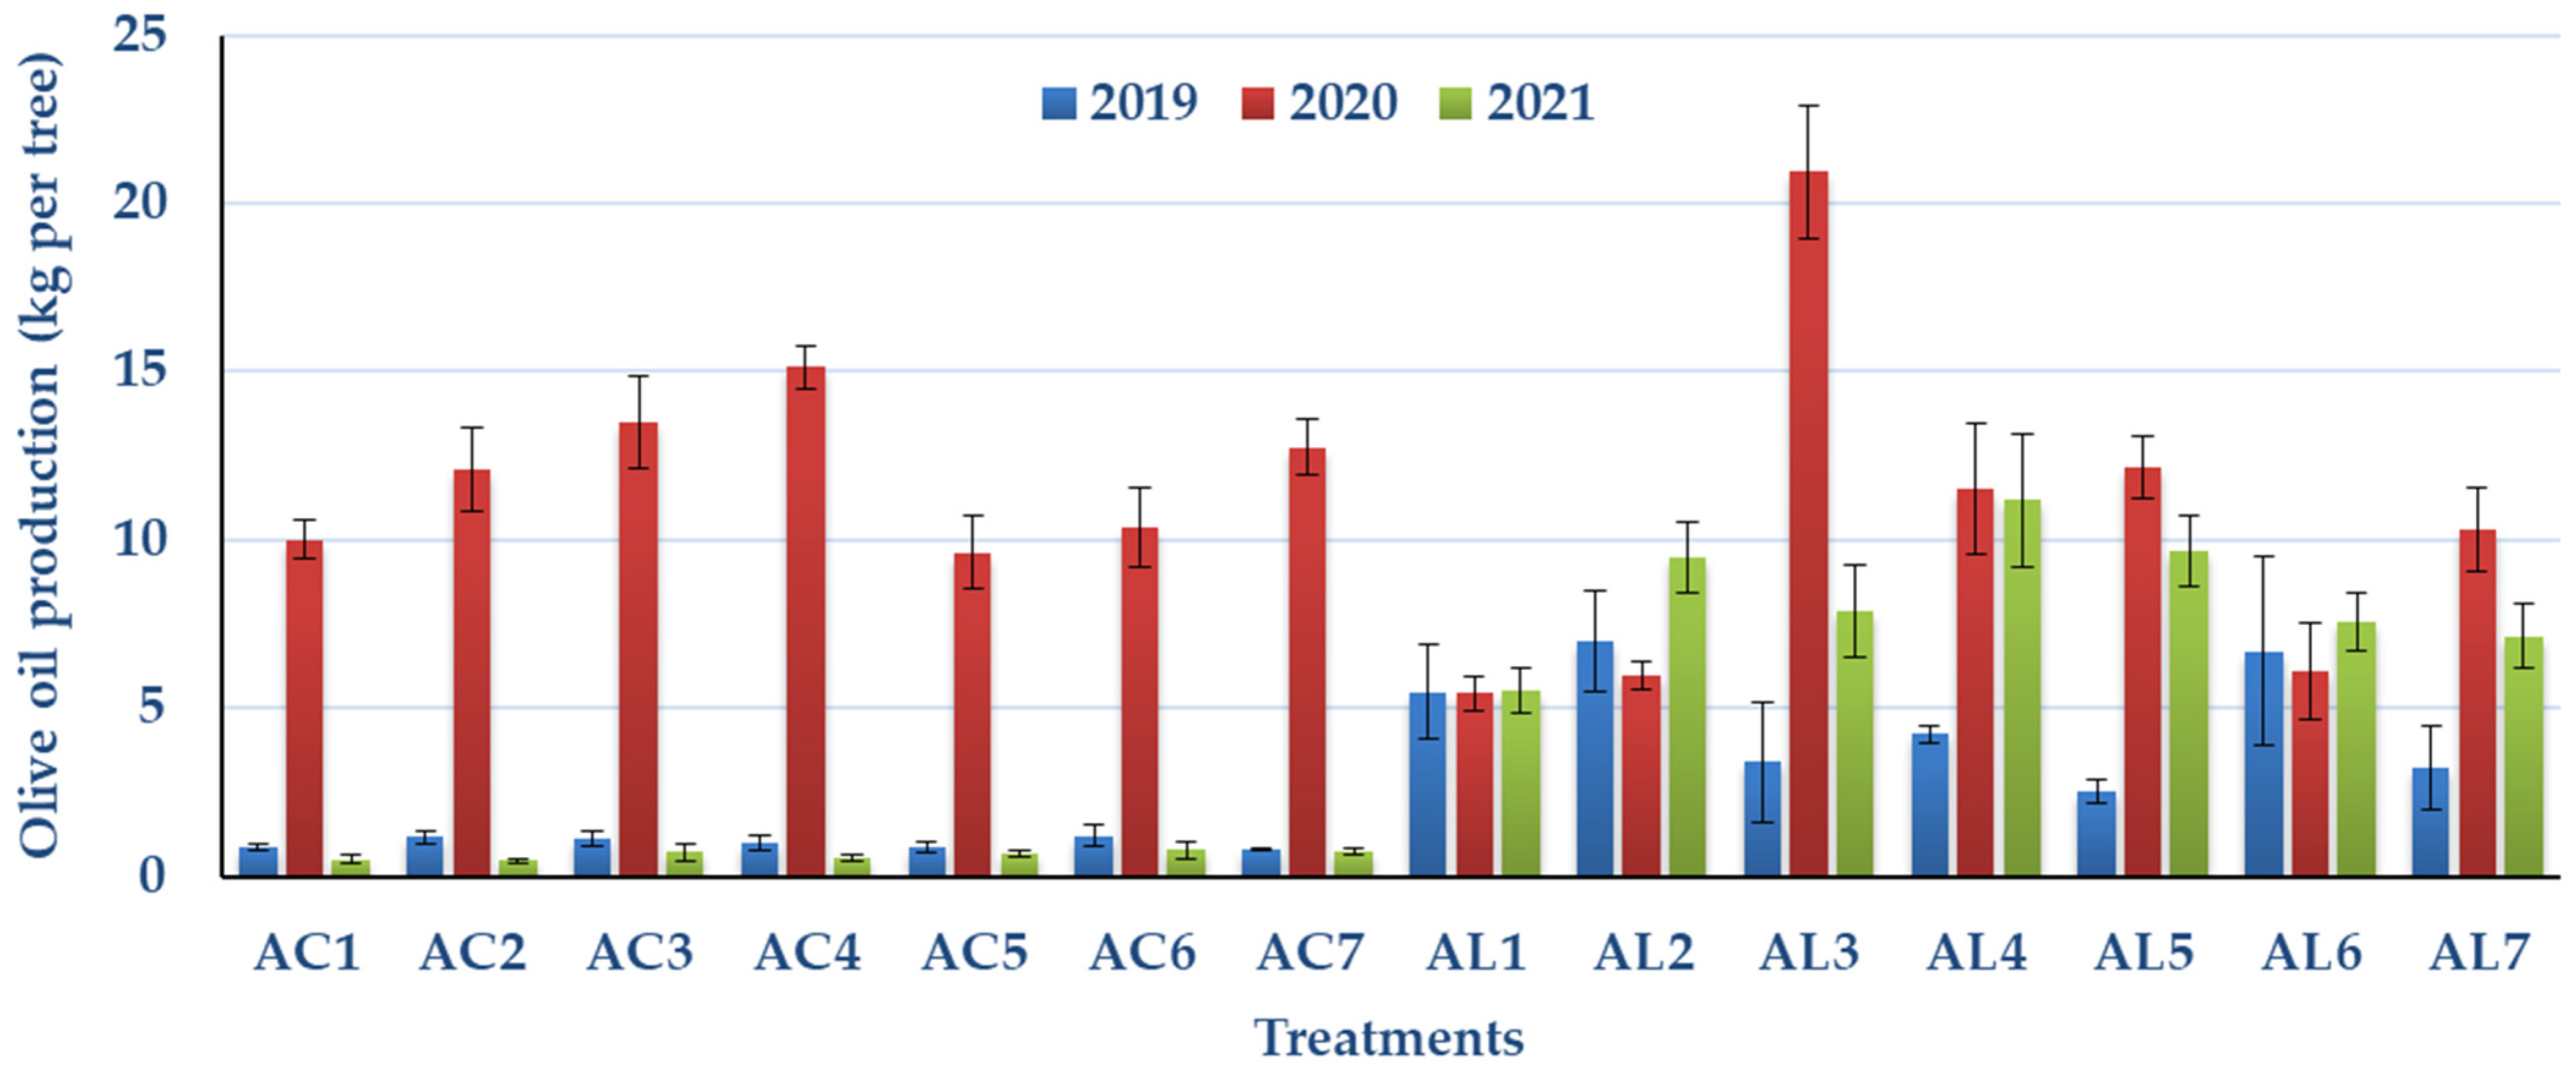
3. Results and Discussion

Following the analysis of soil samples collected from the two experimental olive orchards in December 2018 (Table 1), before the initiation of any fertilizer treatments, the two experimental olive orchard soils were classified as having medium texture, moderate-low organic matter content, and sufficient levels of CEC, as well as being slightly acidic for the non-calcareous (AC) and basic for the alkaline (AL) soils [17,27].
The average olive fruit yield and olive oil production per tree along the seven fertilization treatments (AC1–AC7) and the two orchards (AC and AL) during the three years (2019–2021) of the current study are presented in Figure 1 and Figure 2, respectively. The noticeable absence of fruit production (fruitlessness) in the experimental olive trees grown in both orchards in the years 2019 and 2021 (“off” years) is obvious. This distinct contrast to the yield in 2020 was particularly pronounced in the non-calcareous–acidic orchard (AC) and, to a lesser degree, in the calcareous–alkaline (AL) orchard.
Table 2 provides a comprehensive overview of the impact of various fertilization treatments on cumulative and average fruit yield as well as oil production per tree from 2019 to 2021 (across three harvests) in two distinct experimental olive orchards (AC and AL). The statistical analysis of the results indicates that applying the organic product once a year in alkaline soil (AL3) or twice a year in acidic soil (AC4) resulted in the highest fruit and oil production per tree. These effects were observed in both cumulative and average measurements per tree (Table 2).
A rigorous and appropriate statistical analysis was conducted to investigate the combined influence of year, fertilization treatments, and soil type on olive fruit yield and oil production. The results revealed a significant impact of these factors and their interactions on the outcomes assessed. Individually, the year of study, specific fertilization treatments applied, and distinct soil types demonstrated substantial effects on both fruit yield and olive oil production. Additionally, the intricate interactions among these factors played a pivotal role in shaping the observed outcomes. This underscores the importance of considering the combined influence of year, treatments, and soil type when aiming to optimize fruit yield and olive oil production in olive orchards. All of these, in combination with the occurrence of alternating bearing, existed in both experimental olive orchards during the study (2019 and 2021 were “off” years, while 2020 was an “on” year) (Figure 1 and Figure 2). From a pomological practical point of view, we decided to present the results of an “on” year (second year of the study; 2020) and of an “off” year (third year of the study; 2021), separately for each orchard (soil type) to evaluate the effects of the seven fertilization treatments on the total olive fruit yield and olive production per tree, overall mineral nutrition of trees and parameters relating to photosynthetic pigments.
Prior to the analytical presentation of the results for the selected years (2020 and 2021), it is notable that during the initial year of the study in 2019, which was considered to be an exceptionally poor year for yield (“off” year) (Figure 1 and Figure 2), none of the fertilization treatments applied led to any discernible change (neither an increase nor a decline) in fruit yield or oil production per tree in either of the two orchards. This highlights the lack of impact from the applied treatments during this specific period, signifying a neutral effect on the yield metrics examined in both orchards.

3.1. Non-Calcareous–Acidic (AC) Orchard

In the non-calcareous–acidic (AC) olive orchard, the results for the years 2020 and 2021 demonstrated that AC4 treatment significantly increased leaf N and B concentrations compared to all treatments, excluding AC5 and AC7. Conversely, the treatments AC5 (only in 2020), AC4, and AC6 led to a significant decline in leaf P concentration (Table 3 and Table 4). Leaf K was significantly elevated in 2020 by the treatment AC5, and it continued—although not significantly—with a similar trend in the following year (Table 3 and Table 4). In comparison to AC5 treatment in 2020, trees treated with N + K fertilization (AC6 and AC7) showed a significantly diminished leaf Ca concentration. In contrast, leaf Mg concentration in 2020 was significantly decreased by the treatment AC5, while no significant effect was noted in the following year, 2021 (Table 3 and Table 4). In 2020 (“on” year), the lowest leaf N concentration corresponds to the significantly lowest yield of the untreated-control trees (AC1), also given that leaf K concentration was close to the lower limit of sufficiency range (K: 0.8–1.0% d.w.; [9]). Concerning micronutrients, Fe and Cu concentrations ranged at sufficient levels (80–158 ppm and 22–37 ppm, respectively; [9]), with the highest values found in the non-calcareous–acidic olive orchard, while Mn (20–34 ppm) and Zn (21–36 ppm) ranged in marginal sufficient and sufficient levels, respectively [9,28,29,30]. In 2021, a year of intense fruitlessness (“off” year), there was N adequacy in all treatments, except for the control, while the levels of the other nutrients were within the normal–sufficient range. It is noteworthy that in 2020, the highest B concentration in leaves corresponded to the treatment with two organic sprays (AC4), which also gave the highest production of fruits and oil per tree (Figure 1 and Table 3). Leaf pigments (chlorophylls and carotenoids) were significantly increased in both years under most treatments compared to the control. Τhe organic and N-K treatments (AC2–AC7) led to significantly higher values of the total chlorophylls (chla + chlb) for both years (2020 and 2021) compared to the control treatment (AC1) (Table 5 and Table 6).
Based on chlorophyll analysis of August 2020 and fruit harvest of 2020 (“on” year), it was found that the high fruit yields corresponded to a range of 2.3–3.3 of the leaf chl a/b (chlorophyll a/chlorophyll b ratio) values, which is roughly illustrated in Figure 3. Conversely, in the following year (2021; fruitlessness; “off” year), the above ratio fluctuated in relatively high values, outside the limit of the previous year (>5.85). The above indicates that the variation range of chl a/b in the leaves in August (2.3–3.3) may be a necessary condition for the appearance of high productions (“on” year), related at the same time to a specific range of values of the leaf carotenoids concentrations in August (3.9–5.3 in 2020) (Table 3 and Table 5).
A very interesting issue is the notable difference between treatments AC4 (two foliar applications) and AC5 (three foliar applications) in tree yield in 2020 (“on” year). In fact, despite AC5 trees being treated foliarly thrice, the fruit yield per tree was significantly lower compared to AC4 (two foliar applications). Upon closer examination of the data presented in Table 3, we observed that the nutrient concentrations in the leaves of AC5 were similar to those in AC4. This observation suggests that the additional foliar application in AC5, occurring 40 days after the PFS, may have induced further shoot growth at the expense of fruit growth. Consequently, the trees in AC5 had to allocate nutrients and photosynthetic products to support the increased foliage and stems, limiting the resources available for optimal fruit growth and yield.

3.2. Calcareous–Alkaline (AL) Orchard

The results for the years 2020 and 2021 from the orchard with the alkaline soil (AL) also showed that treatments (except for AL4 as far B leaf content) significantly increased leaf N and B concentrations, while a significant increase in leaf P concentration was further observed in AL2, AL3, and AL4 treatments, compared to the control (AL1) (Table 7 and Table 8). In regard to leaf K concentration, there was a significant increase in all treatments compared to the control in 2020 (Table 7). Whereas leaf K concentrations in 2021 were not significantly affected by the treatments (AL1–AL7), the increase was not significant in 2021 (Table 8). Leaf Ca concentration in 2020 was significantly enhanced in trees treated with the organic product’s treatments (AL3–AL5) or with the combined inorganic fertilizers N + K (AL6 and AL7) (Table 7), while in 2021, a significant increase was observed in the combinations of N + K fertilization treatments (AL6–AL7) compared to the control (AL1) (Table 8). In regard to leaf Mg concentration in 2020 and 2021, a significant decrease was recorded in enhanced Κ fertilization treatment (AL7) (Table 7 and Table 8). Despite N deficiency levels existing in olive leaves in 2020 (leaf N lower than 1.4% d.w.; [9]), irrespective of the treatment (AL1–AL7) (Table 7), the untreated–control trees (AL1) had the lowest leaf N concentration and the lowest fruit production in both the years (2020 and 2021: Table 7 and Table 8). It was noted that in 2020–2021, the concentrations of P, Ca, and Mg in leaves ranged in normal levels. Regarding leaf B concentration for the same two years, marginal sufficiency was observed, apart from in AL1 and AL4 treatments [1,9,28,29,30].
In 2021, a year of partial fruitlessness (“off” year), the nutritional status of the olive trees for all elements except N remained approximately the same as in 2020. Leaf N concentration remained at the same low levels of deficiency in the control treatment, while for the rest of the treatments, an increase (below the adequacy thresholds-1.4% N d.w.- in 2020 and close to or even above the limits of adequacy in 2021) was recorded (Table 7 and Table 8) [1,9,28,29]. It is noteworthy that the highest leaf B concentration was recorded in the trees sprayed once with the organic product (AL3), which gave the highest fruit and oil production per tree in 2020 (Figure 1 and Figure 2: Table 7).
Interestingly, scientific works have connected fruit production with leaf concentrations of pigments and nutrients in olive and other crops in research employing organic and inorganic fertilizers [7,8,31,32,33,34]. The present study also demonstrates that there are numerous complex and multifactorial correlations (soil–climatic conditions, year, etc.) between the olive fruit yield and nutritional status of the trees, as well as one between the pigment concentration of olive leaves and the tree yield, given the extremely dry conditions that prevailed during March and September 2021. In detail, chlorophylls and carotenoids showed significant variations between treatments in samplings from August and December in both years of this study (Table 9 and Table 10). What is remarkable is the correlation between the fruit production and leaf chlorophyll a concentration in August 2020 (Figure 4). Moreover, in Table 9, it can be observed that especially in the “on” year (2020), high yields correspond to a concrete range of chl a/b ratio values (2.28–2.82) in August (AL3–AL7; Table 7 and Table 9), associated with a specific range of leaf carotenoid concentrations in August (9.6–10.92). Moreover, it is worth mentioning that in the alkaline (AL) experimental orchard, the range of chl a/b ratio values in August 2020 (“on” year), which correspond to high yields in 2020, remains approximately the same as in the acidic (AC) orchard for 2020, being a necessary condition for the achievement of high yields in olive orchards, at least in “on” years. However, the range of carotenoid concentrations in August, which is also associated with higher yields, differed in the two years, suggesting, once again, that this parameter is determined by soil–climatic conditions and other factors [35].

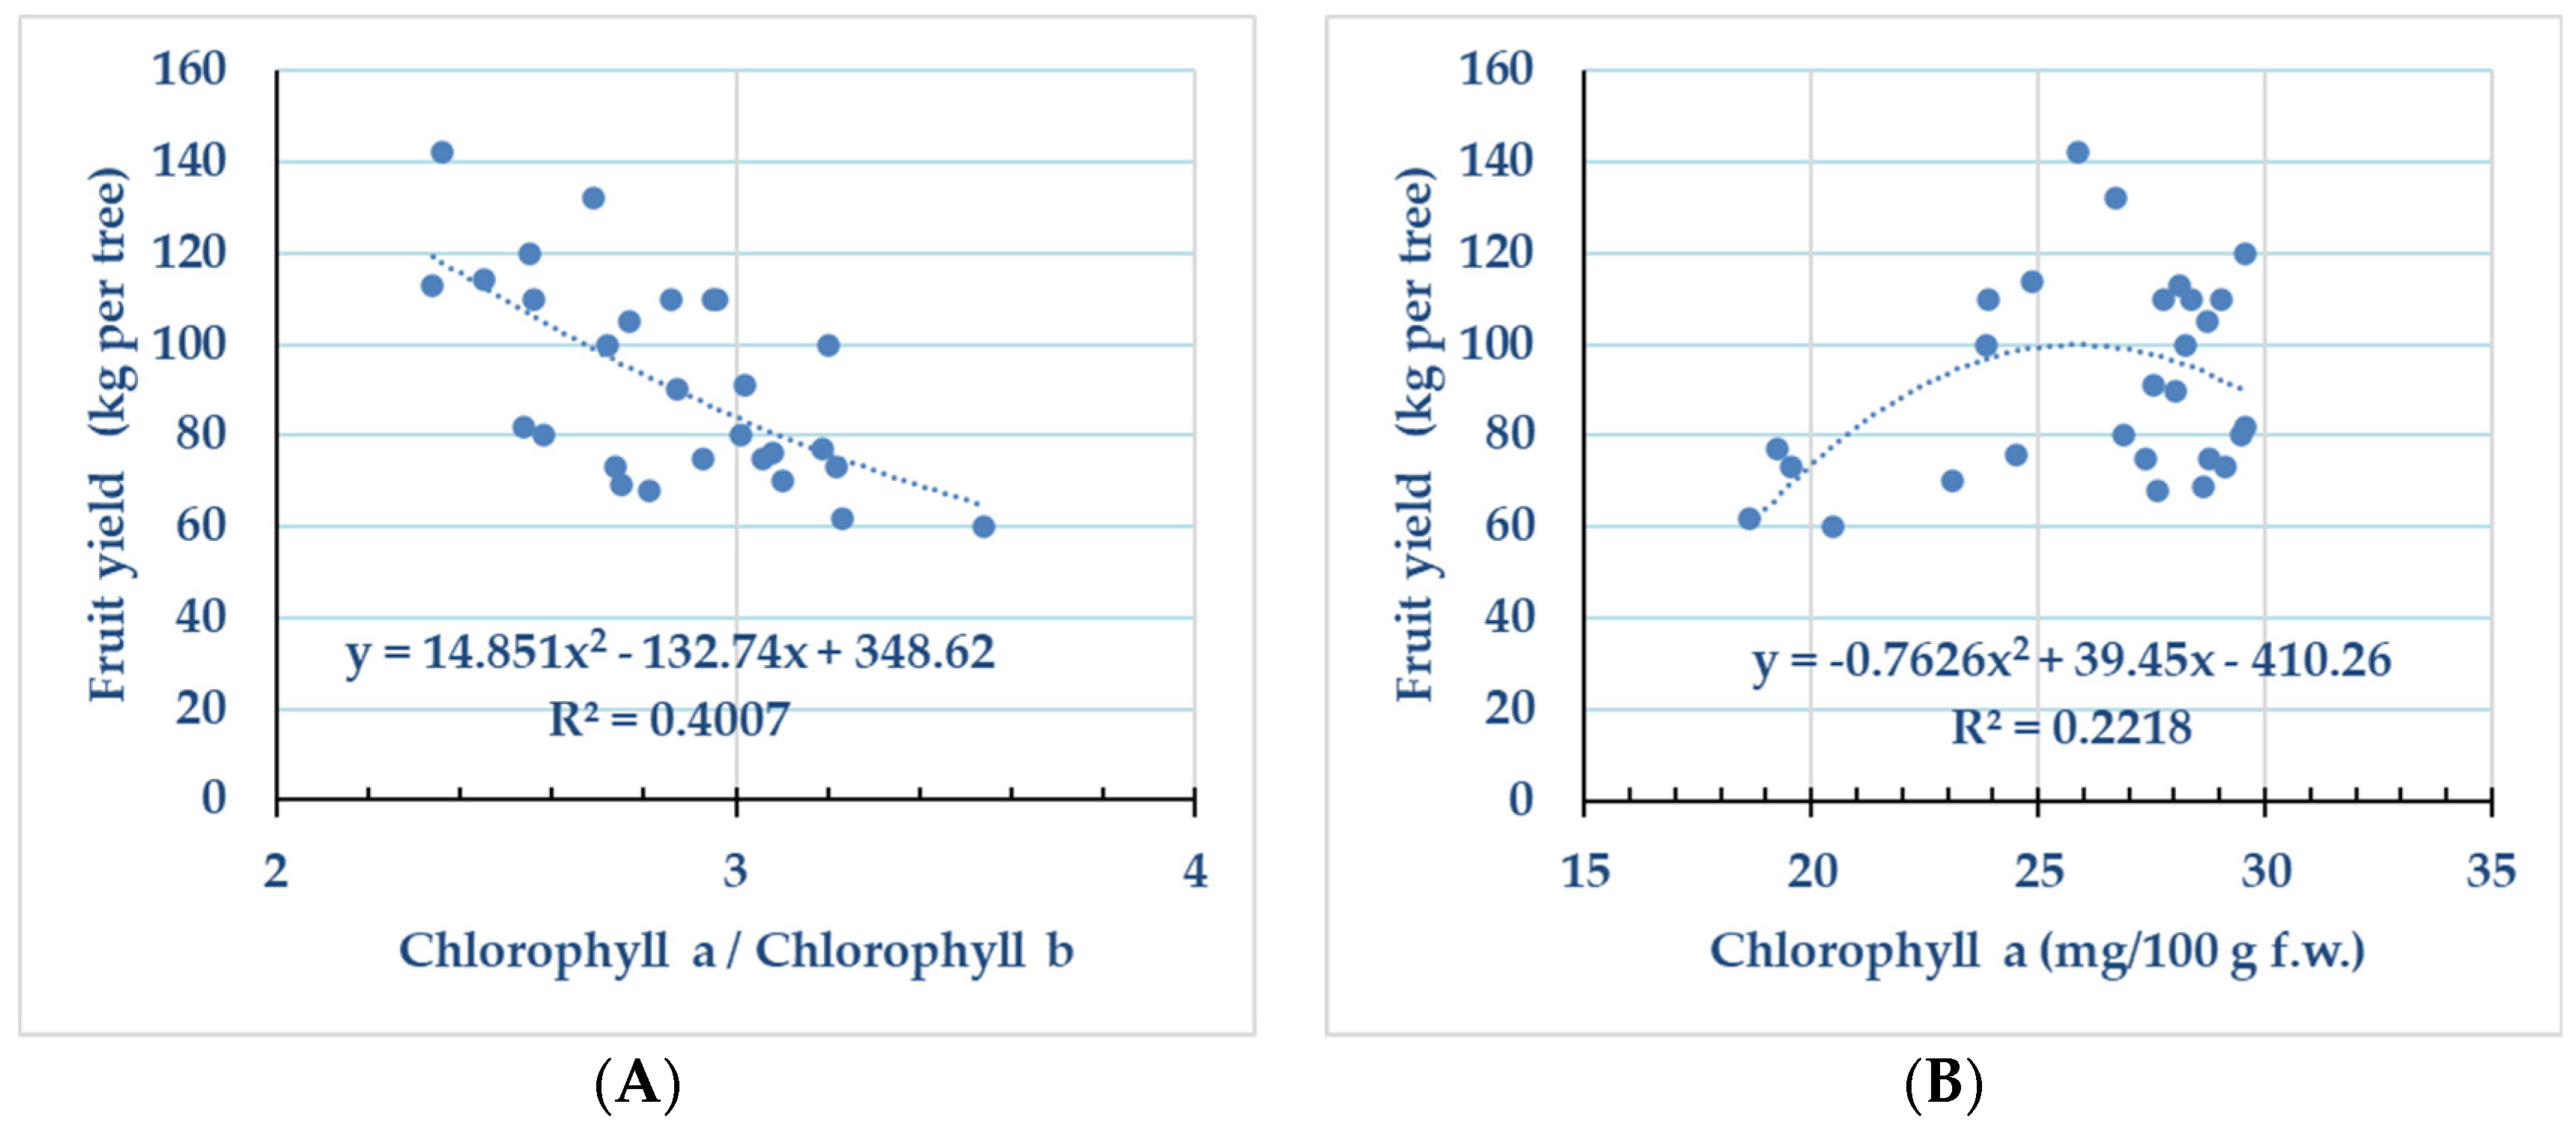
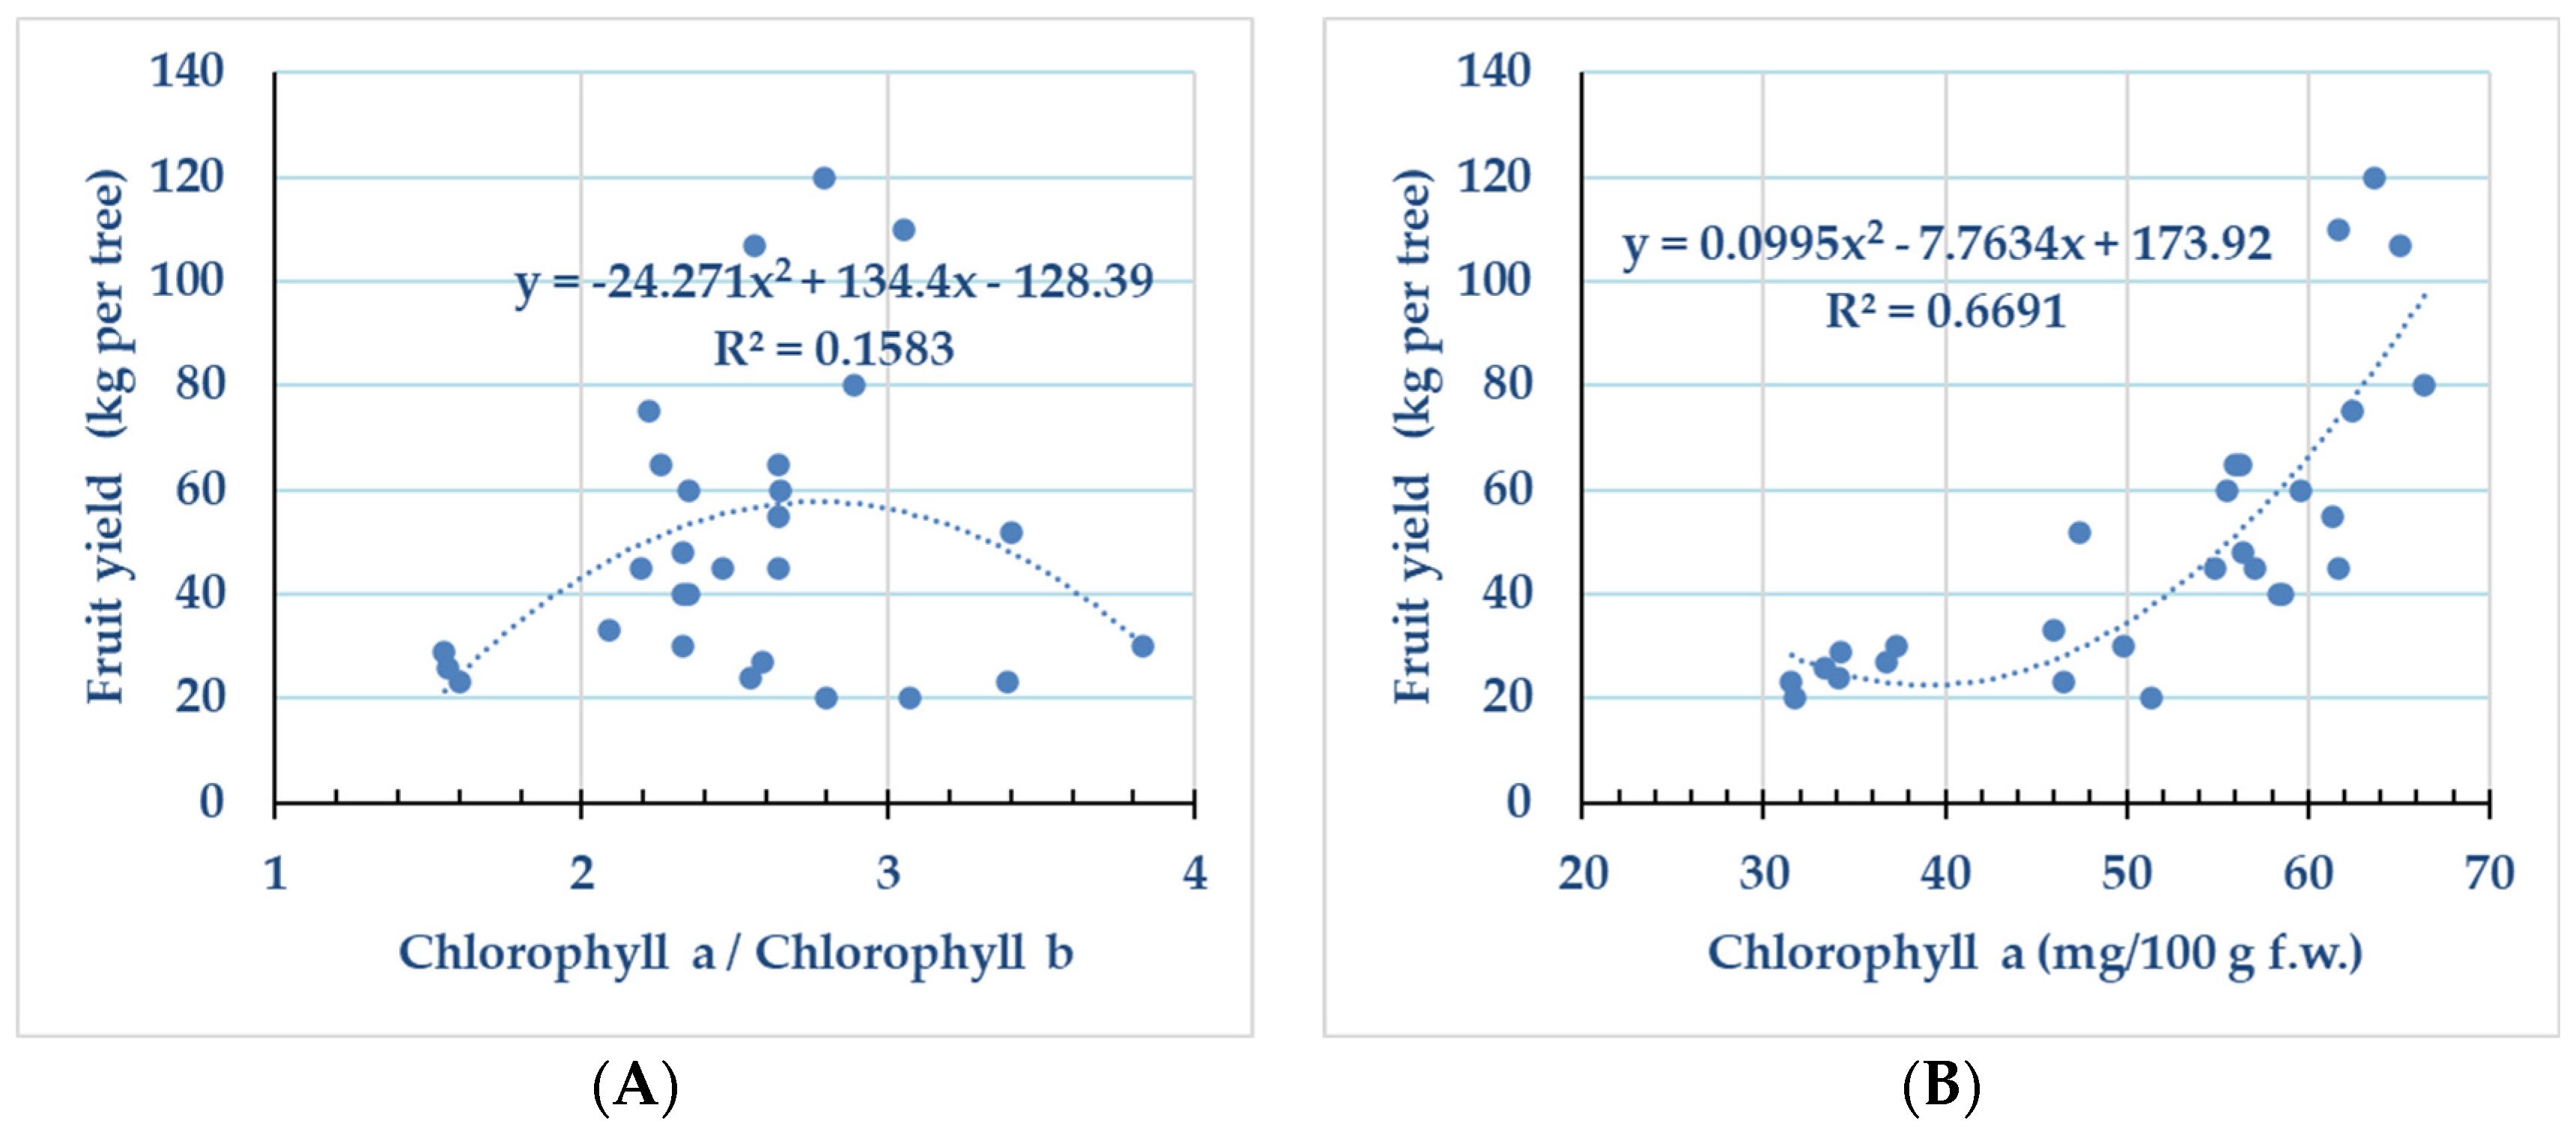
3.3. Correlations between Leaf Pigments Concentrations, Nutrients Concentrations, Fruit Production, Soil Type, and Treatments

Olive fruit production, the chl a/b ratio, and leaf carotenoid concentration in August and December were significantly affected by treatments, type of soil, and their interaction (Table 11).
The relatively high yields in relation to the potential maximum production of the olive tree always correspond to a certain range of the chl a/b ratio values in August (2.3 and 3.3), regardless of the soil type and under different soil–climatic conditions, such as rainfall and temperature, in the “on” year (2020). Although the carotenoid concentration in leaves in August is also associated with high yields, and in particular, with a certain range of values, this varies each time depending on the soil type and current climatic conditions [35]. That is the ranges of chl a/b ratio and carotenoid values in the leaves in August seem to be a prerequisite for achieving relatively high to extremely high yields. It can be deduced from the above that, in many cases, the fertilization treatments affected the leaf pigments, nutrient concentrations, and production in both soil types. The intricate connection between production, nutritional status, and the concentration of olive leaf pigments is due to the existence of numerous degrees of freedom, which result from unexamined (e.g., plant species, variety, etc.) or examined factors such as soil (soil type and fertilizer treatments in the experiment) and climate–environment (different temperatures and rainfall in the years 2020 and 2021) conditions [36,37]. In any case, the organic treatments of one or two spray(s) per year in calcareous–alkaline (AL3) or non-calcareous–acidic (AC4) soil, respectively, led to higher olive fruit yield and oil production. This result is of crucial importance since fruitfulness is the main aim of farmers. From the above, we can be led to direct applications in the field or to some targeted experiments, with treatments including one or two foliar sprays with organic product and maintenance inorganic fertilization of N (1.2 kg N/tree) and K (1.5 kg K2O/tree) in both soil types, since this is the usual dosage of maintenance fertilization in olive cultivation. Furthermore, the correlation between the temporal sequence of the concentration of the pigments in leaves, with the annual production, and the nutritional status needs to be further investigated to highlight the potential possibility of predicting and monitoring the production or corrective actions.

3.4. Future Research Perspectives

While our study contributes valuable insights into optimizing fertilization strategies for non-irrigated olive orchards, it is essential to acknowledge that there are limitations that may influence the broader application of the findings. The modest sample size, comprising four mature trees per treatment, is typical for pomological studies but may limit the generalizability of the results. Additionally, the study’s geographic scope, focusing on two distinct orchards with differing soil profiles and somewhat varied meteorological conditions, may constrain the universality of our conclusions. The relatively short duration of the study (3 years) is another limitation, as long-term effects may not be fully captured. Furthermore, the lack of root analyses limits the understanding of below-ground processes and nutrient uptake dynamics. These limitations are inherent to the exploratory nature of our research, emphasizing the need for future studies with larger sample sizes, broader geographical representation, extended durations, and comprehensive root analyses to further refine and validate our findings. Despite these constraints, this study serves as a foundational step in advancing knowledge about optimized fertilization strategies for olive orchards. For example, an interesting fertilization treatment for future research would involve foliar fertilization with the organic formulation tested herein, administered 20–30 days before the flowering phase. This timing is proposed based on the physiological processes during that critical period, specifically the final stage of olive flower bud differentiation, and the potential impact on final fruit yield and oil production. Finally, in light of the valuable insights gained from studies, such as Xiang et al. [38], which emphasize the significant impact of cover crops on soil microbial abundance and enzyme activities in orchards, future research in our context could explore the potential synergies between organic fertilization strategies and ground cover management. Investigating the interplay between soil microorganisms, nutrient dynamics, and the efficacy of organic formulations under different ground cover conditions may provide a nuanced understanding of sustainable orchard management practices. This direction aligns with the emerging knowledge of the intricate relationships between soil biology and orchard productivity, offering a promising avenue for optimizing fertilization approaches in olive orchards.

4. Conclusions

It is evident that all measured parameters were impacted by the fertilization procedures. Treatments, soil type, and their interaction affected the nutritional status of olive trees. Leaf chlorophylls (chl), chl a/b ratio, and leaf carotenoid concentration in August and December were also affected by fertilization treatments and year: their values can be used as indicators of the level of olive fruit production, especially in “on” years. A stable range of the chl a/b ratio in leaves (2.3–3.3) in August could be a necessary condition for achieving relatively high productions of fruit and oil per olive tree, regardless of soil–climatic conditions. Furthermore, the organic treatments, specifically the application of two sprays per year in non-calcareous–acidic (AC4) soil and one spray per year in calcareous–alkaline (AL3) soil, yielded increased olive fruit and oil production. Finally, the findings of this study emphasize the efficacy of organic treatments and signify the importance of targeted future experiments aimed at predicting olive fruit production using the temporal sequence of pigment concentrations and their ratios.

Author Contributions

Conceptualization, S.S. and C.C.; methodology, S.S., V.K., C.P., S.K. and C.C.; software, S.S., C.A. and I.E.P.; validation, S.S., C.C. and I.E.P.; formal analysis, S.S., C.C. and I.E.P.; investigation, S.S.; resources, S.S.; data curation, S.S. and C.C.; writing—original draft preparation, S.S. and C.A.; writing—review and editing, C.C., I.E.P., V.K., C.P. and S.K.; visualization, S.S., C.A. and I.E.P.; supervision, C.C.; project administration, C.C.; funding acquisition, S.S. and C.C. All authors have read and agreed to the published version of the manuscript.

Funding

This research received no external funding.

Data Availability Statement

The data presented in this study are available on request from the corresponding author (S.S.).

Conflicts of Interest

The authors declare no conflicts of interest.

References

  1. Fernández-Escobar, R.; Benlloch, M.; Barranco, D.; Dueñas, A.; Gañán, J. Response of olive trees to foliar application of humic substances extracted from leonardite. Sci. Hortic. 1996, 66, 191–200. [Google Scholar] [CrossRef]
  2. Canellas, L.P.; Olivares, F.L.; Okorokova-Façanha, A.L.; Façanha, A.R. Humic acids isolated from earthworm compost enhance root elongation, lateral root emergence, and plasma membrane H+-ATPase activity in maize roots. Plant Physiol. 2002, 130, 1951–1957. [Google Scholar] [CrossRef]
  3. Chatzistathis, T.; Kavvadias, V.; Sotiropoulos, T.; Papadakis, I.E. Organic fertilization and tree orchards. Agriculture 2021, 11, 692. [Google Scholar] [CrossRef]
  4. Maksoud, M.A.; Saleh, M.A.; El-Shamma, M.S.; Fouad, A.A. The beneficial effect of biofertilizers and antioxidants on olive trees under calcareous soil conditions. World J. Agric. Sci. 2009, 5, 350–352. [Google Scholar]
  5. Haggag, L.F.; Shahin, M.F.M.; Mahdy, M.A.; Eman, H.A.; El-Hady, S. Effect of spraying humic acid during fruit set stage on fruit quality and quantity of Picual olive trees grown under Sinai condition. J. Appl. Sci. Res. 2013, 9, 1484–1489. [Google Scholar]
  6. Fawy, H.A. Foliar application of organic acids and antioxidants impact on fruit yield and quality of fig and olive trees in some valleys of Northwestern Coast of Egypt. Minufiya J. Agric. Res. 2015, 40, 1629–1645. [Google Scholar]
  7. Dabbaghi, O.; Tekaya, M.; M’Barki, N.; Ali, S.O.; Öden, S.; Mezghani, M.A.; Attia, F.; Labidi, F.; Prinsen, E.; Hammami, M.; et al. Effect of foliar bio-fertilization on growth and biochemical parameters of olive trees at flowering. J. Plant Nutr. 2018, 41, 2281–2297. [Google Scholar] [CrossRef]
  8. Olfa, D.; Meriem, T.; Sevgi, Ö.; Tim, W.; Faouzi, A.; Mohamed, H.; Els, P.; Beligh, M. Foliar application of bio-fertilizers influenced the endogenous concentrations of phytohormones and amino acids in leaves and roots of olive trees (Olea europaea L. cv. Chemlali). Afr. J. Agric. Res. 2018, 13, 1777–1786. [Google Scholar] [CrossRef]
  9. Sotiropoulos, S.; Chatzissavvidis, C.; Papadakis, I.; Kavvadias, V.; Paschalidis, C.; Antonopoulou, C.; Koriki, A. Inorganic and organic foliar fertilization in olives. Hortic. Sci. 2023, 50, 1–11. [Google Scholar] [CrossRef]
  10. Chouliaras, V.; Tasioula, M.; Chatzissavvidis, C.; Therios, I.; Tsabolatidou, E. The effects of a seaweed extract in addition to nitrogen and boron fertilization on productivity, fruit maturation, leaf nutritional status and oil quality of the olive (Olea europaea L.) cultivar Koroneiki. J. Sci. Food Agric. 2009, 89, 984–988. [Google Scholar] [CrossRef]
  11. Elloumi, O.; Ghrab, M.; Ben Mimoun, M. Responses of olive trees (cv. Chemlali) after five years of experiment to potassium mineral nutrition under rainfed condition. In Proceedings of International Plant Nutrition Colloquium; UC Davis: Yolo County, CA, USA, 2009. [Google Scholar]
  12. Mengel, K. Alternative or complementary role of foliar supply in mineral nutrition. Acta Hortic. 2002, 594, 33–48. [Google Scholar] [CrossRef]
  13. Bouyoucos, G.J. Hydrometer method improved for making particle size analyses of soils. Agron. J. 1962, 54, 464–465. [Google Scholar] [CrossRef]
  14. Page, A.L.; Miller, R.H.; Keeney, D.R. Methods of Soil Analysis, Part 2: Chemical and Microbiological Properties, 2nd, ed.; American Society of Agronomy: Madison, CA, USA, 1982. [Google Scholar] [CrossRef]
  15. Westerman, R.L. Soil Testing and Plant Analysis, 3rd ed.; SSSA: Madison, CA, USA, 1990. [Google Scholar]
  16. ISO 11261; Soil Quality. Determination of Total Nitrogen—Modified Kjeldahl Method. International Organization for Standardization: Geneva, Switzerland, 1995.
  17. Okalebo, J.R.; Gathua, K.W.; Woomer, P.L. Laboratory Methods of Soil and Plant Analysis. A Working Manual, 2nd ed.; Sacred African Publishers: Nairobi, Kenya, 2002. [Google Scholar]
  18. Wolf, B. The determination of boron in soil extracts, plant materials, composts, manures, water and nutrient solutions. Commun. Soil Sci. Plant Anal. 1971, 2, 363–374. [Google Scholar] [CrossRef]
  19. Parker, D.R.; Gardner, E.H. The determination of hot-water-soluble boron in some acid Oregon soils using a modified azomethine-H procedure. Commun. Soil Sci. Plant Anal. 1981, 12, 1311–1322. [Google Scholar] [CrossRef]
  20. Soltanpour, P.N.; Johnson, C.W.; Workman, S.M.; Jones, J.B., Jr.; Miller, R.O. Advances in ICP emission and ICP mass spectroscopy. Adv. Agron. 1998, 64, 28–113. [Google Scholar]
  21. Chapman, H.D.; Pratt, P.F. Methods of Analysis for Soils, Plants and Waters; Division of Agricultural Sciences, University of California: Riverside, CA, USA, 1961; p. 309. [Google Scholar]
  22. Jones, J.B.; Wolf, B.; Mills, H.A. Plant Analysis Handbook: A Practical Sampling, Preparation, Analysis, and Inter-Pretation Guide; Micro-Macro Publishing: Athens, Greece, 1991. [Google Scholar]
  23. Wolf, B. Improvements in the azomethine-H method for the determination of boron. Commun. Soil Sci. Plant Anal. 2008, 5, 39–44. [Google Scholar] [CrossRef]
  24. Hansen, T.H.; de Bang, T.C.; Laursen, K.H.; Pedas, P.; Husted, S.; Schjørring, J.K. Multielement plant tissue analysis using ICP spectrometry. In Plant Mineral Nutrients. Methods in Molecular Biology (Methods and Protocols); Maathuis, F., Ed.; Humana Press: Totowa, NJ, USA, 2013; Volume 953. [Google Scholar]
  25. Wintermans, J.; De Mots, A. Spectrophotometric characteristics of chlorophylls a and b and their phenophytins in ethanol. Biochim. Biophys. Acta 1965, 109, 448–453. [Google Scholar] [CrossRef]
  26. Lichtenthaler, H.K. Chlorophylls and carotenoids: Pigments of photosynthetic biomembranes. Methods Enzymol. 1987, 148, 350–382. [Google Scholar] [CrossRef]
  27. Tisdale, S.; Nelson, W.L.; Beaton, J.D.; Havlin, J.L. Soil Fertility and Fertilizers: An Introduction to Nutrient Management, 8th ed.; Pearson: Bloomington, MN, USA, 2013; 528p. [Google Scholar]
  28. Beutel, J.; Uriu, K.; Lilleland, O. Leaf analysis for California deciduous fruits. In Soil and Plant Tissue Testing in California; Bulletin, Division of Agricultural Sciences, University of California: Berkeley, CA, USA, 1983; Volume 1879, pp. 11–14. [Google Scholar]
  29. Koukoulakis, P.C.; Papadopoulos, A.H. The Interpretation of Leaf Diagnostics; Stamoulis Publications: Athens, Greece, 2003. (In Greek) [Google Scholar]
  30. Chatzissavvidis, C.; Therios, I. Response of four olive (Olea europaea L.) cultivars to six B concentrations: Growth performance, nutrient status and gas exchange parameters. Sci. Hortic. 2010, 127, 29–38. [Google Scholar] [CrossRef]
  31. Hegazi, E.S.; Kasim, N.E.; Yehia, T.A.; Abou Rayya, M.S.; Thanaa, S.M. Improving growth and productivity of olive trees through raising photosynthesis efficiency. Res. Pharm. Biol. Chem. Sci. 2016, 7, 2697. [Google Scholar]
  32. Danyaei, A.; Hassanpour, S.; Baghaee, M.A.; Dabbagh, M.; Babarabie, M. The effect of sulfur-containing humic acid on yield and nutrient uptake in olive fruit. Open J. Ecol. 2017, 7, 279–288. [Google Scholar] [CrossRef]
  33. El-Hoseiny, H.M.; Helaly, M.N.; Elsheery, N.I.; Alam-Eldein, S.M. Humic acid and boron to minimize the incidence of alternate bearing and improve the productivity and fruit quality of mango trees. HortScience 2020, 55, 1026–1037. [Google Scholar] [CrossRef]
  34. Golmohammadi, M.; Sofalian, O.; Taheri, M.; Ghanbari, A.; Rasoli, V. Changes in fruit yield and photosynthesis parameters IN different olive cultivars (Olea europaea L.) under contrasting water regimes. Acta Sci. Pol. Hortorum Cultus 2020, 19, 135–147. [Google Scholar] [CrossRef]
  35. Roca, M.; Mínguez-Mosquera, M.I. Changes in chloroplast pigments of olive varieties during fruit ripening. J. Agric. Food Chem. 2001, 49, 832–839. [Google Scholar] [CrossRef]
  36. Cunningham, F.X.; Gantt, E., Jr. Genes and enzymes of carotenoid biosynthesis in plants. Annu. Rev. Plant Physiol. Plant Mol. Biol. 1998, 49, 557–583. [Google Scholar] [CrossRef]
  37. Criado, M.N.; Morelló, J.R.; Motilva, M.J.; Romero, M.P. Effect of growing area on pigment and phenolic fractions of virgin olive oils of the Arbequina variety in Spain. J. Am. Oil Chem. Soc. 2004, 81, 633–640. [Google Scholar] [CrossRef]
  38. Xiang, Y.; Chang, S.X.; Shen, Y.; Chen, G.; Liu, Y.; Yao, B.; Xue, J.; Li, Y. Grass cover increases soil microbial abundance and diversity and extracellular enzyme activities in orchards: A synthesis across China. Appl. Soil Ecol. 2023, 182, 104720. [Google Scholar] [CrossRef]
Figure 1. Fruit yield per olive tree (kg fruit/tree) from 2019 to 2021. The vertical lines represent the ± standard error (S.E.) of the means (n = 4).
Horticulturae 10 00167 g001
Figure 2. Olive oil production per tree (kg oil/tree) during the years 2019–2021. The vertical lines represent the ± standard error (S.E.) of the means (n = 4).
Horticulturae 10 00167 g002
Figure 3. Regression curves linking fruit production (kg per tree) to the leaf chlorophyll a/chlorophyll b ratio (A) (statistically significant relationship) and chlorophyll a concentration (mg per 100 g leaf fresh weigh) (B) (statistically nonsignificant relationship) in the non-calcareous–acidic (AC) orchard, in August 2020 (n = 28).
Horticulturae 10 00167 g003
Figure 4. Regression curves linking production per tree to the leaf chlorophyll a to chlorophyll b ratio (A) (statistically nonsignificant relationship) and chlorophyll a concentration (mg per 100 g leaf fresh weigh) (B) (statistically significant relationship) in the calcareous–alkaline (AL) orchard (August 2020) (n = 28).
Horticulturae 10 00167 g004
Table 1. Physicochemical properties of non-calcareous–acidic (AC) and calcareous–alkaline (AL) soils of the two experimental olive orchards at the start of the study, before the application of any fertilization treatments (December 2018).
Depth
(cm)
Soil
Texture
EC
(mS/cm)
pHCaCO3
(%)
Organic Matter
(%)
Saturation (%)Bulk
Density (g/cm3)
CEC
(meq/100 g)
AC
0–30SL0.1006.580.032.00351.2825.21
30–60SL0.2826.600.030.8044-28.94
60–90SCL0.1506.420.100.8262-31.75
AL
0–30SL0.0927.9033.02.06471.1827.08
30–60SC0.1508.0035.70.7960-29.88
60–90C0.1507.9037.50.7365-22.41
SL = sand loamy; SCL = sand clay loamy; SL = sand loamy; SC = sand clayey; C = clayey; EC = electrical conductivity; CEC = cation exchange capacity; AC = non-calcareous–acidic soil; AL = calcareous–alkaline soil.
Table 2. Effects of fertilization treatments on cumulative and average olive fruit yield (kg fruit/tree) and olive oil production (kg oil/tree) over the three-year study period (harvests in 2019, 2020, and 2021) in two experimental olive orchards (Acidic soil, AC1–AC7; Alkaline soil, AL1–AL7).
Soil/TreatmentCumulative Fruit Yield (kg/tree)Cumulative
Olive Oil
Production (kg/tree)
Average Fruit Yield (kg/tree)Average Olive Oil Production (kg/tree)
Acidic soilAC177.40 c11.37 c25.80 c3.79 c
AC298.55 bc13.73 abc32.85 bc4.58 abc
AC3110.53 ab15.33 ab36.84 ab5.11 ab
AC4133.98 a16.68 a44.66 a5.56 a
AC597.65 bc11.16 c32.55 bc3.72 c
AC698.30 bc12.39 bc32.77 bc4.13 bc
AC7100.00 bc14.27 abc33.33 bc4.76 abc
Alkaline soilAL178.75 C16.43 D26.25 C5.47 D
AL2106.00 B22.44 BC35.33 B7.48 BC
AL3157.50 A32.23 A52.50 A10.74 A
AL4119.13 B26.93 B39.71 B8.97 B
AL5111.00 B24.32 BC37.00 B8.11 BC
AL697.13 BC20.32 CD32.38 BC6.73 CD
AL798.88 BC20.68 CD32.96 BC6.89 CD
For each parameter and soil type (AC or AL), means (±S.E.) followed by a different letter(s) indicate statistically significant differences, according to Duncan’s multiple range test for p ≤ 0.05 (n = 4), between fertilization treatments within the same experimental orchard. Particularly, in order to compare the mean values of fertilization treatments for the AC orchard (AC1–AC7), lowercase letters are used, while for the comparison of mean values of fertilization treatments for the AL orchard (AL1–AL7), capital letters are used.
Table 3. Effect of fertilization treatments on olive fruit production (kg/tree), and leaf N, P, K, Ca, Mg (% d.w.), and B concentration (mg/kg d.w.), in the non-calcareous–acidic (AC) orchard, in December 2020.
TreatmentsFruit ProductionNPKCaMgB
AC168 c0.46 e0.18 ab0.67 b1.24 ab0.19 a24.0 c
AC289 bc0.70 d0.16 bc0.73 b1.23 ab0.18 a29.3 b
AC398 b0.85 c0.19 ab0.66 b1.28 ab0.20 a18.8 d
AC4125 a1.11 ab0.13 cd0.77 ab1.29 ab0.17 ab33.9 a
AC587 bc1.12 ab0.14 cd0.88 a1.39 a0.15 b20.7 d
AC686 bc0.99 b0.12 d0.66 b1.17 b0.19 a27.8 b
AC789 bc1.16 a0.21 a0.68 b1.20 b0.19 a32.5 a
Different letters in the same column indicate statistically significant differences among the fertilization treatments based on Duncan’s multiple range test (p ≤ 0.05, n = 4).
Table 4. Effect of fertilization treatments on olive fruit production (kg/tree), and leaf N, P, K, Ca, Mg (% d.w.), and B concentration (mg/kg d.w.), in the non-calcareous (AC) orchard, in December 2021.
TreatmentsFruit ProductionNPKCaMgB
AC13.65 a0.98 c0.16 ab0.79 a1.99 a0.20 a23.30 c
AC22.80 a1.20 c0.15 ab0.78 a1.92 a0.19 a29.68 b
AC34.78 a1.78 b0.16 ab0.82 a2.00 a0.20 a19.33 d
AC42.98 a2.08 b0.13 c086 a1.96 a0.19 a34.28 a
AC54.65 a2.05 b0.14 bc0.84 a2.05 a0.18 a21.05 cd
AC64.80 a1.82 b0.12 c0.82 a1.90 a0.20 a28.23 b
AC75.00 a2.37 a0.17 a0.82 a1.95 a0.21 a32.78 a
Different letters in the same column indicate statistically significant differences among the fertilization treatments based on Duncan’s multiple range test (p ≤ 0.05, n = 4).
Table 5. Effect of fertilization treatments on leaf chlorophyll a (chla), chlorophyll b (chlb), chlorophyll a + b (chl a + b), chlorophyll a/chlorophyll b ratio (chl a/b), and carotenoid (carot) (mg/100 g f.w.) concentrations in August and December 2020, respectively, in the non-calcareous–acidic (AC) orchard.
Treatmentschlachlbchla + bchl a/bcarotchlachlbchla + bchl a/bcarot
---------------- August 2020 ---------------------------------- December 2020 ---------------
AC119.5 f5.92 f25.4 e3.30 a3.89 d20.6 d8.94 d29.5 d2.31 cd5.04 e
AC223.8 e7.74 e31.6 d3.08 b4.78 b43.1 c16.18 c59.3 c2.68 b8.73 c
AC329.4 a11.50 a40.9 a2.56 e5.12 a65.1 a26.53 a91.6 a2.45 c9.87 b
AC426.4 d10.76 b37.1 c2.46 e4.49 c48.3 b21.82 b70.1 b2.22 d6.95 d
AC528.7 b10.45 b39.1 b2.75 d5.22 a63.6 a21.90 b85.5 a2.91 a10.02 b
AC628.2 bc9.83 c38.0 bc2.87 cd5.28 a62.7 a26.37 a89.0 a2.38 cd7.56 d
AC727.4 cd9.11 d36.5 c3.01 bc5.25 a67.1 a24.30 ab91.4 a2.76 ab11.23 a
Different letters in the same column indicate statistically significant differences among the fertilization treatments based on Duncan’s multiple range test (p ≤ 0.05, n = 4).
Table 6. Effect of fertilization treatments on olive fruit production (kg/tree), leaf chlorophyll a (chla), chlorophyll b (chlb), chlorophyll a + b (chl a + b), chlorophyll a/chlorophyll b ratio (chl a/b), and carotenoid (carot) (mg/100 g f.w.) concentrations in August and December 2021, respectively, in the non-calcareous (AC) orchard.
Treatmentschlachlbchla + bchl a/bcarotchlachlbchla + bchl a/bcarot
-------------------August 2021--------------------------------December 2021----------------
AC112.8 d1.12 d13.95 d11.70 a2.39 e16.9 d1.07 c17.9 d16.07 a2.92 c
AC215.7 c1.59 cd17.27 b9.91 ab3.00 cd29.1 c2.11 c31.2 c13.90 a4.25 b
AC320.6 a3.53 a24.11 a5.85 d3.49 ab40.6 a4.46 a45.1 a9.13 b4.86 a
AC419.6 ab2.38 bc22.02 a9.00 bc3.30 bc40.7 a4.88 a45.5 a9.11 b4.28 b
AC517.6 bc3.27 ab20.85 a5.55 d2.79 d37.7 ab4.17 a41.9 ab9.39 b3.93 b
AC619.5 ab2.85 ab22.33 a7.11 cd3.46 ab34.2 bc3.60 bc37.8 b9.85 b4.17 b
AC720.6 a2.76 ab23.36 a7.83 bcd3.86 a36.2 ab3.50 bc39.7 ab10.83 b4.37 ab
Different letters in the same column indicate statistically significant differences among the fertilization treatments based on Duncan’s multiple range test (p ≤ 0.05, n = 4).
Table 7. Effect of fertilization treatments on olive fruit production (kg/tree), and leaf N, P, K, Ca, Mg (% d.w.), and B concentration (mg/kg d.w.) in the calcareous–alkaline (AL) orchard, in December 2020.
TreatmentsFruit ProductionNPKCaMgB
AL125 C0.38 D0.12 C0.62 B1.17 D0.21 A13.5 B
AL228 C0.77 C0.32 A0.82 A1.33 CD0.20 A22.1 A
AL3104 A0.78 C0.35 A0.89 A1.49 BC0.18 AB22.4 A
AL452 B0.76 C0.22 B0.90 A1.37 C0.18 AB15.2 B
AL556 B0.74 C0.14 C0.79 A1.48 BC0.20 A19.5 A
AL631 C1.18 A0.13 C0.84 A1.57 B0.19 AB21.9 A
AL753 B1.10 B0.12 C0.88 A1.75 A0.17 B20.1 A
Different letters in the same column indicate statistically significant differences among the fertilization treatments based on Duncan’s multiple range test (p ≤ 0.05, n = 4).
Table 8. Effect of fertilization treatments on olive fruit production (kg/tree), and leaf N, P, K, Ca, Mg (% d.w.), and B concentration (mg/kg d.w.) in the calcareous–alkaline orchard in December 2021.
TreatmentsFruit
Production
NPKCaMgB
AL127 C0.30 D0.10 D0.80 A2.04 C0.22 A13.3 B
AL244 AB1.64 AB0.22 A0.82 A2.06 BC0.21 AB21.9 A
AL337 ABC1.44 C0.23 A0.82 A2.14 ABC0.20 AB22.6 A
AL448 A1.50 ABC0.17 B0.79 A2.11 ABC0.19 AB15.4 B
AL543 AB1.32 C0.13 CD0.79 A2.11 ABC0.21 AB19.7 A
AL635 ABC1.67 A0.13 CD0.85 A2.17 AB0.20 AB22.1 A
AL732 BC1.47 BC0.12 CD0.84 A2.20 A0.18 B20.5 A
Different letters in the same column indicate statistically significant differences among the fertilization treatments based on Duncan’s multiple range test (p ≤ 0.05, n = 4).
Table 9. Effect of fertilization treatments on leaf chlorophyll a (chla), chlorophyll b (chlb), chlorophyll a + b (chl a + b) (mg/100 g f.w.) concentrations, chlorophyll a/chlorophyll b ratio (chl a/b), and carotenoid (carot) (mg/100 g f.w.) concentrations in August and December 2020, respectively, in the calcareous–alkaline (AL) orchard.
Treatmentschlachlbchla + bchl a/bcarotchlachlbchla + bchl a/bcarot
------------August 2020---------------------------------December 2020---------------
AL135.0 D13.7 D48.7 C2.57 BC6.39 D35.7 D16.0 C51.7 D2.24 C10.41 BC
AL236.3 D21.3 C57.6 B1.70 D7.27 C50.5 C24.3 B74.8 C2.07 D8.08 D
AL364.2 A22.9 ABC87.1 A2.82 B10.92 A61.5 B27.4 AB88.9 B2.25 C9.37 CD
AL458.1 B24.9 AB82.9 A2.34 C9.64 B66.0 B27.7 A93.7 AB2.39 B9.43 CD
AL558.6 B22.1 BC80.7 A2.64 B10.14 B60.1 B28.0 A88.1 B2.14 D8.81 CD
AL648.8 C14.4 D63.1 B3.42 A10.07 B67.9 B29.1 A97.0 AB2.33 BC11.14 B
AL757.9 B25.4 A83.3 A2.28 C9.60 B75.6 A28.0 A103.6 A2.70 A13.38 A
Different letters in the same column indicate statistically significant differences among the fertilization treatments based on Duncan’s multiple range test (p ≤ 0.05, n = 4).
Table 10. Effect of fertilization treatments on leaf chlorophyll a (chla), chlorophyll b (chlb), chlorophyll a + b (chla + b) (mg/100 g f.w.), chlorophyll a/chlorophyll b ratio (chl a/b), and carotenoid (carot) (mg/100 g f.w.) concentrations in August and December 2021, respectively, in the calcareous–alkaline (AL) orchard.
Treatmentschlachlbchla + bchl a/bcarotchlachlbchla + bchl a/bcarot
-------------------August 2021----------------------------December 2021-----------
AL113.2 BC2.77 C15.9 C4.86 A1.63 AB21.1 A3.86 A25.0 AB5.72 A2.42 AB
AL211.9 C4.02 B15.9 C3.00 B1.06 CD19.4 AB3.81 A23.2 AB5.17 AB1.16 B
AL312.2 C4.72 AB16.9 BC2.59 B0.74 D18.1 AB6.32 A24.5 AB2.89 B0.85 B
AL415.7 A5.16 A20.9 A3.05 B1.31 BC20.8 AB4.03 A24.8 AB5.22 AB1.39 B
AL514.4 AB4.89 AB19.3 AB2.99 B1.51 AB20.7 AB5.57 A26.3 A3.96 AB1.88 B
AL612.3 C2.87 C15.1 C4.31 A1.67 AB16.9 B2.89 A19.8 B6.05 A1.76 B
AL713.0 BC2.78 C15.7 C4.83 A1.72 A19.8 AB5.36 A20.4 B5.76 A4.64 A
Different letters in the same column indicate statistically significant differences among the fertilization treatments based on Duncan’s multiple range test (p ≤ 0.05, n = 4).
Table 11. Effect of fertilization treatments, soil type and their interaction on olive fruit yield, leaf chlorophyll a to chlorophyll b ratio (Chl a/b), and leaf carotenoid concentration in August 2020 and 2021.
SourceDependent VariabledfSig. (2020)Sig. (2021)
TreatmentsFruit yield60.0000.022
Chl a/b60.0000.002
Carotenoids60.0000.000
SoilFruit yield10.0000.000
Chl a/b10.0000.000
Carotenoids10.0000.000
Soil × TreatmentsFruit yield60.0000.007
Chl a/b60.0000.000
Carotenoids60.0000.000
df: degrees of freedom; Sig.: significance level.
Disclaimer/Publisher’s Note: The statements, opinions and data contained in all publications are solely those of the individual author(s) and contributor(s) and not of MDPI and/or the editor(s). MDPI and/or the editor(s) disclaim responsibility for any injury to people or property resulting from any ideas, methods, instructions or products referred to in the content.

