Article

Decoding the Genomic Landscape of Pomegranate: A Genome-Wide Analysis of Transposable Elements and Their Structural Proximity to Functional Genes

Department of Agriculture, Food and Environment (DAFE), University of Pisa, Via del Borghetto 80, 56124 Pisa, Italy
*
Author to whom correspondence should be addressed.
These authors contributed equally to this work.
Horticulturae 2024, 10(2), 111; https://doi.org/10.3390/horticulturae10020111
Submission received: 28 December 2023 / Revised: 19 January 2024 / Accepted: 22 January 2024 / Published: 24 January 2024
(This article belongs to the Special Issue Genetics and Molecular Breeding of Fruit Tree Species)

Abstract

:
Transposable elements (TEs) significantly drive dynamic changes that characterize genome evolution. However, understanding the variability associated with TE insertions among different cultivars remains challenging. The pomegranate (Punica granatum L.) has yet to be extensively studied regarding the roles of TEs in the diversification of cultivars. Herein, we explored the genome distribution of TEs and its potential functional implications among four pomegranate cultivars, ‘Bhagwa’, ‘Dabenzi’, ‘Taishanhong’ and ‘Tunisia’, whose genome sequences are available. A total of 8404 full-length TEs were isolated. The content of TEs varied among the cultivars, ranging from 41.67% of ‘Taishanhong’ to 52.45% of ‘Bhagwa’. In all cultivars, the Gypsy superfamily of retrotransposons accounted for a larger genome proportion than the Copia superfamily. Seventy-three full-length TEs were found at the same genomic loci in all four cultivars. By contrast, 947, 297, 311, and 874 TEs were found exclusively in ‘Bhagwa’, ‘Dabenzi’, ‘Taishanhong’, and ‘Tunisia’ cultivars, respectively. Phylogenetic clustering based on the presence of TE insertions in specific loci reflected the geographic origins of the cultivars. The insertion time profiles of LTR-REs were studied in the four cultivars. Shared elements across the four cultivars exhibited, on average, a more ancient insertion date than those exclusive to three, two, or one cultivars. The majority of TEs were located within 1000 bp from the nearest gene. This localization was observed for 57% of DNA TEs and 55% of long-terminal repeat retrotransposons (LTR-RE). More than 10% of TEs resulted inserted within genes. Concerning DNA TEs, 3.91% of insertions occurred in introns, while 2.42% occurred in exons. As to LTR-REs, 4% of insertions occurred in exons and 1.98% in introns. Functional analysis of the genes lying close to TEs was performed to infer if differences in TE insertion can affect the fruit quality. Two TE insertions were found close to two genes encoding 4-coumarate--CoA ligase, an enzyme involved in the phenylpropanoid pathway. Moreover, a TIR/Mariner element was found within the exon of a gene encoding anthocyanidin reductase in the ‘Tunisia’ genotype, crucial in the biosynthesis of flavan-3-ols and proanthocyanidins, strictly correlated with the nutraceutical properties of pomegranate. Although functional and metabolomic studies are essential to elucidate the consequences of TE insertions, these results contribute to advancing our comprehension of the role of TEs in pomegranate genomics, providing insights for crop breeding.

1. Introduction

The pomegranate stands out as an economically important tree species due to the nutraceutical attributes of its fruits and finds widespread consumption in various forms, including as fresh fruit, juice, wine, and medicinal products [1,2]. Globally, it is cultivated across approximately 0.55 million hectares, yielding a total production of about 6.5 million tonnes, and it is considered an important crop in semi-arid tropical areas [3]. Pomegranate has a short history of extensive breeding and artificial selection, generally followed by vegetative propagation [4], with well-defined and maintained cultivars. The genome is relatively small (328 Mb), and currently, high-quality genomes of four cultivars of different origins have been sequenced at the chromosome or scaffold level.
The first pomegranate genome assembly for the Chinese cultivar ‘Dabenzi’, based on short-read sequencing, was released by Qin [5]. This assembly unveiled a whole-genome duplication event specific to the Myrtales lineage, which occurred in the common ancestor before the pomegranate and eucalyptus diverged. Subsequently, Yuan [6] released the genome of the Chinese cultivar ‘Taishanhong’, resolving the previously disputed taxonomic classification of the Punica genus and reclassifying it within the Lythraceae family. In 2020, Luo [4] published a high-quality draft genome sequence (based on long-read sequencing) for the soft-seeded ‘Tunisia’ cultivar. They also performed resequencing of 26 genetically diverse pomegranate varieties, varying in terms of seed hardness and geographical distribution, to elucidate the genetic distinctions between soft-seeded and hard-seeded cultivars. Finally, in 2022, the genome of the most diffused Indian cultivar, ‘Bhagawa’, was sequenced and assembled [7], which showed high syntenic relationships between ‘Bhagawa’ and ‘Dabenzi’.
Genome sequences allowed to clarify many aspects of pomegranate metabolism and development. Putative genes involved in anthocyanin and punicalagin (ellagitannins unique to pomegranate) metabolism were identified [5]. They reported that the INNER NO OUTER (INO) gene was under positive selection and likely played a role in developing the fleshy outer layer of the seed coat, the edible part of the pomegranate fruit. Yuan [6] used the genome sequence to clarify ellagitannin-based compound biosynthesis, the evolution of the anthocyanin biosynthetic pathway, and the peculiar ovule development processes in pomegranates. Luo [4] identified loci encoding SUC8-like and SUC6, involved in sucrose allocation, transport, and seed hardness. Sowjanya [7] identified important genes for resistance/susceptibility to major diseases and pests, such as bacterial blight, Ceratocystis wilt, and fruit-sucking moths. Despite these advances, there is still an important lack of information concerning an essential fraction of the genome—the one constituted by repeated sequences. Pomegranate transposable elements (TEs) remain only partially characterized, presenting an intriguing area for further exploration, also concerning intraspecific variability.
TEs are DNA sequences capable of autonomously moving within the genome through specific transposition mechanisms. TEs are classified into two principal classes: retrotransposons (REs), or Class I TEs, and DNA TEs, also known as Class II TEs. Both these classes comprise autonomous and non-autonomous elements, depending on the presence or absence of specific open reading frames encoding transposon-related proteins. DNA TEs use a “cut-and-paste” mechanism for transposition, while REs use a “copy-and-paste” replication mechanism that necessitates an intermediate RNA molecule [8] and implies the proliferation of the element.
It is widely acknowledged that TEs constitute the majority of plant genomes. For instance, the sunflower genome (Helianthus annuus) is composed of over 81% TEs [9], bread wheat (Triticum aestivum) exhibits TEs for over 85% of its genome [10] and, similarly, around 85% of the maize genome (Zea mays) is composed of TEs [11].
In plants, the most abundant TEs are REs, especially those characterized by long-terminal repeat (LTR) sequences. The two flanking LTRs vary in size from a few hundred base pairs to over 10 kb, and complete autonomous elements include coding segments with two open reading frames (ORFs) for element replication and integration within the host genome. The two ORFs consist of “gag”, which encodes a virus-like particle structural protein, and “pol”, which encodes a polyprotein with protease, reverse transcriptase, RNaseH, and integrase enzyme domains [12]. LTR-REs of higher plants are separated into the Copia and Gypsy superfamilies, differing in the position of the integrase domain within the polyprotein [13]. The two major superfamilies are further categorized into distinct evolutionary lineages, primarily based on the sequence similarities within their coding regions. Notably, in most plant species among Gypsy REs, the Chromovirus lineage is prevalent, including Galadriel, Tekay, Reina, and CRM sublineages, which are characterized by a chromodomain at the 3′ end of the coding sequence. In particular, Chromovirus/CRM elements are mainly located in the centromeres and in the pericentromeric regions, where they probably play a structural role [14,15,16,17] participating in plant centromere evolution [18]. Conversely, the non-Chromovirus Gypsy lineages, including Athila, Tat, Ogre, and Retand sublineages, lack the chromodomain. As for Copia REs, they encompass key lineages like Ale, Ivana, Ikeros, Tork, Alesia, Angela, Bianca, SIRE, and TAR [17].
As for DNA TEs, these sequences consist of a transposase gene flanked by two terminal inverted repeats (TIRs). DNA TEs are classified into different families depending on their coding sequence, TIRs, and/or TSDs. Some of the best-known subclass I families include Tc1/mariner, PIF/Harbinger, hAT, Mutator, Merlin, Transib, P, piggyBac, and CACTA [19]. Helitron and Maverick TEs belong to subclass II, as they use a different transposition and insertion mechanism [19,20,21,22]. Among the non-autonomous DNA TEs, the miniature inverted-repeat transposable elements (MITEs) are the most common in many eukaryotes, especially in plants [23].
TEs can rapidly increase in number, driving their proliferation. Conversely, the TE component of a genome can also reduce its abundance through mechanisms like unequal homologous and illegitimate recombination that produces the so-called “solo-LTRs” [24,25,26].
The activity of TEs can lead to a broad spectrum of alterations of genome structure, gene expression, and functionality [27]. These alterations can have detrimental, neutral, or even advantageous effects to the host [28]. For instance, TEs can promote chromosome rearrangements by facilitating unequal homologous recombination between sites located at a distance from each other, either within the same chromosome or across different chromosomes [29] leading to gene deletion, translocation, and inversion. TEs can also participate in the formation of novel regulatory networks and the creation of new genes through processes like exon shuffling and the mechanism of exaptation [20,30].
Even more significantly, TEs can be inserted within or in proximity to a gene. The insertion within the coding region of a gene can modify gene functionality or give rise to new splicing patterns, resulting in mutations and alterations in the encoded protein [22,31,32]. It is also well-documented that TEs are often situated within less than 2 kb either upstream or downstream from the genes themselves [33]. These modifications can lead to putative phenotypic variations, as observed in sunflowers [9], orange tree [34], and four cucurbit species [35]. Particularly, TE integration into regulatory regions, influencing promoter functionality and cis-regulatory mechanisms, can result in abnormal gene expression, even in response to different stimuli [36,37,38,39]. In certain grape varieties, the loss of pigmentation can be attributed to the insertion of a RE into the promoter region of a MYB transcription factor gene [40]. Similarly, the insertion of a RE into the upstream promoter region of the apple MdMYB1-1 gene is associated with the red fruit skin phenotype [41].
This work aimed to characterize the repetitive component of the pomegranate genome, making a comparative analysis of the abundance and evolutionary dynamics of TEs in the four sequenced genomes. Moreover, the insertion of TEs in proximity or within genes was also assessed at a genome-wide level in the four cultivars to hypothesize the possible functional implications of TE activity in P. granatum genetic diversity.

2. Materials and Methods

2.1. Collection of Sequence Data for the Four Pomegranate Cultivars

The collection of four genome assemblies belonging to different P. granatum L. cultivars were downloaded from the National Center for Biotechnology Information (NCBI, https://www.ncbi.nlm.nih.gov/datasets/genome; accessed on 3 July 2023). The cultivar ‘Dabenzi’ (Bioproject PRJNA360679), ‘Taishanhong’ (Bioproject PRJNA355913), ‘Tunisia’ (Bioproject PRJNA565884), and ‘Bhagwa’ (Bioproject PRJNA445950) were used for all the subsequent analyses [4,5,6,7].

2.2. Collection and Abundance Estimation of Full-Length Transposable Elements

The four pomegranate genomes were scanned for Class I and II TEs using EDTA v1.9.3 [42]. EDTA implementing a combination of LTR_FINDER v1.06 [43], LTRharvest v1.5.10 [44], and LTR_retriever v2.5 [45] was used for the search of LTR-REs. Generic Repeat Finder v1.0.2 [46] and TIR-Learner v1.18 [47] were used for the identification of DNA MITE and TIR elements, respectively. HelitronScanner v1.1 [48] was used for searching the Helitron elements. All the program parameters were automatically set, as reported in the default pipeline [42], and only full-length TEs were retained for analysis. For the lineage-level classification of LTR-REs, the elements were subjected to domain-based annotation using DANTE v1.1.8, accessible on the RepeatExplorer2 Galaxy-based website (https://repeatexplorer-elixir.cerit-sc.cz/galaxy/; accessed on 17 July 2023). The annotation was carried out with default settings, using the REXdb database of transposable element protein domains [17] and applying a BLOSUM80 scoring matrix. Protein matches were subsequently filtered based on their significance, following the parameters provided by the platform. For abundance estimation, the libraries of LTR-REs, MITEs, TIRs, and Helitrons obtained using EDTA were merged and used to mask the whole four genomes using RepeatMasker v4.1.5 [49] with the following parameters: -no_is, -nolow, -X.

2.3. Identification of Shared Transposable Element Insertion Sites and Phylogenetic Analysis

To determine the position of the full-length TEs across the four genome assemblies, i.e., to identify TEs inserted at genomic loci that are common or not across the four cultivars, we exploited the flanking regions of the elements themselves. All the previously obtained libraries of full-length LTR-REs, MITEs, TIRs, and Helitrons were used for this analysis. Each element was extracted from the corresponding genome assembly with 1000 bp extended downstream and upstream. This procedure was carried out using the “getfasta” function within BEDTools v2.30.0 [50]. Subsequently, all the extended TEs were subjected to clustering using CD-HIT v4.7 with the “s” parameter set to 0.9 [51]. Full-length elements at the same locus in all four genome assemblies were grouped into a single cluster, resulting in a cluster with four elements. For instances where an element occurred at the same locus in three out of four genome assemblies, these were grouped into a single cluster, and so forth. Elements exclusive to a single genome were isolated into separate clusters, each with one element. Ambiguous clusters were manually curated.
Data on the presence/absence of TEs were used to evaluate the phylogenetic relationships among the four pomegranate cultivars. These data were transformed into a matrix dataset and utilized to conduct a hierarchical clustering analysis using the UPGMA method. The analysis was executed with the R package “pvclust” v2.2-0, supported by 10,000 bootstrap replications [52]. A graphical representation of the data was produced using the “ggplot2” R package v3.4.1 [53].

2.4. Localization of Shared Transposable Element Insertion Sites in Genes or Their Proximity

To determine the positional relationship between TEs and protein-coding genes across the four genome assemblies, we extracted 1000 bp upstream and downstream of each full-length TE inserted using BEDTools. The extracted sequences were joined and aligned on the ‘Tunisia’ transcriptome using BLAST tool v2.6.0+ by a blastn search [54], enabling us to identify TE insertion sites compared to genes. If the entire joined sequence aligned to a transcript, indicated a TE inserted into exon. Conversely: (i) if one end of the joined sequence aligned to the transcript indicated the TE position within an intron or in an intergenic region; (ii) if both ends of the joined sequence aligned to the transcript, yet with a non-overlapping internal portion, indicated TE positioning within an intron. Lastly, we identified TEs in proximity to genes by comparing genome coordinates of protein-coding genes with those of TEs in all four genome assemblies, within a maximum distance of 1000 bp upstream or downstream of the genes using BEDTools “intersect” function. We conducted a 2-way ANOVA to assess the primary sources of data variation attributed to both cultivars and TE insertions. The statistical analysis was carried out with GraphPad PRISM v9.0.0 (GraphPad Software, Inc., La Jolla, CA, USA).

2.5. Profiling the Insertion Time of Full-Length LTR-Retrotransposons

The insertion time of different LTR-RE lineages was assessed by computing the distributions of pairwise divergence comparisons of the 5′- and 3′-LTRs. LTR pairwise alignments were calculated using the “stretcher” tool of the EMBOSS v6.6.0.0 suite, applying the Kimura two-parameter model of sequence evolution [55]. Distance matrices were generated using the “distmat” tool within the same suite [56]. To estimate the insertion times of lineages with at least ten full-length LTR-REs in the four genome assemblies, a mutation rate of 4.72 × 10⁻⁹, i.e., two-fold the rate calculated for synonymous substitutions in gene sequences in Populus trichocarpa [57] was used. This adjustment accounts for the fact that LTR-REs accumulate mutations at twice the rate of gene sequences [58]. Peaks in frequency distribution were interpreted as transposition burst events, where lower divergence values suggested recent proliferation [59]. Insertion times of LTR-REs among the four pomegranate genotypes and their genomic locations were tested with ANOVA, followed by post-hoc analyses using Tukey’s method. Outlier values were automatically removed from analysis by the software, while separate tests were performed for the Gypsy and Copia superfamilies. Finally, Statistical analysis was carried out using GraphPad PRISM, with a graphical representation of the data generated by “ggplot2” R package.

2.6. Functional Analysis of Genes in Proximity to or Interrupted by Transposable Elements

To infer the impact of TEs on gene function, we analysed the Gene Ontology (GO) functional annotations of genes lying nearby or interrupted by TEs. The GO terms were derived from the annotated ‘Tunisia’ genome [4]. For the GO enrichment analysis on genes in proximity to or interrupted by TEs compared to the entire transcriptome, we utilized Blast2GO v5.2.5, employing Fisher’s exact test (p-value < 0.05) [60]. Subsequently, KEGG Orthology (KO) id codes of corresponding genes were submitted to KEGG for pathway network analysis (Kyoto Encyclopaedia of Genes and Genomes) [61]. Subsequently, REVIGO was used to remove redundant GO terms with the parameter “tiny similarity” [62].

3. Results

3.1. Collection and Estimation of Abundance of Full-Length Transposable Elements

The genome assemblies of the four available pomegranate cultivars, namely ‘Bhagwa’, ‘Dabenzi’, ‘Taishanhong’, and ‘Tunisia’, were scrutinized to isolate full-length TEs belonging to both Class I and Class II. Overall, we identified a total of 8404 TEs (Table 1, Supplementary Data S1–S4). The highest number of elements was found in the ‘Bhagwa’ genome, with a total of 2511. A similar amount was retrieved in the ‘Tunisia’ genome, with a total of 2465 elements. The analyses of the ‘Taishanhong’ and ‘Dabenzi’ genomes returned 1822 and 1606 elements, respectively.
Regarding Class I elements, the Copia lineages identified were Ale, Alesia, Angela, Ikeros, Ivana, TAR, and Tork. The Ale lineage was abundant in all four genome assemblies (Table 1), predominating in the ‘Taishanhong’ and ‘Dabenzi’ genomes. However, in the ‘Tunisia’ and ‘Bhagwa’ genomes, the Angela lineage was the most abundant. Interestingly, Angela elements were present in significantly fewer copies in the ‘Taishanhong’ and ‘Dabenzi’ genomes. Another notable difference can be observed concerning the Tork lineage, which was highly represented in the ‘Tunisia’ and ‘Bhagwa’ genomes but less abundant in the ‘Taishanhong’ and ‘Dabenzi’ genomes.
As for the Gypsy superfamily, the lineages identified in the four genome assemblies were Chromovirus, including the four sublineages CRM, Galadriel, Reina, and Tekay, and non-Chromovirus, including Athila and Tat/Ogre. Most identified elements belonged to the Chromovirus/CRM lineage. A considerable disparity in the number of non-Chromovirus/Tat/Ogre elements was also observed by comparing ‘Taishanhong’ and ‘Dabenzi’ to the ‘Bhagwa’ and ‘Tunisia’ genomes, with the latter showing a much higher amount.
Concerning Class II TEs, the number of full-length elements in the four genome assemblies was comparable (Table 1). In particular, hAT, CACTA, PIF/Harbinger, Mutator, Tc1/Mariner (for both TIR and MITE superfamilies), and Helitron elements were identified. Mutator elements, considering TIR and MITE superfamilies, were the most abundant in the four pomegranate genome assemblies. The least abundant were the Tc1/Mariner elements. Noteworthy, a relatively large number of Helitron elements were detected to a similar frequency in all four genome assemblies.
The abundance of TEs was evaluated across the four genotypes by masking each genome assembly with TE libraries. Overall, TE abundance resulted highly variable, ranging from 41.67 to 52.45% of ‘Taishanhong’ and ‘Bhagwa’, respectively.
The total content of LTR-REs was higher in ‘Bhagwa’ and lower in the ‘Taishanhong’ genome. The overall abundance of Gypsy was approximately two-fold greater than Copia regarding the ‘Tunisia’, ‘Bhagwa’, and ‘Dabenzi’ genomes. In the case of ‘Taishanhong’, the difference in abundance of the two LTR-RE superfamilies is reduced.
Among the Copia LTR-REs, Angela was the most abundant lineage (above 1.79%), except in the ‘Taishanhong’ genome, where Ale was the most represented (1.79%). On the contrary, Ale was the second most abundant lineage among ‘Dabenzi’, ‘Tunisia’, and ‘Bhagwa’ (ranging from 1.44 to 1.62%). The lineage non-Chromovirus/Tat/Ogre, which belongs to the Gypsy superfamily, was the most abundant LTR-RE in all four pomegranate genomes (Table 2).

3.2. Identification and Phylogenetic Analysis of Shared Transposable Element Insertion Sites

In relation to the TEs identified and annotated in the four pomegranate cultivars, we determined if each TE position was maintained across the four genome assemblies through a clustering approach. The analysis produced 5025 clusters, each composed of one to four elements (Supplementary Table S1), according to whether an element was exclusive to a single genome or shared across multiple genomes. The clusters were categorized to represent the number of shared TE insertions for every genotype combination in relation to the element class (Table 3, Supplementary Table S2).
In total, we identified 73 TEs at the same genomic loci in all four genome assemblies, comprising 23 REs and 50 DNA TEs. Regarding elements shared by three genotypes, the ‘Dabenzi’, ‘Taishanhong’, and ‘Tunisia’ assemblies presented the highest number, totalling 211 shared TEs (38 REs and 173 DNA TEs). The three genotypes with the fewest shared elements were ‘Bhagwa’, ‘Dabenzi’, and ‘Tunisia’, with a total of 81 TEs (17 REs and 64 DNA TEs).
Among the four genome assemblies, ‘Bhagwa’ possessed the highest number of exclusive elements, totalling 947 (comprising 621 REs and 326 DNA TEs), closely followed by ‘Tunisia’ with 878 exclusive elements (including 554 REs and 324 DNA TEs).
Nevertheless, it is important to highlight that the failure to identify certain TEs in specific loci may depend on the accuracy of the assembly and the sequencing technologies used, potentially over-rating the differences among genomes.
The presence/absence data of TEs in the four pomegranate genomes were used to investigate the relationship among cultivars (Figure 1, Supplementary Table S3). The resulting dendrogram showed that ‘Taishanhong’ and ‘Dabenzi’ genomes exhibit a closer phylogenetic relationship to each other compared to ‘Tunisia’ and ‘Bhagwa’. This relationship probably reflects the geographical origins of these cultivars, where ‘Taishanhong’ and ‘Dabenzi’ were of Chinese origin, and ‘Tunisia’ and ‘Bhagwa’ originated from Tunisia and India, respectively.

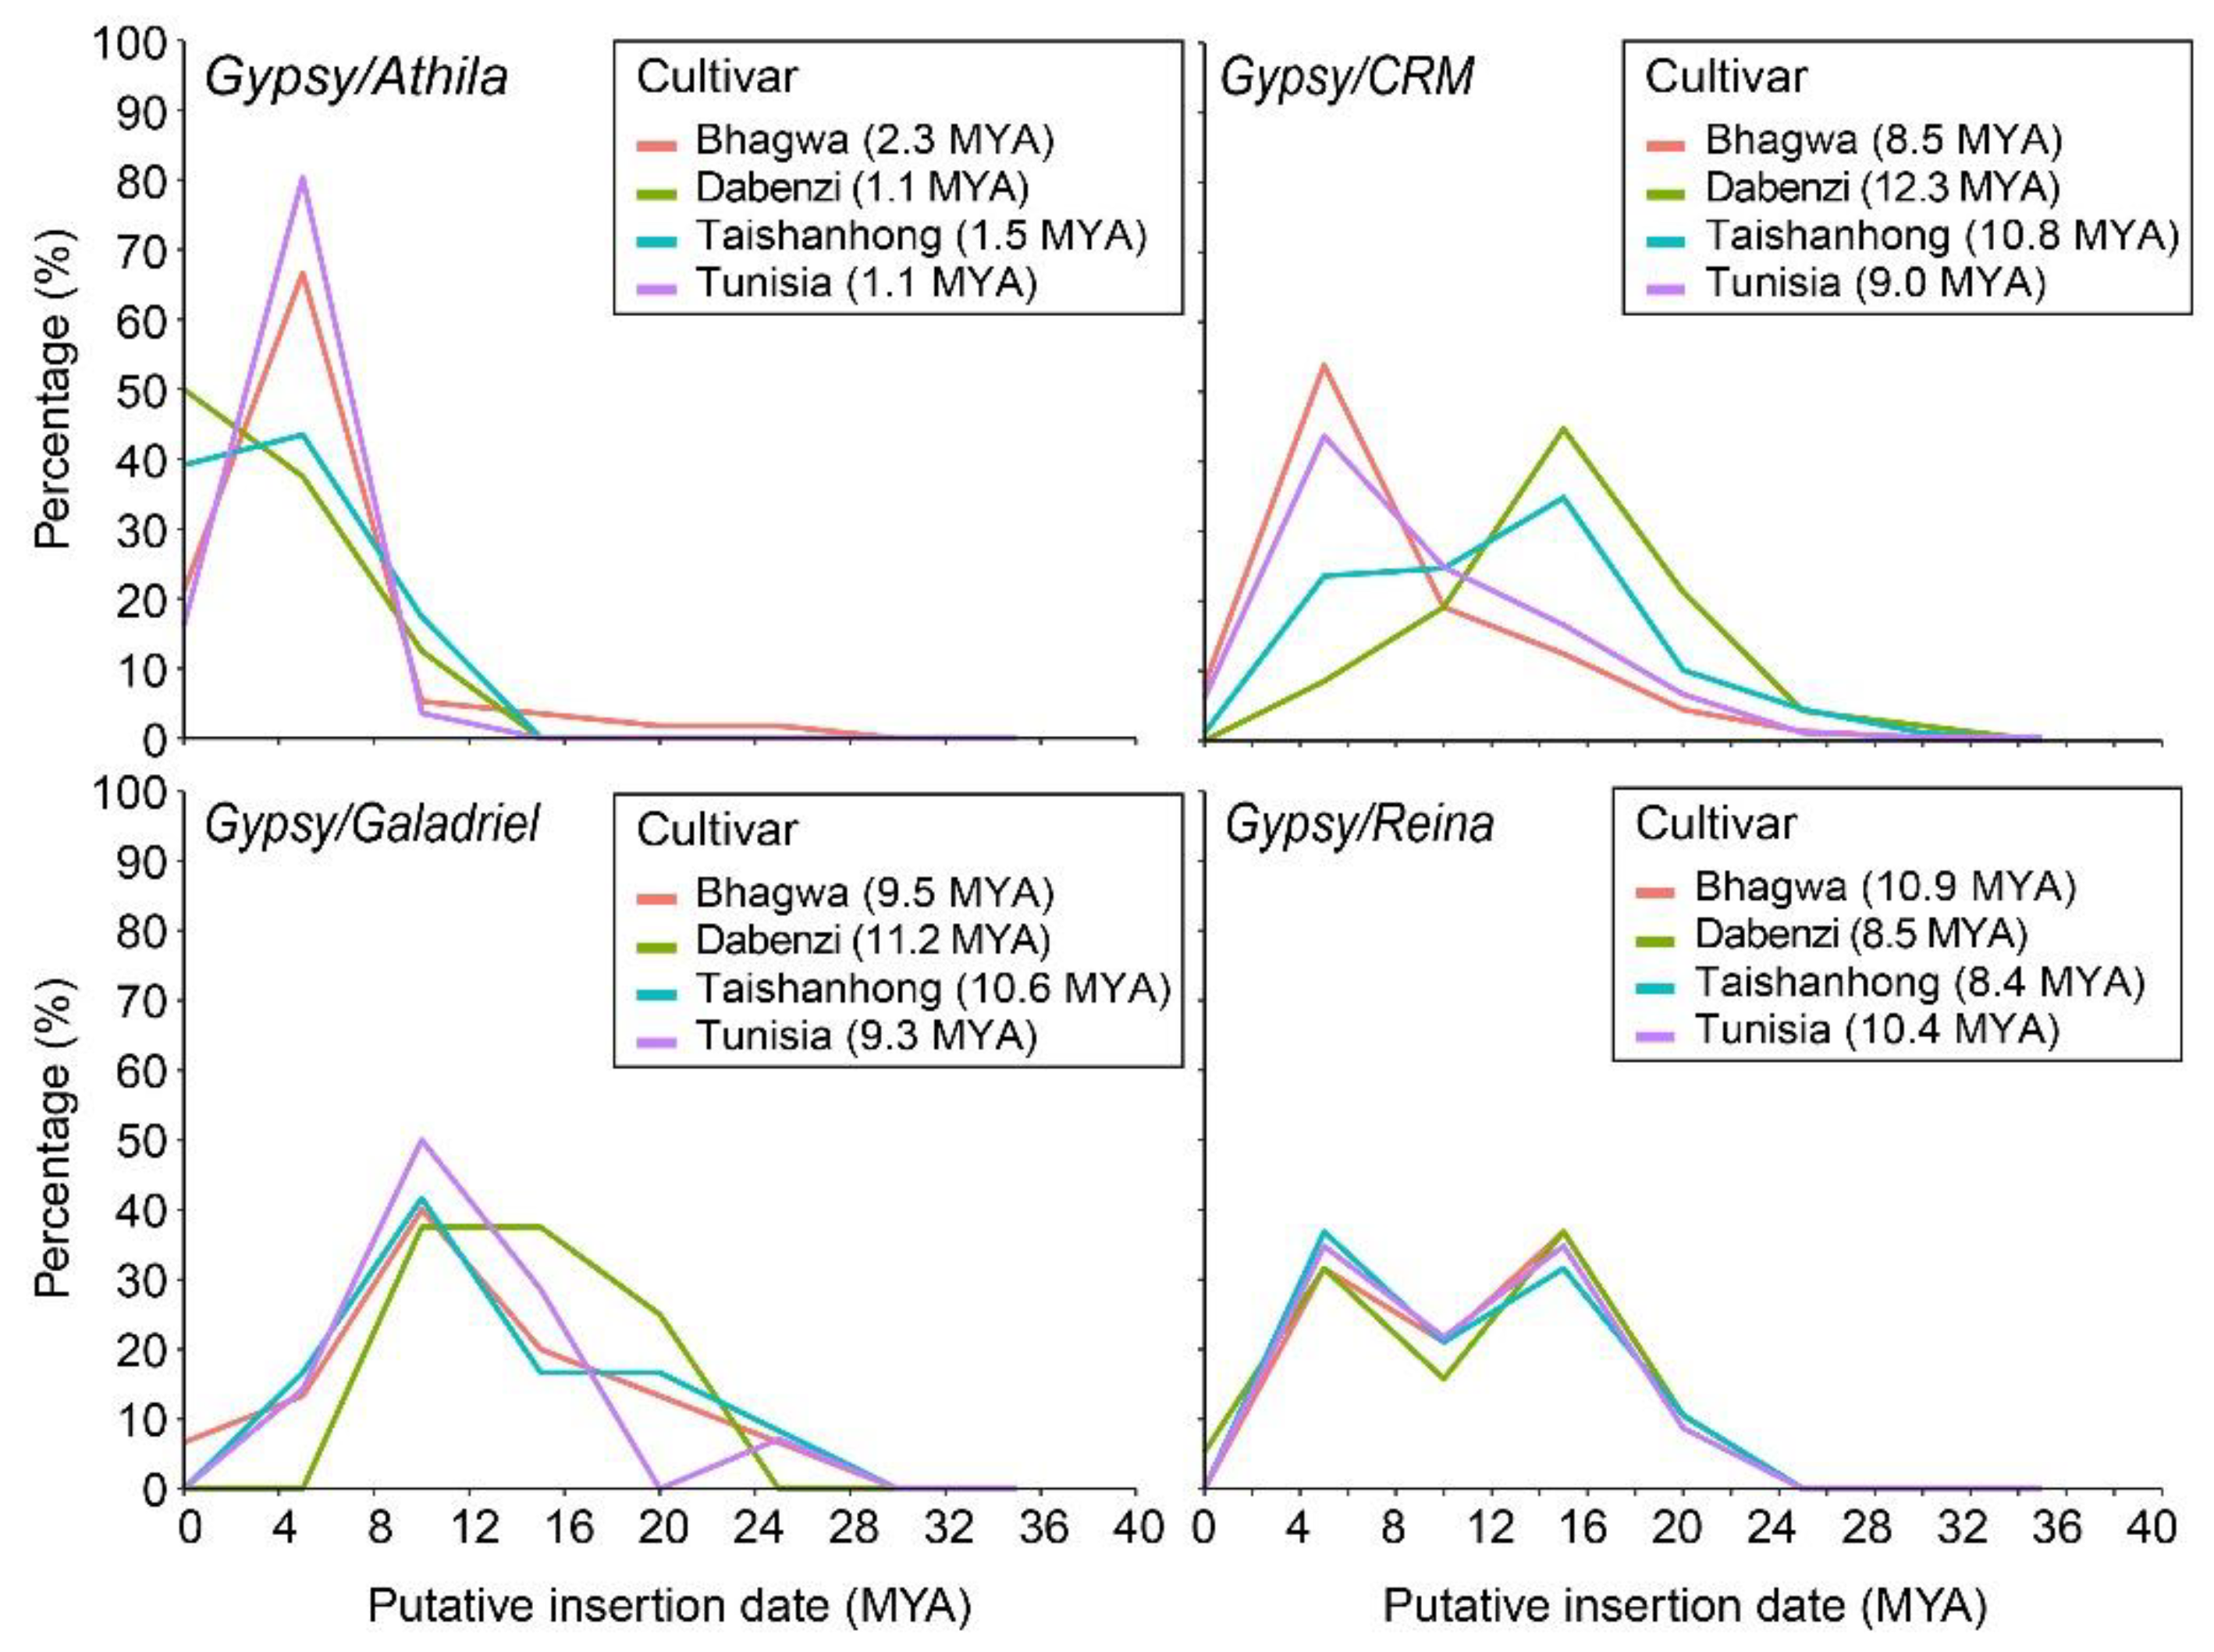
3.3. Profiling the Insertion Time of Full-Length LTR-Retrotransposons

The proliferation time profiles of the full-length LTR-REs were inferred in the four pomegranate genome assemblies by measuring pairwise distances between the LTRs of each element, based on the principle that the two LTR sequences of a RE are identical immediately after the insertion event and then accumulate mutations over time (see Section 2). Although LTR-RE age calculation based on this assumption is subjected to errors due to casualties in mutation events, this method still appears to be the most useful for inferring RE proliferation dynamics [55]. In pomegranate, this analysis showed the proliferation of Copia and Gypsy REs in the last 40 million years (Figure 2 and Figure 3).
The cultivars presented similar putative TE insertion time profiles, with differences specific to each LTR-RE lineage. Most of the lineages of the Copia superfamily showed a proliferation peak about six million years ago (MYA) (Figure 2), except for elements belonging to lineages TAR and Tork that showed older proliferation peaks in ‘Taishanhong’ and ‘Dabenzi’, respectively. The Ikeros lineage presented a more ancient proliferation peak at 16 MYA in the four cultivars. The Tork elements of the ‘Tunisia’ cultivar were identified as the youngest (average insertion time of 3 MY), while the Ikeros elements of the ‘Dabenzi’ and ‘Tunisia’ cultivars resulted the oldest (average insertion time of 15.2 MY).
As regards the Gypsy superfamily, the lineages generally showed a different proliferation activity compared to Copia (Figure 3). The Athila lineage showed a proliferation peak at 5 MYA in all cultivars except for ‘Dabenzi’, in which this lineage appears to be still proliferating. The lineage Galadriel displayed a proliferation peak at 10 MYA, whereas the Reina lineage showed a pattern with two proliferation peaks, one at 5 MYA and one at 15 MYA in all genotypes. CRM lineage exhibited the oldest proliferation peak at 16 MYA in ‘Taishanhong’ and ‘Dabenzi’ cultivars, whereas the transposition burst in ‘Bhagwa’ and ‘Tunisia’ is observed at 5 MYA. The Athila elements of the ‘Dabenzi’ and ‘Tunisia’ cultivars were identified as the youngest (average insertion time of 1.1 MY), while the CRM elements of the ‘Dabenzi’ cultivar were the oldest (average insertion time of 12.3 MY).
The putative insertion times of the LTR-REs were also analysed in relation to the presence of the same element in the same locus in four, three, or two genotypes or to its presence in one specific genotype (Figure 4). Overall, the LTR-REs shared in the same genomic loci across all four pomegranate genome assemblies had a higher average insertion date than elements shared between three or two cultivars or specific to one cultivar. In brief, the more elements are shared at the same locus among cultivars, the older their average insertion date is.

3.4. Localization of Shared TE Insertion Sites in Genes or Their Proximity

To identify TEs inserted in proximity or within gene regions (either exons or introns), 2000 bp-long sequences retrieved for each full-length TE in the four genomes (joining 1000 bp upstream and 1000 bp downstream sequences) were aligned against the ‘Tunisia’ transcriptome (see Section 2). The alignments between entire joined sequences and gene transcripts indicated insertions into exons, while alignments of only one or both ends of the joined sequences to the transcripts indicated insertions in the introns or intergenic regions. Also, TE insertions in the proximity of genes were identified by comparing the genome coordinates of protein-coding genes with those of TEs and retaining all full-length elements lying within 1000 bp upstream or downstream of the coding portion of a gene.
Considering all the insertion sites identified in the four pomegranate genome assemblies for the instances where TEs are shared among, it was observed that most TEs were located near genes (within 1000 bp). This localization was consistent for DNA TEs and REs, with approximately 57% and 55% of insertion sites, respectively (Figure 5). Insertion sites far from genes (i.e., distance more than 1000 bp) represented approximately 36% of DNA TE and 38% of RE insertions. Insertions within gene exons and introns were rare for both DNA TEs and REs.
Detailed results of the distribution of TE insertions among all genotype combinations are reported in Supplementary Figure S1. The complete list of the genes showing TE insertions can be found in Supplementary Table S4.
The number of TEs in the proximity of genes ranged from 874 in ‘Dabenzi’ to 1278 in ‘Tunisia’. The number of TEs within exons in ‘Bhagwa’ and ‘Tunisia’ genomes was higher that of ‘Dabenzi’ and ‘Taishanhong’. The highest number of intronic TE insertions was found in the ‘Bhagwa’ genome assembly. In terms of data variation, the TE insertion location contributed the most to the variation (95.76%) compared to the variation provided by cultivars (Table 4).
The temporal insertion profile of LTR-REs in relation to their insertion locations was also explored (Supplementary Figure S2). This analysis showed no significant differences between the groups in both superfamilies. In the Copia superfamily, the average insertion ages varied from a minimum of 3.3 MYA for elements inserted into exons to a maximum of 4.2 MYA for those distant from genes. In the Gypsy superfamily, insertion ages ranged from 2.6 MYA for elements inserted in introns to a maximum of 6.2 MYA for those distant from genes.

3.5. Functional Analysis of Genes in Proximity to or Interrupted by Transposable Elements

The potential impact of TE insertions on the function of genes lying in proximity to the element or interrupted by the element was explored by functionally annotating these genes using Gene Ontology (GO) and KEGG enrichment analyses. The GO and KEGG codes of analysed genes can be found in Supplementary Table S6. GO enrichment analysis (Figure 6) showed that the most recurrent GO terms of the genes in proximity of at least one TE were ‘tetrapyrrole binding’ (GO:0046906), ‘heme binding’ (GO:0020037), ‘oxidoreductase activity, acting on paired donors, with incorporation or reduction of molecular oxygen’ (GO:0016705), and ‘iron ion binding’ (GO:0005506) (Figure 6a). The most abundant enriched GO terms associated with genes interrupted by a TE in the introns were ‘catalytic activity’ (GO:0003824), ‘hydrolase activity’ (GO:0016787), and ‘ATP binding’ (GO:0005524) (Figure 6b). Similarly, GO terms like ‘carbohydrate derivative binding’ (GO:0097367), ‘heterocyclic compound binding’ (GO:1901363), ‘adenyl ribonucleotide binding’ (GO:0032559), and ‘anion binding’ (GO:0043168), were the most represented for genes interrupted by a TE in the exons (Figure 6c).
KEGG analysis was performed to analyse the genes of the phenylpropanoid pathway (Table 5) that is crucial for producing polyphenolic compounds, the main secondary metabolites in pomegranate, including flavonoids, anthocyanins, and tannins that are of value for pomegranate fruits [2]. Some genes of the phenylpropanoid pathway were found to be located in the proximity of at least one TE or interrupted by one TE, suggesting that TE insertions might change the regulation of the metabolism of these compounds, contributing to biodiversity between cultivars (Table 5). Overall, we found genes encoding two flavonoid 3′-monooxygenase (F3′H) and two 4-coumarate--CoA ligase (4CL) located in the proximity of TEs. Furthermore, genes encoding an anthocyanidin reductase (ANR) and two peroxidases (POD) were found to be interrupted by a TE in the exonic region. No cases of TE insertion in intronic regions were identified.
For both F3′H genes, the TE proximal to the gene coexisted at the same genomic locus across all four pomegranate genome assemblies (Table 5). In both instances, the element belonged to lineages of the Copia superfamily; specifically, one was an Ale element, and the other was an Ivana element. Concerning the two 4CL genes, one exhibits a TE insertion at a shared genomic locus between ‘Bhagwa’ and ‘Taishanhong’. In this case, the element belonged to the Chromovirus/CRM lineage. The other 4CL gene was interrupted by an element belonging to the Helitron class shared among ‘Dabenzi’, ‘Taishanhong’, and ‘Tunisia’ cultivars.
Concerning cases where a TE is inserted within exonic gene regions, we observed an ANR gene, interrupted exclusively in the ‘Tunisia’ cultivar and belonging to the TIR/Mariner family (Table 5). Finally, the two POD genes were interrupted by two different Chromovirus/Reina elements. The first POD gene was interrupted in ‘Bhagwa’ and ‘Dabenzi’ genotypes, the second in ‘Taishanhong’ and ‘Tunisia’ cultivars.

4. Discussion

Our work provides a comprehensive characterization of full-length TEs in the genome of P. granatum through a comparative analysis of the genome assemblies of four pomegranate cultivars (i.e., ‘Bhagwa’, ‘Dabenzi’, ‘Taishanhong’, and ‘Tunisia’), focusing on the intraspecies variability of TE insertion loci and its possible functional implications.
The content of TEs varied among the four cultivars, ranging from 41.67 to 52.45%, in a proportion similar to that found in other small-sized genomes such as apple [63], pear [64], fig [65], and blackberry [66]. Most of the repeat component of the pomegranate genome is composed of LTR-REs. The common occurrence of these elements in the fraction of repeated sequences is a widespread characteristic of higher plant genomes, where REs account for one of the major forces driving genome size evolution [67,68,69]. Based on TEs abundance, the Chinese cultivars ‘Taishanhong’ and ‘Dabenzi’ differ from ‘Tunisia’ and ‘Bhagwa’ due to the lower abundance of the LTR-REs. In all four cultivars, Gypsy accounted for a larger proportion than Copia elements, confirming what is generally observed in the Angiosperms, with valuable exceptions, such as pear, date palm, and banana [70]. Notably, the Gypsy lineage Tat/Ogre was the most abundant in all four pomegranate genomes, as observed in pea [71] and 23 plant genomes belonging to the Fabeae tribe [72], indicating the importance of this lineage in determining the genome size evolution of pomegranate. The Copia superfamily abundance ranged between 4.67 to 5.63% in ‘Taishanhong’ and ‘Tunisia’, respectively. Similar results were observed in pomegranate by Qin [5] and Yuan [6], accounting for 4.8% and 5.87%, respectively. Concerning the Copia superfamily, except for ‘Taishanhong’, the Angela elements were the most frequent in all cultivars, followed by Ale, as observed in Stevia rebaudiana [73] and grape [74].
Our analysis identified only 73 full-length TEs shared across all four pomegranate genome assemblies. Conversely, the four genotypes showed a high number of elements uniquely present in one genotype. For example, ‘Bhagwa’ exhibited the highest number of exclusive elements (947), followed by ‘Tunisia’ (874) (Table 3). Hierarchical clustering based on TE presence/absence reflected a closer phylogenetic relationship between ‘Taishanhong’ and ‘Dabenzi’ cultivars, in line with their shared Chinese origin, distinct from ‘Tunisia’ and ‘Bhagwa’, which originated in Tunisia and India, respectively (Figure 1).
The number of TEs shared among the four genotypes can be underestimated because of genome misassembling. However, it is also plausible that in many cases TEs have been subjected to rearrangements and mutations so that the same full-length element could not be found at the same locus in all cultivars. It is possible that in some loci only TE remnants are maintained, which cannot be recognized by the bioinformatic tools used for identifying full-length TEs. The large number of TEs unique to single genotypes may also suggest that TE proliferation and/or insertions have occurred following the divergence of these genotypes, or that many full-length LTR-REs present in the progenitor have experienced TE removal by unequal recombination or by DNA loss [75].
The full-length LTR-REs were further characterized by their insertion time profiles, which evidenced transposition bursts, presumably associated with plant evolution [76]. The insertion time profiles for different LTR-RE lineages were similar among cultivars, although in some cases different transposition peaks were displayed (Figure 2 and Figure 3). The Copia superfamily showed that the insertions of the isolated full-length elements were relatively recent, with a transposition peak at 4–6 million years ago, except for the Ikeros lineage, where the transposition burst was around 15 million years ago.
Among Gypsy LTR-REs, the insertion times revealed a more ancient transposition burst of Chromovirus/Galadriel and Chromovirus/Reina lineages in all four cultivars compared to non-Chromovirus/Athila. Interestingly, in the cultivar ‘Dabenzi’ the Athila lineage has not yet reached the peak of proliferation. The transposition burst characterizing Chromovirus/CRM lineage occurred more recently in ‘Tunisia’ and ‘Bhagwa’ compared to the Chinese cultivars.
Relating the putative insertion dates of LTR-REs to the presence of the element at the same locus in one, two, three, or four cultivars, indicated that shared elements of both Copia and Gypsy superfamilies exhibited more ancient average insertion dates than those exclusive to individual cultivars (Figure 4). This coherence is logical, as the presence of shared elements among multiple genotypes should imply that their replication and insertion occurred before the divergence of these genotypes. The trend according to which the more an element is shared between the cultivars, the older its insertion, is generally statistically significant. However, in some cases, even full-length elements found only in one, two, or three cultivars, exhibit insertion ages older than the average (Figure 4). This could indeed suggest that very ancient TEs have either been lost from one or more genotypes after their separation or that these TEs have undergone rearrangements that prevented their recognition by the bioinformatic tools used for their identification.
Regarding full-length TE insertion sites, the majority were located within 1000 bp of the encoding portion of a gene (Figure 5). Overall, our results might be influenced by the identification of full-length TE itself. To identify the full-length RE the sequence must exhibit a conserved sequence, and a higher level of conservation may be more favored for TEs located in gene-rich regions that are less exposed to purifying selection. On the other hand, the tendency of TEs to lie near genes has already been observed especially in TE-rich species [28]. This tendency was observed for both DNA TEs (57%) and REs (55%). Less than 5% of full-length TEs and LTR-REs were found interrupting gene exons or introns, suggesting the occurrence of purifying selection against the insertion in the coding portions of genes, as expected because of the potentially negative effect of TE insertion for the gene functionality.
In several plant species, including tomato, soybean, melon, orange, sunflower, and others, functionally relevant TE insertions in the proximity of genes have been well-documented (reviewed by Fambrini [33]). The insertion of a TE near a gene can change its proximal promoter sequence, with possible consequences on the regulation of gene activity [28]; moreover, the inserted TE can modulate the expression rate of a close gene by inducing epigenetic modifications along the chromosomal locus [77].
Our data indicate that TE insertions occurred in the proximity of genes regardless of their function as determined by GO analysis, although some GO (for example those related to binding) resulted overrepresented, also when considering genes interrupted in their exonic portion by a TE (Figure 6). It is noteworthy that, among genes showing proximity to full-length TEs or interrupted in their transcribed portion by a full-length TE, some are involved in the phenylpropanoid biosynthetic pathway.
The pomegranate fruit, celebrated for its health benefits attributed to antioxidant polyphenolic compounds, such as flavonols, flavonoids, hydrolyzable tannins (ellagitannins), gallagic acid, punicalin, anthocyanins, and proanthocyanidins, has received considerable attention [78,79,80,81,82]. Among these secondary metabolites, anthocyanins are one of the most important flavonoids that contribute to the colour of fruits [83], and the content of these compounds was also characterised in the four cultivars whose genome is available. In particular, anthocyanin biosynthesis and the accumulation in ripe fruits occur earlier in ‘Tunisia’ than in ‘Dabenzi’ [84]. ‘Taishanhong’ displays bright red fruits at the ripe stage [6], boasting high total anthocyanin concentration [85]. Similarly, ‘Bhagwa’, the most widespread Indian cultivar, is distinguished by its high anthocyanin content [7].
Our results showed events of TE insertions close to two genes encoding 4-coumarate--CoA ligase (4CL), a pivotal enzyme in the phenylpropanoid pathway directing precursors toward various phenylpropanoids [86]. Notably, one of these insertions was observed in two genotypes, ‘Bhagwa’ and ‘Taishanhong’, of Indian and Chinese origin, respectively, suggesting an ancient, pre-divergence origin for this insertion. The other 4CL gene is shared among three genotypes, i.e., ‘Dabenzi’, ‘Taishanhong’, and ‘Tunisia’, indicating that the inserted TE was lost in the fourth genotype (‘Bhagwa’) or that TE insertion occurred after the divergence of the ‘Bhagwa’ genotype from the common ancestor of the other three genotypes.
Finally, a gene encoding anthocyanidin reductase (ANR) was found to be disrupted by a TIR/Mariner element inserted within the exon. ANR is pivotal in the biosynthesis of flavan-3-ols and proanthocyanidins (PAs) [87]; the significant presence of ellagitannins and anthocyanins in pomegranates, primarily in the form of flavan-3-ol monomers and dimers, enhances the nutraceutical properties of pomegranate juice, showing superior bioavailability compared to larger oligomers and polymers [82]. PAs, as condensed tannins, are usually associated with plant astringency and the darkening of fruit skin upon exposure to air. Increased ANR activity could potentially enhance astringency in plant tissues, like fruit skins and seeds. Interestingly, this insertion was only found in the Tunisian genotype. This could suggest a recent mobilization event exclusive of this genotype.
Changes in the phenylpropanoid phenotype have been induced by insertional mutagenesis in Arabidopsis thaliana [88]. Our data show that such insertional mutagenesis has occurred naturally in P. granatum, and such TE insertions can have induced changes in the phenylpropanoid profile of the pomegranate fruit, affecting nutraceutical properties of pomegranate juice.
In recent years, the availability of genomic resources, even for minor crops like pomegranate, has clarified important aspects related to the structure of the plant genome and potential functional aspects. Despite being challenging, characterizing the repetitive fraction and assessing the variability linked to TE abundance and insertions across different cultivars proves pivotal.
Undoubtedly, the profound impact of transposable elements on genome evolution is widely acknowledged, and this study represents an initial foray into comprehending their functional dynamics in pomegranate. Nevertheless, the functional influence of TEs in pomegranate, which extends beyond their proximity to genes, necessitates targeted functional analyses coupled with in-depth metabolomic studies. Exploring potential candidate targets through screening and evaluating the phenotypic effects of specific TE insertions will unravel the functional repercussions of TE activity. Overall, these elements can generate new genetic variants and be exploited as molecular markers to select plants with specific traits or facilitate genetic mapping, with potential implications for pomegranate breeding and crop improvement.

Supplementary Materials

The following supporting information can be downloaded at: https://www.mdpi.com/article/10.3390/horticulturae10020111/s1, Figure S1: Distribution of TEs among all genotype combinations, their insertion location and annotation. The genotype combination is shown above. The names of the genotypes were abbreviated as follows: Bh = ‘Bhagwa’, Da = ‘Dabenzi’, Ta = ‘Taishanhong’, Tu = ‘Tunisia’; Figure S2: Retrotransposon insertion time based on the insertion locations in the four pomegranate cultivars. Data for the Copia and Gypsy superfamilies are presented. The black bar represents each genotype combination’s average retrotransposon insertion time (in MYA). No significant differences were identified according to Tukey’s test. Table S1: ST_1; Table S2: ST_2; Table S3: ST_3; Table S4: ST_4; Table S5: ST_5. Data S1: Transposable element prediction in ‘Bhagwa’ genome assembly; Data S2: Transposable element prediction in ‘Dabenzi’ genome assembly; Data S3: Transposable element prediction in ‘Taishanhong’ genome assembly; Data S4: Transposable element prediction in ‘Tunisia’ genome assembly.

Author Contributions

L.N., T.G., F.M. and A.C. planned and designed the project. S.S., G.U., A.V. and M.C. performed the computational analysis. S.S. and G.U. wrote the manuscript with contributions from all authors. All authors have read and agreed to the published version of the manuscript.

Funding

University of Pisa: Project “Plantomics”.

Data Availability Statement

Publicly available datasets were analyzed in this study. This data can be found here: https://www.ncbi.nlm.nih.gov/ (accessed on 3 July 2023).

Conflicts of Interest

The authors declare no conflicts of interest.

References

  1. Patel, C.; Dadhaniya, P.; Hingorani, L.; Soni, M.G. Safety assessment of pomegranate fruit extract: Acute and subchronic toxicity studies. Food Chem. Toxicol. 2008, 46, 2728–2735. [Google Scholar] [CrossRef] [PubMed]
  2. Johanningsmeier, S.D.; Harris, G.K. Pomegranate as a functional food and nutraceutical source. Annu. Rev. Food Sci. Technol. 2011, 2, 181–201. [Google Scholar] [CrossRef]
  3. Sarkhosh, A.; Yavari, A.M.; Zamani, Z. (Eds.) The Pomegranate: Botany, Production and Uses; CABI: Wallingford, UK, 2020. [Google Scholar]
  4. Luo, X.; Li, H.; Wu, Z.; Yao, W.; Zhao, P.; Cao, D.; Yu, H.; Li, K.; Poudel, K.; Zhao, D.; et al. The pomegranate (Punica granatum L.) draft genome dissects genetic divergence between soft-and hard-seeded cultivars. Plant Biotechnol. J. 2020, 18, 955–968. [Google Scholar] [CrossRef]
  5. Qin, G.; Xu, C.; Ming, R.; Tang, H.; Guyot, R.; Kramer, E.M.; Hu, Y.; Yi, X.; Qi, Y.; Xu, X. The pomegranate (Punica granatum L.) genome and the genomics of punicalagin biosynthesis. Plant J. 2017, 91, 1108–1128. [Google Scholar] [CrossRef] [PubMed]
  6. Yuan, Z.; Fang, Y.; Zhang, T.; Fei, Z.; Han, F.; Liu, C.; Liu, M.; Xiao, W.; Zhang, W.; Wu, S.; et al. The pomegranate (Punica granatum L.) genome provides insights into fruit quality and ovule developmental biology. Plant Biotechnol. J. 2018, 16, 1363–1374. [Google Scholar] [CrossRef] [PubMed]
  7. Sowjanya, P.R.; Shilpa, P.; Patil, G.P.; Babu, D.K.; Sharma, J.; Sangnure, V.R.; Mundewadikar, D.M.; Natarajan, P.; Marathe, A.R.; Reddy, U.K.; et al. Reference quality genome sequence of Indian pomegranate cv.’Bhagawa’ (Punica granatum L.). Front. Plant Sci. 2022, 13, 947164. [Google Scholar] [CrossRef] [PubMed]
  8. Finnegan, D.J. Eukaryotic transposable elements and genome evolution. Trends Genet. 1989, 5, 103–107. [Google Scholar] [CrossRef]
  9. Mascagni, F.; Barghini, E.; Giordani, T.; Rieseberg, L.H.; Cavallini, A.; Natali, L. Repetitive DNA and plant domestication: Variation in copy number and proximity to genes of LTR-retrotransposons among wild and cultivated sunflower (Helianthus annuus) genotypes. Genome Biol. Evol. 2015, 7, 3368–3382. [Google Scholar] [CrossRef]
  10. Wicker, T.; Gundlach, H.; Spannagl, M.; Uauy, C.; Borrill, P.; Ramirez-Gonzalez, R.H.; De Oliveira, R. Impact of transposable elements on genome structure and evolution in bread wheat. Genome Biol. 2018, 19, 103. [Google Scholar] [CrossRef]
  11. Jiao, Y.; Peluso, P.; Shi, J.; Liang, T.; Stitzer, M.C.; Wang, B.; Campbell, M.S.; Stein, J.C.; Wei, X.; Chin, C.-S.; et al. Improved maize reference genome with single-molecule technologies. Nature 2017, 546, 524–527. [Google Scholar] [CrossRef]
  12. Kumar, A.; Bennetzen, J.L. Plant retrotransposons. Annu. Rev. Genet. 1999, 33, 479–532. [Google Scholar] [CrossRef] [PubMed]
  13. Gifford, R.J.; Blomberg, J.; Coffin, J.M.; Fan, H.; Heidmann, T.; Mayer, J.; Stoye, J.; Tristem, M.; Johnson, W.E. Nomenclature for endogenous retrovirus (ERV) loci. Retrovirology 2018, 15, 59. [Google Scholar] [CrossRef] [PubMed]
  14. Sharma, A.; Presting, G.G. Centromeric retrotransposon lineages predate the maize/rice divergence and differ in abundance and activity. Mol. Genet. Genom. 2008, 279, 133–147. [Google Scholar] [CrossRef]
  15. Gong, Z.; Wu, Y.; Koblížková, A.; Torres, G.A.; Wang, K.; Iovene, M.; Neumann, P.; Zhang, W.; Novák, P.; Buell, C.R.; et al. Repeatless and repeat-based centromeres in potato: Implications for centromere evolution. Plant Cell 2012, 24, 3559–3574. [Google Scholar] [CrossRef] [PubMed]
  16. Su, H.; Liu, Y.; Liu, Y.-X.; Lv, Z.; Li, H.; Xie, S.; Gao, Z.; Pang, J.; Wang, X.-J.; Lai, J.; et al. Dynamic chromatin changes associated with de novo centromere formation in maize euchromatin. Plant J. 2016, 88, 854–866. [Google Scholar] [CrossRef] [PubMed]
  17. Neumann, P.; Novák, P.; Hoštáková, N.; Macas, J. Systematic survey of plant LTR-retrotransposons elucidates phylogenetic relationships of their polyprotein domains and provides a reference for element classification. Mob. DNA 2019, 10, 1. [Google Scholar] [CrossRef]
  18. Neumann, P.; Navrátilová, A.; Koblížková, A.; Kejnovský, E.; Hřibová, E.; Hobza, R.; Widmer, A.; Doležel, J.; Macas, J. Plant centromeric retrotransposons: A structural and cytogenetic perspective. Mob. DNA 2011, 2, 4. [Google Scholar] [CrossRef]
  19. Muñoz-López, M.; García-Pérez, J.L. DNA transposons: Nature and applications in genomics. Curr. Genom. 2010, 11, 115–128. [Google Scholar] [CrossRef]
  20. Morgante, M.; Brunner, S.; Pea, G.; Fengler, K.; Zuccolo, A.; Rafalski, A. Gene duplication and exon shuffling by helitron-like transposons generate intraspecies diversity in maize. Nat. Genet. 2005, 37, 997–1002. [Google Scholar] [CrossRef]
  21. Wicker, T.; Sabot, F.; Hua-Van, A.; Bennetzen, J.L.; Capy, P.; Chalhoub, B.; Flavell, A.; Leroy, P.; Morgante, M.; Panaud, O.; et al. A unified classification system for eukaryotic transposable elements. Nat. Rev. Genet. 2007, 8, 973–982. [Google Scholar] [CrossRef]
  22. Bourque, G.; Burns, K.H.; Gehring, M.; Gorbunova, V.; Seluanov, A.; Hammell, M.; Imbeault, M.; Izsvák, Z.; Levin, H.L.; Macfarlan, T.S.; et al. Ten things you should know about transposable elements. Genome Biol. 2018, 19, 199. [Google Scholar] [CrossRef] [PubMed]
  23. Viviani, A.; Ventimiglia, M.; Fambrini, M.; Vangelisti, A.; Mascagni, F.; Pugliesi, C.; Usai, G. Impact of transposable elements on the evolution of complex living systems and their epigenetic control. Biosystems 2021, 210, 104566. [Google Scholar] [CrossRef] [PubMed]
  24. Devos, K.M.; Brown, J.K.; Bennetzen, J.L. Genome size reduction through illegitimate recombination counteracts genome expansion in Arabidopsis. Genome Res. 2002, 12, 1075–1079. [Google Scholar] [CrossRef] [PubMed]
  25. Vitte, C.; Panaud, O. Formation of solo-LTRs through unequal homologous recombination counterbalances amplifications of LTR retrotransposons in rice Oryza sativa L. Mol. Biol. Evol. 2003, 20, 528–540. [Google Scholar] [CrossRef] [PubMed]
  26. Wang, Q.; Dooner, H.K. Remarkable variation in maize genome structure inferred from haplotype diversity at the bz locus. Proc. Natl. Acad. Sci. USA 2006, 103, 17644–17649. [Google Scholar] [CrossRef] [PubMed]
  27. Oliver, K.R.; McComb, J.A.; Greene, W.K. Transposable elements: Powerful contributors to angiosperm evolution and diversity. Genome Biol. Evol. 2013, 5, 1886–1901. [Google Scholar] [CrossRef]
  28. Lisch, D. How important are transposons for plant evolution? Nat. Rev. Genet. 2013, 14, 49–61. [Google Scholar] [CrossRef]
  29. Pinosio, S.; Giacomello, S.; Faivre-Rampant, P.; Taylor, G.; Jorge, V.; Le Paslier, M.C.; Morgante, M. Characterization of the poplar pan-genome by genome-wide identification of structural variation. Mol. Biol. Evol. 2016, 33, 2706–2719. [Google Scholar] [CrossRef]
  30. Ventimiglia, M.; Marturano, G.; Vangelisti, A.; Usai, G.; Simoni, S.; Cavallini, A.; Giordani, T.; Natali, L.; Zuccolo, A.; Mascagni, F. Genome wide identification and characterization of exapted transposable elements in the large genome of sunflower (Helianthus annuus L.). Plant J. 2023, 113, 734–748. [Google Scholar] [CrossRef]
  31. Hirsch, C.D.; Springer, N.M. Transposable element influences on gene expression in plants. Biochim. Biophys. Acta Gene Regul. Mech. 2017, 1860, 157–165. [Google Scholar] [CrossRef]
  32. Drongitis, D.; Aniello, F.; Fucci, L.; Donizetti, A. Roles of transposable elements in the different layers of gene expression regulation. Int. J. Mol. Sci. 2019, 20, 5755. [Google Scholar] [CrossRef] [PubMed]
  33. Fambrini, M.; Usai, G.; Vangelisti, A.; Mascagni, F.; Pugliesi, C. The plastic genome: The impact of transposable elements on gene functionality and genomic structural variations. Genesis 2020, 58, e23399. [Google Scholar] [CrossRef] [PubMed]
  34. Wang, L.; Huang, Y.; Liu, Z.; He, J.; Jiang, X.; He, F.; Lu, Z.; Yang, S.; Chen, P.; Yu, H.; et al. Somatic variations led to the selection of acidic and acidless orange cultivars. Nat. Plants 2021, 7, 954–965. [Google Scholar] [CrossRef] [PubMed]
  35. Liu, H.N.; Pei, M.S.; Ampomah-Dwamena, C.; He, G.Q.; Wei, T.L.; Shi, Q.F.; Yu, Y.H.; Guo, D.L. Genome-wide characterization of long terminal repeat retrotransposons provides insights into trait evolution of four cucurbit species. Funct. Integr. Genom. 2023, 23, 218. [Google Scholar] [CrossRef] [PubMed]
  36. Hollister, J.D.; Smith, L.M.; Guo, Y.L.; Ott, F.; Weigel, D.; Gaut, B.S. Transposable elements and small RNAs contribute to gene expression divergence between Arabidopsis thaliana and Arabidopsis lyrata. Proc. Natl. Acad. Sci. USA 2011, 108, 2322–2327. [Google Scholar] [CrossRef] [PubMed]
  37. Dubin, M.J.; Scheid, O.M.; Becker, C. Transposons: A blessing curse. Curr. Opin. Plant Biol. 2018, 42, 23–29. [Google Scholar] [CrossRef]
  38. Schrader, L.; Schmitz, J. The impact of transposable elements in adaptive evolution. Mol. Ecol. 2019, 28, 1537–1549. [Google Scholar] [CrossRef]
  39. Vangelisti, A.; Simoni, S.; Usai, G.; Ventimiglia, M.; Natali, L.; Cavallini, A.; Mascagni, F.; Giordani, T. LTR-retrotransposon dynamics in common fig (Ficus carica L.) genome. BMC Plant Biol. 2021, 21, 221. [Google Scholar] [CrossRef]
  40. Kobayashi, S.; Goto-Yamamoto, N.; Hirochika, H. Retrotransposon-induced mutations in grape skin color. Science 2004, 304, 982. [Google Scholar] [CrossRef]
  41. Zhang, L.; Hu, J.; Han, X.; Li, J.; Gao, Y.; Richards, C.M.; Zhang, C.; Tian, Y.; Liu, G.; Gul, H.; et al. A high-quality apple genome assembly reveals the association of a retrotransposon and red fruit colour. Nat. Commun. 2019, 10, 1494. [Google Scholar] [CrossRef]
  42. Ou, S.; Su, W.; Liao, Y.; Chougule, K.; Agda, J.R.; Hellinga, A.J.; Lugo, C.S.B.; Elliott, T.A.; Ware, D.; Peterson, T.; et al. Benchmarking transposable element annotation methods for creation of a streamlined, comprehensive pipeline. Genome Biol. 2019, 20, 275. [Google Scholar] [CrossRef] [PubMed]
  43. Xu, Z.; Wang, H. LTR_FINDER: An efficient tool for the prediction of full-length LTR retrotransposons. Nucleic Acids Res. 2007, 35, W265–W268. [Google Scholar] [CrossRef] [PubMed]
  44. Ellinghaus, D.; Kurtz, S.; Willhoeft, U. LTRharvest, an efficient and flexible software for de novo detection of LTR retrotransposons. BMC Bioinform. 2008, 9, 18. [Google Scholar] [CrossRef] [PubMed]
  45. Ou, S.; Jiang, N. LTR_retriever: A highly accurate and sensitive program for identification of long terminal repeat retrotransposons. Plant Physiol. 2018, 176, 1410–1422. [Google Scholar] [CrossRef] [PubMed]
  46. Shi, J.; Liang, C. Generic repeat finder: A high-sensitivity tool for genome-wide de novo repeat detection. Plant Physiol. 2019, 180, 1803–1815. [Google Scholar] [CrossRef]
  47. Su, W.; Gu, X.; Peterson, T. TIR-Learner, a new ensemble method for TIR transposable element annotation, provides evidence for abundant new transposable elements in the maize genome. Mol. Plant 2019, 12, 447–460. [Google Scholar] [CrossRef]
  48. Xiong, W.; He, L.; Lai, J.; Dooner, H.K.; Du, C. HelitronScanner uncovers a large overlooked cache of Helitron transposons in many plant genomes. Proc. Natl. Acad. Sci. USA 2014, 111, 10263–10268. [Google Scholar] [CrossRef]
  49. Smit, A.F.A.; Hubley, R.; Green, P. RepeatMasker Open-4.0. 2013–2015. Available online: http://www.repeatmasker.org (accessed on 3 July 2023).
  50. Quinlan, A.R.; Hall, I.M. BEDTools: A flexible suite of utilities for comparing genomic features. Bioinformatics 2010, 26, 841–842. [Google Scholar] [CrossRef]
  51. Li, W.; Godzik, A. Cd-hit: A fast program for clustering and comparing large sets of protein or nucleotide sequences. Bioinformatics 2006, 22, 1658–1659. [Google Scholar] [CrossRef]
  52. Suzuki, R.; Shimodaira, H. Pvclust: An R package for assessing the uncertainty in hierarchical clustering. Bioinformatics 2006, 22, 1540–1542. [Google Scholar] [CrossRef]
  53. Wickham, H. Data analysis. In ggplot2. Use R! Springer: Cham, Switzerland, 2016. [Google Scholar] [CrossRef]
  54. Altschul, S.F.; Gish, W.; Miller, W.; Myers, E.W.; Lipman, D.J. Basic local alignment search tool. J. Mol. Biol. 1990, 215, 403–410. [Google Scholar] [CrossRef] [PubMed]
  55. Kimura, M.A. simple method for estimating evolutionary rates of base substitutions through comparative studies of nucleotide sequences. J. Mol. Evol. 1980, 16, 111–120. [Google Scholar] [CrossRef] [PubMed]
  56. Rice, P.; Longden, I.; Bleasby, A. EMBOSS: The European molecular biology open software suite. Trends Genet. 2000, 16, 276–277. [Google Scholar] [CrossRef] [PubMed]
  57. Mascagni, F.; Usai, G.; Natali, L.; Cavallini, A.; Giordani, T. A comparison of methods for LTR-retrotransposon insertion time profiling in the Populus trichocarpa genome. Caryologia 2018, 71, 85–92. [Google Scholar] [CrossRef]
  58. SanMiguel, P.; Gaut, B.S.; Tikhonov, A.; Nakajima, Y.; Bennetzen, J.L. The paleontology of intergene retrotransposons of maize. Nat. Genet. 1998, 20, 43–45. [Google Scholar] [CrossRef] [PubMed]
  59. Usai, G.; Mascagni, F.; Natali, L.; Giordani, T.; Cavallini, A. Comparative genome-wide analysis of repetitive DNA in the genus Populus L. Tree Genet. Genomes 2017, 13, 96. [Google Scholar] [CrossRef]
  60. Conesa, A.; Götz, S.; García-Gómez, J.M.; Terol, J.; Talón, M.; Robles, M. Blast2GO: A universal tool for annotation, visualization and analysis in functional genomics research. Bioinformatics 2005, 21, 3674–3676. [Google Scholar] [CrossRef] [PubMed]
  61. Kanehisa, M.; Goto, S. KEGG: Kyoto encyclopedia of genes and genomes. Nucleic Acids Res. 2000, 28, 27–30. [Google Scholar] [CrossRef]
  62. Supek, F.; Bošnjak, M.; Škunca, N.; Šmuc, T. REVIGO summarizes and visualizes long lists of gene ontology terms. PLoS ONE 2011, 6, 7. [Google Scholar] [CrossRef]
  63. Velasco, R.; Zharkikh, A.; Affourtit, J.; Dhingra, A.; Cestaro, A.; Kalyanaraman, A.; Fontana, P.; Bhatnagar, S.K.; Troggio, M.; Pruss, D.; et al. The genome of the domesticated apple (Malus × domestica Borkh.). Nat. Genet. 2010, 42, 833–839. [Google Scholar] [CrossRef]
  64. Wu, J.; Wang, Z.; Shi, Z.; Zhang, S.; Ming, R.; Zhu, S.; Khan, M.A.; Tao, S.; Korban, S.S.; Wang, H.; et al. The genome of the pear (Pyrus bretschneideri Rehd.). Genome Res. 2013, 23, 396–408. [Google Scholar] [CrossRef] [PubMed]
  65. Usai, G.; Mascagni, F.; Giordani, T.; Vangelisti, A.; Bosi, E.; Zuccolo, A.; Ceccarelli, M.; King, R.; Hassani-Pak, K.; Liceth, S.Z.; et al. Epigenetic patterns within the haplotype phased fig (Ficus carica L.) genome. Plant J. 2020, 102, 600–614. [Google Scholar] [CrossRef] [PubMed]
  66. Brůna, T.; Aryal, R.; Dudchenko, O.; Sargent, D.J.; Mead, D.; Buti, M.; Cavallini, A.; Hytönen, T.; Andrés, J.; Pham, M.; et al. A chromosome-length genome assembly and annotation of blackberry (Rubus argutus, cv. “Hillquist”). G3 2023, 13, jkac289. [Google Scholar] [CrossRef] [PubMed]
  67. Neumann, P.; Koblížková, A.; Navrátilová, A.; Macas, J. Significant expansion of Vicia pannonica genome size mediated by amplification of a single type of giant retroelement. Genetics 2006, 173, 1047–1056. [Google Scholar] [CrossRef] [PubMed]
  68. Christelová, P.; Valárik, M.; Hřibová, E.; De Langhe, E.; Doležel, J. A multi gene sequence-based phylogeny of the Musaceae (banana) family. BMC Evol. Biol. 2011, 11, 130. [Google Scholar] [CrossRef]
  69. Tenaillon, M.I.; Hufford, M.B.; Gaut, B.S.; Ross-Ibarra, J. Genome size and transposable element content as determined by high-throughput sequencing in maize and Zea luxurians. Genome Biol. Evol. 2011, 3, 219–229. [Google Scholar] [CrossRef]
  70. Vitte, C.; Fustier, M.A.; Alix, K.; Tenaillon, M.I. The bright side of transposons in crop evolution. Brief. Funct. Genom. 2014, 13, 276–295. [Google Scholar] [CrossRef]
  71. Kreplak, J.; Madoui, M.A.; Cápal, P.; Novák, P.; Labadie, K.; Aubert, G.; Burstin, J. A reference genome for pea provides insight into legume genome evolution. Nat. Genet. 2019, 51, 1411–1422. [Google Scholar] [CrossRef]
  72. Macas, J.; Novák, P.; Pellicer, J.; Čížková, J.; Koblížková, A.; Neumann, P.; Leitch, I.J. In depth characterization of repetitive DNA in 23 plant genomes reveals sources of genome size variation in the legume tribe Fabeae. PLoS ONE 2015, 10, e0143424. [Google Scholar] [CrossRef]
  73. Simoni, S.; Clemente, C.; Usai, G.; Vangelisti, A.; Natali, L.; Tavarini, S.; Angelini, C.L.; Cavallini, A.; Mascagni, F.; Giordani, T. Characterisation of LTR-retrotransposons of Stevia rebaudiana and their use for the analysis of genetic variability. Int. J. Mol. Sci. 2022, 23, 6220. [Google Scholar] [CrossRef]
  74. He, G.Q.; Jin, H.Y.; Cheng, Y.Z.; Yu, Y.H.; Guo, D.L. Characterization of genome-wide long terminal repeat retrotransposons provide insights into trait evolution of four grapevine species. J. Syst. Evol. 2023, 61, 414–427. [Google Scholar] [CrossRef]
  75. Usai, G.; Mascagni, F.; Vangelisti, A.; Giordani, T.; Ceccarelli, M.; Cavallini, A.; Natali, L. Interspecific hybridisation and LTR-retrotransposon mobilisation-related structural variation in plants: A case study. Genomics 2020, 112, 1611–1621. [Google Scholar] [CrossRef] [PubMed]
  76. Zhang, Q.J.; Gao, L.Z. Rapid and recent evolution of LTR retrotransposons drives rice genome evolution during the speciation of AA-genome Oryza species. G3 2017, 7, 1875–1885. [Google Scholar] [CrossRef] [PubMed]
  77. Arnaud, P.; Goubely, C.; Pelissier, T.; Deragon, J.M. SINE retroposons can be used in vivo as nucleation centers for de novo methylation. Mol. Cell Biol. 2000, 20, 3434–3441. [Google Scholar] [CrossRef] [PubMed]
  78. Gil, M.I.; Tomás-Barberán, F.A.; Hess-Pierce, B.; Holcroft, D.M.; Kader, A.A. Antioxidant activity of pomegranate juice and its relationship with phenolic composition and processing. J. Agric. Food Chem. 2000, 48, 4581–4589. [Google Scholar] [CrossRef] [PubMed]
  79. Longtin, R. The pomegranate: Nature’s power fruit? J. Natl. Cancer Inst. 2003, 95, 346–348. [Google Scholar] [CrossRef] [PubMed]
  80. Tzulker, R.; Glazer, I.; Bar-Ilan, I.; Holland, D.; Aviram, M.; Amir, R. Antioxidant activity, polyphenol content, and related compounds in different fruit juices and homogenates prepared from 29 different pomegranate accessions. J. Agric. Food Chem. 2007, 55, 9559–9570. [Google Scholar] [CrossRef] [PubMed]
  81. Sreekumar, S.; Sithul, H.; Muraleedharan, P.; Azeez, J.M.; Sreeharshan, S. Pomegranate fruit as a rich source of biologically active compounds. Biomed. Res. Int. 2014, 2014, 686921. [Google Scholar] [CrossRef]
  82. Díaz-Mula, H.M.; Tomás-Barberán, F.A.; García-Villalba, R. Pomegranate fruit and juice (cv. Mollar), rich in ellagitannins and anthocyanins, also provide a significant content of a wide range of proanthocyanidins. J. Agric. Food Chem. 2019, 67, 9160–9167. [Google Scholar] [CrossRef]
  83. Horbowicz, M.; Kosson, R.; Grzesiuk, A.; Dębski, H. Anthocyanins of fruits and vegetables-their occurrence, analysis and role in human nutrition. J. Fruit Ornam. Plant Res. 2008, 68, 5–22. [Google Scholar] [CrossRef]
  84. Zhao, J.; Qi, X.; Li, J.; Cao, Z.; Liu, X.; Yu, Q.; Qin, G. Metabolic Profiles of Pomegranate Juices during Fruit Development and the Redirection of Flavonoid Metabolism. Horticulturae 2023, 9, 881. [Google Scholar] [CrossRef]
  85. Zhu, F.; Yuan, Z.; Zhao, X.; Yin, Y.; Feng, L. Composition and contents of anthocyanins in different pomegranate cultivars. Acta Hortic 2015, 1089, 35–41. [Google Scholar]
  86. Lavhale, S.G.; Kalunke, R.M.; Giri, A.P. Structural, functional and evolutionary diversity of 4-coumarate-CoA ligase in plants. Planta 2018, 248, 1063–1078. [Google Scholar] [CrossRef] [PubMed]
  87. Zhao, L.; Jiang, X.L.; Qian, Y.M.; Wang, P.Q.; Xie, D.Y.; Gao, L.P.; Xia, T. Metabolic characterization of the anthocyanidin reductase pathway involved in the biosynthesis of Flavan-3-ols in elite Shuchazao Tea (Camellia sinensis) cultivar in the field. Molecules 2017, 22, 2241. [Google Scholar] [CrossRef]
  88. Wisman, E.; Hartmann, U.; Sagasser, M.; Baumann, E.; Palme, K.; Hahlbrock, K.; Saedler, H.; Weisshaar, B. Knock-out mutants from an En-1 mutagenized Arabidopsis thaliana population generate phenylpropanoid biosynthesis phenotypes. Proc. Natl. Acad. Sci. USA 1998, 95, 12432–12437. [Google Scholar] [CrossRef]
Figure 1. Dendrogram resulting from hierarchical clustering analysis using the presence/absence data of transposable elements in the four pomegranate genome assemblies, along with information about their geographic origins (shown in parenthesis). Bootstrap resampling values are indicated at the nodes.
Horticulturae 10 00111 g001
Figure 2. Insertion time of six retrotransposon lineages belonging to the Copia superfamily in the four pomegranate genome assemblies. Each cultivar is indicated with a different colour. The average insertion time (million years ago = MYA) for each cultivar is reported in parentheses.
Horticulturae 10 00111 g002
Figure 3. Insertion time of four retrotransposon lineages belonging to the Gypsy superfamily in the four pomegranate genome assemblies. Each cultivar is indicated with a different colour. The average insertion time (million years ago = MYA) for each cultivar is reported in parentheses.
Horticulturae 10 00111 g003
Figure 4. Putative insertion times of LTR-REs are subdivided into four groups based on their presence in the same locus in four, three, or two genotypes or specific to one genotype. Data for the Copia and Gypsy superfamilies are presented separately. The black bar represents each genotype combination’s average LTR-RE insertion time (million years ago = MYA). Significant differences for each group of measurements are indicated by letters a, b, and c: groups with the same letter are not significantly different (p-value < 0.05) according to Tukey’s test.
Horticulturae 10 00111 g004
Figure 5. Distribution of total transposable element insertion sites in the four pomegranate genome assemblies. The percentage of the insertion sites is relative to transposable element classes and insertion location.
Horticulturae 10 00111 g005
Figure 6. Distribution of genes in the proximity or interrupted by a transposable element in Gene Ontology classes. The intensity of the colour (yellow to purple) indicates significance (p-value < 0.05). The size of the circle indicates the percentage of the Gene Ontology class. (a) Genes in the proximity of transposable elements; (b) Genes interrupted by a transposable element in the introns; (c) Genes interrupted by a transposable element in the exons.
Horticulturae 10 00111 g006
Table 1. Number (nr) of transposable elements identified in each pomegranate genome assemblies.
OrderSuperfamilyLineageTunisia (nr)Bhagwa (nr)Taishanhong (nr)Dabenzi (nr)
Class I (Retrotransposons)CopiaAle179179148132
Alesia1111
Angela2292307020
Ikeros1010107
Ivana53523232
TAR66653029
Tork1481437123
GypsyChromovirus/CRM1902299046
Chromovirus/Galadriel1413128
Chromovirus/Reina24241919
Chromovirus/Tekay6811
Non-Chromovirus/Athila5652238
Non-Chromovirus/Tat/Ogre595881
Unknown 1211386357
LINE 11ndnd
Pararetrovirus ndnd1nd
Class II (DNA Transposons)TIRhAT127110111110
CACTA141171148142
PIF/Harbinger28372729
Mutator393374368356
Tc1/Mariner19171313
MITEhAT88908478
CACTA15151216
PIF/Harbinger16121514
Mutator96968590
Tc1/Mariner1245
HelitronHelitron378373371366
Unknown 61153
Total 2465251118221606
Table 2. Abundance of transposable elements of the four pomegranate genome assemblies, specified for each order, superfamily, and lineage; %: refers to the percentage of genomic abundance.
OrderSuperfamilyLineageTunisia (%)Bhagwa
(%)
Taishanhong (%)Dabenzi (%)
Class I (Retrotransposons)CopiaAle1.721.611.791.80
Alesia0.010.010.010.01
Angela2.262.081.491.90
Ikeros0.150.130.150.16
Ivana0.330.320.330.36
TAR0.440.410.340.4
Tork0.720.70.560.65
Total5.635.264.675.28
GypsyChromovirus/CRM3.053.221.652.15
Chromovirus/Galadriel0.080.070.080.08
Chromovirus/Reina0.120.110.130.13
Chromovirus/Tekay0.480.620.180.26
Non-Chromovirus/Athila0.480.450.360.4
Non-Chromovirus/Tat/Ogre8.888.984.986.59
Total13.0913.457.389.61
Total Copia/Gypsy 18.7218.7112.0514.89
Unknown 11.8815.327.429.0
LINE 0.050.050.060.05
pararetrovirus 0.080.070.080.08
Class II (DNA Transposons)TIRhAT1.321.081.51.23
CACTA3.132.933.713.32
PIF/Harbinger1.261.191.421.35
Mutator5.615.276.275.99
Tc1/Mariner0.380.360.430.41
MITEhAT0.240.270.360.3
CACTA0.040.040.050.05
PIF/Harbinger0.070.070.110.08
Mutator0.420.390.550.46
Tc1/Mariner0.020.020.050.02
HelitronHelitron6.96.687.617.45
Total 50.1252.4541.6744.68
Table 3. Number of shared transposable element insertions identified in the four pomegranate genome assemblies. Each genotype combination is reported. The number of insertions refers to total transposable elements, REs, and DNA TEs.
Genotype CombinationNumber of Insertion Sites (nr)
Total Transposable
Elements
RetrotransposonsDNA Transposons
Bhagwa–Dabenzi–Taishanhong–Tunisia732350
Bhagwa–Dabenzi–Taishanhong20038162
Bhagwa–Dabenzi–Tunisia811764
Bhagwa–Taishanhong–Tunisia1256362
Dabenzi–Taishanhong–Tunisia21138173
Bhagwa–Dabenzi31068242
Bhagwa–Taishanhong362125237
Bhagwa–Tunisia402252150
Dabenzi–Taishanhong13730107
Dabenzi–Tunisia29368225
Taishanhong–Tunisia396141255
Bhagwa947621326
Dabenzi297105192
Taishanhong313124189
Tunisia878554324
Table 4. Two-factorial analysis of variance (ANOVA) for the insertion of transposable elements and pomegranate cultivars. ns: not significant; ***: p-value < 0.001.
CultivarTE Insertion Location
Close to Gene (nr)Exon (nr)Intron (nr)
‘Bhagwa’12646669
‘Dabenzi’8744050
‘Taishanhong’9683958
‘Tunisia’12786163
Source of variationPercentage of variation (%)Significance
Cultivar1.07ns
TE insertion location95.76***
Table 5. Phenylpropanoid-related genes located in proximity or interrupted by transposable element insertion in the four pomegranate genome assemblies. The table provides details for each gene, including insertion location, family/lineage of the inserted element, gene ID, gene name, and the genotype combination sharing the element at the same genomic locus. Genotype names are abbreviated as follows: Bh = ‘Bhagwa’, Da = ‘Dabenzi’, Ta = ‘Taishanhong’, Tu = ‘Tunisia’.
Insertion LocationTransposable Element Family/LineageGene IDGene NameGene CodeGenotype Combination
Close to geneCopia/AleXM_031520924.1flavonoid 3′-monooxygenaseF3′HBh|Da|Ta|Tu
Copia/IvanaXM_031528957.1flavonoid 3′-monooxygenaseF3′HBh|Da|Ta|Tu
Gypsy/Chromovirus/CRMXM_031526933.14-coumarate--CoA ligase4CLBh|Ta
HelitronXM_031516428.14-coumarate--CoA ligase4CLDa|Ta|Tu
ExonTIR/MarinerXM_031530037.1anthocyanidin reductaseANRTu
Gypsy/Chromovirus/ReinaXM_031520605.1peroxidasePODBh|Da
Gypsy/Chromovirus/ReinaXM_031520605.1peroxidasePODTa|Tu
Disclaimer/Publisher’s Note: The statements, opinions and data contained in all publications are solely those of the individual author(s) and contributor(s) and not of MDPI and/or the editor(s). MDPI and/or the editor(s) disclaim responsibility for any injury to people or property resulting from any ideas, methods, instructions or products referred to in the content.

