Article

Effect of Biofertilizers on Broccoli Yield and Soil Quality Indicators

by
Irene Ollio
1,2,*,
Vanesa Santás-Miguel
3,4,
Diego Soto Gómez
1,3,
Eva Lloret
1,2,
Virginia Sánchez-Navarro
1,2,
Silvia Martínez-Martínez
1,
Catalina Egea-Gilabert
1,2,
Juan A. Fernández
1,2,
David Fernández Calviño
3,4 and
Raúl Zornoza
1,2
1
Grupo de Gestión, Aprovechamiento y Recuperación de Suelos y Agua (GARSA), Departamento de Ingeniería Agronómica, Universidad Politécnica de Cartagena, Paseo Alfonso XIII 48, 30203 Cartagena, Spain
2
Instituto de Biotecnología Vegetal (IBV), Edificio I+D+I, Campus Muralla del Mar, Universidad Politécnica de Cartagena, 30202 Cartagena, Spain
3
Departamento de Bioloxía Vexetal e Ciencia do Solo, Facultade de Ciencias, Universida de Vigo, As Lagoas s/n, 32004 Ourense, Spain
4
Instituto de Agroecoloxía e Alimentación (IAA), Universidade de Vigo—Campus Auga, 32004 Ourense, Spain
*
Author to whom correspondence should be addressed.
Horticulturae 2024, 10(1), 42; https://doi.org/10.3390/horticulturae10010042
Submission received: 30 November 2023 / Revised: 29 December 2023 / Accepted: 30 December 2023 / Published: 31 December 2023
(This article belongs to the Special Issue Organic Fertilizers in Horticulture)

Abstract

:
High rates of fertilizer applications potentially have significant environmental consequences, such as soil and water contamination and biodiversity loss. This study aimed to compare the use of biofertilizers and inorganic fertilizers in a broccoli crop to determine their impact on soil microorganism abundance, microbial community structure, functional gene diversity, yield, and greenhouse gas emissions. Four different fertilization treatments were designed: (i) inorganic fertilizers applied at a rate to cover the nutritional demands of the crop (F100); (ii) 50% of the rate of inorganic fertilizers added in F100 (F50); (iii) F50 + the application of a formulation of various bacteria (BA); and (iv) F50 + the application of a formulation of bacteria and non-mycorrhizal fungi (BA + FU). The results showed that reduced fertilization and the addition of both biofertilizer products had no significant effect on soil nutrients, microbial population, microbial activity, or yield when compared to conventional inorganic fertilization. Thus, microbial inoculants were ineffective in enhancing soil microbial abundance and activity, and there were no changes in GHG emissions or crop yields. Nonetheless, crop yield was positively related to total soil N, microbial activity, and CO2 emissions, confirming the positive effect of soil biodiversity on production. The application of biofertilizers can help reduce mineral fertilization in a broccoli crop with no negative effect on yield.

1. Introduction

Agricultural soils act both as a source and sink for greenhouse gases (GHGs) such as carbon dioxide (CO2), methane (CH4), and nitrous oxide (N2O) [1,2]. N2O and CH4 are potent greenhouse gases, with a global warming potential that is, respectively, 296 times and 23 times greater than that of CO2 [3]. Soil management practices (such as land use, nutrient application, tillage, and reduction in soil compaction) can indirectly influence these fluxes [4]. Furthermore, emission flux rates largely depend on soil water content, soil temperature, nutrient availability, organic matter quantity and quality, and pH [5]. Inorganic fertilizers play an essential role in enhancing crop productivity and soil fertility. However, N fertilizer can also directly influence GHG emissions [6]. Land use influences GHG emissions, which are increasingly higher in agricultural soils [7,8]. The use of nitrogen fertilization [9,10,11], irrigation [12,13,14], soil temperature [12,15], changes in microbial biomass [16], and nutrient availability [2] can explain an important part of the temporal variation of GHG fluxes in agroecosystems. Soil GHG emissions are therefore a key issue for climate research and agricultural management [17].
Soils and plants generate CO2 fluxes through plant aboveground respiration, root respiration, and anaerobic and aerobic microbial respiration processes, with root respiration accounting for 50% of total soil respiration [2]. In the soils, possible sources of NO and N2O include nitrification by autotrophic and heterotrophic nitrifiers, denitrification by nitrifiers and denitrifiers, nitrate respiration by fermenters, and chemodenitrification [18]. These processes can occur simultaneously, in different microsites of the soil, with consequent increases in N2O production [19], although this is dependent on the N rate and type [20]. Understanding the responses of N2O-producing microorganisms to changes in environmental conditions or input handling is the key to regulating gaseous N2O losses [21]. The production of CH4 is the result of the anaerobic activity of different groups of microorganisms, including zymogenic bacteria, acetic acid and hydrogen producers, and methanogens [22]. Normally, when the oxygen supply is adequate, most of the C in decomposing organic matter converts to CO2. Furthermore, under aerobic conditions, CH4 that has been produced in anaerobic soil microsites and atmospheric CH4 can be oxidized, resulting in soils “absorbing” CH4 [4]. In addition to high GHG emissions, the excessive use of inorganic fertilizers has been associated with soil and water pollution by leaching and runoff [23].
An alternative to inorganic fertilizers in agriculture to reduce pollution and GHG emissions is the use of biofertilizers. These are substances that contain living plant growth-promoting rhizobacteria (PGPR) [24] and plant growth-promoting fungi (PGPF) [25], which, when applied to seed, plant surfaces, or soil, colonize the rhizosphere or the interior of the plant and encourage development by improving the supply or availability of primary nutrients to the host plant, as well as providing indirect biological control of plant diseases [26,27,28]. According to numerous studies, they improve soil fertility by fixing the atmospheric N [29], solubilizing insoluble phosphates [30] and potassium [31], and producing plant growth-promoting substances in the soil [32]. With plant growth-promoting microorganisms (PGPMs), plant growth can be stimulated, and so more C can be allocated to plant biomass, which is a prominent option for climate change mitigation. Furthermore, by enhancing the production of glomalin in the rhizosphere by increasing mycorrhizal colonization, PGPM creates important reservoirs of C and N in the soil [33]. The net transfer of biologically fixed N directly from the bacteria to the host plant occurs concurrently with a significant transfer of photosynthetically fixed plant carbon to the N-fixing bacteria [34]. According to various studies, the inoculation of PGPM significantly reduces GHG emissions depending on the inoculation dose, the different humidity levels of the growth substrate, and the C and N availability of the soil [35,36,37]. This could be critical in evaluating and mitigating the environmental impacts of various agricultural management practices. Other compounds responsible for indirect stimulation of plant growth and produced by microorganisms, and which may be enhanced by the use of biofertilizers (PGPR and/or PGPF), include enzymes, nitric oxide, osmolytes, siderophores, organic acids, and antibiotics [38,39]. Moreover, plants exude ethylene into the soil, especially during stressful events, which inhibits oxidation of the methane present in the soil. The biosynthesis of ethylene can be interrupted by the activity of the enzyme ACC deaminase. The use of biofertilizers with microorganisms able to express this enzyme is perhaps the simplest and most effective way to reduce the inhibitory effect of ethylene on CH4 oxidation and plant growth while reducing the CH4 emissions [40].
Although the exact mechanisms of plant growth stimulation are vastly complicated, it is known that they differ between fungal and bacterial strains, environmental conditions, crops, and cultivated genotypes, and most certainly depend on the various compounds released by the different microorganisms [38,39]. Soil microbiota and their activity are crucially important and actively involved in soil fertility, sustainability, and crop production [41,42]. Assessing soil microorganism abundance and structure following biofertilizer application is critical for optimizing the sustainability and fertility of both soils and crops, as well as determining how the biofertilizer may affect native microbial communities [43]. Along with microbial abundance, their functionality is also of great importance. Some of the major microbial gene clusters in soil are related to C and N cycles because they are involved in the supply of utilizable nutrients to the crops. Most important genes are related to ammonia-oxidizing enzymes (amoA) [44], nitrite reductases encoding for denitrifying process (nirK) [45], N2-fixing microbial gene clusters such as nifH [46], CO2-fixing microbial genes such as cbbL [47], or cellulose-breaking activity through cellobiohydrolase coding genes (GH7) [48]. Related to soil microbial functioning, soil enzymes, mainly produced by the cellular metabolism of soil microorganisms, catalyze processes of decomposition of organic matter and influence the cycle of nutrients [49,50]. Soil enzymes such as β-glucosidase, cellulase, urease, and arylesterase are involved in the C and N cycle [51,52,53]. The sensitivity of soil microbial indicators to soil management has been reported to be higher than that of soil physicochemical properties, and so is more suited to explaining changes in soil GHG emissions [54,55]. Several studies have demonstrated significant changes in soil indicators such as enzymes and microbial community structure and abundance [56,57,58], and the abundance of functional genes [59,60], after inoculation with PGPR or PGPF.
We designed an experiment comparing the use of inorganic fertilizers in a broccoli crop with the use of two types of biofertilizers: bacteria and bacteria + fungi, associated with a decrease of 50% in the inorganic fertilization rate. Broccoli is a crop with high demand for soil fertilizers, with potential negative environmental impacts in the regions where it is produced, mostly related to soil and water pollution and low biodiversity [61]. Thus, the partial substitution of mineral fertilizers by a microbial inoculant may contribute to reducing the negative impacts of high fertilization. Thus, we expected that BA and BA + FU treatments in a broccoli crop would increase soil GHG emissions due to increased microbial metabolism. The abundance of soil organisms may increase with the addition of biofertilizers owing to the incorporation of new microbes into the soil, although the release of allelopathic compounds by broccoli, as a Brassicaceae species, may restrain these increases. Furthermore, the microbial community structure might differ due to lower nutrient availability as a consequence of a lower rate of fertilizer application and the addition of external beneficial organisms. The activity of soil microorganisms may enhance crop yield by solubilizing soil nutrients, and increase plant protection, associated with lower CO2 equivalent emissions per unit of crop production. Furthermore, GHG emissions may be related to higher soil organic carbon content, bioavailable soil nitrogen forms, and microbial activity measured as enzyme activities and functional genes. The objectives of this study were to: (i) assess whether the use of biofertilizers may modify the abundance of soil microorganisms, the soil microbial community structure, and the diversity of functional genes related to the C and N cycles and yield in a broccoli crop, compared to a broccoli crop fertilized only with inorganic fertilizers; (ii) assess if the use of biofertilizers may modify soil GHG emissions owing to a more active soil microbiota; and (iii) elucidate if soil GHG emissions are related to soil chemical and biological properties and crop yield.

2. Materials and Methods

2.1. Study Site and Experimental Design

This study was carried out in Cartagena, southeastern Spain, at the Tomás Ferro Experimental Field of the Polytechnic University of Cartagena (UPCT), Spain (37°41′16.6″ N 0°56′55.6″ W). The climate is semiarid Mediterranean with a total annual precipitation of 275 mm and a mean annual temperature of 18 °C. Annual potential evapotranspiration surpasses 900 mm. Soil is classified as Haplic Calcisol (loamic, hypercalcic) [62], with clay loam texture, organic matter content of 1.80%, and pH of 8. Soil analyses were performed in the laboratories of the research group of GARSA (Management, Use and Recovery of Soils and Water), UPCT. The experiment was performed on a broccoli crop (Brassica oleracea var italica Plenck, cultivar Parthenon), (Sakata Seed Iberica—Murcia, Spain) grown from 5 October 2021 to 10 January 2022. Prior to our experimental setup, there was a crop of potato from December 2020 to May 2021. A 1-year field experiment aimed to evaluate the impact of biofertilizers on broccoli, a crop that requires crop rotation to avoid soil and biodiversity issues. As a common practice in this area, farmers tend to rotate crops every year to avoid negative effects of monocultures. The experiment focused on the effectiveness of biofertilizers on Brassicaceae, which release allelopathic compounds. Treatments, including reduced mineral fertilization and fertilizer addition, began in January 2021 with a potato crop. However, no data on microbial abundance, activity, or GHG emissions were collected until the establishment of the broccoli crop in October 2021. Following the local practices, the crop was established under drip irrigation and inorganic fertilization. The separation of seedlings at planting was 100 cm × 20 cm. Thus, the density of the broccoli plants was 50,000 plants ha−1. Four different fertilization treatments were designed: (i) inorganic fertilizers applied at the nutritional demands of the crop (F100); (ii) 50% of the rate of inorganic fertilizers added in F100 (F50); (iii) F50 + the application of a formulation of nitrogen-fixing and phosphorus- and potassium-solubilizing bacteria (BA); and (iv) F50 + the application of a formulation of bacteria and non-mycorrhizal fungi (BA + FU). The formulation of nitrogen-fixing and phosphorus- and potassium-solubilizing bacteria was mostly based on plant growth-promoting rhizobacteria (PGPR) such as Azospirillum, Pseudomonas, and Bacillus (Bactoneco®); the formulation of bacteria and non-mycorrhizal fungi was mostly based on a mix of PGPR and beneficial fungi such as Bacillus, Azotobacter, and non-mycorrhizal fungi (Nuve®). These products were provided by Fertilizantes y Nutrientes Ecológicos, S.L. (Spain), and the exact compositions were not shared due to the protection of intellectual property rights of the providers. The field experiment was established as a completely randomized design with four replications, and each plot had a size of 700 m2. All treatments received the same quantity of irrigation (1100 m3 ha−1). The irrigation was scheduled according to the climatic conditions, crop coefficient, and evapotranspiration rate. Meteorological data were measured using an automatic weather station located on the experimental farm (Figure 1A1). In all treatments, the soil was tilled at a 25 cm depth and a preparatory herbicide application (Metazachlor 50% (SC) p/v) was carried out; subsequently, the crop was kept free from weeds by manual hoeing when necessary. The inorganic fertilization rate in F100 consisted of 158 kg ha−1 of N, 68 kg ha−1 of P2O5, and 255 kg ha−1 of K2O applied by fertigation through the lifespan of the crop [63]. The used fertilizers included ammonium nitrate (34.5% N), monoammonium phosphate (61% P2O5, 12% N), and potassium nitrate (46% K2O, 13% N). Biofertilizers were applied by drip irrigation according to the producer’s recommendations. The product dose used in the BA treatment consisted of two applications (30 November 2021; 9 December 2021) of Bactoneco N®, Bactoneco P®, and Bactoneco K® at a total dose of 6 L ha−1. The BA + FU treatment was 30 L ha−1, divided into three applications (30 November 2021; 9 December 2021; 14 December 2021) of Nuve® product. An insecticide (1.5% p/v Lambda-cyhalothrin) and fungicide (25% p/v Azoxistrobin) were applied as a single preventative treatment on 2 November 2021.

2.2. Soil Greenhouse Gas Measurements

Measurements of CO2, N2O, and CH4 were made every 7 days in all replicated treatments from 15 October 2021 to 10 January 2022, between 9:00 and 12:00. Moreover, we measured the GHGs 24 h after a fertigation episode or the addition of biofertilizers. This procedure was established because microorganisms are considered to bioactivate after 24 h of application in soil [64]. The basic experimental procedure used in this study was the dynamic gas chamber technique [65]. The chamber was made of non-oxidizable steel, with a diameter of 7.5 cm and a height of 20 cm, with one inlet and one outlet connected to a photoacoustic infrared spectroscopy multi-gas analyzer with an ultra-sensitive cantilever pressure sensor (Gasera One, Gasera Ltd., Helsinki, Finland). The dynamic system with an inlet and outlet in the chamber permits a continuous flow and avoids pressure fluctuations. The chambers were inserted into the bare soil to a depth of 10 cm, within two broccoli plants. CO2, N2O, and CH4 were quantified every 1 min for a period of 5 min to assess the linear trend. CO2, N2O, and CH4 emission rates were expressed as the difference between the quantification at the end and the beginning of the measurement period divided by the time. CO2, N2O, and CH4 cumulative emissions for each treatment were estimated using numerical integration [66]. GHG emissions were converted into CO2 equivalent (CO2e), and then cumulative emission data (g m−2) were also expressed on a production basis (g kg−1) for the experimental period to assess the emissions per product of each treatment. Soil temperature (T) and soil moisture (M) were measured using ProCheck and 5TM sensors (Decagon Devices Inc., Pullman, WA, USA), introduced at a 15 cm depth adjacent to the place where GHG measurements were made.

2.3. Soil and Plant Sampling

Soil sampling was carried out on 17 December 2021, after the end of the fertigation schedule in all treatments. All plots were sampled at a 0–25 cm depth (Ap horizon). One composite soil sample derived from four sampling points per plot was collected, thereby avoiding the border effect. Soil was collected in the crop line between two plants. Each sample was divided into two aliquots in the field. The first aliquot was air dried for 7 days, sieved <2 mm, and stored at room temperature for chemical analyses and enzyme activities [67]. The other aliquot was stored in a cool box with ice to be taken to the lab immediately and stored at 4 °C for nitrate and ammonium analysis, and at −20 °C for molecular and phospholipid fatty acid (PLFA) analysis. Harvesting was performed on 5 January 2022 and 10 January 2022, collecting the heads that were formed with the buds of the head firm and tight. Broccoli crop yield was determined by weighing the heads when they reached the marketable size.

2.4. Soil Chemical and Biochemical Analyses

Soil organic carbon (SOC) and total nitrogen (Nt) were analyzed using an elemental CHN (CHN 628, Leco). The soluble carbon (Csol) and soluble nitrogen (Nsol) were extracted with 0.5 M K2SO4 (1:5 ratio w/v) [68] and measured using a CN analyzer for liquid samples (Multi N/C 3100 Analytic Jena). Soil NO3− was extracted with deionized water in a 1:10 ratio (w/v) [69] and measured via ion chromatography (Metrohm 861). The NH4+ was extracted with 2 M KCl in a 1:10 ratio (w/v) and colorimetrically measured [70]. The β-glucosidase activity (Glu) was measured based on the determination of p-nitrophenol released after incubation at 37 °C with β-D-glucopyranoside [71]. The arylesterase activity (Aryl) was determined based on the production of p-nitrophenol released after incubation with p-nitrophenyl acetate at 37 °C [67]. The cellulase activity (Cls) was assessed via the determination of gearbox sugars using amorphous cellulose as a substrate [72,73]. The urease activity (Urs) was based on the determination of the ammonium released after incubation of the soil with urea at 37 °C [74]. All analyses are reported on an air-dry weight basis.

2.5. DNA Extraction and Quantitative PCR (qPCR) Gene Analysis

Quantitative PCR (qPCR) analysis was used to quantify the copy number of the microbial functional genes amoA (ammonium-oxidizing, nitrifying bacteria), nirK (nitrite reductase, denitrifying bacteria), and nifH (nitrogenase, N-fixing bacteria) involved in the nitrogen cycle, and cbbL red-like (ribulose-1,5-bisphosphate carboxylase/oxygenase in autotrophic bacteria) and GH7 (cellulose degradation) involved in the carbon cycle. Soil DNA was extracted from 0.25 g (wet weight) of soil using the DNeasy PowerSoil Pro Kit (Qiagen, Hilden, Germany), following the manufacturer’s protocol. The DNA was eluted in a final volume of 60 μL. The quantity and quality of the DNA extracts were quantified using a Qubit 3.0 Fluorometer (Invitrogen, Thermo Fisher Scientific, Waltham, MA, USA) and a Nano Photometer N60 (Implen Scientific Inc., Germany), respectively. Subsequently, extracts were purified with magnetic beads (AMPure XP beads (Beckman Coulter, High Wycombe, UK). For the construction of the qPCR standards, the DNA extracted from soil samples as described above served as the template of PCR reactions. Amplification was performed in a MultiGene OptiMax Thermalcycler (Labnet International Inc., New York, NY, USA) and conducted using the primer pairs listed in Supplementary Table S1. The expected size of the PCR products was verified by electrophoresis on a 1.5% (w/v) agarose gel in 1× Tris-acetate-EDTA (TAE) buffer stained with ethidium bromide. Triplicate amplicons were pooled and purified using the QIAquick PCR Purification Kit (Qiagen, Hilden, Germany), and quantified with a Qubit® 2.0 Fluorometer and Qubit® dsDNA HS Assay Kit (Invitrogen, Merelbeke, Belgium). The purified PCR product was ligated into the pGEM®-T Easy Vector Systems kit (Promega, Madison, WI, USA), and the resulting ligation products were used to transform into Escherichia coli JM109 competent cells (Promega, Madison, WI, USA) following the manufacturer’s instructions. Transformants were grown on LB plates containing ampicillin (100 µg mL−1), IPTG (0.5 mM), and X-Gal (80 µg mL−1). Individual white colonies were randomly selected and cultured overnight at 37 °C in 5 mL of LB broth medium (Lennox) supplemented with ampicillin (100 µg mL−1), and the plasmids were extracted and purified (QIAprep Spin Miniprep Kit, Qiagen, Hilden, Germany). Cloning screening was performed with reamplification using the vector-specific M13F and M13R primers (Table S1 [46,75,76,77,78]) and the PCR products were examined via electrophoresis (1.5% (w/v) agarose gel in 1× TAE buffer). All plasmid standards were digested with Ndel restriction enzyme (New England BioLabs, Ipswich, MA, USA) with a restriction enzyme reaction composed of 20 μL of plasmid DNA, 5 μL NEBuffer (New England Biolabs, Ipswich, MA, USA), and 1 μL/100 U Ndel in a final volume of 50 μL. The enzymatic reaction was carried out for 1 h at 37 °C and the linearized plasmid DNA was purified (QIAquick PCR Purification Kit, Qiagen, Hilden, Germany), checked on an agarose gel (1.5% (w/v) 1× TAE), and quantified (Qubit® 2.0 Fluorometer and Qubit® dsDNA HS Assay Kit, Invitrogen, Merelbeke, Belgium). The copy numbers of each of the genes of interest were calculated from the known concentration of the extracted DNA plasmid. Ten-fold serial dilutions of linearized plasmids (107 to 101) containing the gene fragment of interest were run in each qPCR assay in triplicate to generate a standard curve. Gene abundances were determined by qPCR in replicated samples using the Rotor-Gene Q (Qiagen, Hilden, Germany) employing the same primers as for cloning. Each reaction was performed in a 20 µL volume containing 10 µL of PowerUp SYBR Green Master Mix (Applied Biosystems, Waltham, MA, USA), 0.56 µL of bovine serum albumin (0.56 mg mL−1, Invitrogen, Merelbeke, Belgium), 400 nM (cbbL, GH7, amoA, and nirK genes) or 500 nM (nifH gene) of each primer, 5 μL of DNA template, and nuclease-free water. Amplification conditions are described in Tables S2–S6. A final dissociation stage, melt curve analysis with continuous fluorescence acquisition from 65 to 95 °C at a rate of 0.25 °C per 5 s, was performed to detect nonspecific amplification. qPCR products were also checked via 1.5% (w/v) agarose gel electrophoresis to check the specificity of the amplification.

2.6. Phospholipid Fatty Acid (PLFA) Analysis

The abundance of microbial groups was estimated by phospholipid fatty acid (PLFA) analysis [79]. Briefly, lipids were extracted from soils by weighing 2 g (dry weight) of soil with a chloroform/methanol/citrate buffer mixture (1:2:0.8 v/v/v) and separated into neutral lipids, glycolipids, and phospholipids using a prepacked silica column. Phospholipids were then subjected to a mild alkaline methanolysis, and the resulting fatty acid methyl esters were identified via gas chromatography. A total of 32 different PLFAs were identified and quantified. The PLFAs were designated in terms of the total number of carbon atoms and double bonds, followed by the position of the double bond from the methyl end of the molecule. Furthermore, cis and trans configurations are indicated by “c” and “t”, respectively. The prefixes “a” and “i” indicate anteiso- and iso-branching positions, “br” indicates the unknown methyl group branching position, “Me” indicates a methyl group on the tenth carbon atom from the carboxyl end of the molecule, and “cy” refers to cyclopropane fatty acids. The abundance of different microbial groups was estimated following Joergensen [80]: Firmicutes: i14:0, i15:0, i16:0a, i17:0, i18, a15:0, a16:0, a17:0, a18:0, a19:0; Actinobacteria: 10Me16:0, 10Me17:0, 10Me18:0; Gram positive (G+) bacteria: Firmicutes + Actinobacteria; Gram negative (G−) bacteria: cy17:0, cy19:0, 16:1ω7, 16:1ω9, 17:1ω8, 18:1ω7; Bacteria: G+ plus G−; Arbuscular mycorrhiza fungi (AMF): 16:1ω5c; Zygomycota: 18:1ω9c; Ascomycota and Basidiomycota: 18:2ω6c; Unspecific fungal PLFA: 18:3ω6,9,12; Fungi: AMF + Zygomycota + Ascomycota and Basidiomycota + unspecific fungal; Unspecific microbial PLFA: 14:0, 15:0, 16:0, 17:0, 18:0, 20:0, 20:4ω6,9,12,15; Total microbial PLFA: bacterial + fungal + unspecific microbial.

2.7. Statistical Analysis

Data were checked to ensure normal distribution using the Kolmogorov–Smirnov test at p < 0.05. GHG emission data were submitted to two-way repeated measures ANOVA, with measurement date as the within-subject factor, and treatment (F100, F50, BA and BA + FU) as the between-subject factor. GHG data were also submitted, independently for each date, to one-way ANOVA and Tukey’s post-hoc test (p < 0.05) to compare significant differences between treatments. Crop yield, soil chemical and biological properties, and cumulative GHG emission values for the experimental period were submitted to a one-way ANOVA and Tukey’s post hoc test (p < 0.05) to compare significant differences between treatments. Relationships among properties were studied using Pearson correlations. Multiple linear regression analysis (Y = m1 × 1 + m2 × 2 +···+mnXn +b) was carried out using the stepwise method, with cumulative values of GHG as independent variables, and soil chemical and biological properties and crop yield as dependent variables. The standardized coefficient (β) and partial correlation values were used for the analysis. The β coefficient compares the intensity of the effect of each independent variable with that of the dependent variable. The higher the absolute value of the beta coefficient, the stronger the effect. The partial correlation measures the correlation between two variables, while controlling for the effect of one or more other variables. The unstandardized coefficients (m) were used to interpret the effect of each independent variable on the outcome of the regression model. Data from all soil properties were subjected to a principal component analysis (PCA) to examine dependency and correlation structures. Statistical analyses were performed with the software IBM SPSS for Windows, Version 26.

3. Results

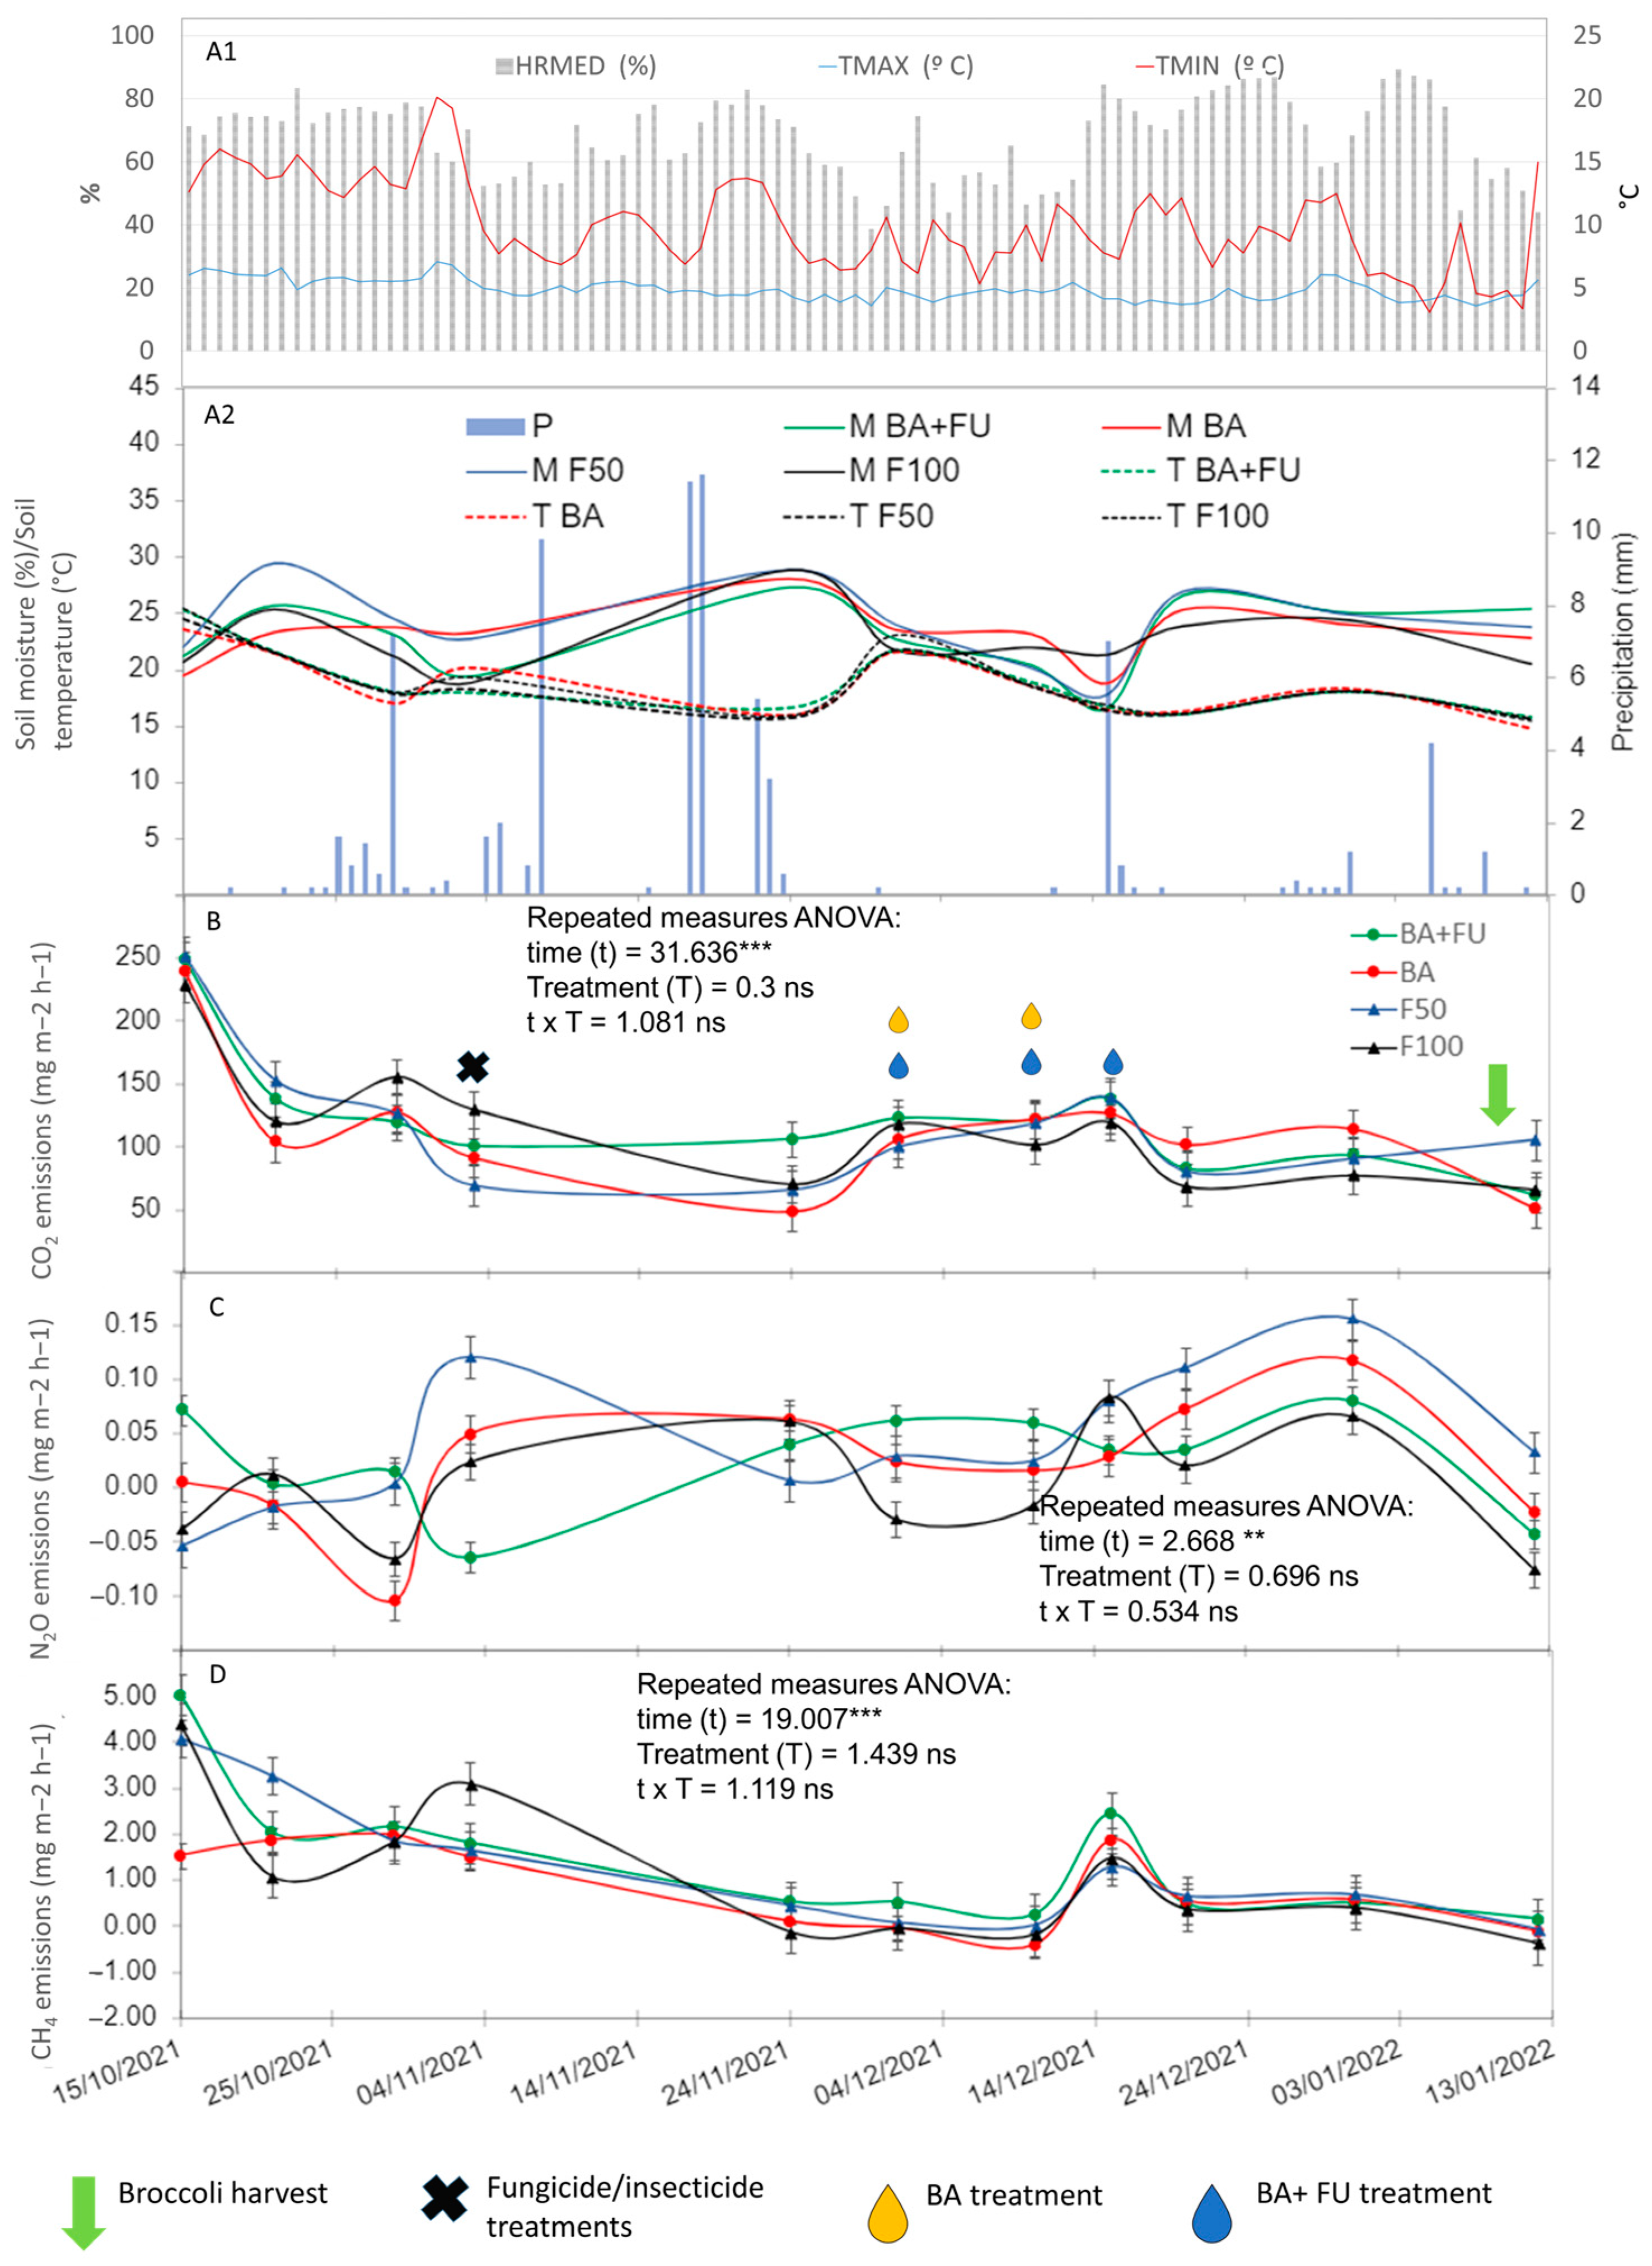
3.1. Soil Greenhouse Gas Emission Rates

Soil CO2 emission rates followed the trend of soil temperature, with a significant positive correlation (R = 0.61; p ≤ 0.01) (Figure 1A1–B). On the contrary, the CO2 emission rates showed a slightly negative correlation to soil moisture (R = −0.30; p ≤ 0.01) (Figure 1A1–B). Hence, the highest CO2 emission rates were related to the highest soil temperatures and the lowest soil moisture levels. There were no significant differences in terms of soil temperature and moisture regarding treatments (Figure 1A1,A2). Soil CO2 emission rates showed no significant differences between treatments (Figure 1B). On average, CO2 emission rates during the crop cycle were 117 mg m−2 h−1 for all treatments.
Soil N2O emission rates had a flat trend with small oscillations around 0 mg m−2 h−1, and they were not correlated with either soil temperature or soil moisture (Figure 1A1,A2,C). Soil N2O emission rates were not significantly different between treatments at any given time. On average, N2O emission rates were 0.029 mg m−2 h−1 for all treatments during the experimental period.
Soil CH4 emission rates followed the trend of soil temperature, with a significant positive correlation (R = 0.39; p ≤ 0.01). However, CH4 emission rates were not correlated with soil moisture. CH4 emission rates showed no significant differences between treatments (Figure 1D), with an average value of 1.08 mg m−2 h−1.
Thus, for all GHGs, there was no significant effect of fertilization treatment, and emissions were only affected by sampling dates, showing a slight time variability (Figure 1). The interaction between treatment and sampling time was not significant for any GHG.

3.2. Overall Cumulative Soil Emissions

The estimation of cumulative CO2, N2O, CH4, and CO2e released during the experimental period showed no significant differences between the treatments (Table 1). The cumulative CO2 emission was positively correlated with crop yield (R = 0.633; p ≤ 0.05) and Csol (R = 0.560; p ≤ 0.05) (Table S7). Cumulative N2O and CH4 had no significant correlations with soil properties or crop yield.

3.3. Crop Yield, Soil Enzyme Activities, and Chemical Properties

Broccoli yield showed no significant differences between treatments, with an average value of 16,797 kg ha−1 for F100, 15,621 kg ha−1 for F50, 14,928 kg ha−1 for BA, and 15,082 kg ha−1 for BA + FU (Table 1). Enzyme activities and chemical properties showed no significant differences between treatments (Table 2). We found a positive correlation between crop yield and Nt (R = 0.618; p ≤ 0.05) and Cls (R = 0.620; p ≤ 0.05) (Table S7). SOC was positively correlated with Nt (R = 0.662, p ≤ 0.01) and negatively with Csol (R = −0.701; p ≤ 0.01) (Table S7).

3.4. PLFA Biomarkers and Functional Genes

Microbial biomass, assessed as total PLFAs, and microbial groups based on PLFA biomarkers, showed no significant differences between the fertilization treatments. Total PLFA averaged 15.4 nmol g−1, bacteria and fungi averaged 7.63 nmol g−1 and 2.64 nmol g−1, respectively, and G+ were more abundant (4.97 nmol g−1) than G− (2.66 nmol g−1) (Table 3). Total PLFAs were positively correlated with SOC and amoA (R = 0.728; p ≤ 0.01; R = 0.648; p ≤ 0.01) and negatively with Csol (R = −0.512; p ≤ 0.05) (Table S7).
None of the C- and N-cycle gene abundances showed significant differences between treatments (Figure 2a–e). The amoA was positively correlated with SOC, NH4+, Csol, nifH, and Csol (R = 0.644, p < 0.01; R = 0.603, p < 0.01, R = 0.636, p < 0.05; R = 0.618, p < 0.05 respectively) (Table S7). The abundance of the nifH gene was correlated with SOC and NH4+ (R = 0.519; p ≤ 0.05; R = 0.557, p ≤ 0.05) (Table S7). cbbL was correlated with nirK and GH7 (R = 0.713; p ≤ 0.01; R = 0.567 p ≤ 0.01, respectively), while no other significant correlations were detected (Table S7).

3.5. Interrelationship between GHGs, Soil Properties and Microbial Abundance and Functioning

Multiple linear regression analysis (Table 4) showed that the cumulative CO2 emissions were positively related to crop yield, and negatively to nifH (R2 = 0.70; F = 10.34; p ≤ 0.01).
The PCA performed on soil chemical properties, cumulative values of GHG emissions, enzyme activities, functional genes, and PLFA showed that 64.19% of the total variability of data can be explained by four PCs (Table 5). None of the PCs were able to show separations between treatments, with all samples clustering together. Therefore, the structure of dependence and correlation between soil properties has not been significantly influenced by the fertilization treatments (Figure 3). PC1, which explained 33.98% of the data variability, was associated with most of the PLFA indicators, including total PLFA, bacteria, Firmicutes, Zygomicota, fungi, G− and G+, SOC, amoA, and β-glucosidase activity. Thus, most variability in data is related to microbial community structure, which is associated with higher SOC content and higher ammonification and degradation of oligosaccharides (Table 5). PC2, which explained 11.50% of data variability, was associated with cumulative CO2e, N2O and CH4 emissions, and nirK, indicating that GHG emissions are the second set of variables contributing to explain data variability, with a negative relationship with denitrification processes. The rest of the properties explained <10% of the data variability.

4. Discussion

Results showed no significant changes in soil properties and GHG emissions when applying two different types of biofertilizers in a broccoli crop, consequently partially rejecting our initial hypotheses: there was no increase in GHG owing to a higher microbial activity caused by the addition of fertilizers, there was no increase in microbial abundances with the addition of microorganisms, and there was no decrease in the emission of CO2e per unit of product. Nonetheless, we can partially confirm our hypothesis since GHG emissions were related to soluble organic C and microbial activity assessed by functional genes and enzyme activities.

4.1. GHG Emissions

Soil temperature exhibited a positive correlation with soil CO2 emissions (Figure 1), aligned with previous studies, and confirming that soil temperature is the most important factor controlling CO2 emissions when water is not the limiting factor [14,81,82]. However, under the irrigation conditions of the broccoli crop, when water is always available for crop development, slight increases in water supply can contribute to decreased CO2 emissions. This is likely because of the presence of anaerobic microsites in the soil in irrigated systems. When O2 supply is adequate, most of the organic C is converted to CO2 by rhizospheric and heterotrophic soil respiration, which is highly affected by temperature [83,84]. Due to the limitation of gas permeability and O2 availability, the CO2 fluxes tend to decrease, and organic C is converted anaerobically to CH4 [84,85]. However, no effect of irrigation or water availability was observed in terms of CH4 emissions, and so, no overall anaerobic conditions were present in the field. Thus, it is likely that an excessive water supply has reduced the aeration and thus respiration by aerobic CO2-producing microorganisms and roots [86,87], without reaching the level to increase methanogenesis and methanogenic populations [88]. As observed with CO2, CH4 emissions showed a significant positive correlation with soil temperature, confirming again that temperature is the most important factor controlling emissions, as previously reported in other studies [12,89].
In terms of fertilization treatments, the reduction in fertilizer rates or the addition of biofertilizers did not contribute to changes in CO2 or CH4 emissions, contrary to our initial hypothesis. This might be attributed to the lack of an effect of fertilization treatments on microbial abundance and activity in the short term [90], implying that fertilization modifications had no direct influence on microbial communities and their functioning [91] during the broccoli crop. Soil type, weather conditions, and seasonal differences, along with soil moisture and pH, are considered the most influential drivers of microbial community structure [92]. The use of microorganisms can either reduce or have no effect on CO2 emissions, depending on a variety of abiotic (moisture conditions, C and N substrates, SOM, fertilization, etc.) and biotic (microbial strains, soil enzymes, and microbial activity) factors [37,93,94]. Previous studies have also reported no effect of fertilization rates on CH4 emissions [93,95,96].
The cumulative CO2 emission is positively correlated with crop yield. This may be explained by the fact that soil respiration is strongly linked to plant metabolism, autotrophic respiration, and photosynthesis, thus promoting plant growth [86]. The respiration of the plant and the metabolism associated with soil microbial biomass can explain this correlation, including a positive correlation with Csol. Csol is a substrate for microorganisms (heterotrophic respiration) that could support CO2 fluxes, and so an important pool for microbial activity, rather than the total stock of soil organic carbon measured as SOC [97,98]. The negative correlation between cumulative CO2 and the nifH gene may indicate the highest efficiency in C use when there is high biological N fixation, leading to lower CO2 emissions. This is because diazotrophs use large amounts of soil C and energy to produce bioavailable soil N [99]. Consistent with other studies, the nifH gene abundance is generally associated with higher organic carbon levels [54]. PGPR addition can also decrease C-cycling enzyme activity and stimulate N-cycling enzyme activity in the soil, reducing CO2 emissions from soil [94], although this effect was not observed in our study.
Most research has reported that N fertilization influences N2O emissions [10,11,89], something also not found in our experiment. Furthermore, most of the increases in N2O emissions happen after irrigation events in previous studies [13]. However, in our experiment, fertilization was always accompanied by irrigation and soil moisture was always maintained at the appropriate levels to ensure crop development, so moisture was not a limiting factor. This may explain the lack of a relationship between N2O emissions and soil moisture in our study. Production of N2O primarily occurs through microbially mediated nitrification and denitrification [100]. Under aerobic conditions, ammonium (NH4+) is oxidized in soil to nitrite (NO2−) and nitrate (NO3−), resulting in N2O production, whereas under anaerobic conditions, NO3− can be reduced to N2O and/or dinitrogen (N2) [101]. The fact that changes in fertilization regime or addition of biofertilizers did not affect these processes may be related to the lack of modification of microbial communities with the treatments, as assessed by PFLA analysis, enzyme activities, and functional genes. Huang et al. [36], contrary to our results, found that application of PGPM in a cucumber crop reduced soil N2O emissions by 22.6–33.5%, depending on the inoculation dose, and was associated with the enrichment of the nitrifier AOB gene and the denitrifiers nirK and nosZ gene abundances. Wu et al. [60] carried out a biofertilizer treatment in an oil-seed rape crop (Brassica campestris) and reported increased relative abundances of bacteria involved in denitrification and increased numbers of nosZ gene copies, which led to the increased reduction of N2O to N2.

4.2. Soil Chemical Properties, Microbial Abundance, and Potential Activity

Many studies showed that SOC is critical for maintaining the soil microbial community. SOC concentration, composition, and dissolving rate drive soil respiration, which is significantly correlated with the shifts in bacterial community compositions [97,98]. Thus, the lack of differences in SOC, Csol, or available N under the different treatments may have contributed to maintain the same microbial activity, and therefore the same GHG emissions. The significant correlations between SOC and some functional genes suggest that, in our experiment, SOC is controlling microbial functioning rather than external fertilization or the addition of exogenous microorganisms. In this sense, SOC exerts a strong influence on the abundance and diversity of the N-cycling genes [102,103], as it is considered more limiting to free-living microbial activity than nutrient availability [104]. The nifH gene that fixes atmospheric N, plus the mineralization of organic N, leads to the formation of NH4+ (ammonification) moving on to nitrification by the amoA gene, which is also positively correlated with SOC and microbial abundance [103]. The cbbL gene (RubisCO) was also significantly positively correlated with SOC, confirming its key role in CO2 fixation and sequestration in soils [105]. The cbbL gene was also positively correlated with the GH7 gene, which explains how microorganisms simultaneously contribute to the processes involved in the C cycle [106]. Several authors have identified different bacteria and fungi with cellulolytic and nitrogen-fixing attributes [107,108,109]. These bacteria and fungi play a crucial role in plant nutrient accessibility, sustaining soil fertility, plant growth, and, proportionally, crop yield [110]. In this line, we observed a positive correlation between crop yield, Nt, and cellulase activity. A wide range of soil enzymes have been identified as being strongly associated with soil organic matter (SOM) decomposition [111]. Urease plays a significant role in N cycling, and this explains the correlation in our study between the urease enzyme and the N-cycle genes (amoA, nifH).
As confirmed by the correlation and multivariate analyses, the abundance of microorganisms was mostly controlled by SOC and Csol, as highlighted in previous studies [112,113,114], but not affected by fertilization regimes. SOC and Nt may have promoted the increase in bacterial biomass until a peak was reached, after which some other biotic factors, such as competition, may have prevented bacterial growth even if nutrient levels increased [115]. This may explain the lack of significant differences in microbial biomass in our study, and also how the application of external microorganisms did not affect the stock of microorganisms [115,116]. However, other research described how different N fertilization strategies and the application of PGPM increased the content of various PLFAs markers [56,57] and, in general, microbial abundance and biodiversity [117] and crop yields [118]. These controversial results may suggest that the effect of microbial inoculants is soil-, climate-, crop-, and management-dependent. In this line, conventional practices (tillage and pesticide addition) could weaken the effect of inoculants [119]. Additionally, it is also known that bacterial species decline after inoculation in soil, mainly due to competition with native communities and the hostility of biotic or abiotic interactions [120]. These conditions may have greatly affected the microbial life in our applications. Furthermore, Brassicaceae are known to release allelopathic compounds, such as glucosinolates, that may have contributed to limiting the growth of microbial inoculants, explaining the differences in all the properties measured [121,122].
Increased activity of soil enzymes after the inoculation with PGPR strains has been reported in other studies [56,58,123], contrary to our results. In a greenhouse experiment, the legume Hedysarum carnosum was sown using a loamy soil collected from southern Spain, observing that the inoculation with Bacillus subtilis increased dehydrogenase, β-glucosidase, urease, and alkaline phosphatase activities compared to the non-inoculated control [124]. However, other studies have also reported no effects on microbial properties after inoculation of soil with PGPR. For instance, Chaudhary et al. [56] reported that reduced fertilization and PGPR application in a peanut field had no significant effect on microbial biomass, β-glucosidase, and urease activities. They consider it a positive result because inoculation with beneficial bacteria, which had a significant effect by influencing and improving the availability of nutrients (N, P, K, and Fe) in the soil, does not perturb the natural microbial community of the soil. Angelina et al. [119] reported in barley cultivation that the use of microbial inoculants (Bacillus subtilis and Pseudomonas fluorescens) led to an increase in microbial biomass only in the organic system, while no differences were detected in the conventional system, as we have reported. Moreover, the activity of β-glucosidase was not affected, indicating the independence of the carbon cycle on inoculation.

4.3. Crop Yield

It is known that PGPM inoculation could compensate for nutrient deficiency and improve plant development through the production of plant growth regulators, stimulating the development of plant roots and leading to better absorption of water and nutrients from the soil [125]. Various studies consider that the most significant effect of biofertilizers on crops occurs in poor soils or in conditions of stress [125,126]. However, in our study, the reduction in nutrients did not affect the production in the treatment without biofertilizers. It is possible that nutrients already present in the soil compensated for the lack of NPK fertilizer in each treatment where a reduction in fertilizer was applied (see Supplementary Table S8). Two microbial biofertilizer preparations were applied in an organic arable crop rotation in central Europe, and the results showed no effect on crop yield, soil microbial biomass, activity parameters, substrate turnover, or soil microbial community structure [88]. Nuzzo et al. [127] tested different formulations of plant growth-promoting bacteria (Lactobacillus, Rhizobia, etc.), yeasts, and mycorrhizal fungi on a tomato crop under greenhouse conditions and found no significant effect on plant growth. Biofertilizers tested in a pot experiment of Lolium perenne L. crop did not affect N mineralization or plant growth, but may have suppressive effects on the zymogenic microbial biomass of the soil due to the substrate of the biofertilizer suspensions [128].
Application methodologies, doses, and inoculation times of microorganisms vary between studies, and can thus affect the results; for example, inoculation efficacy depends on the rhizosphere competence of the bacteria for the particular crop type [129]. Thus, the fact that in our study no significant differences were found between treatments may be a result of the type or crop being less compatible with the applied PGPM. Fiorentino et al. [121] showed that different botanical families have different cultural performances when treated with Trichoderma-based biostimulants, with improvements in lettuce (Asteraceae), but not in broccoli (Brassicaceae), consistent with our study. Another explanation could be that Brassicaceae species have an allelopathic effect on soil microbes, bacteria, and fungi due to the production of numerous inhibitory compounds, such as glucosinolates, that are released into the soil of the rhizosphere [121,122]. Due to limited knowledge of the ecological factors that determine the survival of inoculants, such as competition with indigenous bacteria for available growth substrates [129], a general assumption regarding the exogenous microorganism survival applied in the soil cannot be determined in our study. Some variables such as soil type, crop type, natural selection, and agricultural management, including pesticide use, may be among the factors influencing colonization with preselected beneficial microorganisms [38].
In our case, when a 50% reduction in the conventional dose of N fertilizer was applied (158 kg ha−1), we found no significant difference in crop production. A study of broccoli fertilization regime carried out in Italy under a Mediterranean climate suggested that the most effective dose of fertilizer N was 75 kg ha−1 and each unit of N above 75 kg ha−1 produced about 41% less fresh weight of the head [61]. However, according to Conversa et al. [61], an application rate of 150 kg ha−1 of N is the advisable rate to enhance overall production and is currently being used in the study region. According to Mourão and Brito [126], who performed an experiment with different rates of N fertilizers (0, 60, 120, 180, and 240 kg N ha−1) in a broccoli crop, the yield increases were not significant above 120 kg N ha−1. Similarly, Kim et al. [130] conducted a comprehensive simulation-based study of broccoli and concluded that the amount of N fertilizer does not significantly alter the crop yield above 75 kg ha−1 N input. Thus, even if the N supply was reduced compared to the dose conventionally applied by farmers in the area, plants did not suffer from lack of nutrients, and the microorganisms applied had no significant impact on crop yield, soil microbial biomass, soil microbial activity parameters, soil microbial community structure, or greenhouse gas emissions.

5. Conclusions

The reduction in fertilization and the addition of biofertilizers did not significantly affect the yield, soil chemical properties, or biological properties, compared to the conventional inorganic fertilization, applied to a broccoli crop in this area. Thus, the addition of microbial inoculants was not effective in increasing soil microbial abundance and activity, and so no changes were observed in emissions of GHGs such as CO2, N2O, and CH4. GHG emissions responded to soil organic C content (mostly the soluble fraction), available N, and microbial activity assessed by enzyme activities and functional genes, which were not different between fertilization regimes. This may be related to the crop type (Brassicaceae, with release of allelopathic compounds), the lack of nutrient limitation, and the conventional management with use of tillage and pesticides. Crop yield responded positively to total N, microbial activity, and CO2 emissions, suggesting that the active soil microbial community is related to high yields. Nevertheless, these positive correlations were observed under short-term experiments and an overall statistical difference was not observed. In our experiment, it was concluded that, following a 50% reduction in fertilizer compared to conventional practices in a farm location in SE Spain, total crop yield was not affected. Specifically for the location of this study, the crop type and cultivar, the climatic conditions, and the crop management used, it is possible to reduce the amount of fertilizer and still obtain optimal production. This may contribute to reducing production costs and possible water pollution by leaching and runoff, and eventually improve farm profitability. The present study is based on a single inoculation of a product based on microorganisms in a short-term experiment. Therefore, long-term application of biofertilizers under different soil and climate conditions and crop types would be needed to fully assess their effect on GHG emissions and soil microbial communities along with their effect on soil microbial activity and final crop yield.

Supplementary Materials

The following supporting information can be downloaded at: https://www.mdpi.com/article/10.3390/horticulturae10010042/s1. Table S1. Primers used in this study [46,75,76,77,78]; Table S2. amoA PCR cycling conditions; Table S3. nirK PCR cycling conditions; Table S4. cbbL PCR cycling conditions; Table S5. GH7 PCR cycling conditions; Table S6. nifH PCR cycling conditions; Table S7. Pearson correlation results of the properties analyzed; Table S8. Main soil characteristics. Values mean ± standard error (n = 4). References [126,127,128,129,130] are cited in Supplementary Materials.

Author Contributions

Conceptualization, R.Z., S.M.-M., C.E.-G. and J.A.F.; methodology, R.Z., D.F.C., S.M.-M., C.E.-G. and J.A.F.; formal analysis, I.O., V.S.-M., D.S.G., E.L. and V.S.-N.; resources, R.Z. and D.F.C.; data curation, I.O.; writing—original draft preparation, I.O.; writing—review and editing, R.Z.; supervision, S.M.-M., C.E.-G., J.A.F., D.F.C. and R.Z.; project administration, D.F.C.; funding acquisition, D.F.C. and R.Z. All authors have read and agreed to the published version of the manuscript.

Funding

This work was supported by the European Commission Horizon 2020 project SoildiverAgro [grant agreement 817819].

Data Availability Statement

Data fully accessible on the SoildiverAgro Community of the repository Zenodo.

Conflicts of Interest

The authors declare no conflicts of interest.

References

  1. Cooper, R.N.; Houghton, J.T.; McCarthy, J.J.; Metz, B. Climate Change 2001: The Scientific Basis. Foreign Aff. 2002, 81, 208. [Google Scholar] [CrossRef]
  2. Oertel, C.; Matschullat, J.; Zurba, K.; Zimmermann, F.; Erasmi, S. Greenhouse Gas Emissions from Soils—A Review. Geochemistry 2016, 76, 327–352. [Google Scholar] [CrossRef]
  3. Prather, M.; Ehhalt, D.; Dentener, F.; Derwent, R.; Dlugokencky, E.; Holland, E.; Isaksen, I.; Katima, J.; Kirchhoff, V.; Matson, P.; et al. Atmospheric Chemistry and Greenhouse Gases. In Precise Soil Management as a Tool to Reduce CH4 and N2O Emissions from Agricultural Soils; Houghton, J.T., Ed.; Cambridge University Press: New York, NY, USA, 2001; pp. 239–287. [Google Scholar]
  4. Mosquera, J.; Hilhorst, M.A. Precise Soil Management as a Tool to Reduce N2O and CH4 Emissions from Agricultural Soils: Literature Review. In Proceedings of the 4th International Symposium on non-CO2 Greenhouse Gases (NCGG-4), Science, Control, Policy and Implementation, Utrecht, The Netherlands, 4–6 July 2005; Millpress Science Publishers: Rotterdam, The Netherlands, 2005; pp. 5–12. [Google Scholar]
  5. Ludwig, J.; Meixner, F.; Vogel, B.; Förstner, J. Soil-Air Exchange of Nitric Oxide: An Overview of Processes, Environmental Factors, and Modeling Studies. Biogeochemistry 2001, 52, 225–257. [Google Scholar] [CrossRef]
  6. Maraseni, T.N.; Cockfield, G. Including the Costs of Water and Greenhouse Gas Emissions in a Reassessment of the Profitability of Irrigation. Agric. Water Manag. 2012, 103, 25–32. [Google Scholar] [CrossRef]
  7. Iqbal, J.; Ronggui, H.; Lijun, D.; Lan, L.; Shan, L.; Tao, C.; Leilei, R. Differences in Soil CO2 Flux between Different Land Use Types in Mid-Subtropical China. Soil Biol. Biochem. 2008, 40, 2324–2333. [Google Scholar] [CrossRef]
  8. Sainju, U.M.; Stevens, W.B.; Caesar-TonThat, T.; Jabro, J.D. Land Use and Management Practices Impact on Plant Biomass Carbon and Soil Carbon Dioxide Emission. Soil Sci. Soc. Am. J. 2010, 74, 1613–1622. [Google Scholar] [CrossRef]
  9. Linquist, B.A.; Adviento-Borbe, M.A.; Pittelkow, C.M.; van Kessel, C.; van Groenigen, K.J. Fertilizer Management Practices and Greenhouse Gas Emissions from Rice Systems: A Quantitative Review and Analysis. Field Crops Res. 2012, 135, 10–21. [Google Scholar] [CrossRef]
  10. Piva, J.T.; Dieckow, J.; Bayer, C.; Zanatta, J.A.; de Moraes, A.; Tomazi, M.; Pauletti, V.; Barth, G.; Piccolo, M.d.C. Soil Gaseous N2O and CH4 Emissions and Carbon Pool Due to Integrated Crop-Livestock in a Subtropical Ferralsol. Agric. Ecosyst. Environ. 2014, 190, 87–93. [Google Scholar] [CrossRef]
  11. Sanz-Cobena, A.; García-Marco, S.; Quemada, M.; Gabriel, J.L.; Almendros, P.; Vallejo, A. Do Cover Crops Enhance N2O, CO2 or CH4 Emissions from Soil in Mediterranean Arable Systems? Sci. Total Environ. 2014, 466–467, 164–174. [Google Scholar] [CrossRef]
  12. Schaufler, G.; Kitzler, B.; Schindlbacher, A.; Skiba, U.; Sutton, M.A.; Zechmeister-Boltenstern, S. Greenhouse Gas Emissions from European Soils under Different Land Use: Effects of Soil Moisture and Temperature. Eur. J. Soil Sci. 2010, 61, 683–696. [Google Scholar] [CrossRef]
  13. Yan, H.; Xie, L.; Guo, L.; Fan, J.; Diao, T.; Lin, M.; Zhang, H.; Lin, E. Characteristics of Nitrous Oxide Emissions and the Affecting Factors from Vegetable Fields on the North China Plain. J. Environ. Manag. 2014, 144, 316–321. [Google Scholar] [CrossRef] [PubMed]
  14. Zornoza, R.; Acosta, J.A.; Gabarrón, M.; Gómez-Garrido, M.; Sánchez-Navarro, V.; Terrero, A.; Martínez-Martínez, S.; Faz, Á.; Pérez-Pastor, A. Greenhouse Gas Emissions and Soil Organic Matter Dynamics in Woody Crop Orchards with Different Irrigation Regimes. Sci. Total Environ. 2018, 644, 1429–1438. [Google Scholar] [CrossRef] [PubMed]
  15. Hou, C.; Song, C.; Li, Y.; Wang, J.; Song, Y.; Wang, X. Effects of Water Table Changes on Soil CO2, CH4 and N2O Fluxes during the Growing Season in Freshwater Marsh of Northeast China. Environ. Earth Sci. 2013, 69, 1963–1971. [Google Scholar] [CrossRef]
  16. Ren, C.; Wang, T.; Xu, Y.; Deng, J.; Zhao, F.; Yang, G.; Han, X.; Feng, Y.; Ren, G. Differential Soil Microbial Community Responses to the Linkage of Soil Organic Carbon Fractions with Respiration across Land-Use Changes. For. Ecol. Manag. 2018, 409, 170–178. [Google Scholar] [CrossRef]
  17. Sanz-Cobena, A.; Lassaletta, L.; Aguilera, E.; del Prado, A.; Garnier, J.; Billen, G.; Iglesias, A.; Sánchez, B.; Guardia, G.; Abalos, D.; et al. Strategies for Greenhouse Gas Emissions Mitigation in Mediterranean Agriculture: A Review. Agric. Ecosyst. Environ. 2017, 238, 5–24. [Google Scholar] [CrossRef]
  18. Hui, K.; Yuan, Y.; Xi, B.; Tan, W. A Review of the Factors Affecting the Emission of the Ozone Chemical Precursors VOCs and NOx from the Soil. Environ. Int. Anderson, I.C.; Levine, J.S. Relative Rates of Nitric Oxide and Nitrous Oxide Production by Nitrifiers, Denitrifiers, and Nitrate Respirers. Environ. Int. 2023, 172, 107799. [Google Scholar] [PubMed]
  19. Abbasi, M.K.; Adams, W.A. Gaseous N Emission during Simultaneous Nitrification–Denitrification Associated with Mineral N Fertilization to a Grassland Soil under Field Conditions. Soil Biol. Biochem. 2000, 32, 1251–1259. [Google Scholar] [CrossRef]
  20. Wang, X.; Zou, C.; Gao, X.; Guan, X.; Zhang, W.; Zhang, Y.; Shi, X.; Chen, X. Nitrous Oxide Emissions in Chinese Vegetable Systems: A Meta-Analysis. Environ. Pollut. 2018, 239, 375–383. [Google Scholar] [CrossRef]
  21. Senbayram, M.; Chen, R.; Mühling, K.H.; Dittert, K. Contribution of Nitrification and Denitrification to Nitrous Oxide Emissions from Soils after Application of Biogas Waste and Other Fertilizers. Rapid Commun. Mass Spectrom. 2009, 23, 2489–2498. [Google Scholar] [CrossRef]
  22. Hou, A.X.; Chen, G.X.; Wang, Z.P.; Van Cleemput, O.; Patrick, W.H., Jr. Methane and Nitrous Oxide Emissions from a Rice Field in Relation to Soil Redox and Microbiological Processes. Soil Sci. Soc. Am. J. 2000, 64, 2180–2186. [Google Scholar] [CrossRef]
  23. Foley, J.A.; DeFries, R.; Asner, G.P.; Barford, C.; Bonan, G.; Carpenter, S.R.; Chapin, F.S.; Coe, M.T.; Daily, G.C.; Gibbs, H.K.; et al. Global Consequences of Land Use. Science 2005, 309, 570–574. [Google Scholar] [CrossRef] [PubMed]
  24. Riaz, U.; Murtaza, D.G.; Anum, W.; Samreen, T.; Sarfraz, M.; Nazir, M. Plant Growth-Promoting Rhizobacteria (PGPR) as Biofertilizers and Biopesticides. In Microbiota and Biofertilizers; Springer: Cham, Switzerland, 2020; pp. 181–196. ISBN 978-3-030-48770-6. [Google Scholar]
  25. Hossain, M.M.; Sultana, F.; Islam, S. Plant Growth-Promoting Fungi (PGPF): Phytostimulation and Induced Systemic Resistance. In Plant-Microbe Interactions in Agro-Ecological Perspectives: Volume 2: Microbial Interactions and Agro-Ecological Impacts; Singh, D.P., Singh, H.B., Prabha, R., Eds.; Springer: Singapore, 2017; pp. 135–191. ISBN 978-981-10-6593-4. [Google Scholar]
  26. El-Saadony, M.T.; Saad, A.M.; Soliman, S.M.; Salem, H.M.; Ahmed, A.I.; Mahmood, M.; El-Tahan, A.M.; Ebrahim, A.A.M.; Abd El-Mageed, T.A.; Negm, S.H.; et al. Plant Growth-Promoting Microorganisms as Biocontrol Agents of Plant Diseases: Mechanisms, Challenges and Future Perspectives. Front. Plant Sci. 2022, 13, 923880. [Google Scholar] [CrossRef] [PubMed]
  27. Malusá, E.; Sas-Paszt, L.; Ciesielska, J. Technologies for Beneficial Microorganisms Inocula Used as Biofertilizers. Sci. World J. 2012, 2012, e491206. [Google Scholar] [CrossRef] [PubMed]
  28. Vessey, J.K. Plant Growth Promoting Rhizobacteria as Biofertilizers. Plant Soil 2003, 255, 571–586. [Google Scholar] [CrossRef]
  29. Xu, J.; Kloepper, J.W.; Huang, P.; McInroy, J.A.; Hu, C.H. Isolation and Characterization of N2-Fixing Bacteria from Giant Reed and Switchgrass for Plant Growth Promotion and Nutrient Uptake. J. Basic Microbiol. 2018, 58, 459–471. [Google Scholar] [CrossRef]
  30. Khan, M.S.; Zaidi, A.; Wani, P.A. Role of Phosphate-Solubilizing Microorganisms in Sustainable Agriculture—A Review. Agron. Sustain. Dev. 2007, 27, 29–43. [Google Scholar] [CrossRef]
  31. Ali, A.M.; Awad, M.Y.M.; Hegab, S.A.; Gawad, A.M.A.E.; Eissa, M.A. Effect of Potassium Solubilizing Bacteria (Bacillus cereus) on Growth and Yield of Potato. J. Plant Nutr. 2021, 44, 411–420. [Google Scholar] [CrossRef]
  32. Calvo, P.; Nelson, L.; Kloepper, J.W. Agricultural Uses of Plant Biostimulants. Plant Soil 2014, 383, 3–41. [Google Scholar] [CrossRef]
  33. Sarfraz, R.; Hussain, A.; Sabir, A.; Ben Fekih, I.; Ditta, A.; Xing, S. Role of Biochar and Plant Growth Promoting Rhizobacteria to Enhance Soil Carbon Sequestration—A Review. Env. Monit. Assess. 2019, 191, 251. [Google Scholar] [CrossRef]
  34. Pankievicz, V.C.S.; do Amaral, F.P.; Santos, K.F.D.N.; Agtuca, B.; Xu, Y.; Schueller, M.J.; Arisi, A.C.M.; Steffens, M.B.; de Souza, E.M.; Pedrosa, F.O.; et al. Robust Biological Nitrogen Fixation in a Model Grass–Bacterial Association. Plant J. 2015, 81, 907–919. [Google Scholar] [CrossRef]
  35. Florio, A.; Bréfort, C.; Gervaix, J.; Bérard, A.; Le Roux, X. The Responses of NO2- and N2O-Reducing Bacteria to Maize Inoculation by the PGPR Azospirillum Lipoferum CRT1 Depend on Carbon Availability and Determine Soil Gross and Net N2O Production. Soil Biol. Biochem. 2019, 136, 107524. [Google Scholar] [CrossRef]
  36. Huang, M.; Zhang, Y.; Wu, J.; Wang, Y.; Xie, Y.; Geng, Y.; Zhang, N.; Michelsen, A.; Li, S.; Zhang, R.; et al. Bacillus Velezensis SQR9 Inhibition to Fungal Denitrification Responsible for Decreased N2O Emissions from Acidic Soils. Sci. Total Environ. 2023, 885, 163789. [Google Scholar] [CrossRef] [PubMed]
  37. Paliwoda, D.; Mikiciuk, G.; Mikiciuk, M.; Miller, T.; Kisiel, A.; Sas-Paszt, L.; Kozioł, A.; Brysiewicz, A. The Use of Plant Growth Promoting Rhizobacteria to Reduce Greenhouse Gases in Strawberry Cultivation under Different Soil Moisture Conditions. Agronomy 2023, 13, 754. [Google Scholar] [CrossRef]
  38. Dimkpa, C.; Weinand, T.; Asch, F. Plant–Rhizobacteria Interactions Alleviate Abiotic Stress Conditions. Plant Cell Environ. 2009, 32, 1682–1694. [Google Scholar] [CrossRef] [PubMed]
  39. Malgioglio, G.; Rizzo, G.F.; Nigro, S.; Lefebvre du Prey, V.; Herforth-Rahmé, J.; Catara, V.; Branca, F. Plant-Microbe Interaction in Sustainable Agriculture: The Factors That May Influence the Efficacy of PGPM Application. Sustainability 2022, 14, 2253. [Google Scholar] [CrossRef]
  40. Zhou, X.; Smaill, S.J.; Clinton, P.W. Methane Oxidation Needs Less Stressed Plants. Trends Plant Sci. 2013, 18, 657–659. [Google Scholar] [CrossRef]
  41. Shah, A.M.; Khan, I.M.; Shah, T.I.; Bangroo, S.A.; Kirmani, N.A.; Nazir, S.; Malik, A.R.; Aezum, A.M.; Mir, Y.H.; Hilal, A.; et al. Soil Microbiome: A Treasure Trove for Soil Health Sustainability under Changing Climate. Land 2022, 11, 1887. [Google Scholar] [CrossRef]
  42. Ortega Pérez, R.; Nieto García, J.C.; Gallegos-Cedillo, V.M.; Domene Ruiz, M.Á.; Santos Hernández, M.; Nájera, C.; Miralles Mellado, I.; Diánez Martínez, F. Biofertilizers Enriched with PGPB Improve Soil Fertility and the Productivity of an Intensive Tomato Crop. Agronomy 2023, 13, 2286. [Google Scholar] [CrossRef]
  43. Lori, M.; Symnaczik, S.; Mäder, P.; De Deyn, G.; Gattinger, A. Organic Farming Enhances Soil Microbial Abundance and Activity—A Meta-Analysis and Meta-Regression. PLoS ONE 2017, 12, e0180442. [Google Scholar] [CrossRef]
  44. Chen, X.-P.; Zhu, Y.-G.; Xia, Y.; Shen, J.-P.; He, J.-Z. Ammonia-Oxidizing Archaea: Important Players in Paddy Rhizosphere Soil? Environ. Microbiol. 2008, 10, 1978–1987. [Google Scholar] [CrossRef]
  45. Henry, S.; Bru, D.; Stres, B.; Hallet, S.; Philippot, L. Quantitative Detection of the nosZ Gene, Encoding Nitrous Oxide Reductase, and Comparison of the Abundances of 16S rRNA, narG, nirK, and nosZ Genes in Soils. Appl. Environ. Microbiol. 2006, 72, 5181–5189. [Google Scholar] [CrossRef]
  46. Poly, F.; Ranjard, L.; Nazaret, S.; Gourbière, F.; Monrozier, L.J. Comparison of nifH Gene Pools in Soils and Soil Microenvironments with Contrasting Properties. Appl. Environ. Microbiol. 2001, 67, 2255–2262. [Google Scholar] [CrossRef]
  47. Yousuf, B.; Keshri, J.; Mishra, A.; Jha, B. Application of Targeted Metagenomics to Explore Abundance and Diversity of CO2-Fixing Bacterial Community Using cbbL Gene from the Rhizosphere of Arachis Hypogaea. Gene 2012, 506, 18–24. [Google Scholar] [CrossRef] [PubMed]
  48. Fan, F.; Li, Z.; Wakelin, S.A.; Yu, W.; Liang, Y. Mineral Fertilizer Alters Cellulolytic Community Structure and Suppresses Soil Cellobiohydrolase Activity in a Long-Term Fertilization Experiment. Soil Biol. Biochem. 2012, 55, 70–77. [Google Scholar] [CrossRef]
  49. Henry, H.A.L.; Juarez, J.D.; Field, C.B.; Vitousek, P.M. Interactive Effects of Elevated CO2, N Deposition and Climate Change on Extracellular Enzyme Activity and Soil Density Fractionation in a California Annual Grassland. Glob. Chang. Biol. 2005, 11, 1808–1815. [Google Scholar] [CrossRef]
  50. Sinsabaugh, R.L.; Lauber, C.L.; Weintraub, M.N.; Ahmed, B.; Allison, S.D.; Crenshaw, C.; Contosta, A.R.; Cusack, D.; Frey, S.; Gallo, M.E.; et al. Stoichiometry of Soil Enzyme Activity at Global Scale. Ecol. Lett. 2008, 11, 1252–1264. [Google Scholar] [CrossRef]
  51. Acosta-Martinez, V.; Cano, A.; Johnson, J. Simultaneous Determination of Multiple Soil Enzyme Activities for Soil Health-Biogeochemical Indices. Appl. Soil Ecol. 2018, 126, 121–128. [Google Scholar] [CrossRef]
  52. Deng, S.P.; Tabatabai, M.A. Cellulase Activity of Soils. Soil Biol. Biochem. 1994, 26, 1347–1354. [Google Scholar] [CrossRef]
  53. Krajewska, B.; Ureases, I. Functional, Catalytic and Kinetic Properties: A Review. J. Mol. Catal. B Enzym. 2009, 59, 9–21. [Google Scholar] [CrossRef]
  54. Morales, S.E.; Cosart, T.; Holben, W.E. Bacterial Gene Abundances as Indicators of Greenhouse Gas Emission in Soils. ISME J. 2010, 4, 799–808. [Google Scholar] [CrossRef]
  55. Nannipieri, P.; Ascher, J.; Ceccherini, M.T.; Landi, L.; Pietramellara, G.; Renella, G. Microbial Diversity and Soil Functions. Eur. J. Soil Sci. 2003, 54, 655–670. [Google Scholar] [CrossRef]
  56. Chaudhary, D.R.; Rathore, A.P.; Sharma, S. Effect of Halotolerant Plant Growth Promoting Rhizobacteria Inoculation on Soil Microbial Community Structure and Nutrients. Appl. Soil Ecol. 2020, 150, 103461. [Google Scholar] [CrossRef]
  57. Siddikee, M.A.; Zereen, M.I.; Li, C.-F.; Dai, C.-C. Endophytic Fungus Phomopsis Liquidambari and Different Doses of N-Fertilizer Alter Microbial Community Structure and Function in Rhizosphere of Rice. Sci. Rep. 2016, 6, 32270. [Google Scholar] [CrossRef]
  58. Wang, H.-W.; Zhu, Y.-X.; Xu, M.; Cai, X.-Y.; Tian, F. Co-Application of Spent Mushroom Substrate and PGPR Alleviates Tomato Continuous Cropping Obstacle by Regulating Soil Microbial Properties. Rhizosphere 2022, 23, 100563. [Google Scholar] [CrossRef]
  59. Sun, B.; Gu, L.; Bao, L.; Zhang, S.; Wei, Y.; Bai, Z.; Zhuang, G.; Zhuang, X. Application of Biofertilizer Containing Bacillus Subtilis Reduced the Nitrogen Loss in Agricultural Soil. Soil Biol. Biochem. 2020, 148, 107911. [Google Scholar] [CrossRef]
  60. Wu, S.; Zhuang, G.; Bai, Z.; Cen, Y.; Xu, S.; Sun, H.; Han, X.; Zhuang, X. Mitigation of Nitrous Oxide Emissions from Acidic Soils by Bacillus Amyloliquefaciens, a Plant Growth-Promoting Bacterium. Glob. Chang. Biol. 2018, 24, 2352–2365. [Google Scholar] [CrossRef]
  61. Conversa, G.; Lazzizera, C.; Bonasia, A.; Elia, A. Growth, N Uptake and N Critical Dilution Curve in Broccoli Cultivars Grown under Mediterranean Conditions. Sci. Hortic. 2019, 244, 109–121. [Google Scholar] [CrossRef]
  62. IUSS, WRB World Reference Base for Soil Resources. International Soil Classification System for Naming Soils and Creating Legends for Soil Maps, 4th ed.; International Union of Soil Sciences (IUSS): Vienna, Austria, 2022. [Google Scholar]
  63. CARM Normativa Reguladora, Producción Integrada, Alimentos Sanos y Garantizados [Regulatory Rules, Integrated Production, Healthy Food and Guaranteed]; Consejería de Agricultura y Agua de La Región de Murcia: Murcia, Spain, 1998.
  64. He, Y.; Pantigoso, H.A.; Wu, Z.; Vivanco, J.M. Co-Inoculation of Bacillus sp. and Pseudomonas Putida at Different Development Stages Acts as a Biostimulant to Promote Growth, Yield and Nutrient Uptake of Tomato. J. Appl. Microbiol. 2019, 127, 196–207. [Google Scholar] [CrossRef]
  65. Álvaro-Fuentes, J.; Lóczy, D.; Thiele-Bruhn, S.; Zornoza, R. Handbook of Plant and Soil Analysis for Agricultural Systems; Universidad Politécnica de Cartagena: Cartagena, Spain, 2019; ISBN 978-84-16325-86-3. [Google Scholar]
  66. Chen, W.; Wang, Y.; Zhao, Z.; Cui, F.; Gu, J.; Zheng, X. The Effect of Planting Density on Carbon Dioxide, Methane and Nitrous Oxide Emissions from a Cold Paddy Field in the Sanjiang Plain, Northeast China. Agric. Ecosyst. Environ. 2013, 178, 64–70. [Google Scholar] [CrossRef]
  67. Zornoza, R.; Landi, L.; Nannipieri, P.; Renella, G. A Protocol for the Assay of Arylesterase Activity in Soil. Soil Biol. Biochem. 2009, 41, 659–662. [Google Scholar] [CrossRef]
  68. Vance, E.D.; Brookes, P.C.; Jenkinson, D.S. An Extraction Method for Measuring Soil Microbial Biomass C. Soil Biol. Biochem. 1987, 19, 703–707. [Google Scholar] [CrossRef]
  69. Keeney, D.R.; Nelson, D.w. Nitrogen—Inorganic Forms. In Methods of Soil Analysis; John Wiley & Sons, Ltd.: Hoboken, NJ, USA, 1983; pp. 643–698. ISBN 978-0-89118-977-0. [Google Scholar]
  70. Kandeler, E.; Gerber, H. Short-Term Assay of Soil Urease Activity Using Colorimetric Determination of Ammonium. Biol. Fertil. Soils 1988, 6, 68–72. [Google Scholar] [CrossRef]
  71. Ekenler, M.; Tabatabai, M.A. β-Glucosaminidase Activity as an Index of Nitrogen Mineralization in Soils. Commun. Soil Sci. Plant Anal. 2004, 35, 1081–1094. [Google Scholar] [CrossRef]
  72. Garcia-Alvarez, A.; Ibañez, J.J. Seasonal Fluctuations and Crop Influence on Microbiota and Enzyme Activity in Fully Developed Soils of Central Spain. Arid Soil Res. Rehabil. 1994, 8, 161–178. [Google Scholar] [CrossRef]
  73. Nelson, N. A Photometric Adaptation of the Somogyi Method for the Determination of Glucose. J. Biol. Chem. 1944, 153, 375–380. [Google Scholar] [CrossRef]
  74. Nannipieri, P.; Johnson, R.L.; Paul, E.A. Criteria for Measurement of Microbial Growth and Activity in Soil. Soil Biol. Biochem. 1978, 10, 223–229. [Google Scholar] [CrossRef]
  75. Rotthauwe, J.H.; Witzel, K.P.; Liesack, W. The Ammonia Monooxygenase Structural Gene amoA as a Functional Marker: Molecular Fine-Scale Analysis of Natural Ammonia-Oxidizing Populations. Appl. Environ. Microbiol. 1997, 63, 4704–4712. [Google Scholar] [CrossRef] [PubMed]
  76. Henry, S.; Baudoin, E.; López-Gutiérrez, J.C.; Martin-Laurent, F.; Brauman, A.; Philippot, L. Quantification of Denitrifying Bacteria in Soils by nirK Gene Targeted Real-Time PCR. J. Microbiol. Methods 2004, 59, 327–335. [Google Scholar] [CrossRef]
  77. Selesi, D.; Schmid, M.; Hartmann, A. Diversity of Green-Like and Red-Like Ribulose-1,5-Bisphosphate Carboxylase/Oxygenase Large-Subunit Genes (cbbL) in Differently Managed Agricultural Soils. Appl. Environ. Microbiol. 2005, 71, 175–184. [Google Scholar] [CrossRef]
  78. Tian, X.; Yang, T.; He, J.; Chu, Q.; Jia, X.; Huang, J. Fungal Community and Cellulose-Degrading Genes in the Composting Process of Chinese Medicinal Herbal Residues. Bioresour. Technol. 2017, 241, 374–383. [Google Scholar] [CrossRef]
  79. Frostegård, Å.; Bååth, E.; Tunlio, A. Shifts in the Structure of Soil Microbial Communities in Limed Forests as Revealed by Phospholipid Fatty Acid Analysis. Soil Biol. Biochem. 1993, 25, 723–730. [Google Scholar] [CrossRef]
  80. Joergensen, R.G. Phospholipid Fatty Acids in Soil—Drawbacks and Future Prospects. Biol. Fertil. Soils 2022, 58, 1–6. [Google Scholar] [CrossRef]
  81. Tang, X.; Liu, S.; Zhou, G.; Zhang, D.; Zhou, C. Soil-Atmospheric Exchange of CO2, CH4, and N2O in Three Subtropical Forest Ecosystems in Southern China. Glob. Chang. Biol. 2006, 12, 546–560. [Google Scholar] [CrossRef]
  82. Iqbal, J.; Lin, S.; Hu, R.; Feng, M. Temporal Variability of Soil-Atmospheric CO2 and CH4 Fluxes from Different Land Uses in Mid-Subtropical China. Atmos. Environ. 2009, 43, 5865–5875. [Google Scholar] [CrossRef]
  83. Curiel Yuste, J.; Baldocchi, D.D.; Gershenson, A.; Goldstein, A.; Misson, L.; Wong, S. Microbial Soil Respiration and Its Dependency on Carbon Inputs, Soil Temperature and Moisture. Glob. Chang. Biol. 2007, 13, 2018–2035. [Google Scholar] [CrossRef]
  84. Arai, H.; Hadi, A.; Darung, U.; Limin, S.H.; Takahashi, H.; Hatano, R.; Inubushi, K. Land Use Change Affects Microbial Biomass and Fluxes of Carbon Dioxide and Nitrous Oxide in Tropical Peatlands. Soil Sci. Plant Nutr. 2014, 60, 423–434. [Google Scholar] [CrossRef]
  85. Furukawa, Y.; Inubushi, K.; Ali, M.; Itang, A.M.; Tsuruta, H. Effect of Changing Groundwater Levels Caused by Land-Use Changes on Greenhouse Gas Fluxes from Tropical Peat Lands. Nutr. Cycl. Agroecosystems 2005, 71, 81–91. [Google Scholar] [CrossRef]
  86. Li, Y.; Niu, W.; Wang, J.; Liu, L.; Zhang, M.; Xu, J. Effects of Artificial Soil Aeration Volume and Frequency on Soil Enzyme Activity and Microbial Abundance When Cultivating Greenhouse Tomato. Soil Sci. Soc. Am. J. 2016, 80, 1208–1221. [Google Scholar] [CrossRef]
  87. Zhu, Y.; Cai, H.; Song, L.; Chen, H. Aerated Irrigation Promotes Soil Respiration and Microorganism Abundance around Tomato Rhizosphere. Soil Sci. Soc. Am. J. 2019, 83, 1343–1355. [Google Scholar] [CrossRef]
  88. Mayer, H.P.; Conrad, R. Factors Influencing the Population of Methanogenic Bacteria and the Initiation of Methane Production upon Flooding of Paddy Soil. FEMS Microbiol. Ecol. 1990, 6, 103–111. [Google Scholar] [CrossRef]
  89. Fan, Y.; Hao, X.; Carswell, A.; Misselbrook, T.; Ding, R.; Li, S.; Kang, S. Inorganic Nitrogen Fertilizer and High N Application Rate Promote N2O Emission and Suppress CH4 Uptake in a Rotational Vegetable System. Soil Tillage Res. 2021, 206, 104848. [Google Scholar] [CrossRef]
  90. Sun, B.; Dong, Z.-X.; Zhang, X.-X.; Li, Y.; Cao, H.; Cui, Z.-L. Rice to Vegetables: Short- Versus Long-Term Impact of Land-Use Change on the Indigenous Soil Microbial Community. Microb. Ecol. 2011, 62, 474–485. [Google Scholar] [CrossRef] [PubMed]
  91. Stark, C.H.; Condron, L.M.; O’Callaghan, M.; Stewart, A.; Di, H.J. Differences in Soil Enzyme Activities, Microbial Community Structure and Short-Term Nitrogen Mineralisation Resulting from Farm Management History and Organic Matter Amendments. Soil Biol. Biochem. 2008, 40, 1352–1363. [Google Scholar] [CrossRef]
  92. Lüneberg, K.; Schneider, D.; Siebe, C.; Daniel, R. Drylands Soil Bacterial Community Is Affected by Land Use Change and Different Irrigation Practices in the Mezquital Valley, Mexico. Sci. Rep. 2018, 8, 1413. [Google Scholar] [CrossRef] [PubMed]
  93. Matysek, M.; Leake, J.; Banwart, S.; Johnson, I.; Page, S.; Kaduk, J.; Smalley, A.; Cumming, A.; Zona, D. Impact of Fertiliser, Water Table, and Warming on Celery Yield and CO2 and CH4 Emissions from Fenland Agricultural Peat. Sci. Total Environ. 2019, 667, 179–190. [Google Scholar] [CrossRef] [PubMed]
  94. Ding, Y.; Li, C.; Li, Z.; Liu, S.; Zou, Y.; Gao, X.; Cai, Y.; Siddique, K.H.M.; Wu, P.; Zhao, X. Greenhouse Gas Emission Responses to Different Soil Amendments on the Loess Plateau, China. Agric. Ecosyst. Environ. 2023, 342, 108233. [Google Scholar] [CrossRef]
  95. Flessa, H.; Ruser, R.; Dörsch, P.; Kamp, T.; Jimenez, M.A.; Munch, J.C.; Beese, F. Integrated Evaluation of Greenhouse Gas Emissions (CO2, CH4, N2O) from Two Farming Systems in Southern Germany. Agric. Ecosyst. Environ. 2002, 91, 175–189. [Google Scholar] [CrossRef]
  96. Glatzel, S.; Stahr, K. Methane and Nitrous Oxide Exchange in Differently Fertilised Grassland in Southern Germany. Plant Soil 2001, 231, 21–35. [Google Scholar] [CrossRef]
  97. Iqbal, J.; Hu, R.; Feng, M.; Lin, S.; Malghani, S.; Ali, I.M. Microbial Biomass, and Dissolved Organic Carbon and Nitrogen Strongly Affect Soil Respiration in Different Land Uses: A Case Study at Three Gorges Reservoir Area, South China. Agric. Ecosyst. Environ. 2010, 137, 294–307. [Google Scholar] [CrossRef]
  98. Zhang, S.; Fang, Y.; Luo, Y.; Li, Y.; Ge, T.; Wang, Y.; Wang, H.; Yu, B.; Song, X.; Chen, J.; et al. Linking Soil Carbon Availability, Microbial Community Composition and Enzyme Activities to Organic Carbon Mineralization of a Bamboo Forest Soil Amended with Pyrogenic and Fresh Organic Matter. Sci. Total Environ. 2021, 801, 149717. [Google Scholar] [CrossRef]
  99. Tang, Y.; Yu, G.; Zhang, X.; Wang, Q.; Tian, J.; Niu, S.; Tian, D.; Ge, J. Different Strategies for Regulating Free-Living N2 Fixation in Nutrient-Amended Subtropical and Temperate Forest Soils. Appl. Soil Ecol. 2019, 136, 21–29. [Google Scholar] [CrossRef]
  100. Duff, A.M.; Forrestal, P.; Ikoyi, I.; Brennan, F. Assessing the Long-Term Impact of Urease and Nitrification Inhibitor Use on Microbial Community Composition, Diversity and Function in Grassland Soil. Soil Biol. Biochem. 2022, 170, 108709. [Google Scholar] [CrossRef]
  101. Kuypers, M.M.M.; Marchant, H.K.; Kartal, B. The Microbial Nitrogen-Cycling Network. Nat. Rev. Microbiol. 2018, 16, 263–276. [Google Scholar] [CrossRef] [PubMed]
  102. Wang, C.; Zheng, M.; Song, W.; Wen, S.; Wang, B.; Zhu, C.; Shen, R. Impact of 25 Years of Inorganic Fertilization on Diazotrophic Abundance and Community Structure in an Acidic Soil in Southern China. Soil Biol. Biochem. 2017, 113, 240–249. [Google Scholar] [CrossRef]
  103. Ouyang, Y.; Evans, S.E.; Friesen, M.L.; Tiemann, L.K. Effect of Nitrogen Fertilization on the Abundance of Nitrogen Cycling Genes in Agricultural Soils: A Meta-Analysis of Field Studies. Soil Biol. Biochem. 2018, 127, 71–78. [Google Scholar] [CrossRef]
  104. Dynarski, K.A.; Houlton, B.Z. Nutrient Limitation of Terrestrial Free-Living Nitrogen Fixation. New Phytol. 2018, 217, 1050–1061. [Google Scholar] [CrossRef]
  105. Yuan, H.; Ge, T.; Chen, C.; O’Donnell, A.G.; Wu, J. Significant Role for Microbial Autotrophy in the Sequestration of Soil Carbon. Appl. Environ. Microbiol. 2012, 78, 2328–2336. [Google Scholar] [CrossRef]
  106. Van Hees, P.A.W.; Jones, D.L.; Finlay, R.; Godbold, D.L.; Lundström, U.S. The Carbon We Do Not See—The Impact of Low Molecular Weight Compounds on Carbon Dynamics and Respiration in Forest Soils: A Review. Soil Biol. Biochem. 2005, 37, 1–13. [Google Scholar] [CrossRef]
  107. Abdel-Rahman, M.A.; Nour El-Din, M.; Refaat, B.M.; Abdel-Shakour, E.H.; Ewais, E.E.-D.; Alrefaey, H.M.A. Biotechnological Application of Thermotolerant Cellulose-Decomposing Bacteria in Composting of Rice Straw. Ann. Agric. Sci. 2016, 61, 135–143. [Google Scholar] [CrossRef]
  108. Ahmad, B.; Nigar, S.; Malik, N.A.; Bashir, S.; Ali, J.; Yousaf, S.; Bangash, J.A.; Jan, I. Isolation and Characterization of Cellulolytic Nitrogen Fixing Azotobacter Species from Wheat Rhizosphere of Khyber Pakhtunkhwa. World Appl. Sci. J. 2013, 27, 51–60. [Google Scholar]
  109. Emtiazi, G.; Etemadifar, Z.; Tavassoli, M. A Novel Nitrogen-Fixing Cellulytic Bacterium Associated with Root of Corn Is a Candidate for Production of Single Cell Protein. Biomass Bioenergy 2003, 25, 423–426. [Google Scholar] [CrossRef]
  110. Harindintwali, J.D.; Zhou, J.; Yu, X. Lignocellulosic Crop Residue Composting by Cellulolytic Nitrogen-Fixing Bacteria: A Novel Tool for Environmental Sustainability. Sci. Total Environ. 2020, 715, 136912. [Google Scholar] [CrossRef]
  111. Miao, F.; Li, Y.; Cui, S.; Jagadamma, S.; Yang, G.; Zhang, Q. Soil Extracellular Enzyme Activities under Long-Term Fertilization Management in the Croplands of China: A Meta-Analysis. Nutr. Cycl. Agroecosystems 2019, 114, 125–138. [Google Scholar] [CrossRef]
  112. García-Orenes, F.; Morugán-Coronado, A.; Zornoza, R.; Scow, K. Changes in Soil Microbial Community Structure Influenced by Agricultural Management Practices in a Mediterranean Agro-Ecosystem. PLoS ONE 2013, 8, e80522. [Google Scholar] [CrossRef] [PubMed]
  113. Siles, J.A.; Vera, A.; Díaz-López, M.; García, C.; van den Hoogen, J.; Crowther, T.W.; Eisenhauer, N.; Guerra, C.; Jones, A.; Orgiazzi, A.; et al. Land-Use- and Climate-Mediated Variations in Soil Bacterial and Fungal Biomass across Europe and Their Driving Factors. Geoderma 2023, 434, 116474. [Google Scholar] [CrossRef]
  114. Yang, T.; Li, X.; Hu, B.; Wei, D.; Wang, Z.; Bao, W. Soil Microbial Biomass and Community Composition along a Latitudinal Gradient in the Arid Valleys of Southwest China. Geoderma 2022, 413, 115750. [Google Scholar] [CrossRef]
  115. Bastida, F.; Eldridge, D.J.; García, C.; Kenny Png, G.; Bardgett, R.D.; Delgado-Baquerizo, M. Soil Microbial Diversity–Biomass Relationships Are Driven by Soil Carbon Content across Global Biomes. ISME J. 2021, 15, 2081–2091. [Google Scholar] [CrossRef]
  116. Wang, H.; Liu, S.; Li, H.; Tao, X.; Wang, H.; Qi, J.; Zhang, Z. Large-Scale Homogenization of Soil Bacterial Communities in Response to Agricultural Practices in Paddy Fields, China. Soil Biol. Biochem. 2022, 164, 108490. [Google Scholar] [CrossRef]
  117. Di Salvo, L.P.; Cellucci, G.C.; Carlino, M.E.; García de Salamone, I.E. Plant Growth-Promoting Rhizobacteria Inoculation and Nitrogen Fertilization Increase Maize (Zea mays L.) Grain Yield and Modified Rhizosphere Microbial Communities. Appl. Soil Ecol. 2018, 126, 113–120. [Google Scholar] [CrossRef]
  118. Sabier Saeed, K.; Abdulla Ahmed, S.; Ahmaed Hassan, I.; Hamed Ahmed, P. Effect of Bio-Fertilizer and Chemical Fertilizer on Growth and Yield in Cucumber (Cucumis sativus) in Green House Condition. Pak. J. Biol. Sci. 2015, 18, 129–134. [Google Scholar] [CrossRef]
  119. Angelina, E.; Papatheodorou, E.M.; Demirtzoglou, T.; Monokrousos, N. Effects of Bacillus Subtilis and Pseudomonas Fluorescens Inoculation on Attributes of the Lettuce (Lactuca sativa L.) Soil Rhizosphere Microbial Community: The Role of the Management System. Agronomy 2020, 10, 1428. [Google Scholar] [CrossRef]
  120. Qiu, Z.; Egidi, E.; Liu, H.; Kaur, S.; Singh, B.K. New Frontiers in Agriculture Productivity: Optimised Microbial Inoculants and in Situ Microbiome Engineering. Biotechnol. Adv. 2019, 37, 107371. [Google Scholar] [CrossRef] [PubMed]
  121. Fiorentino, N.; Ventorino, V.; Woo, S.L.; Pepe, O.; De Rosa, A.; Gioia, L.; Romano, I.; Lombardi, N.; Napolitano, M.; Colla, G.; et al. Trichoderma-Based Biostimulants Modulate Rhizosphere Microbial Populations and Improve N Uptake Efficiency, Yield, and Nutritional Quality of Leafy Vegetables. Front. Plant Sci. 2018, 9, 743. [Google Scholar] [CrossRef] [PubMed]
  122. Siebers, M.; Rohr, T.; Ventura, M.; Schütz, V.; Thies, S.; Kovacic, F.; Jaeger, K.-E.; Berg, M.; Dörmann, P.; Schulz, M. Disruption of Microbial Community Composition and Identification of Plant Growth Promoting Microorganisms after Exposure of Soil to Rapeseed-Derived Glucosinolates. PLoS ONE 2018, 13, e0200160. [Google Scholar] [CrossRef]
  123. Ju, W.; Liu, L.; Fang, L.; Cui, Y.; Duan, C.; Wu, H. Impact of Co-Inoculation with Plant-Growth-Promoting Rhizobacteria and Rhizobium on the Biochemical Responses of Alfalfa-Soil System in Copper Contaminated Soil. Ecotoxicol. Environ. Saf. 2019, 167, 218–226. [Google Scholar] [CrossRef] [PubMed]
  124. Hidri, R.; Metoui-Ben Mahmoud, O.; Debez, A.; Abdelly, C.; Barea, J.-M.; Azcon, R. Modulation of C:N:P Stoichiometry Is Involved in the Effectiveness of a PGPR and AM Fungus in Increasing Salt Stress Tolerance of Sulla Carnosa Tunisian Provenances. Appl. Soil Ecol. 2019, 143, 161–172. [Google Scholar] [CrossRef]
  125. Egamberdiyeva, D. The Effect of Plant Growth Promoting Bacteria on Growth and Nutrient Uptake of Maize in Two Different Soils. Appl. Soil Ecol. 2007, 36, 184–189. [Google Scholar] [CrossRef]
  126. Mourão, I.; Brito, M. Effects of Direct Film Crop Cover and Top Dress Nitrogen on Earliness and Yield of Broccoli Crop (Brassica oleracea Var. Italica Plenk). In Proceedings of the International Conference on Environmental Problems Associated with Nitrogen Fertilisation of Field Grown Vegetable Crops 563, Postdam, Germany, 30 August–1 September 1999; pp. 103–109. [Google Scholar]
  127. Nuzzo, A.; Satpute, A.; Albrecht, U.; Strauss, S.L. Impact of Soil Microbial Amendments on Tomato Rhizosphere Microbiome and Plant Growth in Field Soil. Microb. Ecol. 2020, 80, 398–409. [Google Scholar] [CrossRef]
  128. Schenck zu Schweinsberg-Mickan, M.; Müller, T. Impact of Effective Microorganisms and Other Biofertilizers on Soil Microbial Characteristics, Organic-Matter Decomposition, and Plant Growth. J. Plant Nutr. Soil Sci. 2009, 172, 704–712. [Google Scholar] [CrossRef]
  129. Martínez-Viveros, O.; Jorquera, M.A.; Crowley, D.E.; Gajardo, G.; Mora, M.L. Mechanisms and practical considerations involved in plant growth promotion by rhizobacteria. J. Soil Sci. Plant Nutr. 2010, 10, 293–319. [Google Scholar] [CrossRef]
  130. Kim, S.; Kim, S.; Kiniry, J.R.; Ku, K.-M. A Hybrid Decision Tool for Optimizing Broccoli Production in a Changing Climate. Hortic. Environ. Biotechnol. 2021, 62, 299–312. [Google Scholar] [CrossRef]
Figure 1. Environmental conditions over the course of the experiment (A1,A2), soil CO2 emission rates (B), soil N2O emission rates (C), and CH4 emission rates (D) in broccoli cultivation with different fertilization treatments. Vertical bars denote the standard error. P: precipitation; T: soil temperature.; M: soil moisture; TMAX and TMIN: maximum and minimum temperature, respectively; HMED: relative humidity; BA + FU (F50 + the application of a formulation of bacteria and non-mycorrhizal fungi), BA (F50 + the application of a formulation of nitrogen-fixing and phosphorus- and potassium-solubilizing bacteria), F50 (50% of the rate of inorganic fertilizers added in F100), F100 (inorganic fertilizers applied at the rate to cover the nutritional demands of the crop). Blue and yellow icons indicate the days of applications of biofertilizers. Arrows indicate the days of harvest. For repeated measures ANOVA data: significant at *** p < 0.001; ** p < 0.01; ns: not significant (p > 0.05).
Horticulturae 10 00042 g001
Figure 2. Boxplots show abundance of N- and C-cycle genes: amoA (a), nifH (b), nirK (c). GH7 (d), cbbL (e) in soils under the different fertilization treatments. BA + FU (F50 + the application of a formulation of bacteria and non-mycorrhizal fungi) in green, BA (F50 + the application of a formulation of nitrogen-fixing and phosphorus- and potassium-solubilizing bacteria) in red, F50 (50% of the rate of inorganic fertilizers added in F100) in purple, F100 (inorganic fertilizers applied at the rate to cover the nutritional demands of the crop) in blue. Values are mean ± standard error (n = 4).
Horticulturae 10 00042 g002
Figure 3. PCA factor scores of variations in soil properties in the broccoli crop submitted to different fertilization strategies. BA + FU (F50 + the application of a formulation of bacteria and non-mycorrhizal fungi), BA (F50 + the application of a formulation of nitrogen-fixing and phosphorus- and potassium-solubilizing bacteria), F50 (50% of the rate of inorganic fertilizers added in F100), F100 (inorganic fertilizers applied at the rate to cover the nutritional demands of the crop).
Horticulturae 10 00042 g003
Table 1. Cumulative values of soil CO2, N2O, CH4, and total CO2 equivalent emissions, crop yield, and cumulative CO2 equivalent emission data expressed on a production basis released from the soil in the broccoli crop with different fertilization treatments. The values shown are mean ± standard error (n = 4).
TreatmentCumulative CO2Cumulative N2OCumulative CH4CO2eCrop YieldCO2e
g m−2kg ha−1g kg−1 of Crop Yield
BA + FU261.5 ± 19.70.0 ± 0.03.0 ± 0.3351.3 ± 14.415,082.3 ± 894.3225.0 ± 12.6
BA242.8 ± 24.40.1 ± 0.12.1 ± 0.4327.7 ± 36.714,928.3 ± 886.4203.3 ± 18.4
F50233.8 ± 16.70.1 ± 0.13.0 ± 0.7360.0 ± 43.615,622.7 ± 1736.2262.3 ± 27.6
F100250.3 ± 8.10.0 ± 0.03.1 ± 0.4347.2 ± 22.316,797.3 ± 650.3204.3 ± 24.9
F-ANOVA0.744 ns0.336 ns0.518 ns0.903 ns0.649 ns0.260 ns
BA + FU (F50 + the application of a formulation of bacteria and non-mycorrhizal fungi), BA (F50 + the application of a formulation of nitrogen-fixing and phosphorus- and potassium-solubilizing bacteria), F50 (50% of the rate of inorganic fertilizers added in F100), F100 (inorganic fertilizers applied at the rate to cover the nutritional demands of the crop), ns: not significant (p > 0.05).
Table 2. Soil enzyme activities and chemical properties in terms of fertilization treatments in the broccoli crop. Values are mean ± standard error (n = 4).
BA + FUBAF50F100F-ANOVA
Clsμmol gearbox sugars g−1 h−136.3 ± 6.020.3 ± 11.130.1 ± 10.331.0 ± 3.450.649 ns
Ursμmol NH4+ g−1 h−14.9 ± 1.44.7 ± 0.84.1 ± 0.77.2 ± 2.11.049 ns
Arylμmol PNP g−1 h−113.3 ± 1.815.4 ± 1.914.4 ± 1.215.6 ± 0.90.490 ns
Gluμmol PNP g−1 h−10.3 ± 0.00.3 ± 0.00.3 ± 0.10.3 ± 0.00.505 ns
M%14.4 ± 0.615.5 ± 0.915.4 ± 0.813.6 ± 0.50.254 ns
SOC%1.0 ± 0.01.0 ± 0.11.1 ± 0.01.0 ± 0.10.656 ns
Nt%0.1 ± 0.00.1 ± 0.00.1 ± 0.00.1 ± 0.00.411 ns
Csolmg kg−11405.8 ± 71.41255.5 ± 136.41080.5 ± 52.31129.5 ± 56.60.082 ns
Nsolmg kg−194.6 ± 8.378.2 ± 7.298.1 ± 16.895.0 ± 4.40.534 ns
NO3mg kg−147.2 ± 13.633.2 ± 5.540.4 ± 6.179.8 ± 19.00.088 ns
NH4+mg kg−11.7 ± 0.01.8 ± 0.11.7 ± 0.01.8 ± 0.00.293 ns
BA + FU (F50 + the application of a formulation of bacteria and non-mycorrhizal fungi), BA (F50 + the application of a formulation of nitrogen-fixing and phosphorus- and potassium-solubilizing bacteria), F50 (50% of the rate of inorganic fertilizers added in F100), F100 (inorganic fertilizers applied at the rate to cover the nutritional demands of the crop). Cls: Cellulase activity; Urs: Urease activity; Aryl: Arylestrerase activity; Glu: β-glucosidase activity; M: Soil moisture; SOC: soil organic carbon; Nt: Total nitrogen; Csol: Soluble carbon; Nsol: Soluble nitrogen; PNP: p-nitrophenol; ns: not significant (p > 0.05).
Table 3. Microbial biomass and microbial groups based on PLFA biomarkers (nmol g−1). Values are mean and standard error (n = 4).
Microbial GroupsBA + FUBAF50F100F-ANOVA
nmol g−1
Total PLFA15.6 ± 1.015.8 ± 1.115.6± 1.114.6 ± 0.70.834 ns
Firmicutes3.6 ± 0.23.5 ± 0.33.4 ± 0.33.1 ± 0.20.523 ns
Actinobacteria1.8 ± 0.11.7 ± 0.11.4 ± 0.11.5 ± 0.10.097 ns
Gram-positive5.4 ± 0.35.2 ± 0.44.7 ± 0.24.6 ± 0.30.265 ns
Gram-negative2.5 ± 0.22.7 ± 0.22.9 ± 0.22.6 ± 0.20.729 ns
Bacteria7.9 ± 0.57.8 ± 0.67.6 ± 0.47.2 ± 0.50.763 ns
AMFbdlbdlbdlbdl
Zygomycota2.0 ± 0.22.1 ± 0.12.2 ± 0.21.9 ± 0.10.558 ns
Ascomycota and Basidiomycota0.5 ± 0.00.6 ± 0.00.6 ± 0.00.6 ± 0.00.194 ns
Total fungi2.6 ± 0.22.7 ± 0.12.8 ± 0.32.5 ± 0.10.530 ns
Unspecific microbial PLFA5.1 ± 0.45.3 ± 0.45.1 ± 0.44.9 ± 0.20.922 ns
ns: not significant; bdl: below detection limit.
Table 4. Multiple linear regression model for cumulative CO2 emissions in a broccoli crop.
YXmPartial CorrelationβR2R2 adjF Value
Cumulative CO2 (mg m−2)Constant422.86 0.700.6310.34
(p < 0.01)
nifH (Log copies g−1 dry weight)−57.51−0.70−0.56
Crop yield (kg ha−1)0.010.680.52
Table 5. Matrix of PCA obtained with all soil properties, including cumulative values of GHG emissions.
Variance ExplainedPC1 (33.98%)PC2 (11.50%)PC3 (10.01%)PC4 (8.70%)
Total PLFA0.980.060.01−0.01
Bacteria 0.950.020.150.03
Unspecific microbial PLFA0.950.16−0.080.05
Firmicutes0.91−0.040.05−0.05
Zygomycota0.900.01−0.20−0.23
Gram-negative0.900.210.150.07
Fungi0.88−0.01−0.19−0.22
Gram-positive0.85−0.100.130.00
Soil organic C0.780.040.410.16
amoA gene0.690.11−0.120.60
β-glucosidase0.68−0.050.050.34
Soluble C−0.570.01−0.21−0.22
CO2e0.160.890.02−0.17
N2O0.270.730.070.05
nirK gene0.04−0.710.380.00
CH40.260.590.25−0.08
GH7 gene0.240.080.89−0.15
cbbL gene0.29−0.240.610.15
NO30.07−0.120.600.06
Urease−0.420.440.500.15
NH4+0.05−0.08−0.120.89
nifH gene0.45−0.180.210.68
Actinobacteria0.43−0.150.230.09
Ascomycota and Basidiomycota0.41−0.11−0.14−0.16
Moisture0.350.09−0.010.11
Total N0.500.040.380.33
Soluble N0.020.12−0.18−0.07
CO2−0.190.39−0.23−0.25
Cellulase0.23−0.03−0.18−0.54
Arylesterase0.020.180.050.08
Disclaimer/Publisher’s Note: The statements, opinions and data contained in all publications are solely those of the individual author(s) and contributor(s) and not of MDPI and/or the editor(s). MDPI and/or the editor(s) disclaim responsibility for any injury to people or property resulting from any ideas, methods, instructions or products referred to in the content.

