Article

Integrated Metagenomics and Network Analysis of Metabolic Functional Genes in the Microbial Community of Chinese Fermentation Pits

1
College of Food Science and Technology, Sichuan Tourism University, Chengdu 610100, China
2
National Engineering Research Center of Solid-State Brewing, Luzhou Laojiao Group Co., Ltd., Luzhou 646000, China
3
College of Bioengineering, Sichuan University of Science and Engineering, Yibin 644005, China
*
Author to whom correspondence should be addressed.
Fermentation 2023, 9(8), 772; https://doi.org/10.3390/fermentation9080772
Submission received: 19 July 2023 / Revised: 15 August 2023 / Accepted: 17 August 2023 / Published: 18 August 2023

Abstract

:
Traditional Chinese strong-aroma baijiu (CSAB) fermentation technology has been used for thousands of years. Microbial communities that are enriched in continuous and uninterrupted fermentation pits (FPs) are important for fermentation. However, changes in the metabolic functional genes in microbial communities of FPs are still under-characterized. High-throughput sequencing technology was applied to comprehensively analyze the diversity, function, and dynamics of the metabolic genes among FPs of different ages, positions, and geographical regions. Approximately 1,375,660 microbial genes derived from 259 Gb metagenomic sequences of FPs were assembled and characterized to understand the impact of FP microorganisms on the quality of CSAB and to assess their genetic potential. The core functional gene catalog of FPs, consisting of 3379 ubiquitously known gene clusters, was established using Venn analysis. The functional profile confirmed that the flavor compounds in CSAB mainly originate from the metabolism of carbohydrates and amino acids. Approximately 17 key gene clusters that determine the yield and quality of CSAB were identified. The potential mechanism was associated with the biosynthesis of host compounds in CSAB, which relies on the abundance of species, such as Lactobacillus, Clostridium, Saccharomycetales, and the abundance of functional genes, such as CoA dehydrogenase, CoA transferase, and NAD dehydrogenase. Furthermore, the detailed metabolic pathways for the production of main flavor compounds of CSAB were revealed. This study provides a theoretical reference for a deeper understanding of substance metabolism during CSAB brewing and may help guide the future exploration of novel gene resources for biotechnological applications.

1. Introduction

Baijiu is a conventional fermented beverage that has been produced for thousands of years. Chinese strong-aroma baijiu (CSAB), also called Chinese strong-aroma liquor (CSAL), is the most consumed spirit in China (>70%) [1] and is produced using unique and traditional solid-state fermentation. Fermentation pits (FPs) are key fermentative bioreactors that are used for the solid-state fermentation of CSAB and significantly affect the quality of CSAB. These bioreactors are rectangular in shape (2000–3000 mm in length, 1500–2000 mm in width, and 1800–2000 mm in height) and are coated with a mixture of fermented cereals (including sorghum, wheat, corn, rice, and sticky rice) and mud. Studies have suggested that the characteristics of FPs are related to the final characteristics of the CSAB produced [2,3]; however, the mechanisms underlying this relationship between FPs and CSAB still need to be elucidated.
To reveal the fermentation mechanism and improve the quality of CSAB, attention should be paid to the analysis of flavor compounds and microorganisms. On the one hand, the application of high-throughput screening and confirmation of flavor compounds has attracted a large amount of attention and interest from researchers. The key flavor compounds of CSAB have been identified using hyphenated chromatographic techniques based on various treatment approaches [4,5]. Gas chromatography-mass spectrometry (GC-MS) and liquid chromatography–mass spectrometry (LC-MS) are two widely used approaches [6,7]. GC-MS is suitable for the detection of semipolar and nonpolar flavor compounds of CSAB, whereas LC-MS specifically targets the semipolar and polar flavor compounds of CSAB [8,9]. Therefore, these two methods are typically combined. More than 400 flavor compounds, such as alcohols, acids, esters, aldehydes, and ketones [2,10], have been identified in CSAB through the unremitting efforts of baijiu researchers. Ethyl caproate, ethyl lactate, ethyl acetate, and ethyl butyrate have been confirmed as the four critical flavor compounds of CSAB. This laid the foundation for the exploration of the fermentation mechanisms associated with the manufacturing of CSAB. On the other hand, a vast number of research studies have focused on microbial community analysis of the CSAB ecosystem, specifically using culture-independent analysis methods [11]. Various sources of CSAB microbial diversity have been studied, including workshop environments [12], daqu [13,14,15], zaopei [16,17], and pit mud [18,19,20,21]. These studies reported that Lactobacillus, Bacillus, Clostridium, Syntrophomonas, Methanobacterium, Methanoculleus, Galactomyces, Sedimentibacte, Candida, Pichia, Aspergillus, Penicillium, and so on significantly affect the yield and quality of CSAB [2]. FPs are vital sources of microorganisms during CSAB fermentation. During brewing, multiple microorganisms coexist in FPs [21], and these microorganisms produce CSAB flavor compounds [22]. Therefore, the quality of CSAB partly depends on the metabolism of microorganisms in FPs. Furthermore, the possible application of systems biology approaches to elucidate the molecular mechanisms underlying CSAB production has been gradually explored [11,23]. To comprehensively understand the complex microbial communities of FPs, links between flavor compounds and functional genes must be established. However, changes in metabolic functional genes in the FPs of CSAB are still poorly understood. Therefore, it is difficult to comprehensively understand the processes and mechanisms underlying CSAB fermentation. A metagenomic approach based on total DNA analysis provides reliable information on the functional genes in microbial communities [24,25]. Whole metagenome sequencing is a powerful method used to analyze complex gene diversities [26]. This method has been extensively applied to characterize microbial gene catalogs in a large variety of environments [27,28,29]. Thus, this efficient approach could also be employed to characterize the diversity of metabolic functional genes in the FPs for CSAB production.
In the present study, a metagenomic approach using Illumina high-throughput sequencing was applied to reveal the functional gene profiles of FPs. A core functional gene catalog of FPs was established. Variations in the functional genes of FPs of different ages, spatial distributions, and geographical locations were analyzed. The overall metabolic pathway profile and biosynthesis of secondary metabolites was constructed. Key gene clusters and metabolic pathways affecting CSAB yield and quality were identified. The metabolic relationship between the functional gene profile and the flavor components of CSAB was determined.

2. Materials and Methods

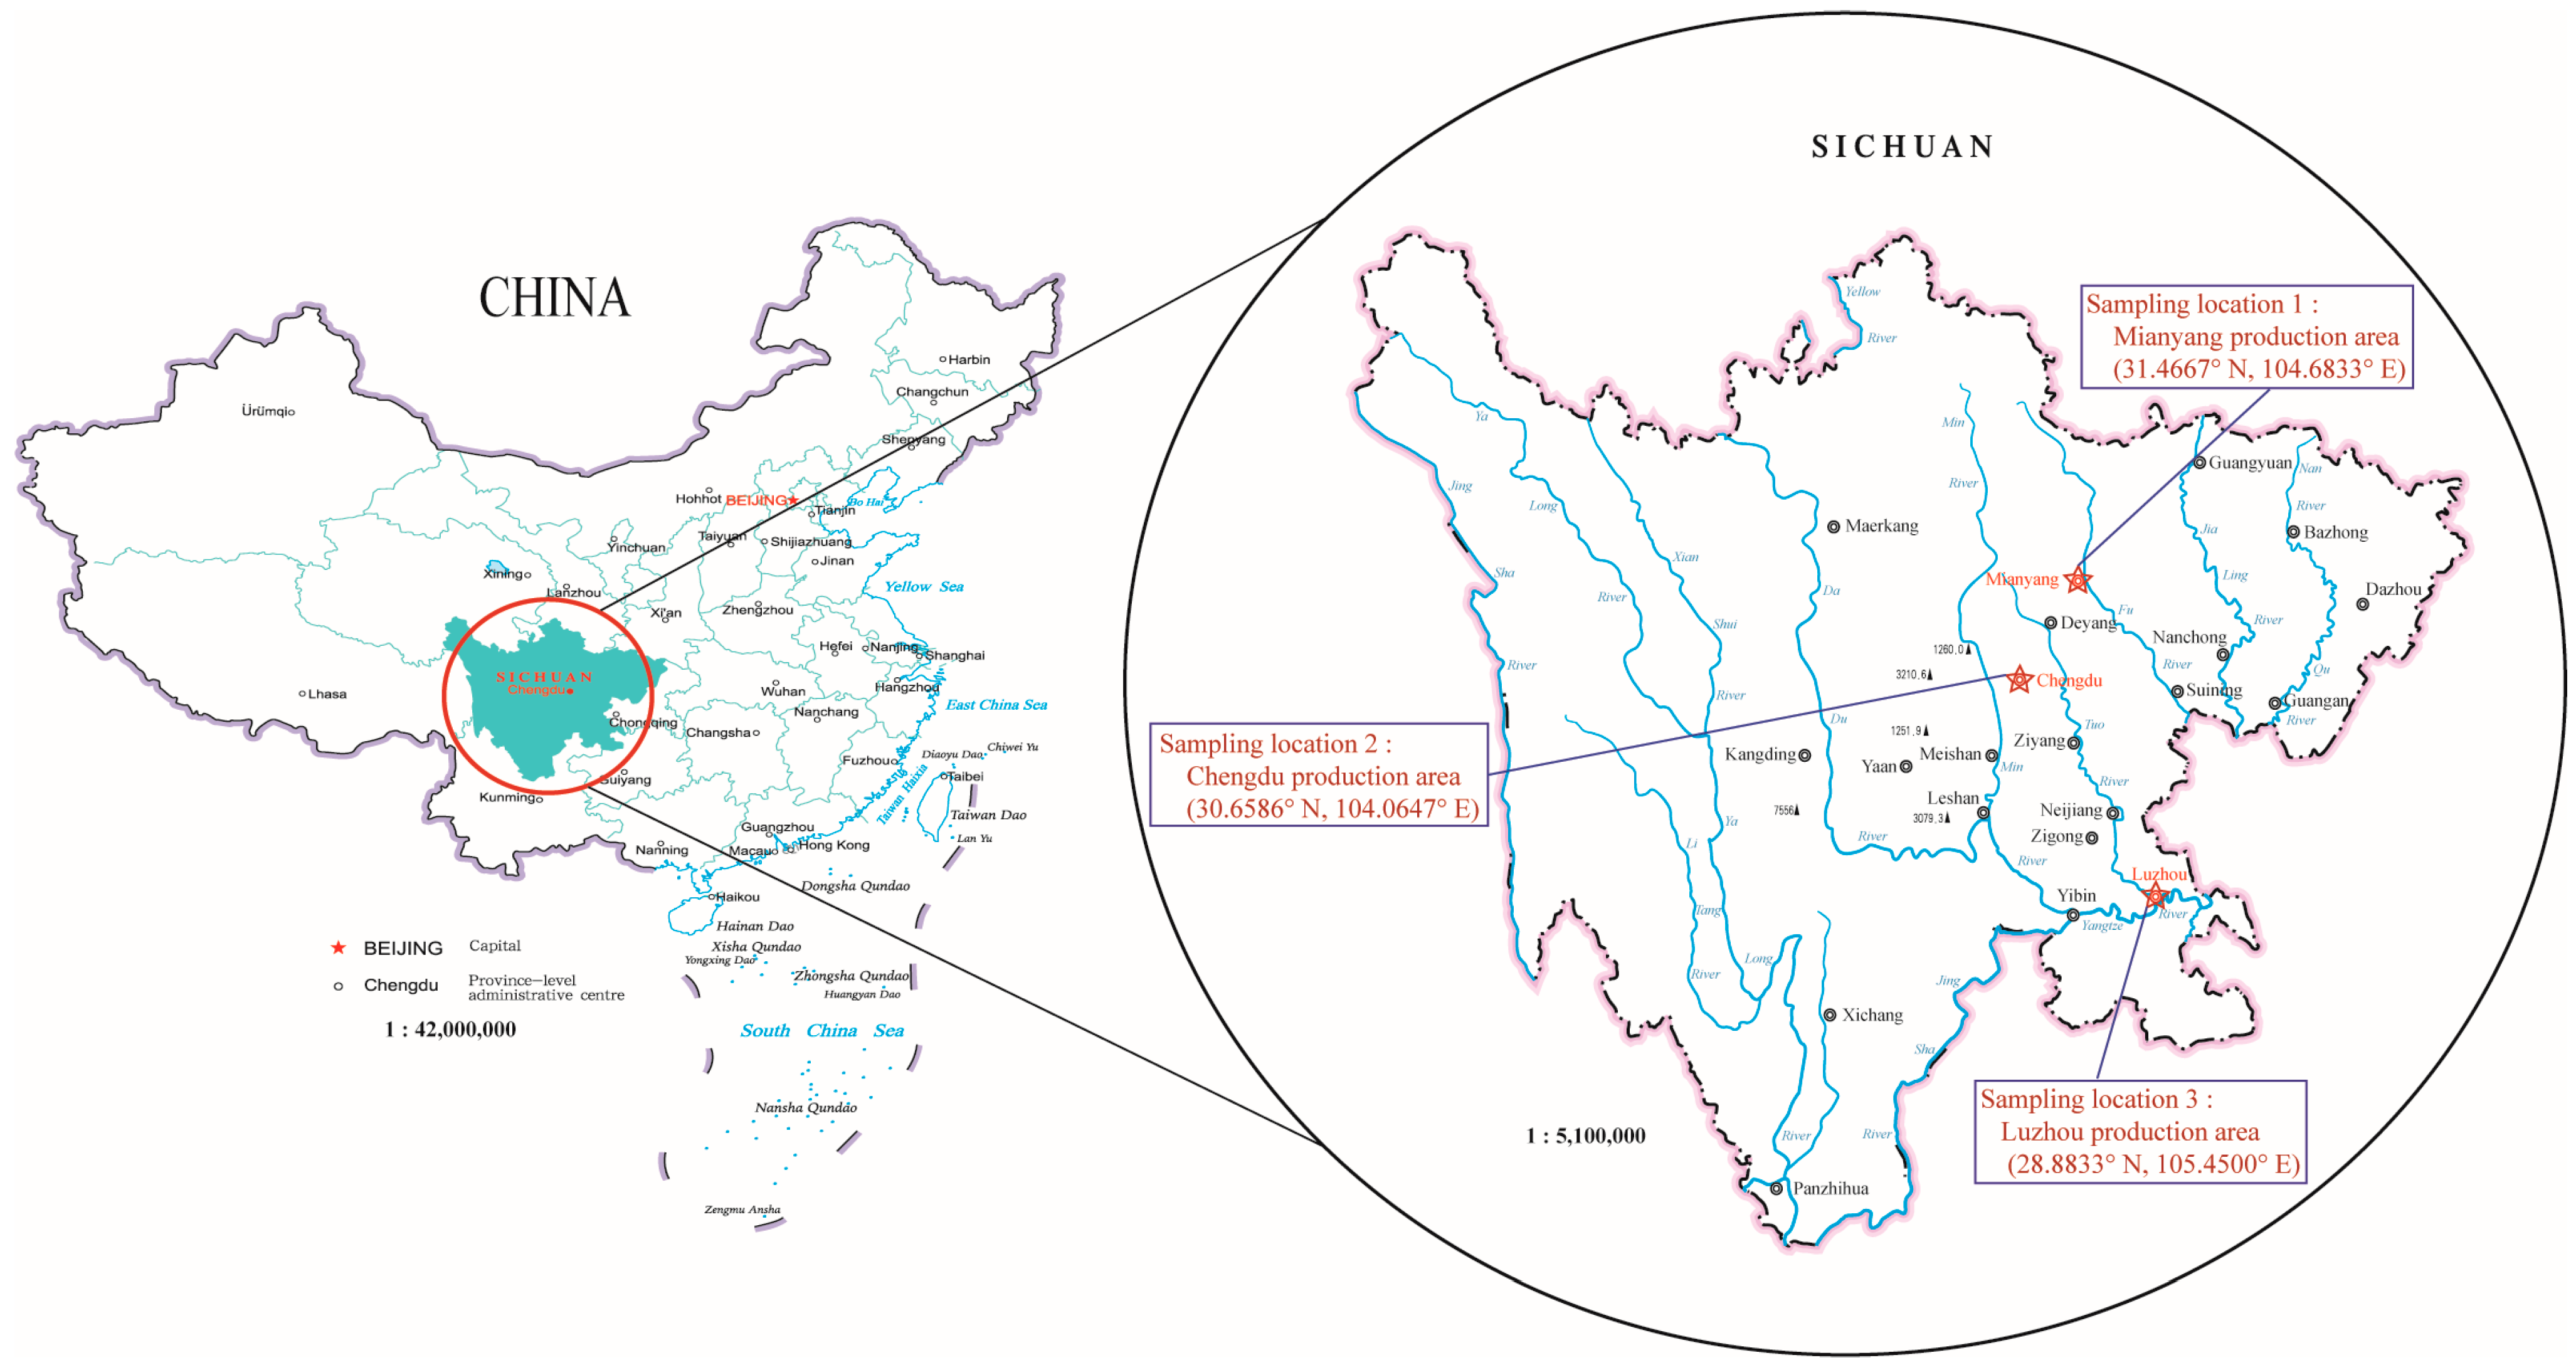
2.1. Sampling and Metagenomic DNA Extraction

Samples were collected from representative famous traditional FPs for CSAB production [2] in Chengdu City (30.6586° N, 104.0647° E), Luzhou City (28.8833° N, 105.4500° E), and Mianyang City (31.4667° N, 104.6833° E), China. Sample selection was based on the statistical methods described by Carter [30] and the authors’ previous work [2]. Twenty FPs of four different ages were sampled from Luzhou and 10 FPs of the same age were sampled from Chengdu and Mianyang. The FPs in Luzhou were 440, 220, 140, and 50 years old. The FPs in Chengdu and Mianyang were approximately 50 years old. Samples were collected from three depths (top, middle, and bottom) of the FP. The top layer was 0–50 cm from the top of the FP, the bottom layer was 0–50 cm from the bottom of the FP, and the remaining layer was termed the middle layer. Sampling was performed at the end of each fermentation cycle after emptying the fermented cereals. Ten representative pit mud samples (10 g each) were collected from each sampling sites and mixed (total 100 g) to provide a single sample. For each sample, five samples with the same FP characteristics (age, position, and geographical region) were collected as parallel samples. The samples were kept at −80 °C until genomic DNA was extracted. Total genomic DNA was extracted from the pit mud of the FPs using a Power Max® Soil DNA Isolation Kit (MO BIO Laboratories, Inc., Carlsbad, CA, USA). Quality checks and quantification of metagenomic DNA were performed with the Qubit™ 1X dsDNA HS/BR Assay Kit using a Qubit 4 fluorometer (Thermo Fisher Scientific, Inc., Waltham, MA, USA) to obtain a DNA concentration of ≥30 ng/µL and a weight of ≥3 µg. Thereafter, the metagenomic DNA bands were detected using 1% agarose gel electrophoresis yielding clear ≥23 kb bands with no obvious degradation.

2.2. Paired-End (PE) Library Generation and Illumina Hiseq Sequencing

The PE library generation and the Illumina Hiseq sequencing of metagenomic DNA was achieved in the group’s previous work [2]. Finally, ~3.4 billion sequence reads, including more than 259 gigabases (Gb) of metagenomic sequence data, were obtained from the FPs. The further bioinformatic analysis was carried out in the current study.

2.3. Data Processing of Metagenomic Sequence Reads

The metagenomic data of the FPs were processed using the Perl utility module of Velvet-shuffleSeqences_fastq.pl from the Velvet toolset [31] to match and pair the paired-end sequences generated by the Illumina HiSeq platform. Adapter sequences and low-quality reads were removed using LUCY2 [32] and DynamicTrim pl. [33]. Adapter sequences were defined based on the information from the header sequences added during the PE library generation experiment. Reads with a Phred quality score below 38 and lengths exceeding 40 bp were discarded as low-quality reads. Reads with more than 5 bp N bases and an overlap with an adapter exceeding 15 bp were removed. Furthermore, to identify and remove potential nonmicrobial sequence contaminants present in the FPs, the SOAP Aligner [34] tool was employed with the following parameter settings: identity ≥99%, -l 30, -v 7, -M 4, -m 100, -x1000 to align and filter out highly specific sequences related to brewing raw materials.

2.4. Metagenome Assembly of Fps

The preprocessed clean data were assembled using a de Bruijn-type algorithm with the Meta-IDBA [35] tool. The parameter settings for Kmer were as follows: min 70, max 100, and step 10 for the number of iterations. First, overlapping regions were assembled into contiguous sequences without gaps to generate a set of contigs. The order of the contigs was then determined based on paired-end relationships to further assemble them into scaffolds. The obtained scaffolds were fragmented at potential N base locations to obtain scaffold sequences without N bases. These sequences were used as the assembly results for subsequent statistical analyses and gene predictions. The assembly process was performed in the second round to maximize the utilization of the sequences and improve the assembly efficiency. The SOAP Align [34] tool was used to align the obtained scaffolds in the first assembly step from each categorized sample with the quality-controlled clean metagenomic data of all FPs samples, which facilitated the identification of unused reads. Thereafter, the unused reads were combined and subjected to a new round of assembly using the Meta-IDBA [35] tool with the same parameter settings, resulting in supplementary scaffolds for potential mixed samples. The completeness of the two rounds of assembly was evaluated using the important indicator of N50, which represents the minimum sequence length required to cover 50% of the total length of all scaffolds. To improve the accuracy of the conclusions of the downstream analysis, a Perl process was implemented using the BioPerl tool (https://bioperl.org/ (accessed on 1 June 2019)) to remove scaffolds smaller than 10 kb and eliminate the probability of misassembly or confusion in shorter scaffolds.

2.5. Gene Prediction and Abundance Analysis in FPs

Using the assembled scaffolds (length ≥ 10 Kb), the MetaGene-ETP [36] tool was employed based on the hidden Markov model (HMM) with parameter settings of -a, -d, -f G, -k, and -r to predict open reading frames (ORFs). The predicted results with lengths smaller than 100 nt were filtered to obtain a high-quality set of genes. The predicted ORFs were subjected to redundancy removal using the CD-HIT tool [37]. The parameter settings for redundancy removal were c 0.95, aS 0.9, aL 0.9, similarity greater than 95%, and coverage >90%. The nonredundant genes were subjected to abundance calculation through the SOAP Align [34] tool with parameter settings of -m 100, -x500, and identity ≥95% to align the clean metagenomic data of all FPs samples. Genes with a number of aligned reads supporting <1 in each sample were further filtered out as another part of quality control. Additionally, the MG-RAST [38] tool was used to assist in gene prediction and abundance analysis of the FPs metagenomic data. Finally, nonredundant gene sets (unigenes) obtained from each sample were used for fundamental characteristic statistics, intersample correlation analysis, and Venn diagram analysis.

2.6. Gene Functional Annotation of FPs Aligned to the KEGG/eggNOG/CAZy Databases

First, the predicted FP unigenes were annotated in the Kyoto Encyclopedia of Genes and Genomes (KEGG) database [39] using BLAST with an E-value threshold of 1 × 10⁻⁵. The best alignment results of the supported KEGG Orthology (KO) clusters for the FPs were obtained based on similarity and alignment scores. The corresponding KO abundance of FPs represented the sum of the gene abundances annotated to all genes in the KEGG database. The relative abundances of the five major functional levels in the KEGG database for FPs were calculated. The relative abundances of FPs genes at each subhierarchical functional level were also summed. The diversity in the function of the obtained KO results was analyzed and compared among FPs of different ages, positions, and geographical regions. Secondly, the predicted FPs unigenes were annotated based on the eggnog 6.0 database [40] using the DIAMOND alignment tool [41]. The annotated results with the highest alignment scores were selected as the gene functions of orthologous groups (OGs) for FPs. The relative abundances of annotated genes at each functional level of the eggNOG OGs were also calculated. The functional diversity of the obtained OG results was deciphered among FPs of different ages, positions, and geographical regions. Genes not annotated in eggNOG were considered to have unknown or novel functions. These genes were clustered using BLAST and the Markov cluster algorithm (MCL) [42], with the definition of a gene family as a cluster containing 20 new functional genes. Finally, predicted FP unigenes were annotated in the CAZy database using the dbCAN tool [43]. This provided functional information on the carbohydrate-active enzymes in FPs, including GHs, AAs, GTs, CEs, PLs, and CBMs. The aligned functional results were subjected to statistical analysis, along with the other two annotations.

2.7. Drawing the Overall Metabolic Pathway Profile of FPs

The annotated functional genes were categorized, statistically summarized, and aligned to public pathways [39] to generate metabolic pathway maps of the FPs. In these maps, nodes correspond to various chemical compounds, edges represent a series of enzymatic reactions or protein complexes, and edge thickness represents the relative abundance of functional genes or enzymes. The global metabolic pathway profile and secondary metabolite biosynthesis profiles were generated to depict the overall biological system of the FPs. The key genes that constitute the main metabolic characteristics of FPs are explained in the metabolic network diagram.

2.8. Construction of the Generative Pathways for the Main Flavor Compounds of CSAB

Starting from the functional gene sets of the FP metagenome, the focus was on the main flavor compounds of CSAB previously detected [2] to construct the degradation pathways of raw materials such as starch and cellulose, the generation and utilization of compounds such as glucose and pyruvic acid, as well as the formation pathways of key characteristic compounds of alcohols (including ethanol, butanol), acids (including acetic acid, propionic acid, lactic acid, butyric acid, caproic acid), and esters (including ethyl acetate, ethyl caproate, ethyl lactate, ethyl butyrate, ethyl propionate, and ethyl valerate). Possible metabolic pathways for the formation of the main flavor compounds were identified. The key catalytic enzyme gene information involved in the metabolic pathways was extracted from the annotated functional gene sets of the FP metagenome. Finally, the specific network pathways for the formation of the main flavor compounds in CSAB were identified, summarized, and illustrated.

2.9. Statistical Analysis

Statistical analyses were conducted using R (v 4.3.1) (https://www.r-project.org/ (accessed on 10 June 2023)) with custom scripts under the available packages in the project. The ggplot2 package in R was used to construct a hierarchical heat map. Venn analysis was performed using ImageGP software (v 1) (http://www.ehbio.com/ImageGP/ (accessed on 10 June 2023)). The statistical significance of the difference between the means of the samples was tested using a two-way analysis of variance (ANOVA) with Duncan’s test (p < 0.05).

3. Results and Discussion

3.1. Statistical Analysis of Fundamental Information for FPs Metagenomic Data

Metagenomic sequencing of the FPs from the Luzhou production area (Figure 1) generated 1,648,547,602 reads, amounting to 167 Gb of data. For the Chengdu production area, 515,952,346 reads, amounting to 51 Gb of data, were obtained. Similarly, for the Mianyang production area, 410,809,062 reads, amounting to 41 Gb of data, were obtained. Overall, 2,575,309,010 reads, equivalent to 259 Gb of data, were obtained from the FP metagenomes. Therefore, the obtained data volume was sufficiently large to meet the common standard requirements for the analysis of metagenomic data. The GC content of the metagenomic sequences was extracted and statistically analyzed for FPs based on the classification of ages, spatial layers, and geographical regions. The GC content, which represents the overall DNA characteristics of the metagenome, was used as an evaluation parameter to compare different environmental metagenomes. The relationship between the GC content distribution and relative abundance of FPs is depicted in Figure 2. The analysis of the relative abundance of the GC content revealed slight differences among the different ages of FPs, layers within the FPs, and geographical regions, with a peak of approximately 42%. This indicates the presence of consistent characteristics in the microbial community composition within the same category. In comparison, typical agricultural soil reference metagenomes (available public data: NCBI ID 13699/MG-RAST ID 4441091.3) had a GC content peak of approximately 63%, indicating a significant difference between these two environments. This suggests that there are notable differences in the microbial composition between FPs and typical agricultural soils, suggesting unique new resource characteristics of FP metagenomes and microbial communities.

3.2. Assembly Results of FPs Metagenome

A total of 2,575,309,010 sequences were generated from the metagenomics of FPs. The assembly results of this metagenomic study revealed 49,322 scaftigs with lengths greater than 10 kb, amounting to a total size of 1,465,978,515 bp (Table 1). The longest single sequence had a length of 938,471 bp, which was almost equivalent to the genome length of a typical single microorganism. The average N50 value was 39,156 base pairs (bp). These results indicated that the assembled scaftigs possessed completeness, and the assembly outcome was satisfactory.

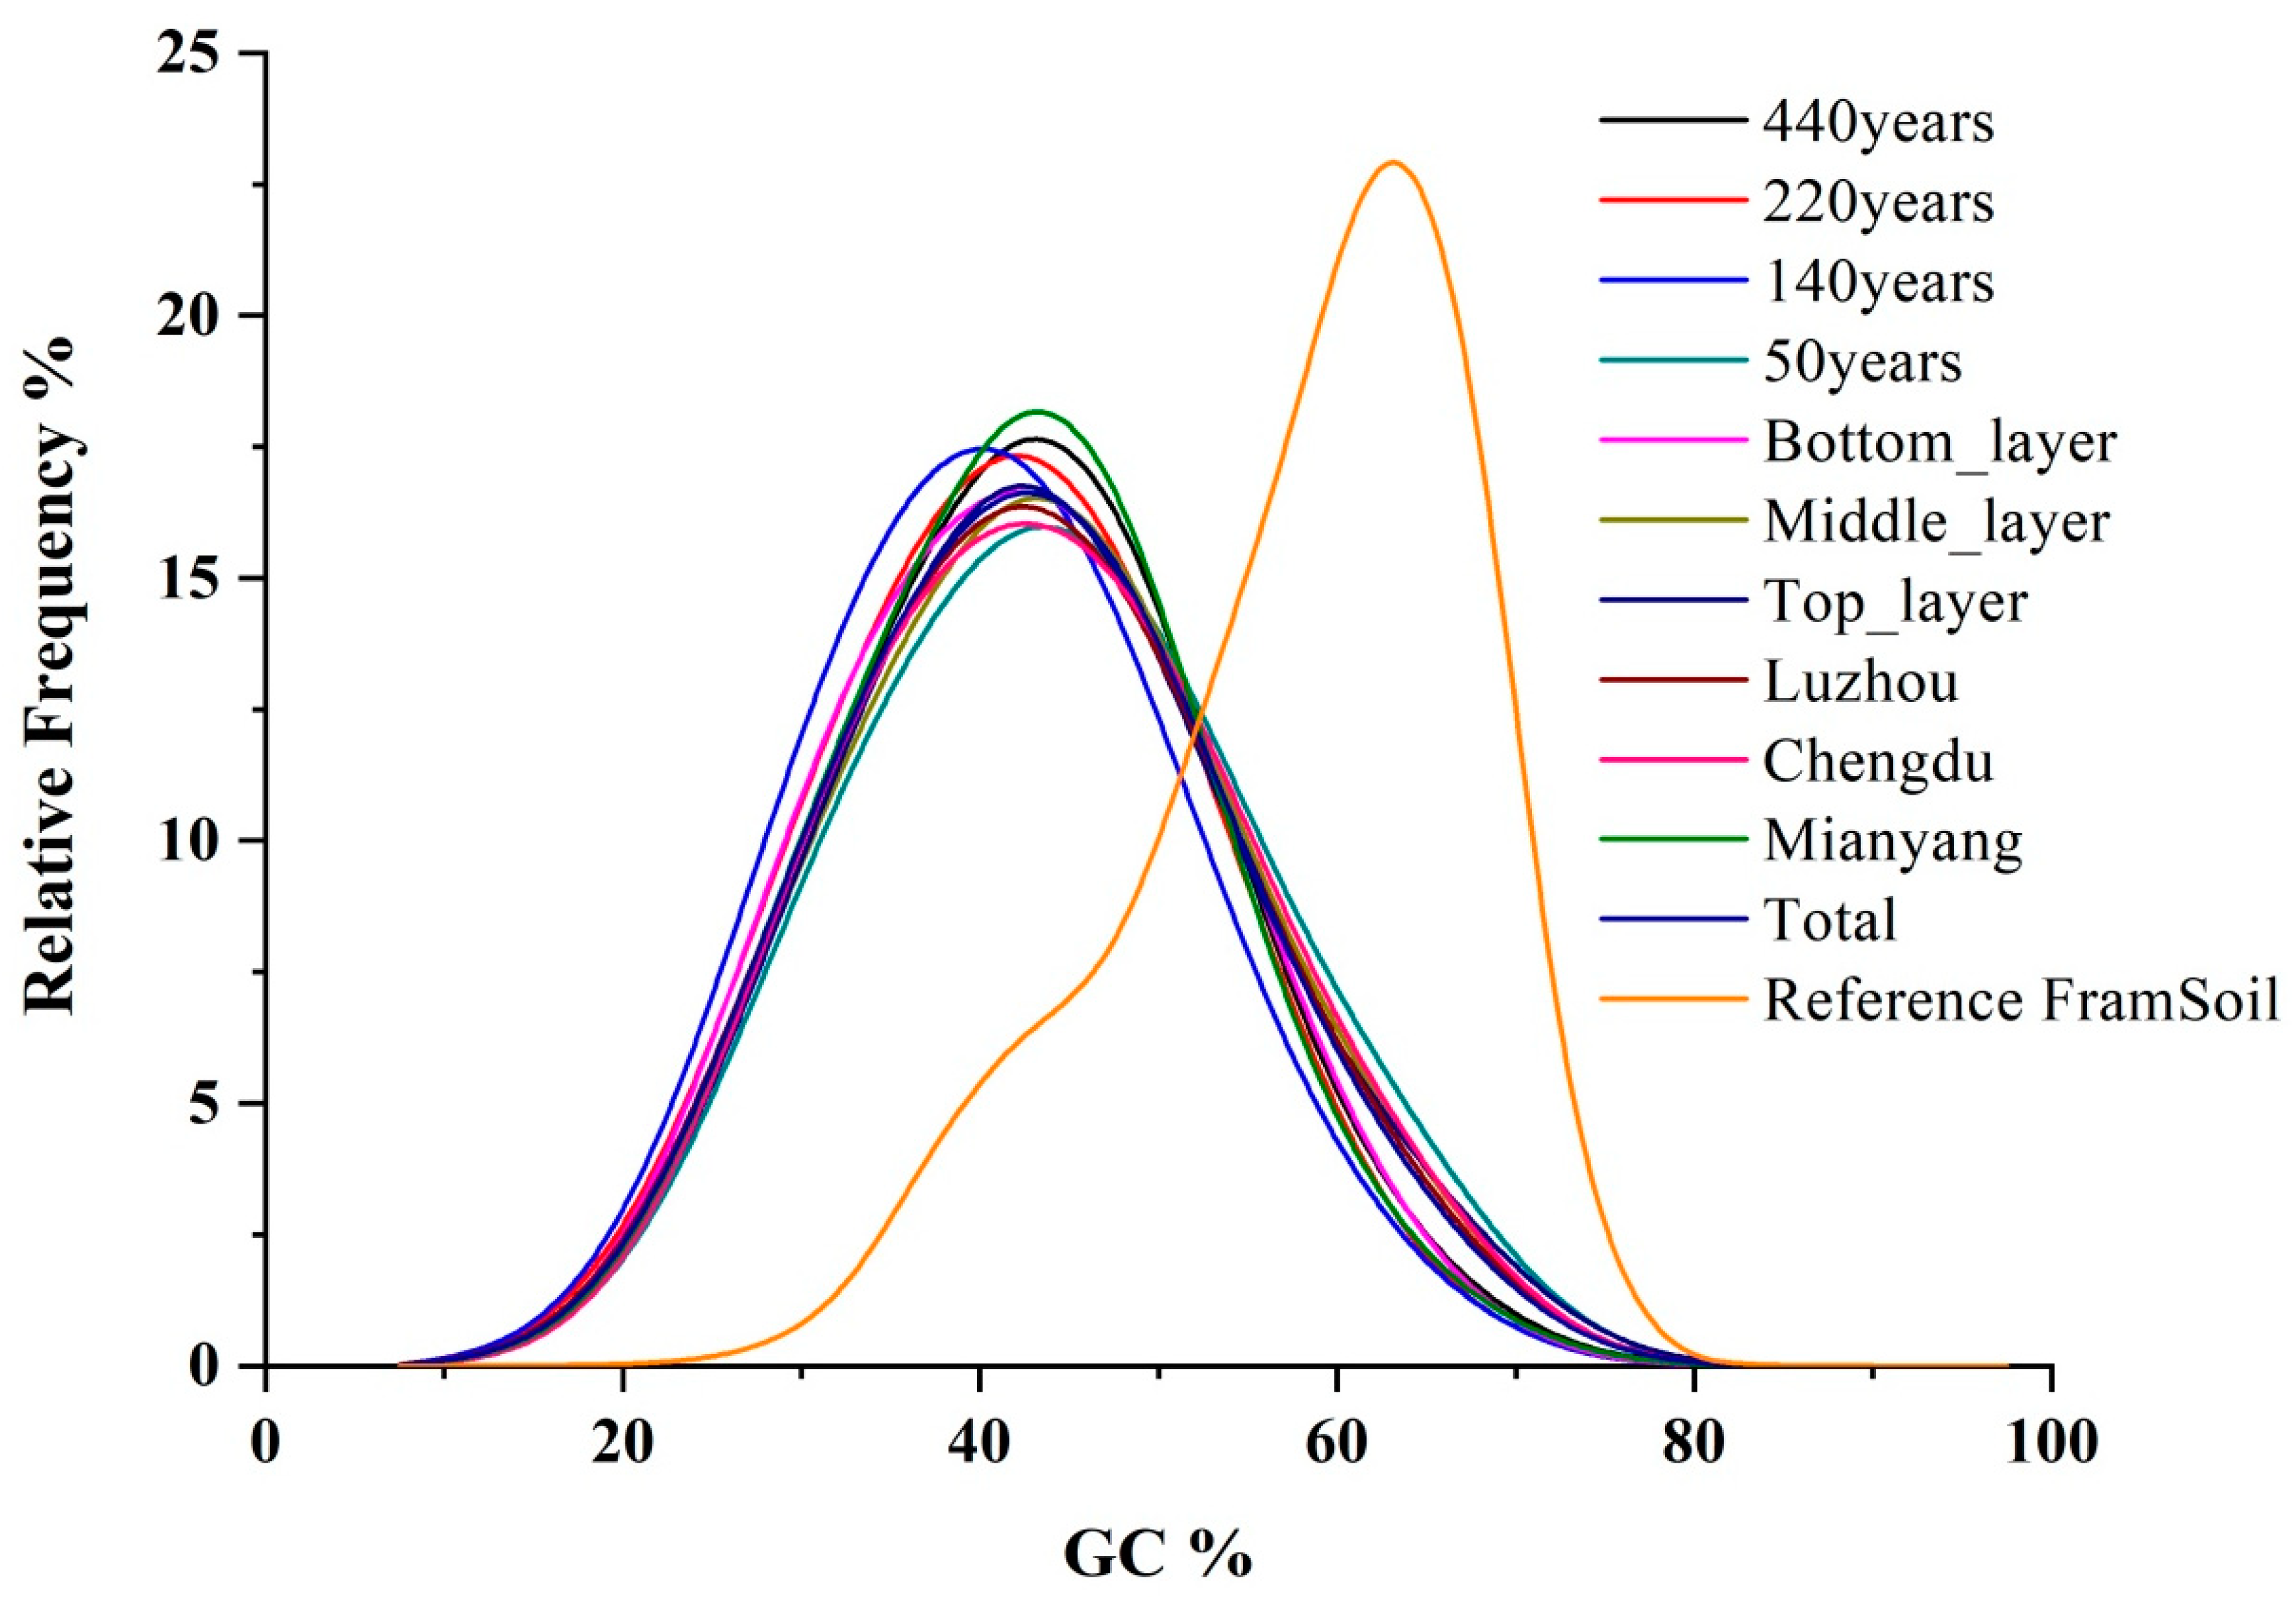
3.3. Gene Prediction Characteristics of FPs

In total, 1,392,928 ORFs were predicted from the metagenomic data of the FPs. The specific results for the number of genes obtained for each FP classification are listed in Table 2. The total length of the predicted open ORFs was 1,292,881,866 bp. After removing redundant genes, a total of 1,375,660 nonredundant genes (unigenes) with a cumulative length of 1,292,669,970 bp were obtained. These nonredundant genes were defined as the gene set used to establish a foundational database of the gene resource catalog for CSAB FPs.

3.4. Comparative and Differential Analysis of Gene Sets in FPs

Venn diagrams were constructed based on the confirmed shared and unique genes and their classifications (KO classification) to display the diversity among the FPs with different ages, layers, and geographical regions (Figure 3). It was observed that the number of shared functional genes among different ages of FPs was 3498, accounting for 67.2%. Unique genes in the 50-year, 140-year, 220-year, and 440-year FPs accounted for 14.2%, 0.7%, 1.8%, and 1.7%, respectively. Functional genes exhibited a gradual stabilization pattern, which may correspond to the evolution of the FP community. During the long-term, uninterrupted production and use of FPs, there is a subtle process of microbial domestication. Over time, microorganisms suitable for the FP environment and those that are closely related to brewing were gradually preserved, whereas unsuitable microorganisms were gradually eliminated. Therefore, the microbial community in the FPs also exhibit a gradual stabilization pattern over time. In an analysis of microbial communities [2], it was reported that the number of microbial species in 50-year FPs was higher than that in 440-year FPs. The presence of widely distributed “miscellaneous” microorganisms contributed to the higher number of unique functional genes in the 50-year FPs. Venn analysis of the functional genes from different layers of the FPs (top, middle, and bottom layers) revealed that there were 3847 shared functional genes, accounting for 72.1% of the total. The top layer of FPs contained 1030 unique genes, accounting for 19.3% of the total. The top layer of the FP represents a relatively exposed space and has more opportunities to be influenced by microorganisms from the external environment. Microorganisms from the external environment can infiltrate the microbial community structure of the top layer, thereby altering the genetic diversity. Analysis of the microbial taxonomy of contigs [2] revealed that Bacteroidetes, Gammaproteobacteria, Opisthokonta (fungi), and Chloroflexi were more abundant in the top layer of the FPs. This indicated that these microbial categories potentially contribute to the diversity of functional genes in the top layer. After comparing the functional genes of FPs from different geographical regions, it was concluded that Luzhou, Chengdu, and Mianyang had 3603 shared functional genes, accounting for 67.5% of the total. Luzhou shared more functional genes with Chengdu than with Mianyang. Luzhou also had a significantly higher proportion of unique genes, reaching 21.9%. Venn analysis of the microbial community structure [2] indicated that the diversity of CSAB-related microbial species in Luzhou FPs was higher than those in Chengdu and Mianyang. GC-MS analysis of CSAB produced in different geographical regions has confirmed that the diversity of microbial communities in Luzhou is beneficial for CSAB quality [2]. Therefore, the increased diversity of beneficial microbial communities contributed to the diversity of functional genes in Luzhou. This explains the superior quality of CSAB produced in Luzhou compared to Chengdu and Mianyang, providing a preliminary theoretical explanation for the widely recognized superior quality of Luzhou CSAB.
By comprehensively analyzing the comparative results of functional genes from FPs of different ages, layers, and geographical regions, it was observed that the 50-year FPs had a higher number of unique genes than the 140-year, 220-year, and 440-year FPs. However, older FPs produced higher-quality CSAB. Additionally, the top layer of FPs had a greater number of unique genes than the middle and bottom layers; however, the CSAB quality of the top layer was not as good as that of the middle and bottom layers. Surprisingly, the functional gene sets of FPs in Luzhou had a higher number of unique genes, and the quality of CSAB in Luzhou was superior to that in Chengdu and Mianyang. This indicates that to ensure the quality of fine CSAB, a certain number of functional genes is required. The particular characteristics of the functional gene structure of 440-year-old FPs contributed to the formation of a metabolic network for high-quality CSAB production. Subsequently, the metabolic tendencies of microbial communities progressed to specialization, with beneficial functional genes being preserved and nonbeneficial genes gradually diminishing. Therefore, the presence of other types of nonbeneficial genes may cause deviations in the overall community metabolism, potentially affecting the quality of CSAB. Moreover, by combining the comprehensive results of the Venn analysis of functional gene sets from all the different characteristics of FPs, we concluded that approximately 3379 currently known functional gene clusters were defined as the core functional gene catalog for FPs.

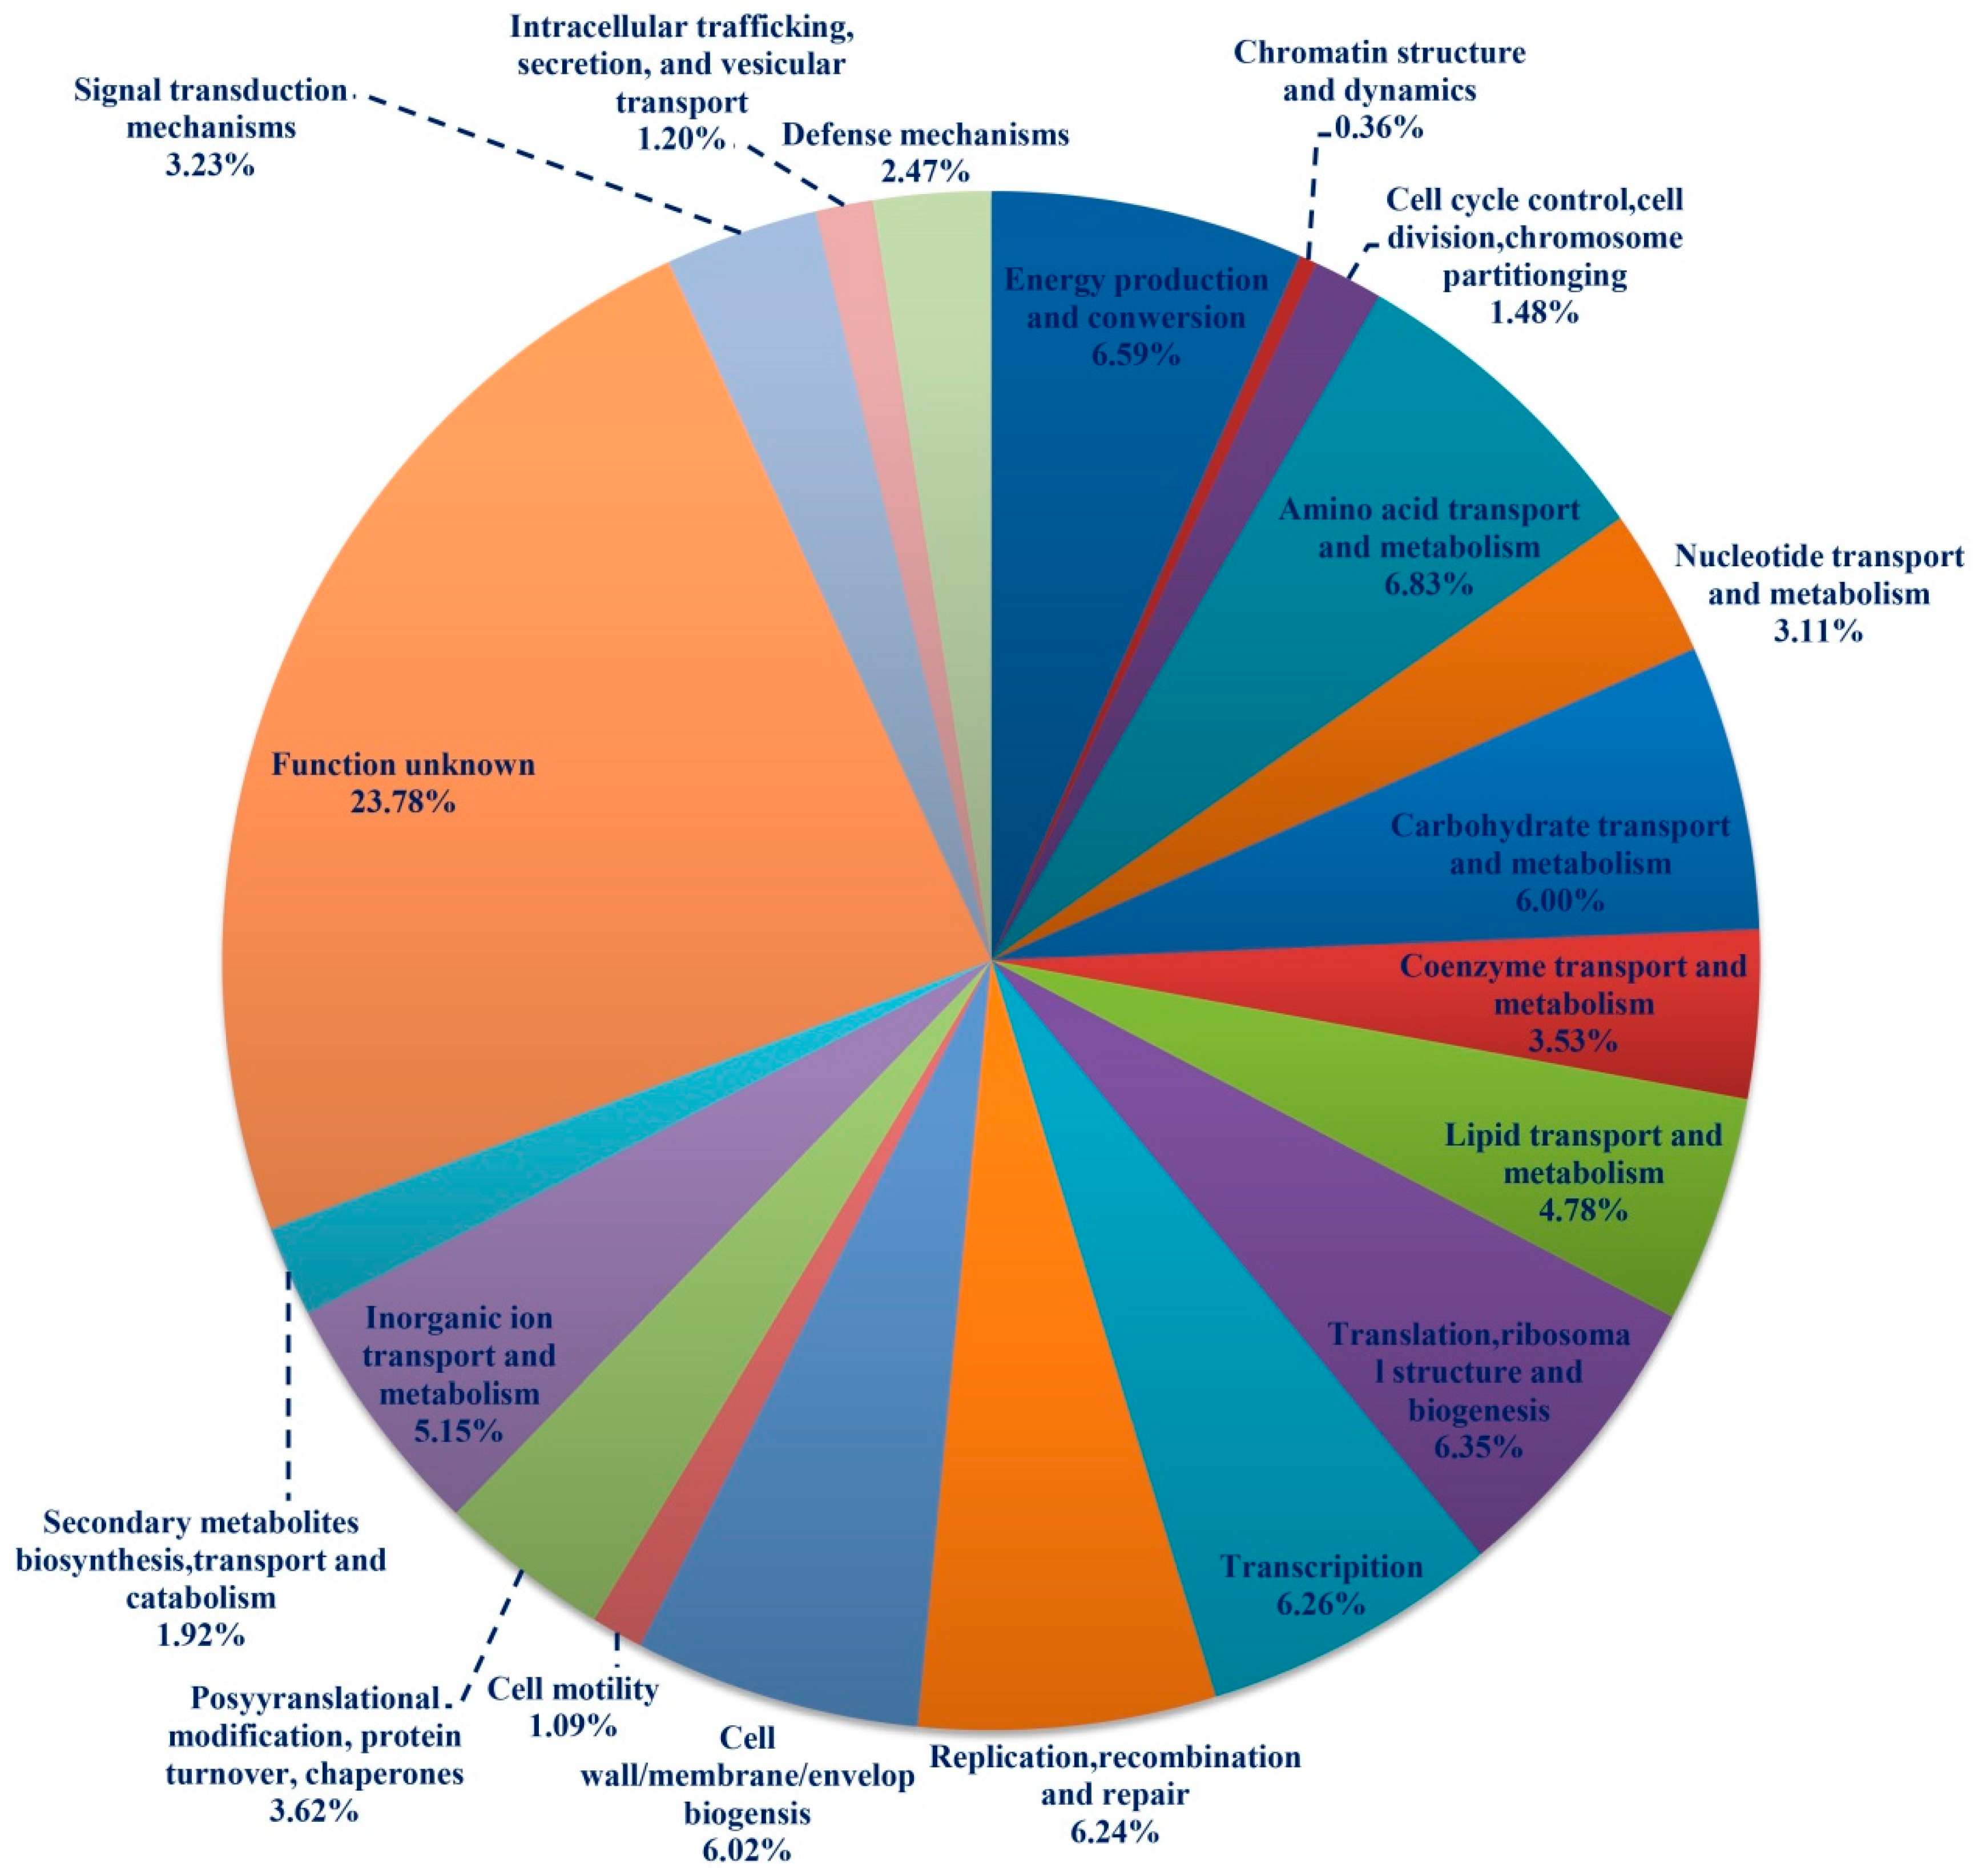
3.5. Classificatory and Differential Analysis of Functional Genes in FPs

The analysis results of functional annotation and classification revealed that the functional microbial genes in the FPs were involved in multiple metabolic pathways (Figure 4). Among them, functional genes related to energy production and conversion, as well as amino acid transport and metabolism were the most abundant, accounting for 6.59% and 6.83%, respectively. Additionally, a relatively high proportion of functional genes in the FPs were associated with carbohydrate transport and metabolism (6.00%), cell wall/membrane/envelope biogenesis (6.02%), translation, ribosomal structure and biogenesis (6.35%), transcription (6.26%), replication, recombination and repair (6.24%), inorganic ion transport and metabolism (5.15%), and lipid transport and metabolism (4.78%). The main components comprising the raw materials used in the fermentation process, such as sorghum, corn, wheat, rice, and glutinous rice, are carbohydrates and proteins, which account for approximately 60–80% and 8–10%, respectively. The major distribution of the functional genes associated with carbohydrate, energy, and amino acid metabolism in microbial communities of FPs has been verified as the fundamental source of flavor compounds in CSAB at the genetic level.
Furthermore, a substantial proportion of unknown functional genes accounted for 23.78% of the total genes. These abundant unknown genes reflect the uniqueness of the FP ecosystem compared with other publicly known environmental microbial ecosystems. These genes represent valuable tools for the exploration of new functional genes for industrial fermentation; however, further research is required.
Further analysis was conducted to investigate the detailed distinguishable characteristics and metabolic roles of the functional genes in different FPs. These results are displayed in Figure 5. Overall, the differences in the functional gene distribution of microbial ecosystems in FPs across all observed ages were not significant; however, the characteristics were only suitable for the requirement of metabolic flavor compounds in the fermentation production of CSAB. However, subtle differences were observed in key metabolic pathways. As shown in Figure 5, the functional categories of C (energy production and conversion), E (amino acid transport and metabolism), G (carbohydrate transport and metabolism), and I (lipid transport and metabolism) increased in abundance with an increase in age. [G] Carbohydrate metabolism, C (energy metabolism), E (amino acid metabolism), and I (lipid metabolism) were the main pathways involved in microbial utilization, decomposition, and transformation of raw materials used in CSAB production. This could explain why the old FPs produced CSAB with higher quality as opposed to new FPs. With an increase in age, FPs contribute beneficial functional genes that facilitate the metabolism of CSAB raw materials, thereby improving the quality of CSAB. These subtle adjustments in the metabolism of the abovementioned substance categories led to differences in CSAB quality. However, it was also observed that the proportion of unknown functional genes (S, function unknown) slightly decreased with an increase in age. This could be because the functional metabolism of the FP microbial community tends to develop in a more specialized direction during CSAB production as age increases.
Regarding the functional differences in genes in different layers of the FP, the middle layer exhibited a slight superiority in C (energy production and conversion) and E (amino acid transport and metabolism) compared to the bottom and top layers. The bottom layer exhibited a slight advantage in terms of Q (secondary metabolite biosynthesis, transport, and catabolism) compared to the middle and top layers. The top layer had a slightly higher distribution of functional genes associated with J (translation, ribosomal structure, and biogenesis) than the other two layers. By combining the characteristics of CSAB quality and the microbial diversity of FPs [2], we concluded that the CSAB quality of the middle layer was superior to that of the bottom and top layers, due to the slight enhancement in energy metabolism and amino acid metabolism. The CSAB quality of the top layer was inferior to that of the middle layer, possibly because G (carbohydrate transport and metabolism) was slightly reduced in the top layer, resulting in lower levels of fermentation byproducts, such as acetic acid and hexanoic acid, which affected the quality. As the fermentation process progressed, a large amount of fermentation liquid gradually accumulated in the bottom layer of the FPs. Consequently, these environmental conditions may have enhanced Q (secondary metabolite biosynthesis, transport, and catabolism) in the bottom layer when compared to the middle and top layers. Regarding microbial diversity [2], the top layer had more species abundance than the middle and bottom layers, and the abundance of functional genes associated with J (translation, ribosomal structure, and biogenesis) was slightly higher in the top layer, which is consistent with the observations relating to the CSAB quality differences.
In terms of the functional genes of the microbial community in FPs from different geographical regions, a previous analysis revealed that CSAB from the Luzhou region differs from that of the Chengdu and Mianyang regions. This could be attributed to the higher E (amino acid transport and metabolism) and G (carbohydrate transport and metabolism) activities in the FP microbial community in the Luzhou region than in the other two regions. Another possible reason is that the microbial community abundance was higher in the Luzhou region in terms of functional genes related to J (translation, ribosomal structure, and biogenesis).
In conclusion, functional gene distribution exhibited general consistency with regard to the different FP characteristics. Metabolic pathways influence quantity and quality of CSAB. However, the current research mainly focused on the ethanol metabolic pathway derived from carbohydrate metabolism. Therefore, there is still a limited understanding of the metabolic pathways associated with major flavor compounds, such as ethyl caproate, ethyl lactate, ethyl acetate, and ethyl butyrate, which have a significant impact on the quality of CSAB. Hence, it is challenging to analyze differences in the functional gene metabolic classification of FPs. At the same time, this also indicates that the construction and analysis of metabolic pathways, such as ethyl caproate, ethyl lactate, ethyl acetate, and ethyl butyrate, in brewing fermentation would be a meaningful direction. Although it was difficult to perform an in-depth and precise analysis, a general trend can be summarized: the abundance of functional genes constituting the FP microbial community was slightly enhanced in the key main characteristic metabolic classifications of C (energy production), E (amino acid metabolism), G (carbohydrate metabolism), and I (lipid metabolism). This enhancement was beneficial for improving the quality of CSAB, thus exhibiting a positive correlation.

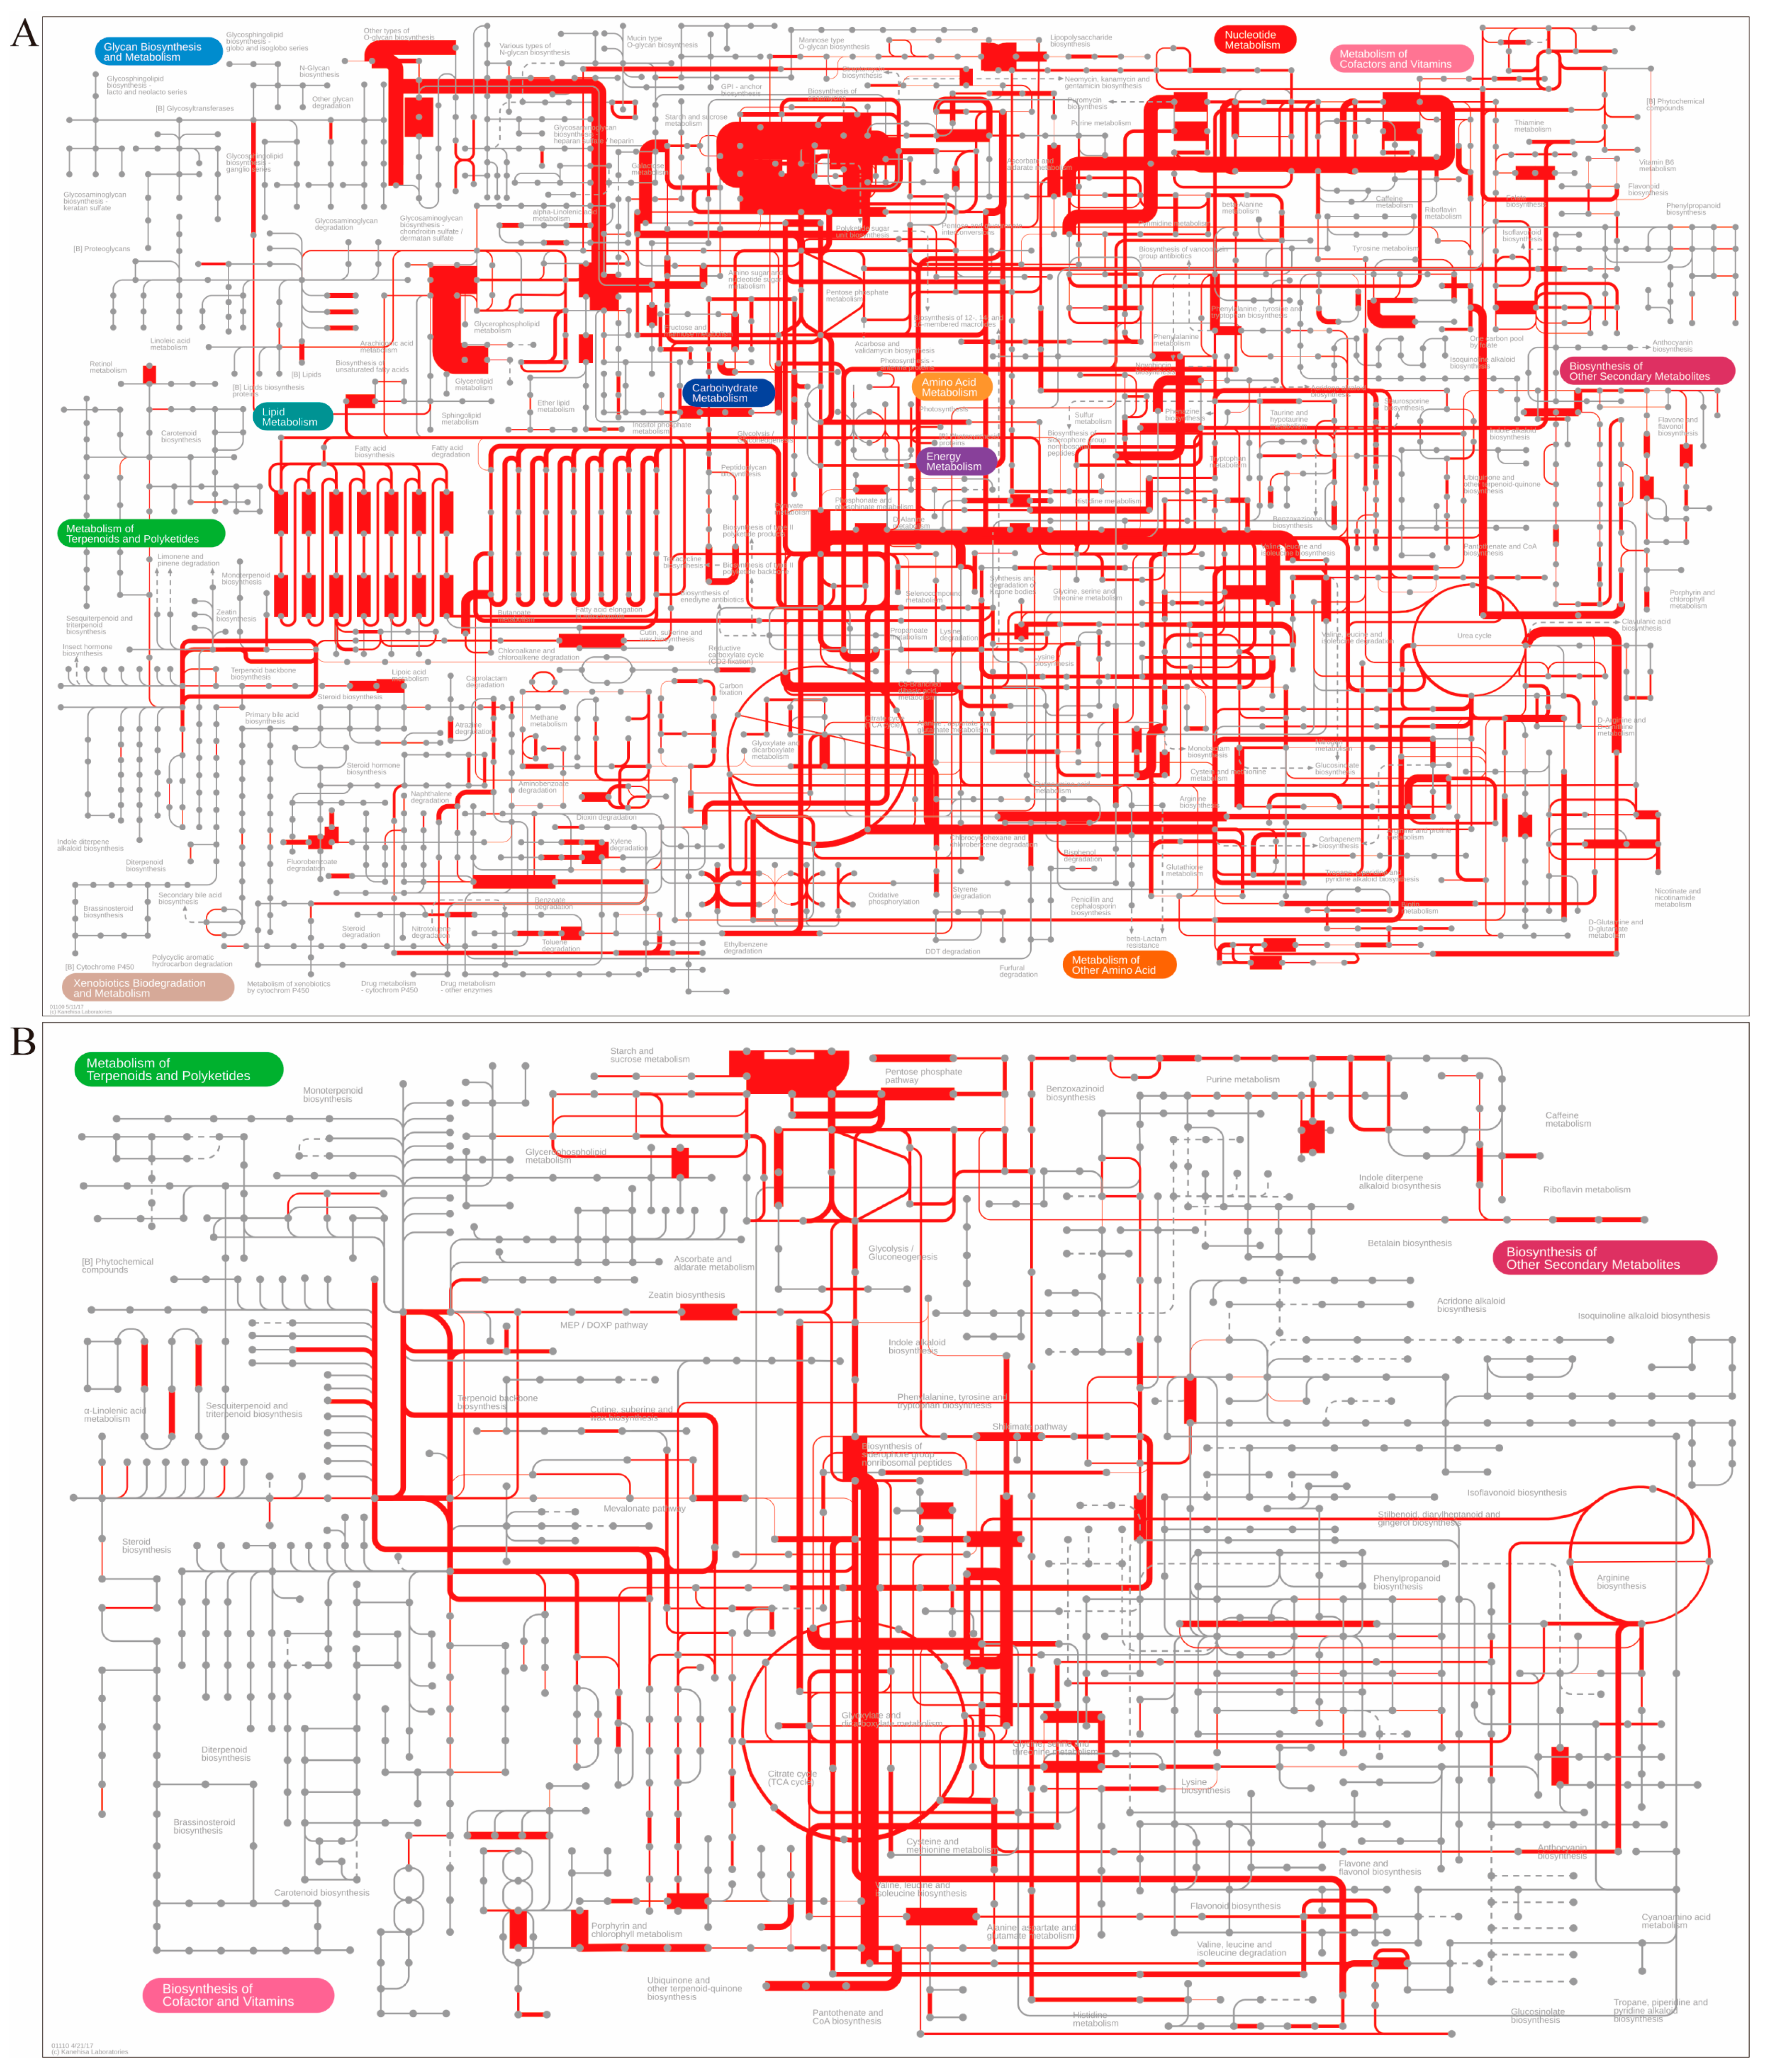
3.6. Overall Characteristics of the Constructed Metabolic Pathway Profile of FPs

The global metabolic network (Figure 6A) and secondary metabolic network diagram (Figure 6B) of the FP microbial community was plotted based on the annotated categorization and abundance of functional genes. The red lines represent the metabolic pathways associated with FP microorganisms, and the thickness of the lines indicates the abundance of the corresponding functional genes. In the FP microbial community, the summarized metabolic support for CSAB was mainly observed in the highly active functional genes in the G (carbohydrate metabolism), I (lipid metabolism), F (nucleotide metabolism), E (amino acid transport and metabolism), and C (energy metabolism) pathways. These metabolic pathways form the life framework of the FP microbial communities. Further analysis revealed specific genes involved in starch and sucrose metabolism, including a glycosyltransferase gene (COG0438) and transaldolase gene (COG0176); in lipid conversion and metabolism, including 3-oxoacyl-(acyl carrier protein) synthase gene (COG0304), phosphopantetheinyl transferase (holo-ACP synthase) gene (COG0736), and (acyl-carrier-protein) s-malonyltransferase gene (COG0331); in starch and sucrose metabolism and energy production and conversion, including a NAD-dependent aldehyde dehydrogenases gene (COG1012) (NADH plays a functional role in bacterial alcohol fermentation to catalyze the conversion of the pyruvic acid produced acetaldehyde to ethanol), and a predicted hydrolases or acyltransferases (alpha/beta hydrolase superfamily) gene (COG0596); in starch and sucrose metabolism and lipid transport and metabolism, including acetyl-CoA acetyltransferase gene (COG0183), acyl dehydratase gene (COG2030), enoyl-CoA hydratase gene (COG1024), dehydrogenases with different specificities gene (related to alcohol dehydrogenases) (COG1028), 3-hydroxyacyl-CoA dehydrogenase gene (COG1250), and acyl-CoA dehydrogenases gene (COG1960, catalyzing the conversion of acetaldehyde to ethanol); in nucleotide metabolism, including tRNA-dihydrouridine synthase gene (COG0042) and intein/homing endonuclease gene (COG1372); and in amino acid transport and metabolism, including acetylornithine deacetylase gene (COG0624) and aspartate/tyrosine/aromatic aminotransferase gene (COG0436). These exhibited highly abundant and active gene clusters that contributed to the characteristic microbial metabolic networks of the FPs. Summary analysis indicated the presence of highly abundant and active genes predominantly associated with CoA hydrolase, CoA dehydrogenase, CoA transferase, and NAD dehydrogenase in the FP microbial ecosystem, as well as the existence of abundant microbial species [2], such as Lactobacillus, Clostridium, and Saccharomycetales (Supporting Table S1). This further helped elucidate the source mechanism of ethanol and the major ester flavor compounds present in CSAB. The brewing materials, namely sorghum, corn, wheat, and glutinous rice, mainly provide starch-derived sugars for fermentation. The starch was metabolized and further converted to pyruvate, which, unlike in aerobic conditions, was not directly oxidized to produce energy and CO2, and was recruited in the microbial community. Instead, it underwent various fermentation metabolic conversions via different high-abundance microorganisms in the FP, entering the heterolactic fermentation metabolic pathway of Lactobacillus, the butyric acid fermentation metabolic pathway of Clostridium, and the yeast-type alcoholic fermentation metabolic pathway of Saccharomycetales (Supporting Table S2). Under metabolic catalysis by the main enzymes CoA hydrolase, CoA dehydrogenase, CoA transferase, and NAD dehydrogenase, various substrates of flavor compounds, such as lactic acid, ethanol, acetic acid, butyric acid, and hexanoic acid, were generated. Consequently, the main flavor compounds representing the strong aromatic characteristics of CSAB, including ethyl acetate, butyl acetate, hexyl acetate, and ethyl lactate, were produced. This theoretically demonstrates the importance of FPs in the production of CSAB, which provides abundant specific beneficial microorganisms and functional genes for fermentation.

3.7. The Deciphered Generative Pathway Profile for the Main Flavor Compounds of CSAB

The detailed metabolic network profile for the formation of the main flavor compounds detected using GC-MS in CSAB was constructed by progressively aligning the annotated functional genes of the FPs with the metabolic pathways plotted in Figure 6. The results are displayed in Figure 7. A total of 159 catalytic enzymes related to the formation of the main flavor compounds in CSAB were identified. Specifically, fermentative substrates, such as starch, cellulose, sucrose, and trehalose, provided by the raw materials were metabolized into glucose by ko00500, which was further transferred into the cells of the microorganisms for metabolism. The transferred glucose was converted to phosphoenolpyruvate by ko00010, and pyruvic acid was then formed. Pyruvic acid is an important nodal substance in the metabolism and formation of flavor compounds in CSAB. Pyruvic acid can be converted into various flavor compounds through different metabolic pathways. First, acetaldehyde was formed by ko00620, which was then transformed into ethanol by ko00010. Ethanol is the most abundant compound in CSAB and determines the main taste and production yield during fermentation. The acetaldehyde formed in this step can be further metabolized to acetic acid. The esterification reaction between acetic acid and ethanol formed ethyl acetate, which is one of the four pivotal aromatic compounds in CSAB. Pyruvic acid can also be converted into lactic acid, propionic acid, and acetyl-CoA by ko00620. When esterified with ethanol, lactic acid and propionic acid form ethyl lactate and ethyl propionate, respectively. Ethyl lactate is one of the four pivotal aromatic compounds in CSAB. Propionic acid can also be metabolized to valeric acid by ko00290, and valeric acid can be further esterified with ethanol to form ethyl valerate, which also plays a role in the aromatic profile of CSAB. Acetyl-CoA is converted to butyric acid by ko00650, which is then directly esterified with ethanol to form ethyl butyrate. One butyric acid molecule reacts with one acetyl-CoA molecule to generate caproic acid. When esterified with ethanol, the caproic acid forms ethyl caproate. Ethyl butyrate and ethyl caproate are the two remaining pivotal aromatic compounds in CSAB. Additionally, acetic, butyric, and caproic acids are abundant acidic flavor compounds in CSAB. Butyric acid can also be metabolized by ko00650 to form butanol and by ko00290 to form propanol. Both butanol and propanol are abundant alcohols in CSAB. Another abundant alcohol, 2,3-butanediol, is formed from pyruvic acid through ko00290 by metabolizing it to 2-acetolactic acid and 3-hydroxybutanone, which are further transformed through ko00650. Furthermore, the proteins and amino acids provided by brewing raw materials can be metabolized through ko00250 to ko00400, resulting in the production of various higher alcohols in CSAB, thus obtaining the flavor characterized by the sensation of being “heady” after consuming CSAB. Therefore, the metabolic network for the formation of the main flavor compounds in CSAB is well understood.

4. Conclusions

A functional gene catalogue of traditional industrial FPs for CSAB production was established using a metagenomic analysis approach. A total of 259 Gb of metagenomic data were obtained from FPs. After assembly, 1,392,928 ORFs were identified with a cumulative length of 1,292,881,866 bp. Through homology comparisons, 1,375,660 nonredundant genes (unigenes) were identified. Further annotation based on known public functional databases and Venn analysis revealed 3379 known functional gene clusters as the core functional gene set of FPs. Based on the KO annotation using the KEGG database and COG annotation from the eggNOG database, the functional classification features of the microbial genes in the microbial community of FPs were identified. The main functional genes were as follows: carbohydrate metabolism, 6.00%; energy metabolism, 6.59%; amino acid metabolism, 6.83%; cell wall/membrane formation, 6.02%; translation and genetic processes, 6.35%; transcriptional processes, 6.26%; replication/recombination/repair processes, 6.24%; ion transport processes, 5.15%; and lipid metabolism, 4.78%. Additionally, newly discovered genes with unknown functions accounted for a significant proportion (23.78%). These functional compositional features indicate that the microbial ecosystem of FPs is a community system primarily driven by the utilization of carbohydrates and amino acids as the main sources for metabolic consumption. This revealed that the flavor compounds formed during CSAB were mainly derived from the conversion of carbohydrates and amino acid metabolism. Global and secondary metabolic network profiles of the microbial community in FPs were constructed based on known functional gene metabolic pathways. Approximately 17 clusters of key genes affecting CSAB yield and quality were identified. The underlying mechanisms that influence the production (ethanol) and quality (main flavor compounds, such as ethyl caproate, ethyl lactate, ethyl acetate, and ethyl butyrate) of CSAB by FPs were elucidated. These mechanisms are formed through the specific metabolic activities of highly abundant microbial species, such as Lactobacillus, Clostridium, and yeast (Saccharomycetales), and through specific pathways involving highly active specific species of functional genes, including CoA hydrolases, CoA dehydrogenases, CoA transferases, and NAD dehydrogenases. The relationship between flavor compound formation and microbial metabolism was studied based on the main flavor compounds. In total, 159 catalytic enzymes related to the formation of main flavor compounds in CSAB were annotated. The pathways involved in the formation of flavor compounds were elucidated.
However, the number of new homologous gene clusters in the microbial ecosystem of FPs was much larger than that in the known homologous groups. There are still a significant number of unknown microbial genes in the FP ecosystem, indicating that the functionality of FPs is still not fully understood. Further research is required to explore these unknown genes, and continuous updates to functional gene databases are required.

Supplementary Materials

The following supporting information can be downloaded at: https://www.mdpi.com/article/10.3390/fermentation9080772/s1, Table S1: The relative abundance of the top 100 microorganisms in the microbial communities from FPs for the production of CSAB; Table S2: The phylogenetic profile of the top 20 Eukaryotes in the FPs.

Author Contributions

M.G. and Y.D.: conceptualization; M.G., Y.D. and J.H.: methodology, software and visualization; J.H., C.Z. and H.Q.: formal analysis; H.W., H.Q. and S.Z.: investigation and resources; M.G., J.H., C.Z. and H.Q.: writing—original draft preparation; M.G., Y.D., H.W. and S.Z.: writing—review and editing. All authors have read and agreed to the published version of the manuscript.

Funding

This work was supported by the Natural Science Foundation of Sichuan Province (No. 2022NSFSC1676).

Institutional Review Board Statement

Not applicable.

Informed Consent Statement

Not applicable.

Data Availability Statement

Supporting Information may be found in the online version of this article. The datasets generated during the current study are available from the corresponding author upon reasonable request.

Acknowledgments

We gratefully acknowledge the financial support of this research provided by the Natural Science Foundation of Sichuan Province.

Conflicts of Interest

The authors declare no conflict of interest. HQ and SYZ were employed by the company of Luzhou Laojiao Group Co. Ltd. The remaining authors declare that the research was conducted in the absence of any commercial or financial relationships that could be construed as a potential conflict of interest.

Abbreviations

AAsAuxiliary activities
ANOVAAnalysis of variance
BLASTBasic local alignment search tool
CAZyCarbohydrate active enzyme
CBMsCarbohydrate-binding modules
CEsCarbohydrate esterases
CoACoenzyme A
COGClusters of orthologous genes
CSABChinese strong-aroma baijiu
eggNOGEvolutionary gene genealogy non-supervised orthologous groups
FPFermentation pit
GC-MSGas chromatography-mass spectrometry
GHsGlycoside hydrolases
GTsGlycosyl transferases
HMMHidden Markov model
KEGGKyoto Encyclopedia of Genes and Genomes
KOKEGG orthology
LC-MSLiquid chromatography-mass spectrometry
MCLMarkov cluster algorithm
NADNicotinamide adenine dinucleotide
OGsOrthologous groups
ORFsOpen reading frames
PEPaired-end
PLsPolysaccharide lyases

References

  1. Ye, H.; Wang, J.; Shi, J.; Du, J.; Zhou, Y.; Huang, M.; Sun, B. Automatic and Intelligent Technologies of Solid-State Fermentation Process of Baijiu Production: Applications, Challenges, and Prospects. Foods 2021, 10, 680. [Google Scholar] [CrossRef] [PubMed]
  2. Guo, M.Y.; Hou, C.J.; Bian, M.H.; Shen, C.H.; Zhang, S.Y.; Huo, D.Q.; Ma, Y. Characterization of microbial community profiles associated with quality of Chinese strong-aromatic liquor through metagenomics. J. Appl. Microbiol. 2019, 127, 750–762. [Google Scholar] [CrossRef]
  3. Chai, L.-J.; Xu, P.-X.; Qian, W.; Zhang, X.-J.; Ma, J.; Lu, Z.-M.; Wang, S.-T.; Shen, C.-H.; Shi, J.-S.; Xu, Z.-H. Profiling the Clostridia with butyrate-producing potential in the mud of Chinese liquor fermentation cellar. Int. J. Food Microbiol. 2019, 297, 41–50. [Google Scholar] [CrossRef] [PubMed]
  4. Jia, W.; Fan, Z.; Du, A.; Li, Y.; Zhang, R.; Shi, Q.; Shi, L.; Chu, X. Recent advances in Baijiu analysis by chromatography based technology-A review. Food Chem. 2020, 324, 126899. [Google Scholar] [CrossRef] [PubMed]
  5. Liu, H.; Sun, B. Effect of Fermentation Processing on the Flavor of Baijiu. J. Agric. Food Chem. 2018, 66, 5425–5432. [Google Scholar] [CrossRef]
  6. Xie, X.; Chen, L.; Chen, T.; Yang, F.; Wang, Z.; Hu, Y.; Lu, J.; Lu, X.; Li, Q.; Zhang, X.; et al. Profiling and annotation of carbonyl compounds in Baijiu Daqu by chlorine isotope labeling-assisted ultrahigh-performance liquid chromatography-high resolution mass spectrometry. J. Chromatogr. A 2023, 1703, 464110. [Google Scholar] [CrossRef]
  7. Yu, Y.; Nie, Y.; Chen, S.; Xu, Y. Characterization of the dynamic retronasal aroma perception and oral aroma release of Baijiu by progressive profiling and an intra-oral SPME combined with GC × GC-TOFMS method. Food Chem. 2023, 405, 134854. [Google Scholar] [CrossRef]
  8. Sharma, A.; Rai, P.K.; Prasad, S. GC–MS detection and determination of major volatile compounds in Brassica juncea L. leaves and seeds. Microchem. J. 2018, 138, 488–493. [Google Scholar] [CrossRef]
  9. Xu, Y.; Sun, L.; Wang, X.; Zhu, S.; You, J.; Zhao, X.-E.; Bai, Y.; Liu, H. Integration of stable isotope labeling derivatization and magnetic dispersive solid phase extraction for measurement of neurosteroids by in vivo microdialysis and UHPLC-MS/MS. Talanta 2019, 199, 97–106. [Google Scholar] [CrossRef]
  10. Mu, Y.; Huang, J.; Zhou, R.; Zhang, S.; Qin, H.; Tang, H.; Pan, Q.; Tang, H. Characterization of the differences in aroma-active compounds in strong-flavor Baijiu induced by bioaugmented Daqu using metabolomics and sensomics approaches. Food Chem. 2023, 424, 136429. [Google Scholar] [CrossRef]
  11. Zou, W.; Zhao, C.; Luo, H. Diversity and Function of Microbial Community in Chinese Strong-Flavor Baijiu Ecosystem: A Review. Front. Microbiol. 2018, 9, 671. [Google Scholar] [CrossRef] [PubMed]
  12. Tu, W.; Cao, X.; Cheng, J.; Li, L.; Zhang, T.; Wu, Q.; Xiang, P.; Shen, C.; Li, Q. Chinese Baijiu: The Perfect Works of Microorganisms. Front. Microbiol. 2022, 13, 919044. [Google Scholar] [CrossRef] [PubMed]
  13. Li, H.; Liu, S.; Liu, Y.; Hui, M.; Pan, C. Functional microorganisms in Baijiu Daqu: Research progress and fortification strategy for application. Front. Microbiol. 2023, 14, 1119675. [Google Scholar] [CrossRef]
  14. Huang, Y.; Yi, Z.; Jin, Y.; Zhao, Y.; He, K.; Liu, D.; Zhao, D.; He, H.; Luo, H.; Zhang, W.; et al. New microbial resource: Microbial diversity, function and dynamics in Chinese liquor starter. Sci. Rep. 2017, 7, 14577. [Google Scholar] [CrossRef] [PubMed]
  15. Liu, W.H.; Chai, L.J.; Wang, H.M.; Lu, Z.M.; Zhang, X.J.; Xiao, C.; Wang, S.T.; Shen, C.H.; Shi, J.S.; Xu, Z.H. Bacteria and filamentous fungi running a relay race in Daqu fermentation enable macromolecular degradation and flavor substance formation. Int. J. Food Microbiol. 2023, 390, 110118. [Google Scholar] [CrossRef]
  16. Tan, Y.; Zhong, H.; Zhao, D.; Du, H.; Xu, Y. Succession rate of microbial community causes flavor difference in strong-aroma Baijiu making process. Int. J. Food Microbiol. 2019, 311, 108350. [Google Scholar] [CrossRef]
  17. Xu, S.; Zhang, M.; Xu, B.; Liu, L.; Sun, W.; Mu, D.; Wu, X.; Li, X. Microbial communities and flavor formation in the fermentation of Chinese strong-flavor Baijiu produced from old and new Zaopei. Food Res. Int. 2022, 156, 111162. [Google Scholar] [CrossRef]
  18. Chai, L.J.; Qian, W.; Zhong, X.Z.; Zhang, X.J.; Lu, Z.M.; Zhang, S.Y.; Wang, S.T.; Shen, C.H.; Shi, J.S.; Xu, Z.H. Mining the Factors Driving the Evolution of the Pit Mud Microbiome under the Impact of Long-Term Production of Strong-Flavor Baijiu. Appl. Environ. Microbiol. 2021, 87, 88521. [Google Scholar] [CrossRef]
  19. Shoubao, Y.; Yonglei, J.; Qi, Z.; Shunchang, P.; Cuie, S. Bacterial diversity associated with volatile compound accumulation in pit mud of Chinese strong-flavor baijiu pit. AMB Express 2023, 13, 3. [Google Scholar] [CrossRef]
  20. Wu, L.; Fan, J.; Chen, J.; Fang, F. Chemotaxis of Clostridium Strains Isolated from Pit Mud and Its Application in Baijiu Fermentation. Foods 2022, 11, 3639. [Google Scholar] [CrossRef]
  21. Wang, X.J.; Zhu, H.M.; Ren, Z.Q.; Huang, Z.G.; Wei, C.H.; Deng, J. Characterization of Microbial Diversity and Community Structure in Fermentation Pit Mud of Different Ages for Production of Strong-Aroma Baijiu. Pol. J. Microbiol. 2020, 69, 151–164. [Google Scholar] [CrossRef] [PubMed]
  22. Xu, M.L.; Yu, Y.; Ramaswamy, H.S.; Zhu, S.M. Characterization of Chinese liquor aroma components during aging process and liquor age discrimination using gas chromatography combined with multivariable statistics. Sci. Rep. 2017, 7, 39671. [Google Scholar] [CrossRef] [PubMed]
  23. Sun, H.; Chai, L.J.; Fang, G.Y.; Lu, Z.M.; Zhang, X.J.; Wang, S.T.; Shen, C.H.; Shi, J.S.; Xu, Z.H. Metabolite-Based Mutualistic Interaction between Two Novel Clostridial Species from Pit Mud Enhances Butyrate and Caproate Production. Appl. Environ. Microbiol. 2022, 88, 48422. [Google Scholar] [CrossRef]
  24. Ustick, L.J.; Larkin, A.A.; Garcia, C.A.; Garcia, N.S.; Brock, M.L.; Lee, J.A.; Wiseman, N.A.; Moore, J.K.; Martiny, A.C. Metagenomic analysis reveals global-scale patterns of ocean nutrient limitation. Science 2021, 372, 287–291. [Google Scholar] [CrossRef]
  25. Luo, T.; He, J.; Shi, Z.; Shi, Y.; Zhang, S.; Liu, Y.; Luo, G. Metagenomic Binning Revealed Microbial Shifts in Anaerobic Degradation of Phenol with Hydrochar and Pyrochar. Fermentation 2023, 9, 387. [Google Scholar] [CrossRef]
  26. Paoli, L.; Ruscheweyh, H.-J.; Forneris, C.C.; Hubrich, F.; Kautsar, S.; Bhushan, A.; Lotti, A.; Clayssen, Q.; Salazar, G.; Milanese, A.; et al. Biosynthetic potential of the global ocean microbiome. Nature 2022, 607, 111–118. [Google Scholar] [CrossRef] [PubMed]
  27. Shalon, D.; Culver, R.N.; Grembi, J.A.; Folz, J.; Treit, P.V.; Shi, H.; Rosenberger, F.A.; Dethlefsen, L.; Meng, X.; Yaffe, E.; et al. Profiling the human intestinal environment under physiological conditions. Nature 2023, 617, 581–591. [Google Scholar] [CrossRef]
  28. Mardanov, A.V.; Gruzdev, E.V.; Beletsky, A.V.; Ivanova, E.V.; Shalamitskiy, M.Y.; Tanashchuk, T.N.; Ravin, N.V. Microbial Communities of Flor Velums and the Genetic Stability of Flor Yeasts Used for a Long Time for the Industrial Production of Sherry-like Wines. Fermentation 2023, 9, 367. [Google Scholar] [CrossRef]
  29. Levin, D.; Raab, N.; Pinto, Y.; Rothschild, D.; Zanir, G.; Godneva, A.; Mellul, N.; Futorian, D.; Gal, D.; Leviatan, S.; et al. Diversity and functional landscapes in the microbiota of animals in the wild. Science 2021, 372, 5352. [Google Scholar] [CrossRef]
  30. Carter, M.R.; Gregorich, E.G. Soil Sampling and Methods of Analysis, 2nd ed.; CRC Press: Boca Raton, FL, USA, 2007; pp. 1–14. [Google Scholar] [CrossRef]
  31. Afiahayati; Sato, K.; Sakakibara, Y. MetaVelvet-SL: An extension of the Velvet assembler to a de novo metagenomic assembler utilizing supervised learning. DNA Res. 2015, 22, 69–77. [Google Scholar] [CrossRef]
  32. Li, S.; Chou, H.H. LUCY2: An interactive DNA sequence quality trimming and vector removal tool. Bioinformatics 2004, 20, 2865–2866. [Google Scholar] [CrossRef] [PubMed]
  33. Cox, M.P.; Peterson, D.A.; Biggs, P.J. SolexaQA: At-a-glance quality assessment of Illumina second-generation sequencing data. BMC Bioinform. 2010, 11, 485. [Google Scholar] [CrossRef]
  34. Luo, R.; Wong, T.; Zhu, J.; Liu, C.M.; Zhu, X.; Wu, E.; Lee, L.K.; Lin, H.; Zhu, W.; Cheung, D.W.; et al. SOAP3-dp: Fast, accurate and sensitive GPU-based short read aligner. PLoS ONE 2013, 8, 65632. [Google Scholar] [CrossRef] [PubMed]
  35. Peng, Y.; Leung, H.C.; Yiu, S.M.; Chin, F.Y. IDBA-UD: A de novo assembler for single-cell and metagenomic sequencing data with highly uneven depth. Bioinformatics 2012, 28, 1420–1428. [Google Scholar] [CrossRef] [PubMed]
  36. Bruna, T.; Lomsadze, A.; Borodovsky, M. GeneMark-ETP: Automatic Gene Finding in Eukaryotic Genomes in Consistence with Extrinsic Data. bioRxiv 2023, 1, 13. [Google Scholar] [CrossRef]
  37. Wei, Z.G.; Chen, X.; Zhang, X.D.; Zhang, H.; Fan, X.G.; Gao, H.Y.; Liu, F.; Qian, Y. Comparison of methods for biological sequence clustering. IEEE/ACM Trans. Comput. Biol. Bioinform. 2023, 3, 13. [Google Scholar] [CrossRef]
  38. Abdelsalam, N.A.; Elshora, H.; El-Hadidi, M. Interactive Web-Based Services for Metagenomic Data Analysis and Comparisons. Methods Mol. Biol. 2023, 2649, 133–174. [Google Scholar] [CrossRef]
  39. Kanehisa, M.; Furumichi, M.; Sato, Y.; Kawashima, M.; Ishiguro-Watanabe, M. KEGG for taxonomy-based analysis of pathways and genomes. Nucleic Acids Res. 2023, 51, 587–592. [Google Scholar] [CrossRef]
  40. Hernández-Plaza, A.; Szklarczyk, D.; Botas, J.; Cantalapiedra, C.P.; Giner-Lamia, J.; Mende, D.R.; Kirsch, R.; Rattei, T.; Letunic, I.; Jensen, L.J.; et al. eggNOG 6.0: Enabling comparative genomics across 12,535 organisms. Nucleic Acids Res. 2023, 51, 389–394. [Google Scholar] [CrossRef]
  41. Gautam, A.; Zeng, W.; Huson, D.H. DIAMOND +  MEGAN Microbiome Analysis. Methods Mol. Biol. 2023, 2649, 107–131. [Google Scholar] [CrossRef]
  42. Dong, C.; Zeng, Z.; Pu, D.K.; Wen, Q.F.; Liu, S.; Du, M.Z.; Sun, Y.; Gao, Y.Z.; Rao, N.; Huang, J.; et al. CasLocusAnno: A web-based server for annotating cas loci and their corresponding (sub)types. FEBS Lett. 2019, 593, 2646–2654. [Google Scholar] [CrossRef] [PubMed]
  43. Zheng, J.; Hu, B.; Zhang, X.; Ge, Q.; Yan, Y.; Akresi, J.; Piyush, V.; Huang, L.; Yin, Y. dbCAN-seq update: CAZyme gene clusters and substrates in microbiomes. Nucleic Acids Res. 2023, 51, 557–563. [Google Scholar] [CrossRef] [PubMed]
Figure 1. The sampling locations on the geographic map of China and Sichuan province.
Fermentation 09 00772 g001
Figure 2. The GC% content for the metagenomic data of the FPs. Note: Reference FrameSoil (Available public data: NCBI ID13699/MG-RAST ID 4441091.3).
Fermentation 09 00772 g002
Figure 3. Venn analysis for cross-comparison of the functional genes in FPs with different ages (A), layers (B), and geographical regions (C).
Fermentation 09 00772 g003
Figure 4. The relative abundance of functional genes in the microbiota of FPs.
Fermentation 09 00772 g004
Figure 5. Functional categories of genes in FPs with different ages (A), layers (B), and geographical regions (C); hierarchical clustering analysis heat map of the differential functional categories of genes in FPs (D).
Fermentation 09 00772 g005
Figure 6. The microbial metabolic pathways of FP microbiotas (A); the biosynthesis of secondary metabolites in the FP microbiotas (B).
Fermentation 09 00772 g006
Figure 7. Integrated analysis of the main metabolic network for flavor compounds in industrial CSAB fermentation by FPs.
Fermentation 09 00772 g007
Table 1. Assembly results of the scaftigs for the samples (≥10 Kb).
Sample ClassificationTotal Len. (bp)Num.Average Len. (bp)Max Len. (bp)N50 Len. (bp)
RegionAgePosition
Luzhou440 yearsAll-Bottom_layer90,762,126288231,492684,28643,776
Luzhou440 yearsAll-Middle_layer90,425,571333827,089383,10934,736
Luzhou440 yearsAll-Top_layer66,059,291230128,708383,18936,358
Luzhou220 yearsAll-Bottom_layer67,906,746238328,496938,47134,156
Luzhou220 yearsAll-Middle_layer56,765,588195329,065454,80636,701
Luzhou220 yearsAll-Top_layer92,198,789333427,654362,75734,395
Luzhou140 yearsAll-Bottom_layer65,720,000226629,002465,95636,112
Luzhou140 yearsAll-Middle_layer82,135,058286128,708544,38137,429
Luzhou140 yearsAll-Top_layer78,202,504278928,039353,10436,019
Luzhou50 yearsAll-Bottom_layer70,386,979220431,936750,63943,744
Luzhou50 yearsAll-Middle_layer65,224,763230728,272294,87434,635
Luzhou50 yearsAll-Top_layer82,475,229271730,355426,27641,806
Chengdu50 yearsAll-Bottom_layer93,242,880315129,591365,43838,234
Chengdu50 yearsAll-Middle_layer116,609,574393129,664793,64338,912
Chengdu50 yearsAll-Top_layer84,719,849279130,354411,34240,105
Mianyang50 yearsAll-Bottom_layer97,967,763300532,601879,26744,720
Mianyang50 yearsAll-Middle_layer72,020,509192837,355689,89656,266
Mianyang50 yearsAll-Top_layer93,155,296318129,284644,23936,710
Table 2. The results of the scaftigs for the samples.
Sample ClassificationNumber of GenesNumber of Unigenes
RegionAgePosition
Luzhou440 yearsAll-Bottom_layer86,44985,431
Luzhou440 yearsAll-Middle_layer86,33885,295
Luzhou440 yearsAll-Top_layer63,07962,273
Luzhou220 yearsAll-Bottom_layer64,75463,952
Luzhou220 yearsAll-Middle_layer54,24053,577
Luzhou220 yearsAll-Top_layer88,62287,547
Luzhou140 yearsAll-Bottom_layer62,35661,522
Luzhou140 yearsAll-Middle_layer78,89477,925
Luzhou140 yearsAll-Top_layer74,56773,631
Luzhou50 yearsAll-Bottom_layer68,44267,632
Luzhou50 yearsAll-Middle_layer62,35761,567
Luzhou50 yearsAll-Top_layer78,48577,561
Chengdu50 yearsAll-Bottom_layer88,10186,959
Chengdu50 yearsAll-Middle_layer109,015107,659
Chengdu50 yearsAll-Top_layer80,54079,564
Mianyang50 yearsAll-Bottom_layer92,05390,946
Mianyang50 yearsAll-Middle_layer67,10666,184
Mianyang50 yearsAll-Top_layer87,53086,435
Disclaimer/Publisher’s Note: The statements, opinions and data contained in all publications are solely those of the individual author(s) and contributor(s) and not of MDPI and/or the editor(s). MDPI and/or the editor(s) disclaim responsibility for any injury to people or property resulting from any ideas, methods, instructions or products referred to in the content.

