The research yielded a significant amount of bioethanol from lignocellulosic components through the utilization of bacterial consortia sourced from various bio-wastes, employing fermentation methodologies. A total of 20 isolates were procured from bio-wastes, out of which three were found to have effectively produced bioethanol. Consequently, the consortium of three bacteria (ICBP1, ICBP7, and ICBP15) was selected for the study instead of the remaining 17 isolates to produce ethanol using varying combinations and substrates.
3.1. Isolation and Identification of Bacteria
The population of various bacteria gathered from various bio-wastes was tallied, and the orange waste substrate had the greatest bacterial population (221 × 106 CFU/g) compared to the other bio-waste substrates examined throughout the research, i.e., 102 × 10−5 CFU/g and 186 × 10−5 CFU/g in mango and tapioca shells, respectively. The process of isolating and identifying bacteria was conducted by utilizing the morphological and biochemical traits of 20 distinct isolates. All of the examined isolates, specifically 10, exhibited positive results for catalase, while 10 showed negative results for both H2S and lactose fermentation. However, regarding other biochemical tests, there was a lack of consistency in the results. The ten isolates that were examined displayed dissimilar responses. Specifically, six isolates exhibited a positive urease test, three displayed a positive oxidase test, and one was positive for MR, VP, nitrate reduction, and starch hydrolysis tests.
3.2. Screening of Cellulase Enzymes-Producing Bacteria
The three isolates, namely
E. cloacae (ICPB1),
P. aeruginosa (ICPB7), and
B. cereus (ICPB15), exhibited distinct zones as a “zone of clearance” in bacterial growth on CMC agar plates and determined the appearance in contrast to the remaining 17 isolates. The first was determined to be
E. cloacae (ICPB1), a rod-shaped, facultatively anaerobic, Gram-negative bacterium with peritrichous flagella. Its oxidase and catalase tests were also negative.
P. aeruginosa (ICPB7) was identified as a gram-negative, rod-shaped bacteria with positive citrate, catalase, and oxidase findings.
B. cereus (ICPB15) was identified as a gram-positive, rod-shaped, aerobic, facultatively anaerobic, motile, beta-hemolytic bacterium. This was because the Voges-Proskauer test, the starch hydrolysis, the nitrate reduction, and the citrate test were all positive. The bacterial isolates were characterized in accordance with the guidelines set forth in
Bergey’s Manual of Systematic Bacteriology [
26].
3.6. Analysis of Ethanol by FTIR
The distinctive absorptions of bioethanol are located in the spectral range between 1700 and 1800 cm
−1. The absorption spectrum of ethanol reveals peaks at specific wavenumbers, namely 2750–3000 cm
−1, which correspond to the stretching modes of CH
2 and CH
3, 1350–1500 cm
−1, which signify angular deformation of CH
2 and CH
3, and 720 cm
−1, which attributed to asymmetric angular deformation within the plane of CH
2. The biodiesel spectra exhibit carbonyl bands’ stretching vibration at approximately 1750 cm
−1. Symmetric angular deformation out of the plane of the C–H bonds of olefins is assigned to peaks in the 1000–900 cm
−1 region. The asymmetric stretching band of C–C (O)–O bonds of the ester group is assigned to peaks around 1200 cm
−1, while peaks around 1183 cm
−1 are assigned to the asymmetric stretching band of O–C–C bonds. The 1378 cm
−1 band is significant for detecting methyl groups in ethanol due to its association with the bending vibration location of C-H groups (
Table 3,
Table 4,
Table 5,
Table 6,
Table 7,
Table 8 and
Table 9 and
Figure 2,
Figure 3,
Figure 4,
Figure 5,
Figure 6,
Figure 7 and
Figure 8). The results of our investigation align with the research conducted by Kosa et al. [
24], which suggests that the peak observed at 3400 cm
−1 can be attributed to the stretching vibration of the hydroxyl group (OH).
Table 3.
Prediction of the functional group using FTIR spectroscopy with different frequencies using ICPB1 (E. cloacae) in tapioca shell bioethanol.
Table 3.
Prediction of the functional group using FTIR spectroscopy with different frequencies using ICPB1 (E. cloacae) in tapioca shell bioethanol.
| S. No. | Frequency | Bonds | Functional Group |
|---|
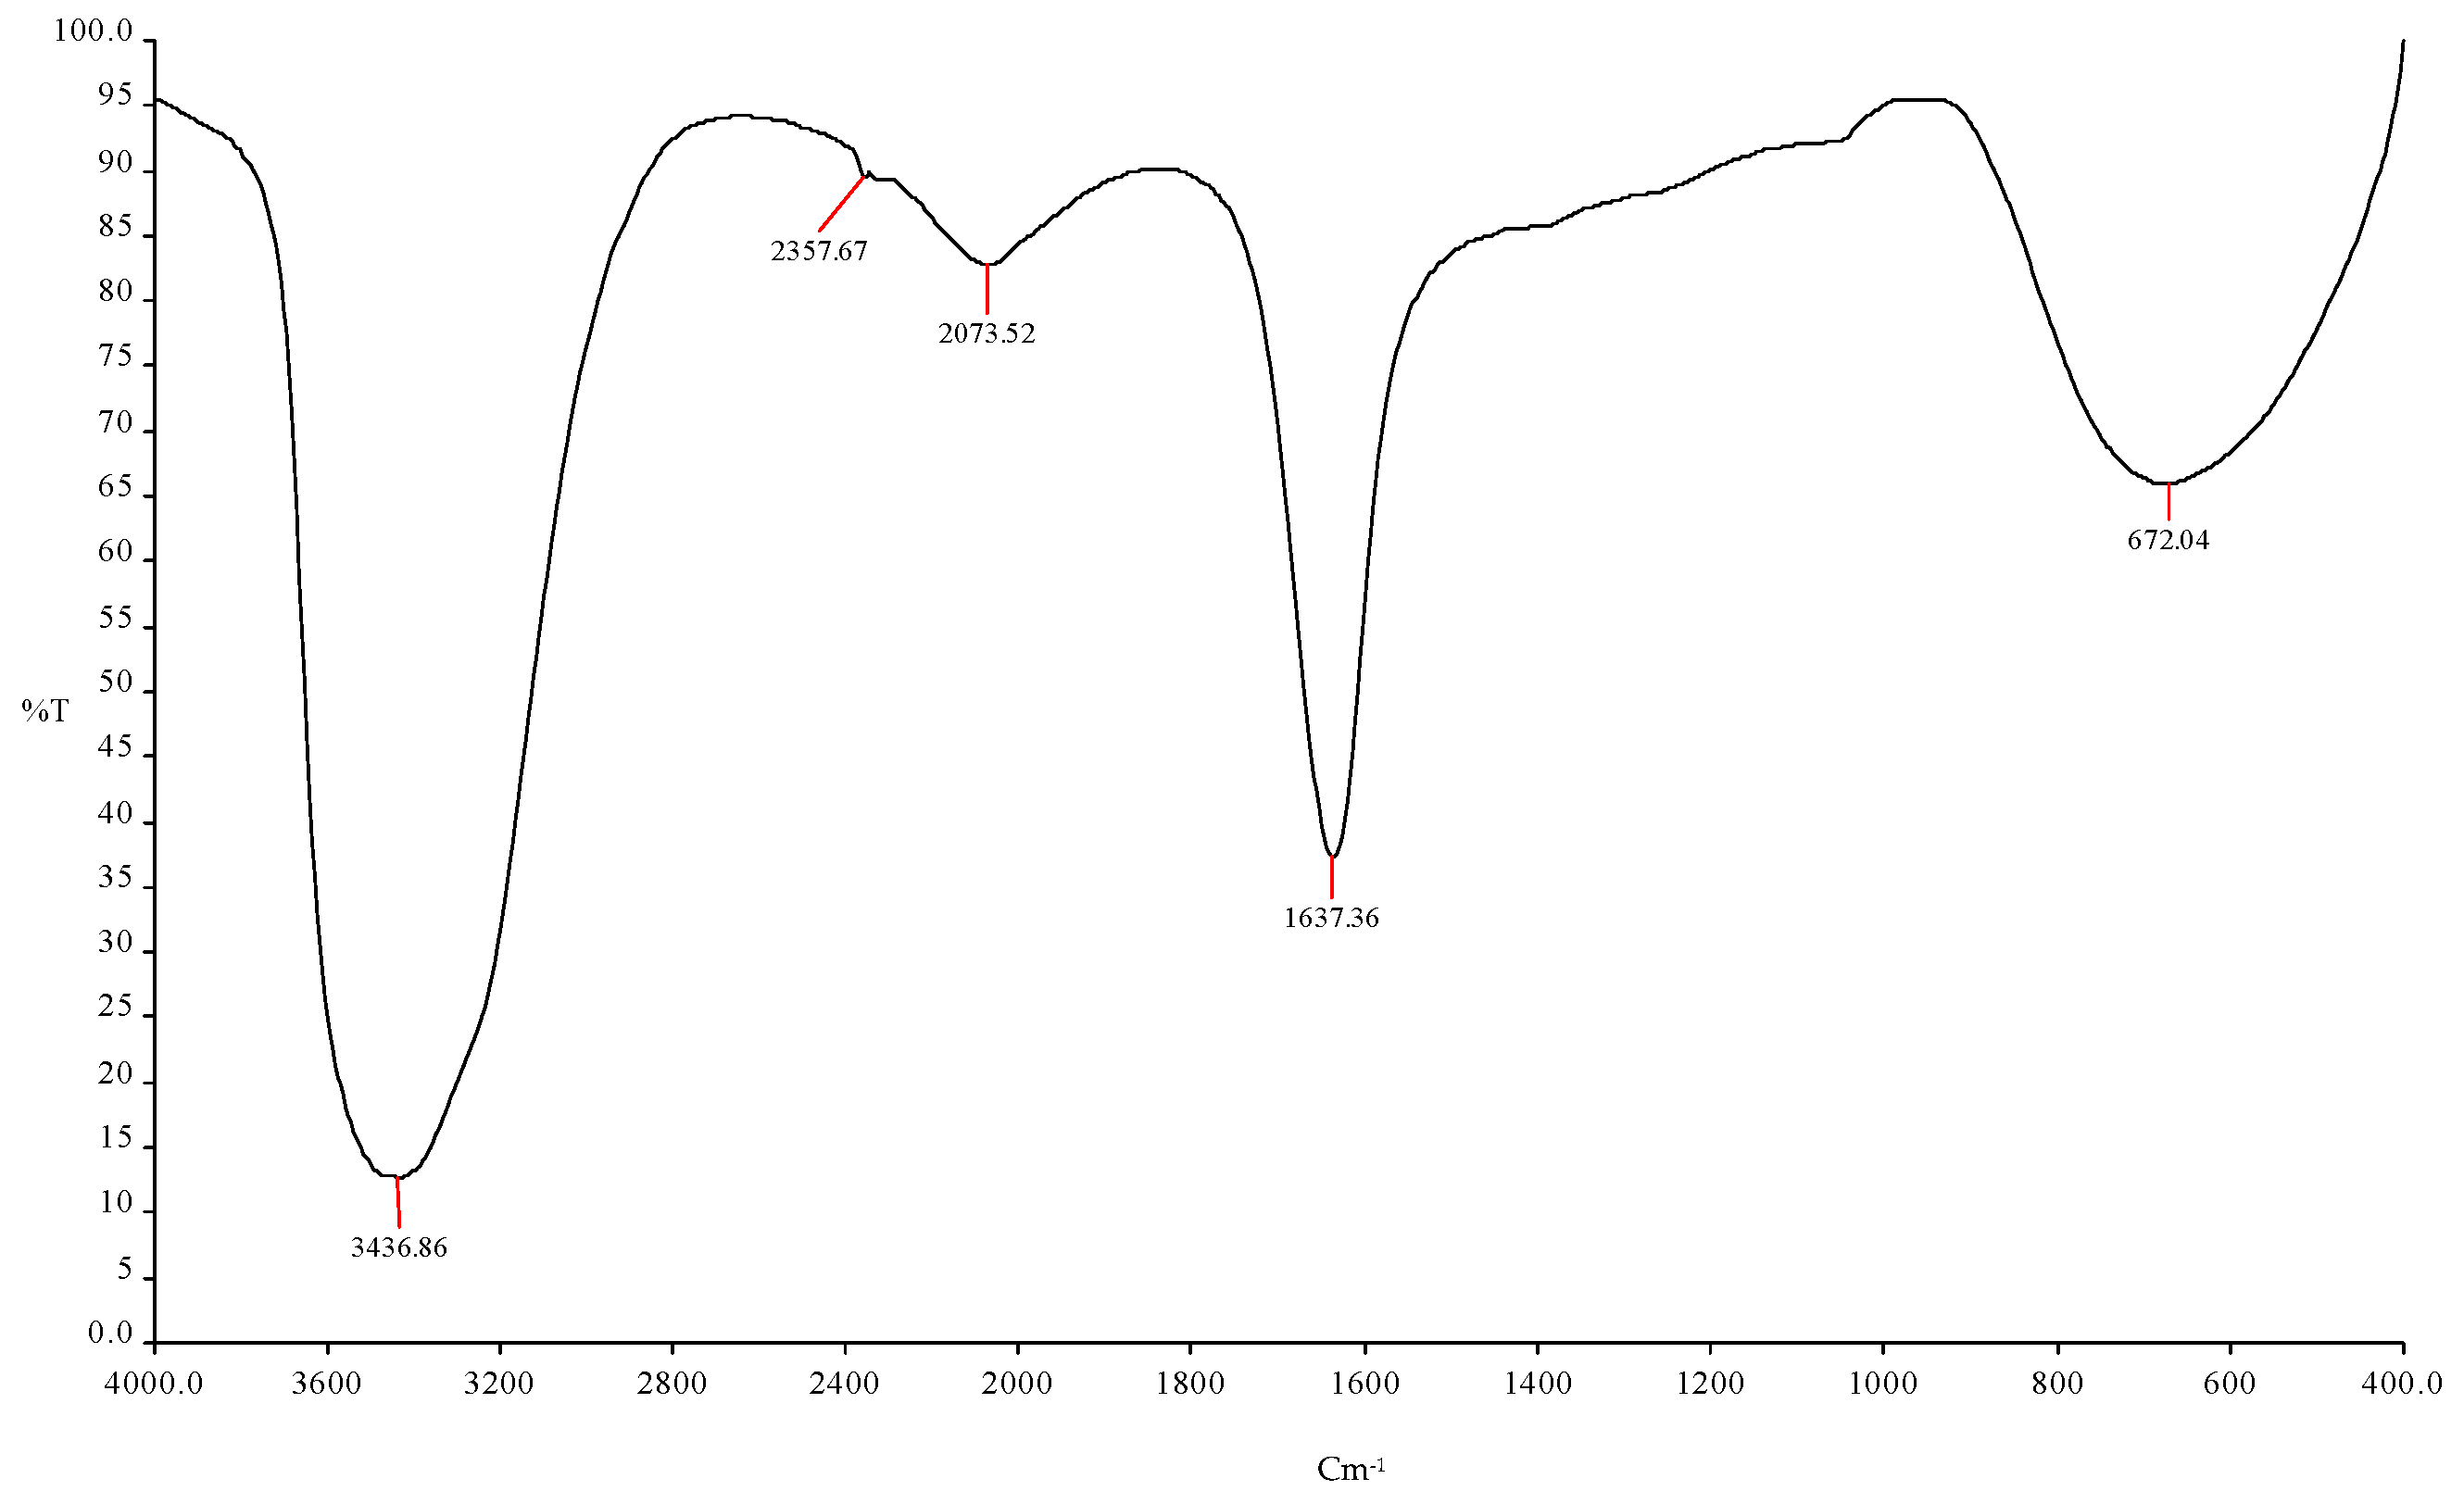
| 1 | 3436.86 cm−1 | N-H | Primary and secondary amines and amides (stretch) |
| 2 | 2357.67 cm−1 | C-H | Aldehyde |
| 3 | 2073.52 cm−1 | O-H | Carboxylic acid |
| 4 | 1637.36 cm−1 | C-O | Alcohols, ethers, ester, carboxylic acid, anhydrides |
| 5 | 672.04 cm−1 | C=O | Amides |
Figure 2.
FTIR spectroscopy analysis showed the ethanol production using ICPB1 (E. cloacae).
Figure 2.
FTIR spectroscopy analysis showed the ethanol production using ICPB1 (E. cloacae).
Table 4.
Prediction of the functional group using FTIR spectroscopy with different frequencies using ICPB7 (P. aeruginosa) in mango peel bio-ethanol.
Table 4.
Prediction of the functional group using FTIR spectroscopy with different frequencies using ICPB7 (P. aeruginosa) in mango peel bio-ethanol.
| S. No. | Frequency | Bonds | Functional Group |
|---|
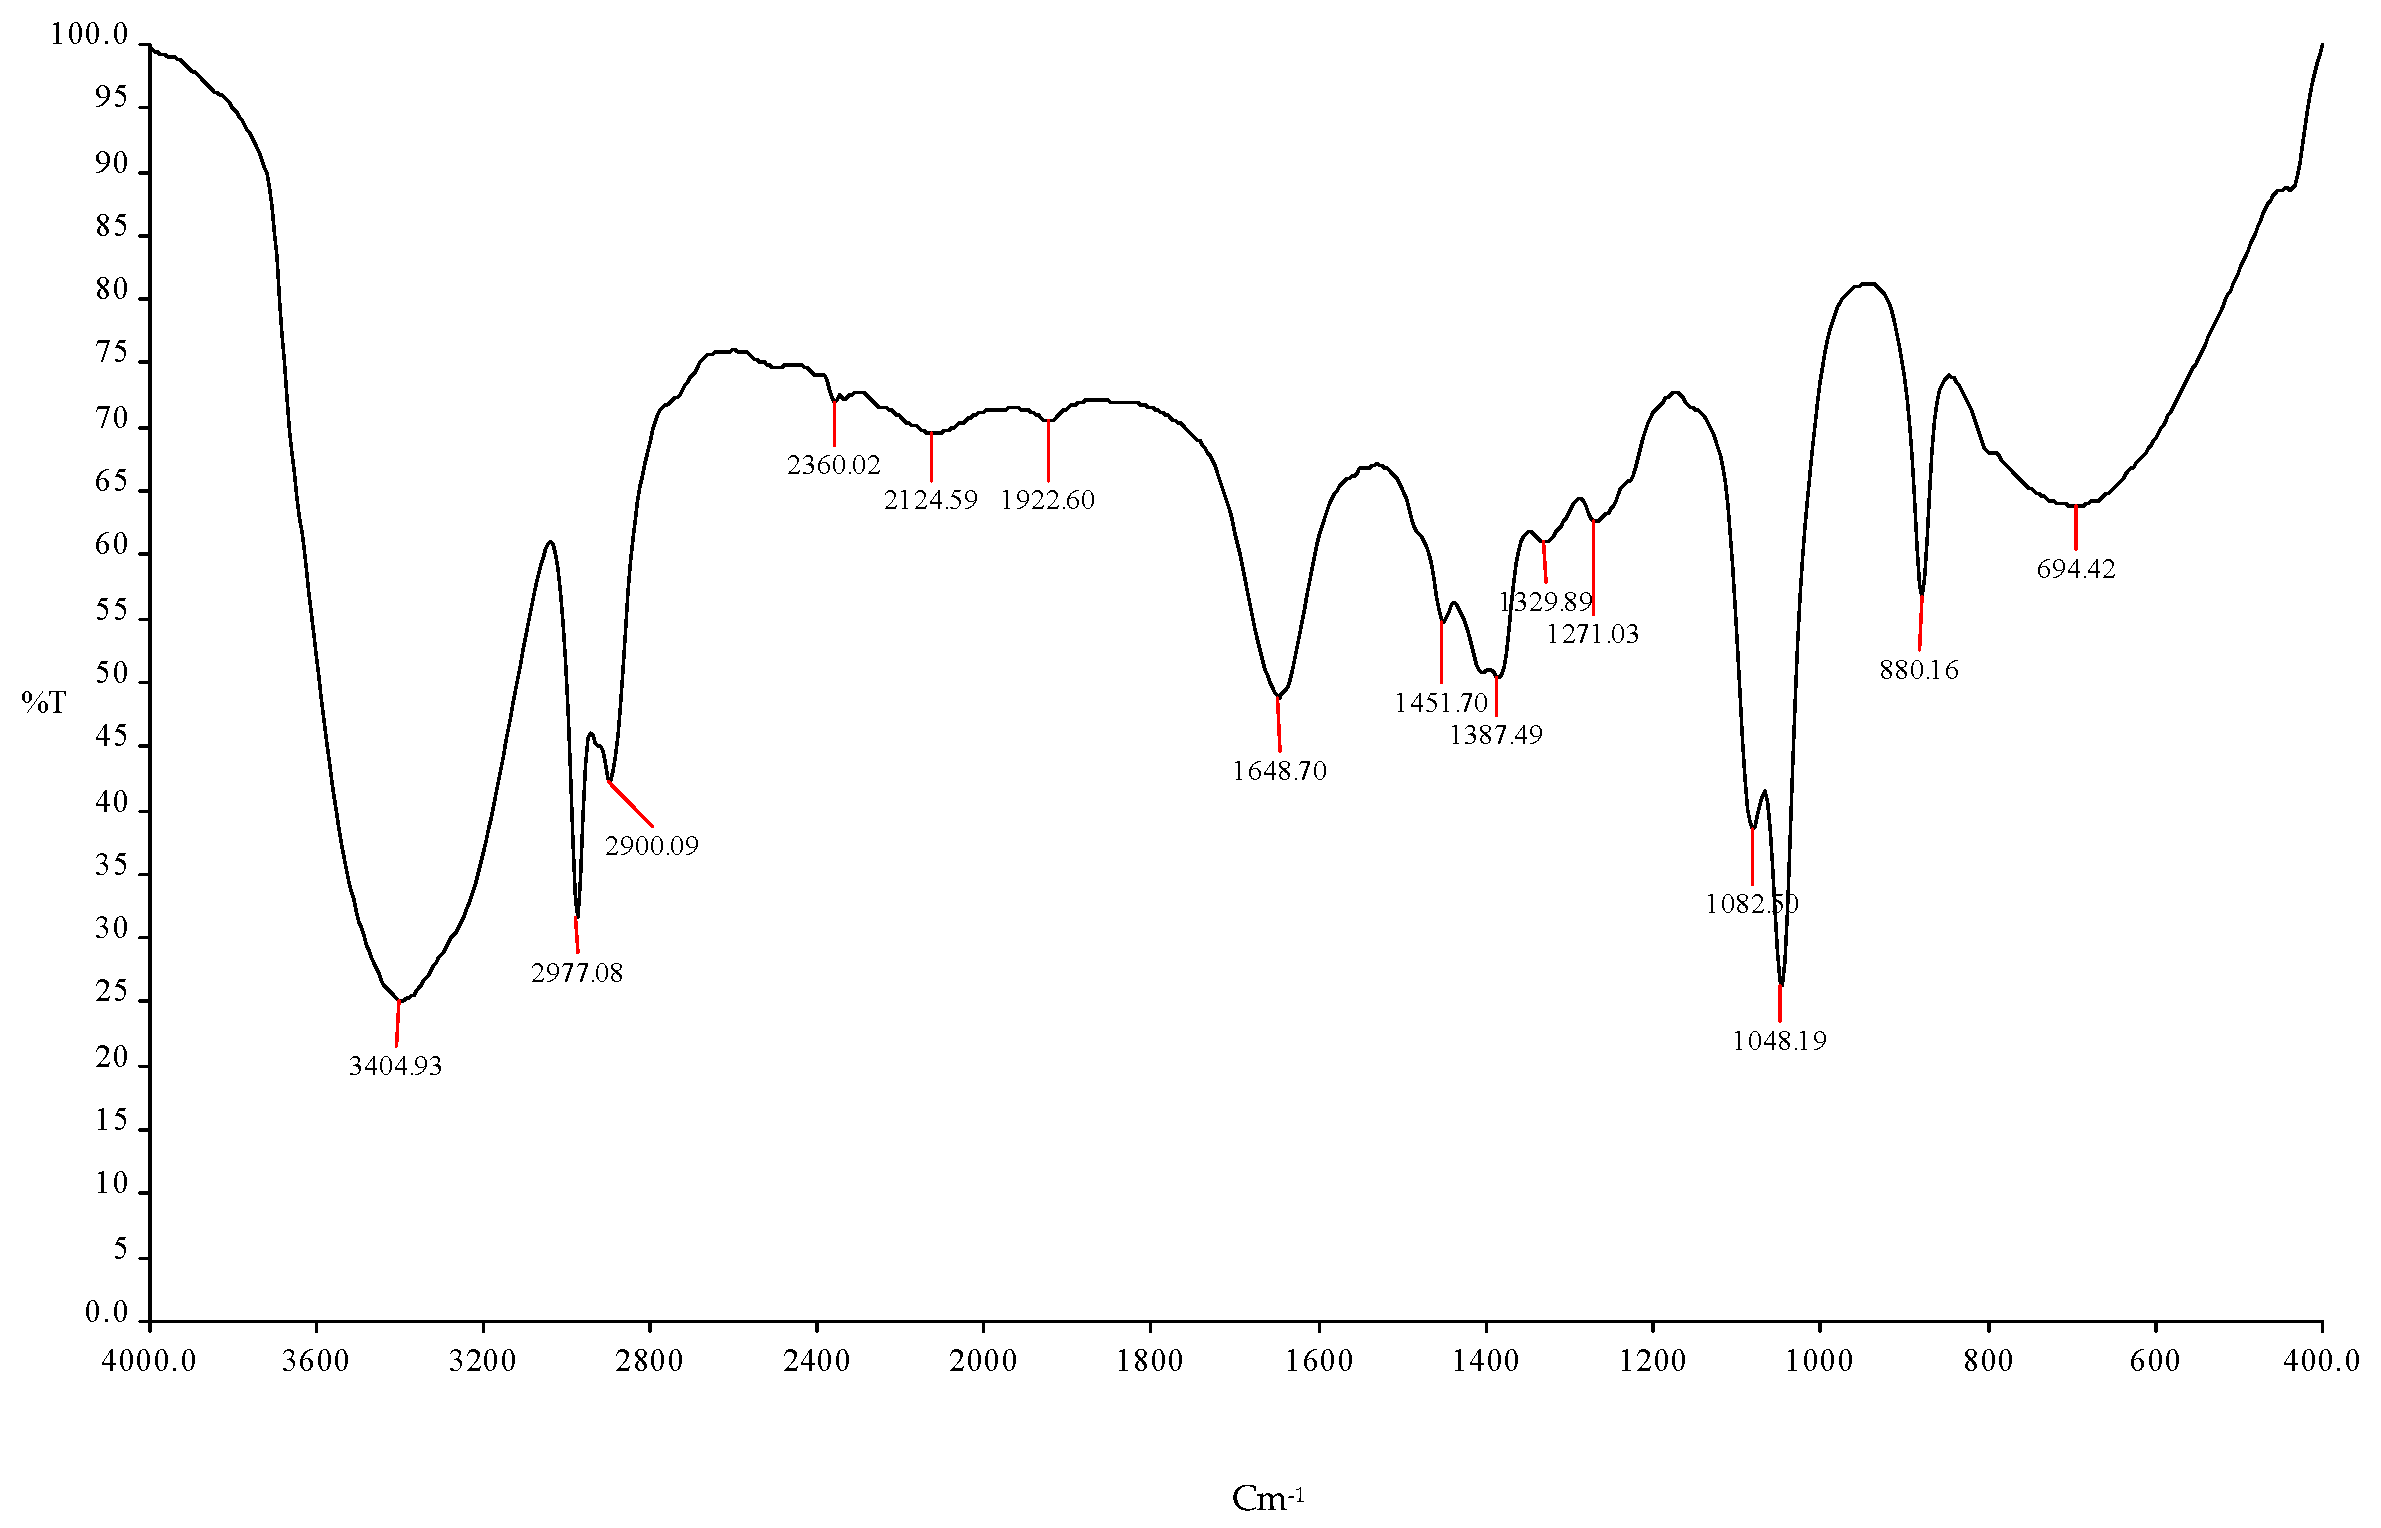
| 1 | 3404.93 cm−1 | O-H | Esters |
| 2 | 2977.08 cm−1 | C-H | R-CH3 |
| 3 | 2900.09 cm−1 | O-H | -COOH |
| 4 | 2360.02 cm−1 | CC | Alkynes |
| 5 | 2124.59 cm−1 | C-O | Alcohols |
| 6 | 1922.60 cm−1 | O-H | Esters |
| 7 | 1648.70 cm−1 | C=O | Alcohols |
| 8 | 1451.70 cm−1 | C-H | R-CH3 |
| 9 | 1387.49 cm−1, 1329.89 cm−1 | C=O | Alcohols |
| 10 | 1271.03 cm−1 | C-O | Alcohols |
| 11 | 1082.50 cm−1, 1048.19 | C-H | Alkynes |
| 12 | 880.16 cm−1, 694.42 cm−1 | C=O | Amides |
Figure 3.
FTIR spectroscopy analysis showed the ethanol production using ICPB7 (P. aeruginosa).
Figure 3.
FTIR spectroscopy analysis showed the ethanol production using ICPB7 (P. aeruginosa).
Table 5.
Prediction of the functional group using FTIR spectroscopy with different frequencies using ICPB15 (B. cereus) in orange peel bio-ethanol.
Table 5.
Prediction of the functional group using FTIR spectroscopy with different frequencies using ICPB15 (B. cereus) in orange peel bio-ethanol.
| S. No. | Frequency | Bonds | Functional Group |
|---|
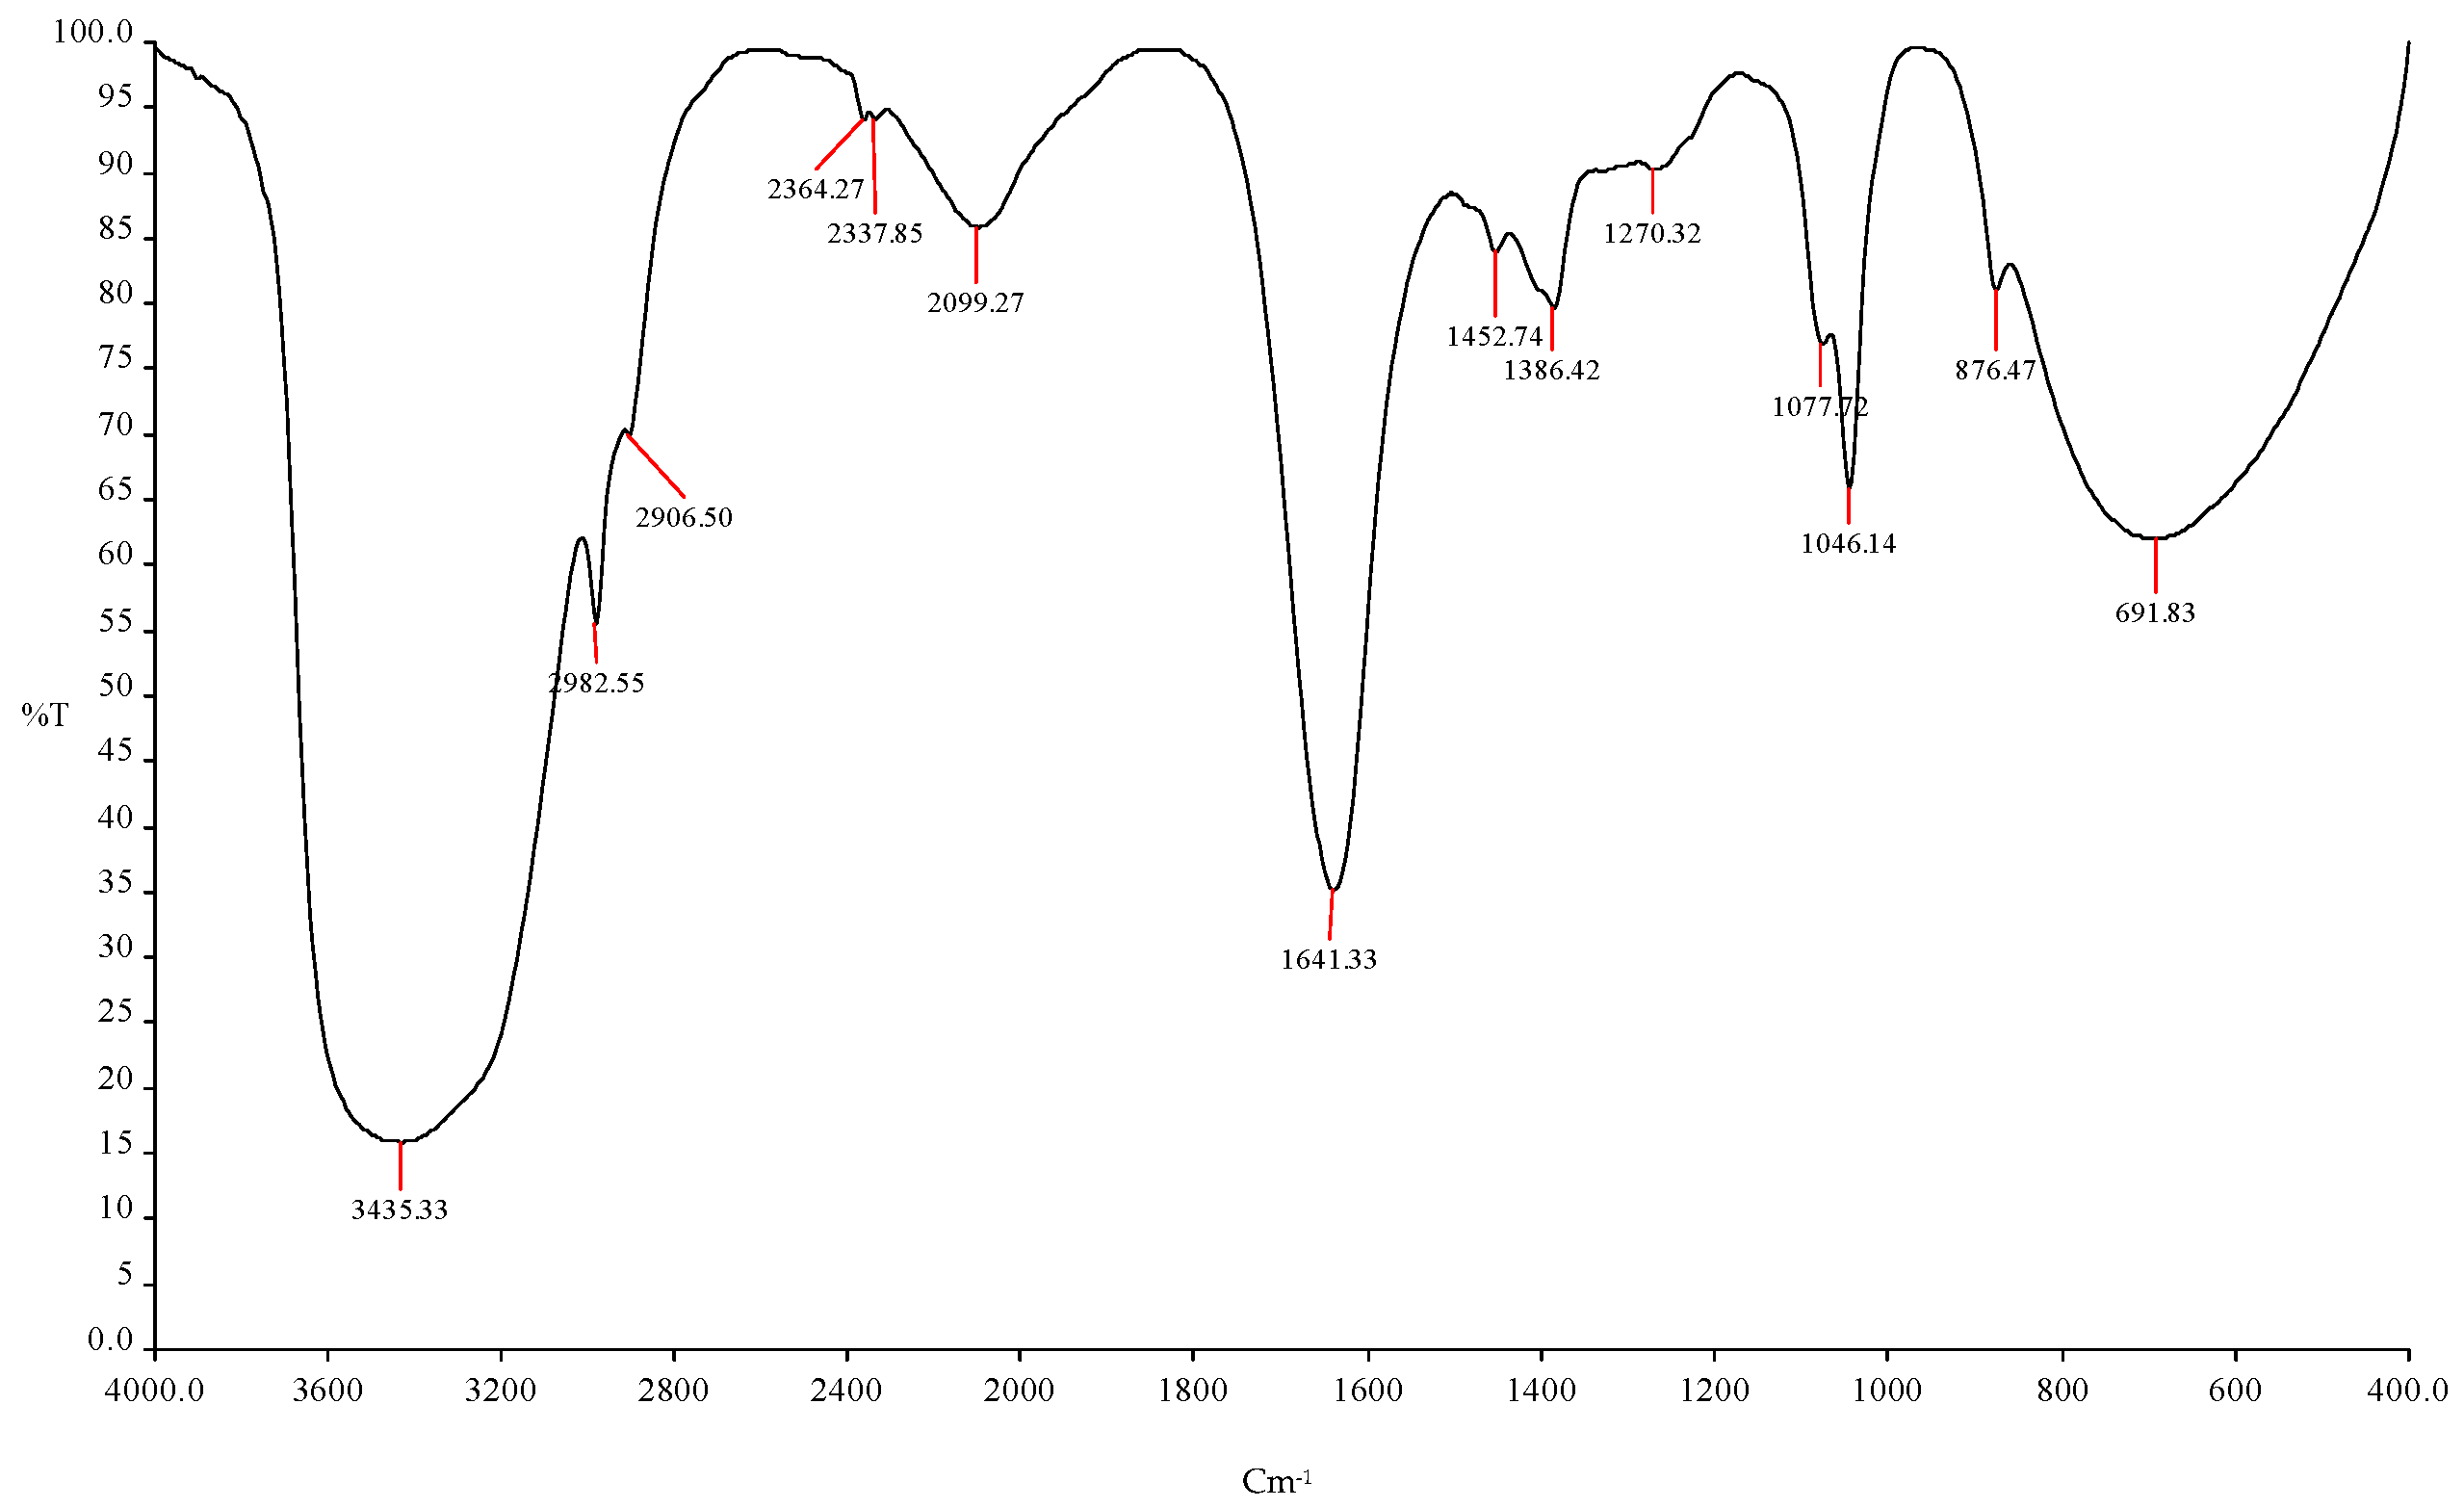
| 1 | 3435.33 cm−1 | O-H | Esters |
| 2 | 2982.55 cm−1 | C-H | R-CH3 |
| 3 | 2906.50 cm−1 | C-H | R-CH3 |
| 4 | 2364.27 cm−1, 2337.85 cm−1, 2099.27 cm−1 | O-H | Esters |
| 5 | 1641.33 cm−1 | C=O | Alcohols |
| 6 | 1452.74 cm−1 | C-H | R-CH3 |
| 7 | 1386.42cm−1, 1270.32 cm−1 | C=O | Alcohols |
| 8 | 1077.72 cm−1 | C-O | Alcohols |
| 9 | 1046.14 cm−1 | C-H | Alkynes |
| 10. | 876.47 cm−1 | C=O | Amides |
| 11. | 691.83 cm−1 | C=O | Amides |
Figure 4.
FTIR spectroscopy analysis showed the ethanol production using ICPB15 (B. cereus).
Figure 4.
FTIR spectroscopy analysis showed the ethanol production using ICPB15 (B. cereus).
Table 6.
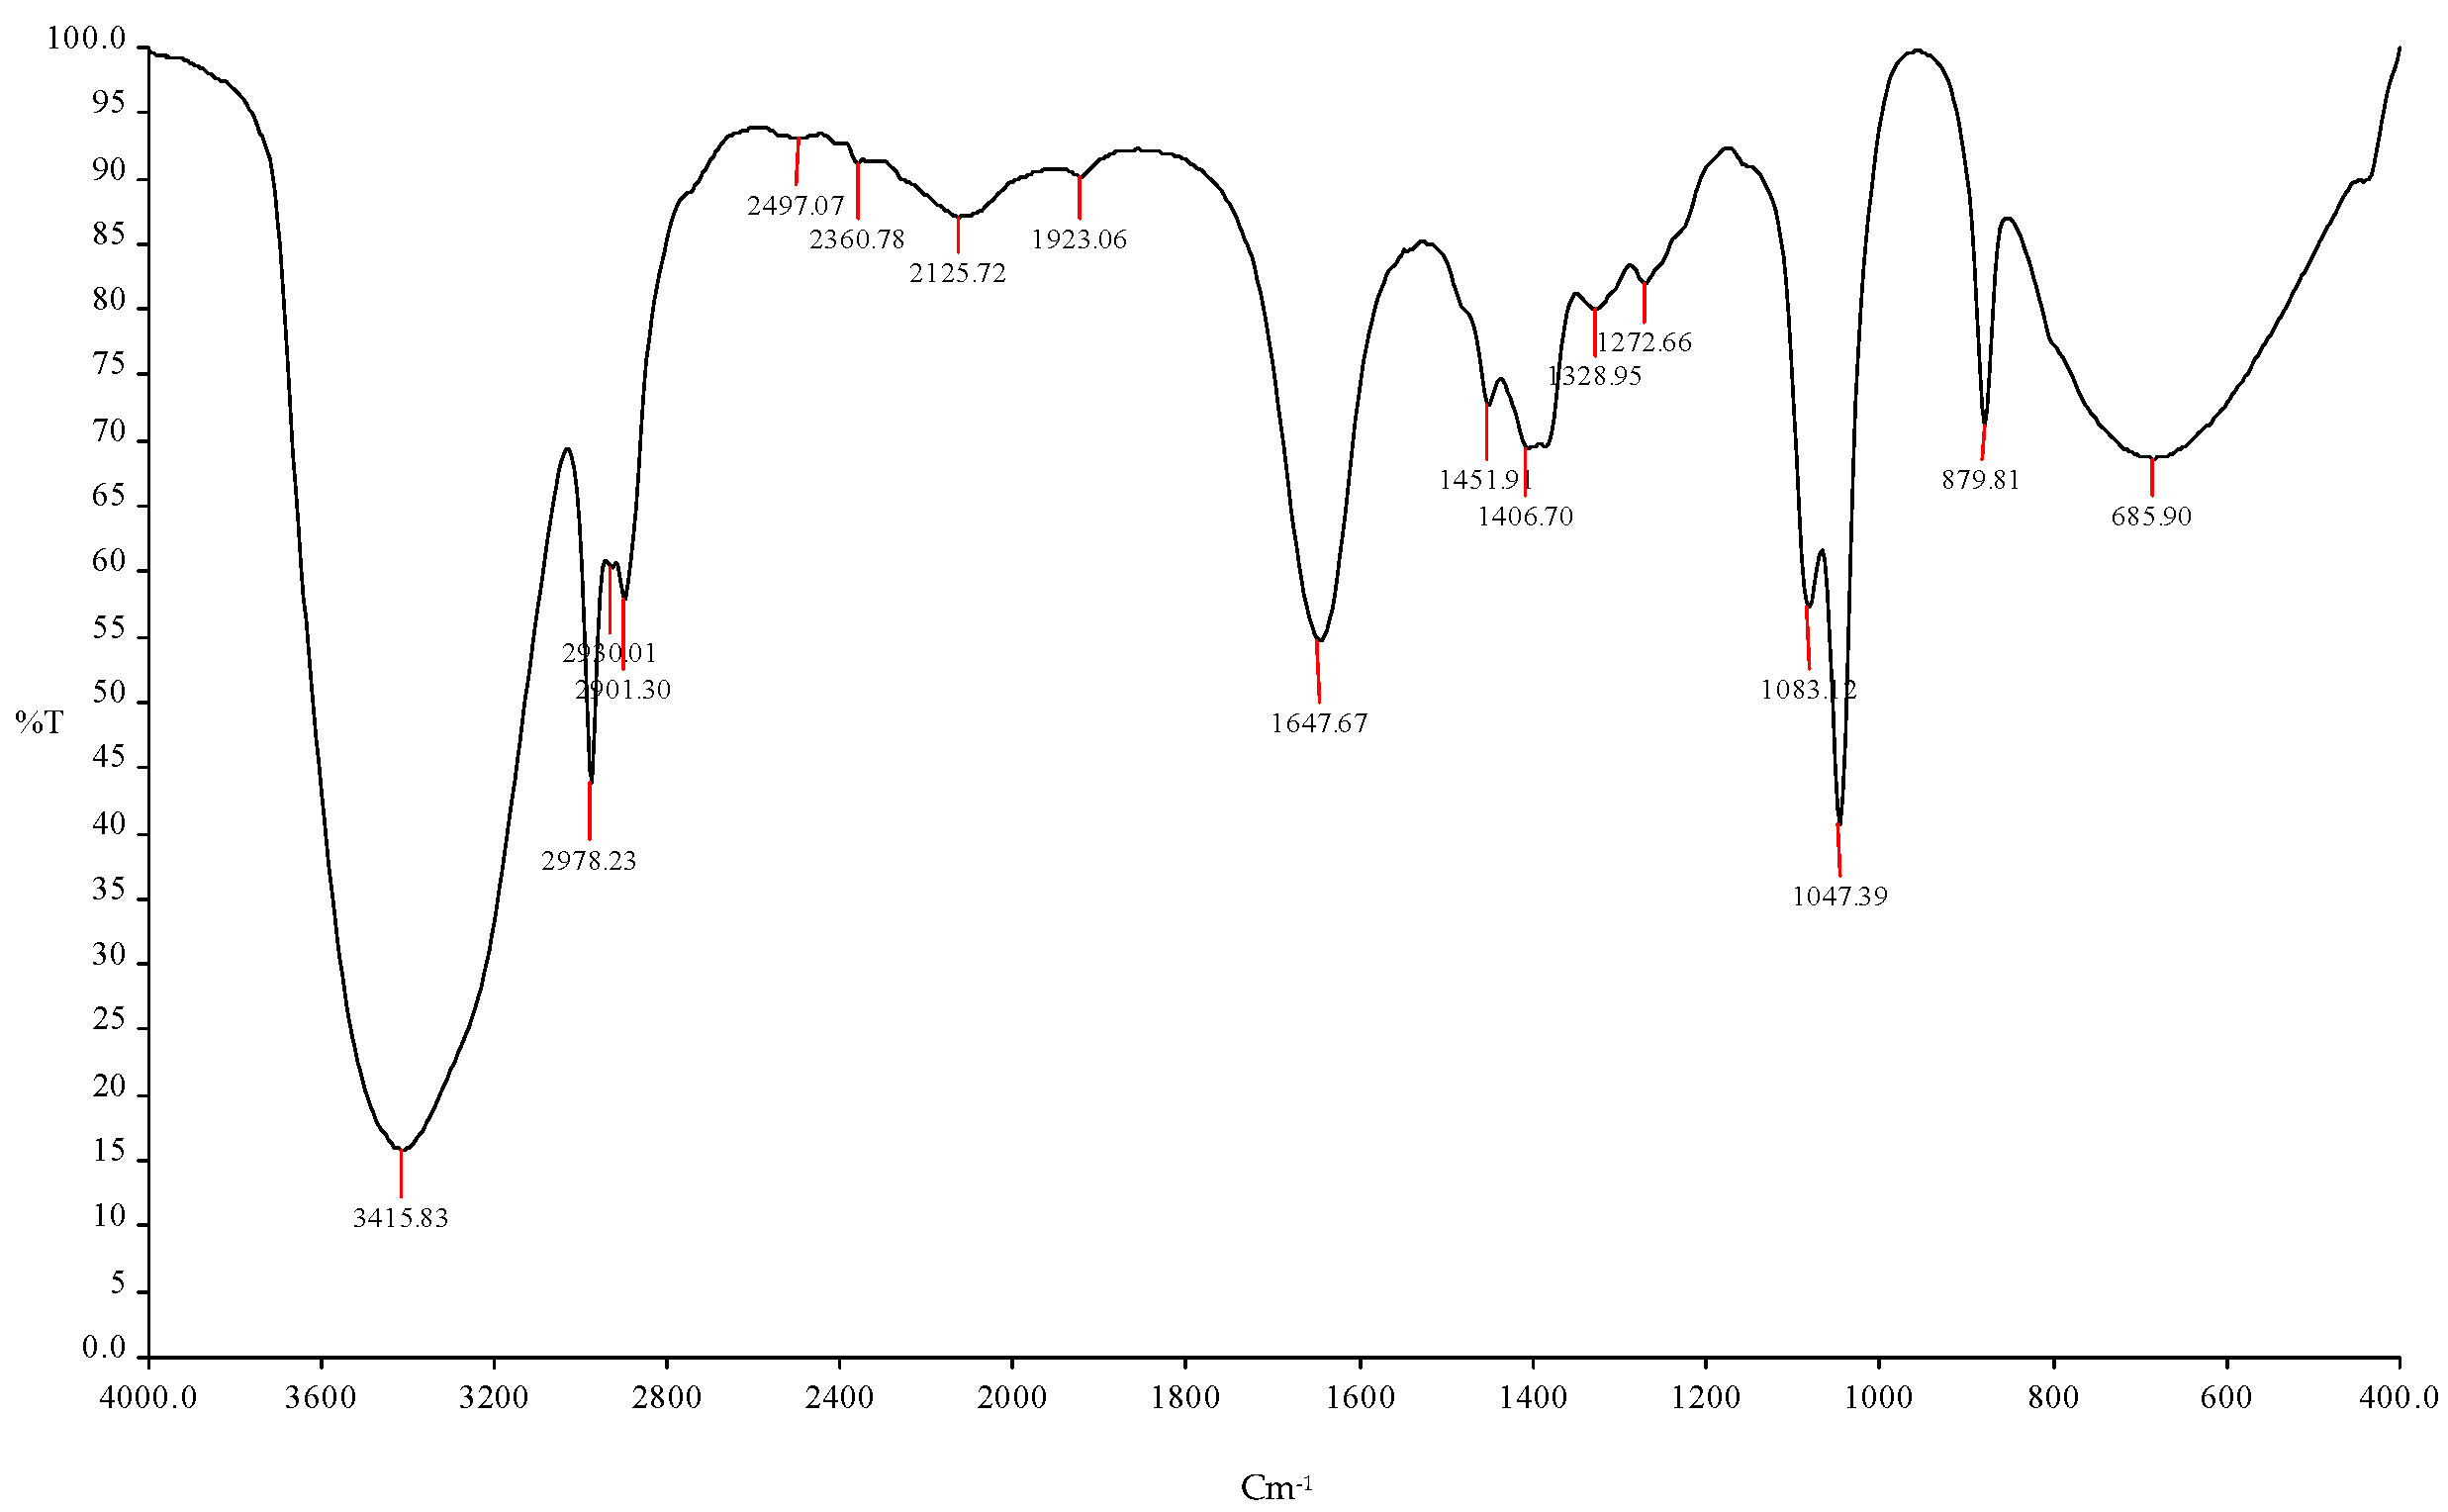
Prediction of the functional group using FTIR spectroscopy with different frequencies using ICPB1+ ICPB7 in tapioca shell + mango peel bioethanol.
Table 6.
Prediction of the functional group using FTIR spectroscopy with different frequencies using ICPB1+ ICPB7 in tapioca shell + mango peel bioethanol.
| S. No. | Frequency | Bonds | Functional Group |
|---|
| 1 | 3415.83 cm−1 | O-H | Esters |
| 2 | 2978.23 cm−1 | C-H | R-CH3 |
| 3 | 2930.01 cm−1 | C-H | R-CH3 |
| 4 | 2901.30 cm−1 | C-H | R-CH3 |
| 5 | 2497.07 cm−1 | O-H | Esters |
| 6 | 2360.78 cm−1 | C-O | Alcohols |
| 7 | 2125.72 cm−1 | C-O | Alcohols |
| 8 | 1923.06 cm−1 | C-O | Alcohols |
| 9 | 1647.67 cm−1 | C=O | Alcohols |
| 10 | 1451.91 cm−1, 1406.70 cm−1 | C=O | Aldehyde |
| 11 | 1328.95 cm−1, 1272.66 cm−1 | C-O | Alcohols |
| 12 | 1083.12 cm−1, 1047.39 cm−1 | C-H | Alkynes |
| 13. | 879.81 cm−1, 685.90 cm−1 | C=O | Amides |
Figure 5.
FTIR spectroscopy analysis showed the ethanol production using (ICPB1- E. cloacae + ICPB7- P. aeruginosa).
Figure 5.
FTIR spectroscopy analysis showed the ethanol production using (ICPB1- E. cloacae + ICPB7- P. aeruginosa).
Table 7.
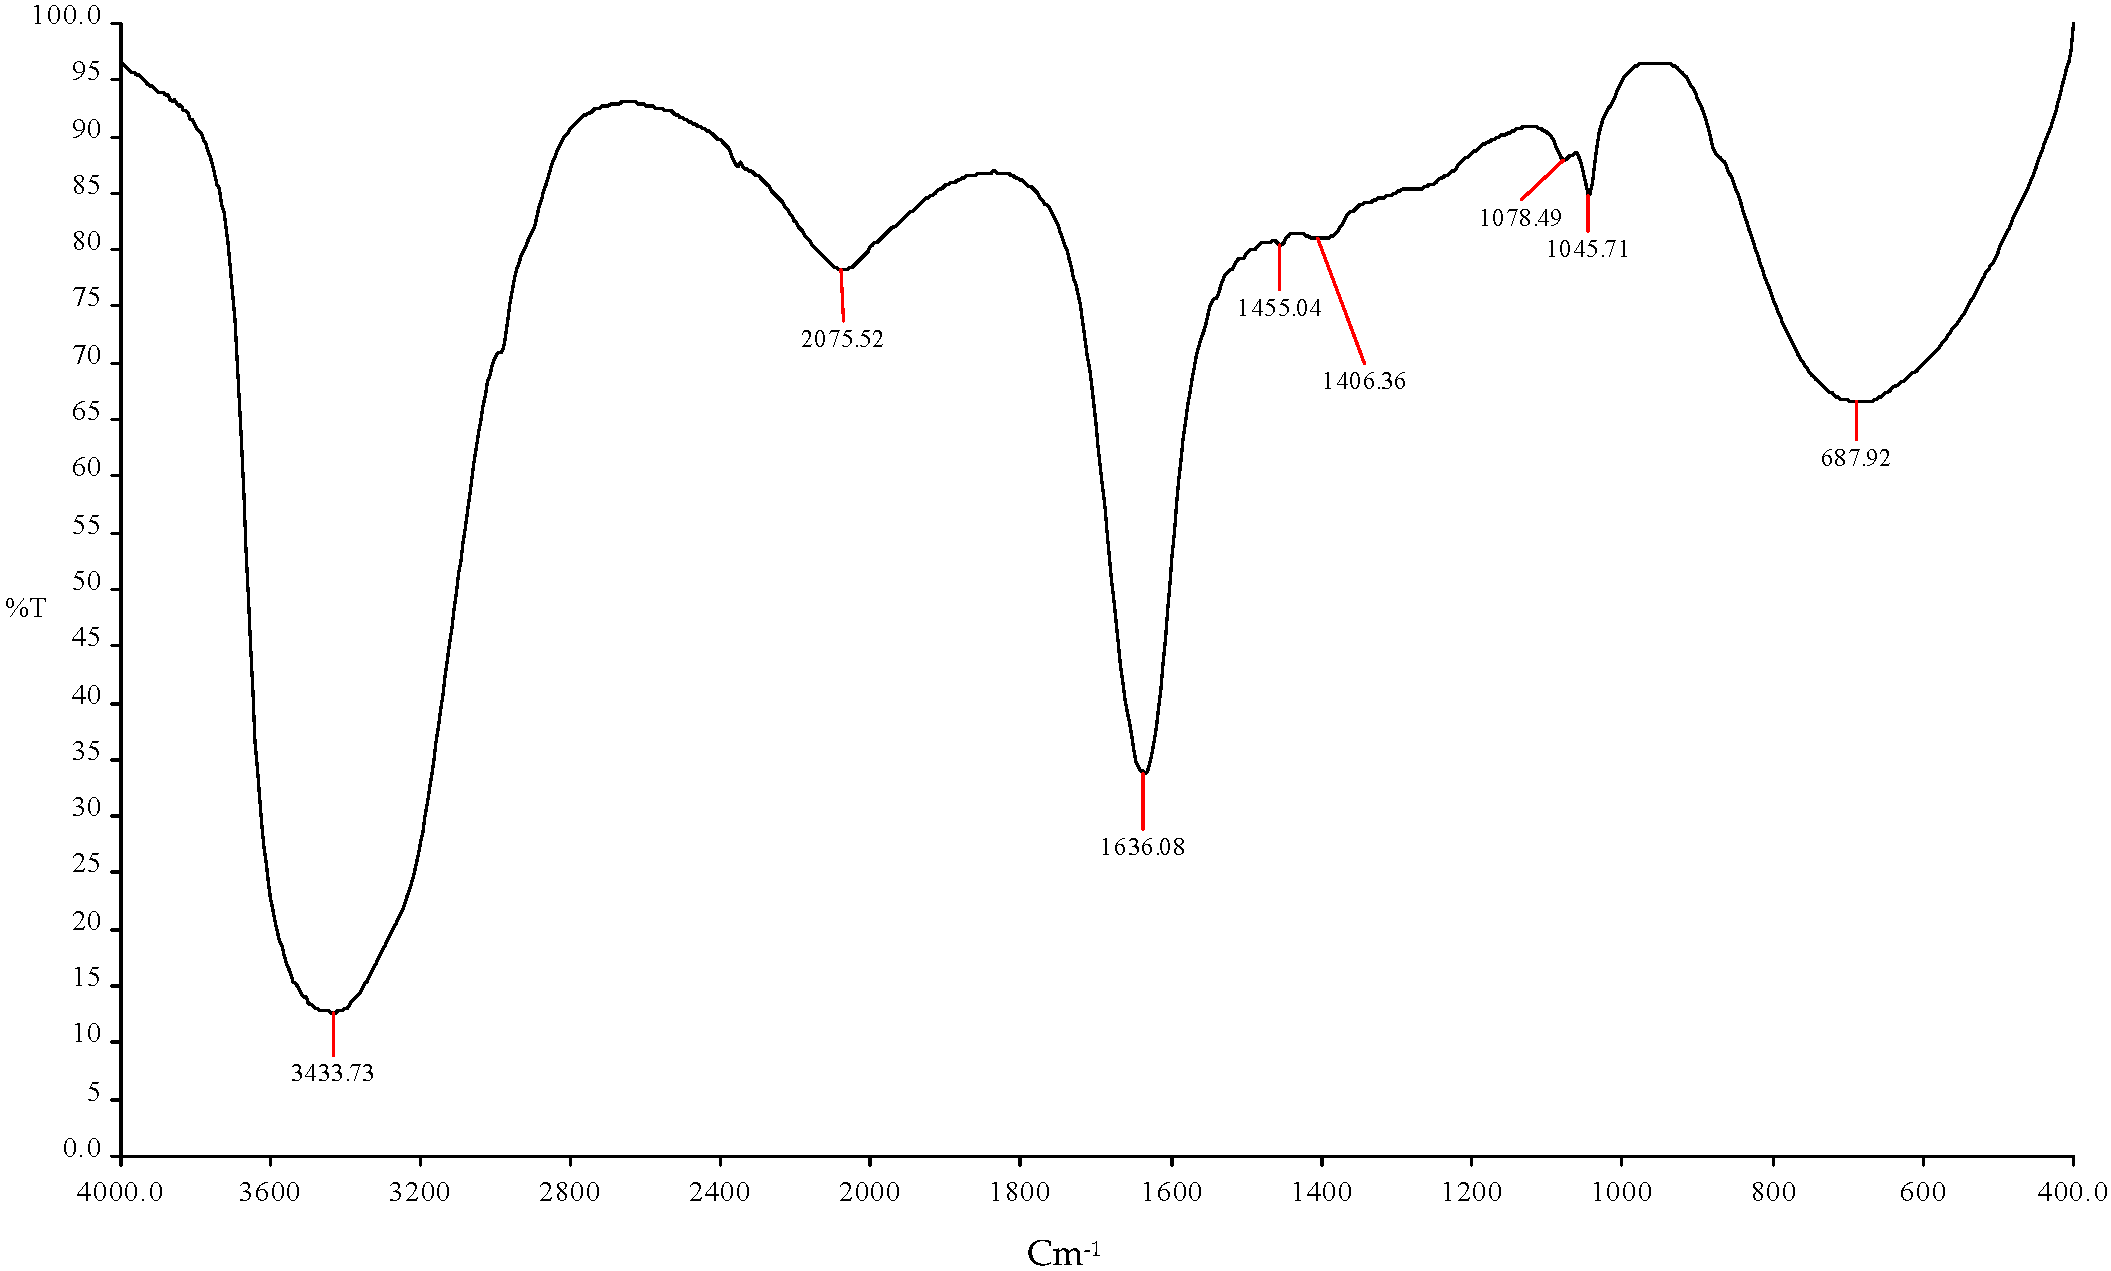
Prediction of the functional group using FTIR spectroscopy with different frequencies using the combination of ICPB7 + ICPB15 in mango peel + orange peel, bioethanol.
Table 7.
Prediction of the functional group using FTIR spectroscopy with different frequencies using the combination of ICPB7 + ICPB15 in mango peel + orange peel, bioethanol.
| S. No. | Frequency | Bonds | Functional Group |
|---|
| 1 | 3433.73 cm−1 | O-H | Esters |
| 2 | 2075.52 cm−1 | C-H | R-CH3 |
| 3 | 1636.08 cm−1 | C=O | Alcohols |
| 4 | 1455.04 cm−1 | C-H | R-CH3 |
| 5 | 1406.36 cm−1 | C-H | R-CH3 |
| 6 | 1078.49 cm−1 | C-O | Alcohols |
| 7 | 1045.71 cm−1 | C-H | Alkynes |
| 8 | 687.92 cm−1 | C=O | Amides |
Figure 6.
FTIR spectroscopy analysis showed the ethanol production using (ICPB1- E. cloacae + ICPB15- B. cereus).
Figure 6.
FTIR spectroscopy analysis showed the ethanol production using (ICPB1- E. cloacae + ICPB15- B. cereus).
Table 8.
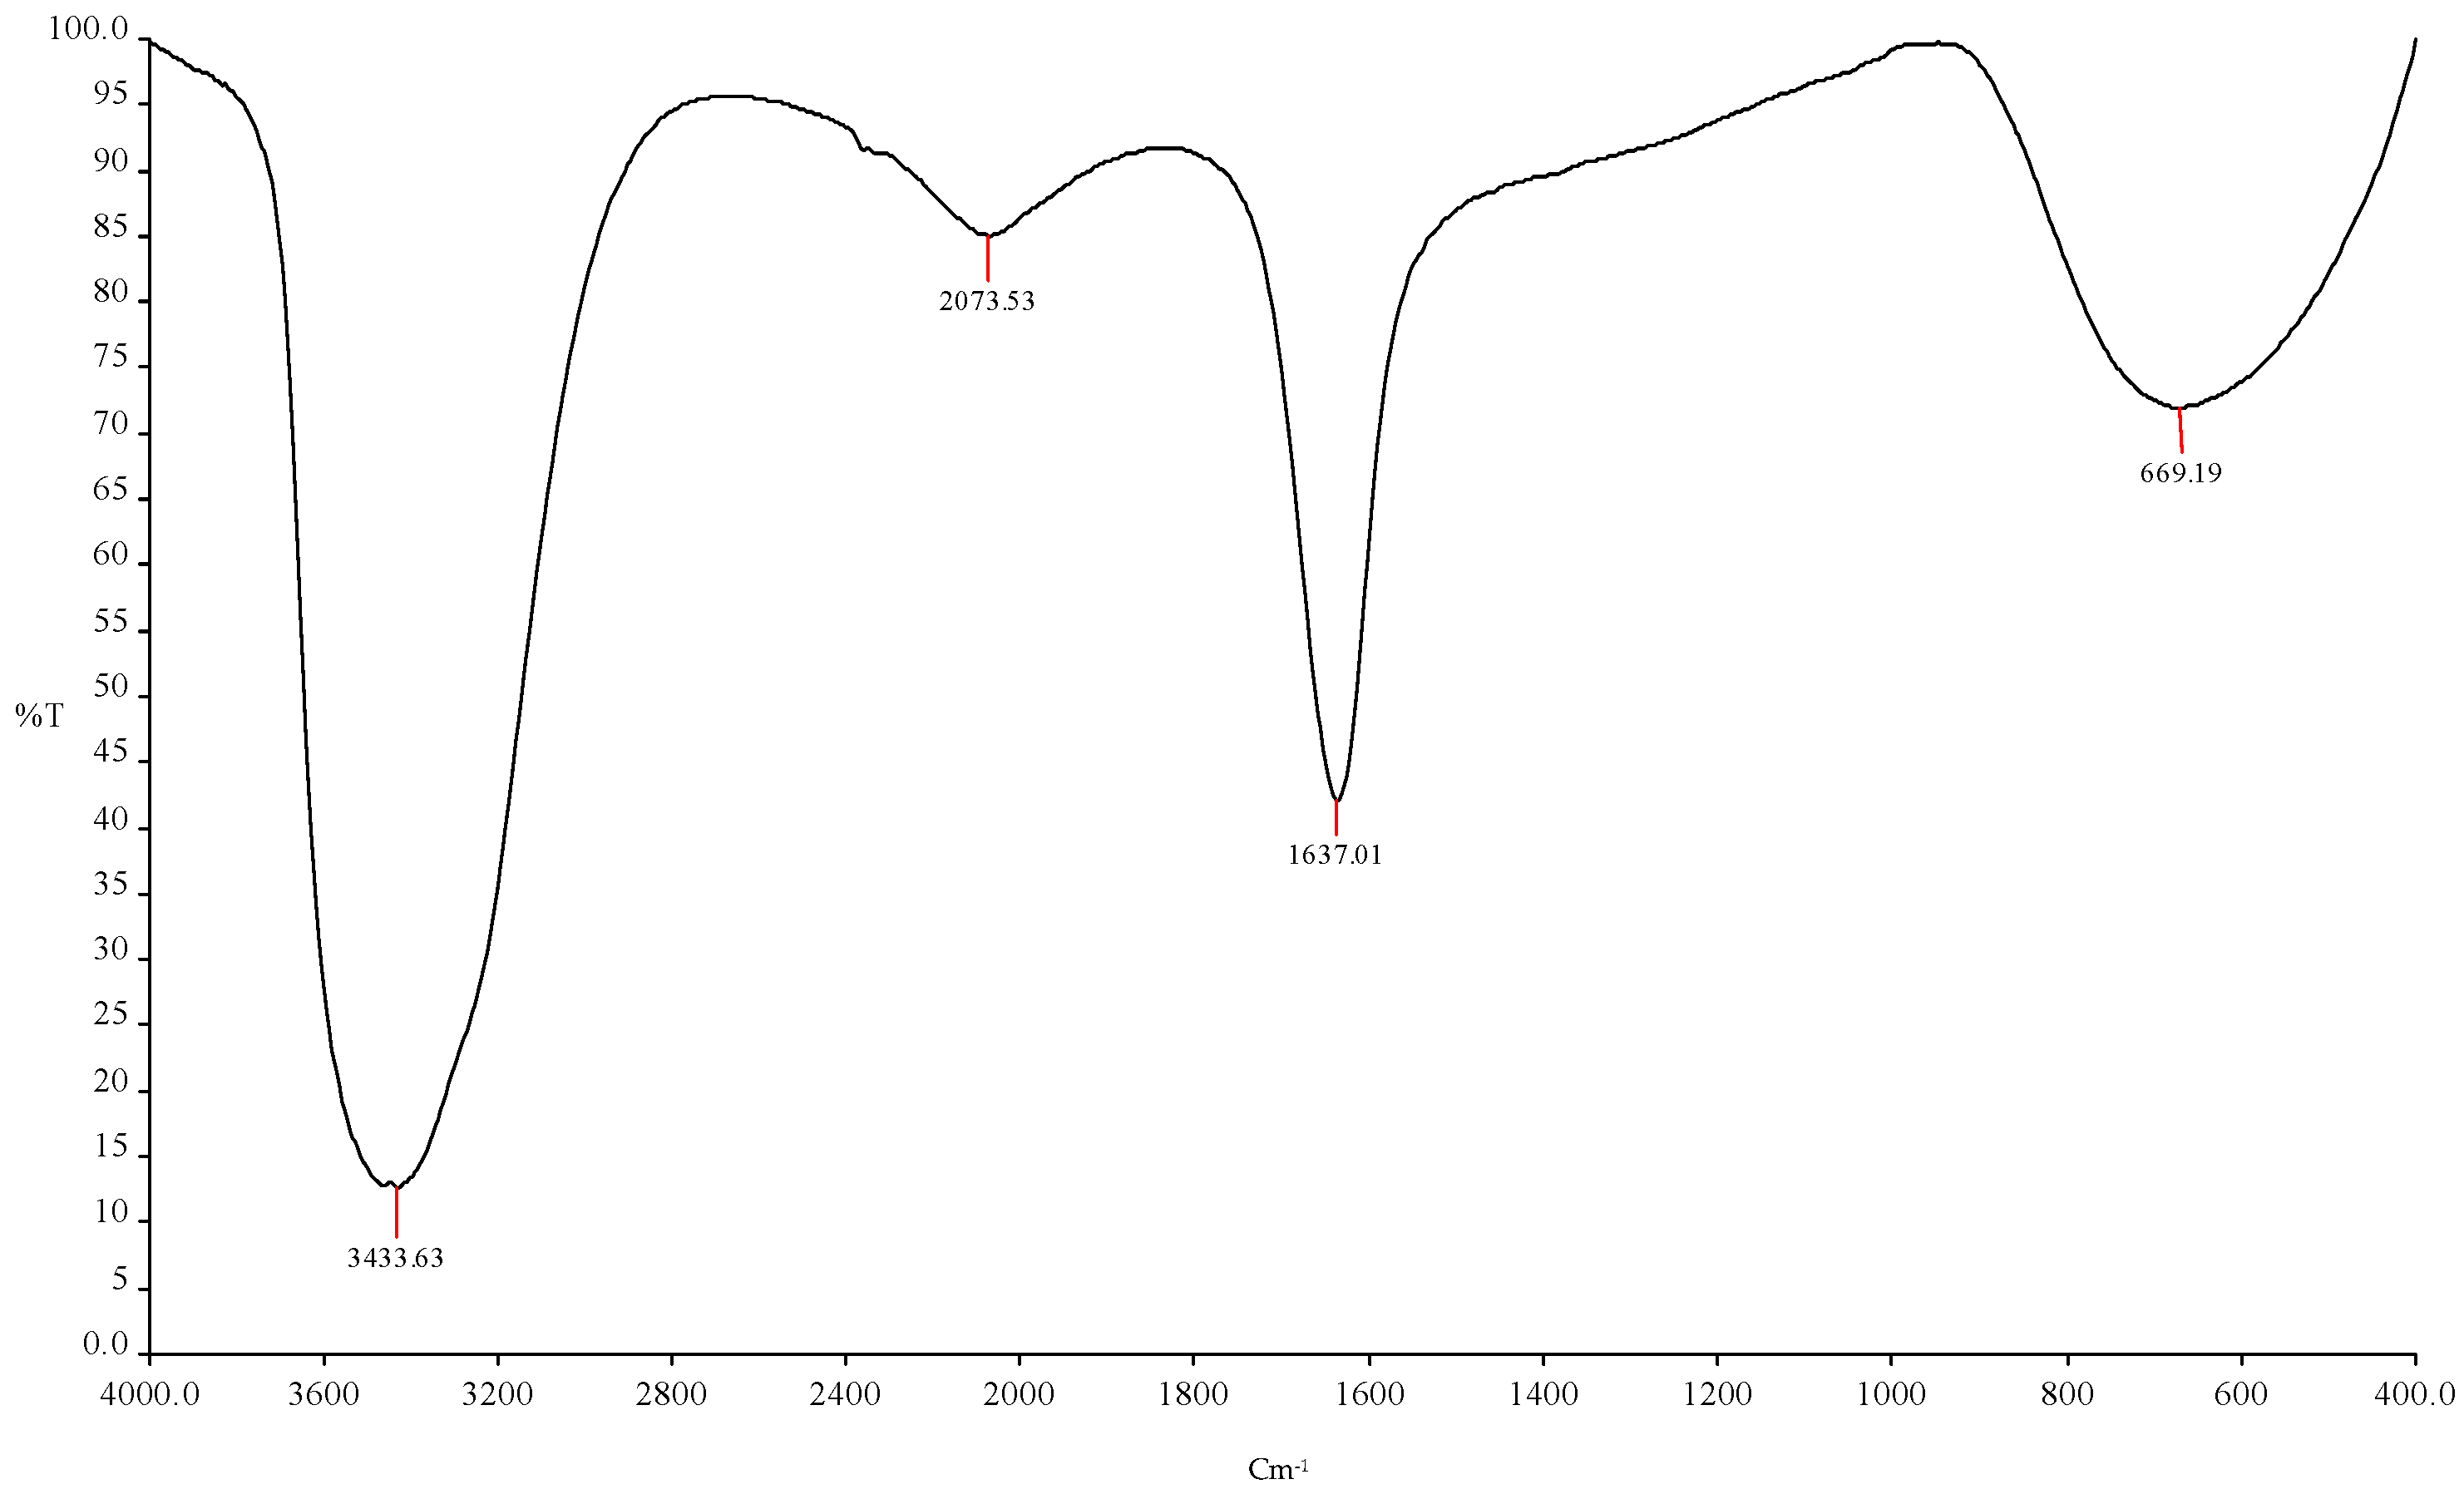
Prediction of the functional group using FTIR spectroscopy with different frequencies using the combination of ICPB1+ ICPB15 in tapioca shell + orange peel, bioethanol.
Table 8.
Prediction of the functional group using FTIR spectroscopy with different frequencies using the combination of ICPB1+ ICPB15 in tapioca shell + orange peel, bioethanol.
| S. No. | Frequency | Bonds | Functional Group |
|---|
| 1 | 3433.63 cm−1 | O-H | Esters |
| 2 | 2073.53 cm−1 | C-H | R-CH3 |
| 3 | 1637.01 cm−1 | C-O | Alcohols |
| 4 | 669.19 cm−1 | C=O | Amides |
Figure 7.
FTIR spectroscopy analysis showed the ethanol production using (ICPB7- P. aeruginosa + ICPB15- B. cereus).
Figure 7.
FTIR spectroscopy analysis showed the ethanol production using (ICPB7- P. aeruginosa + ICPB15- B. cereus).
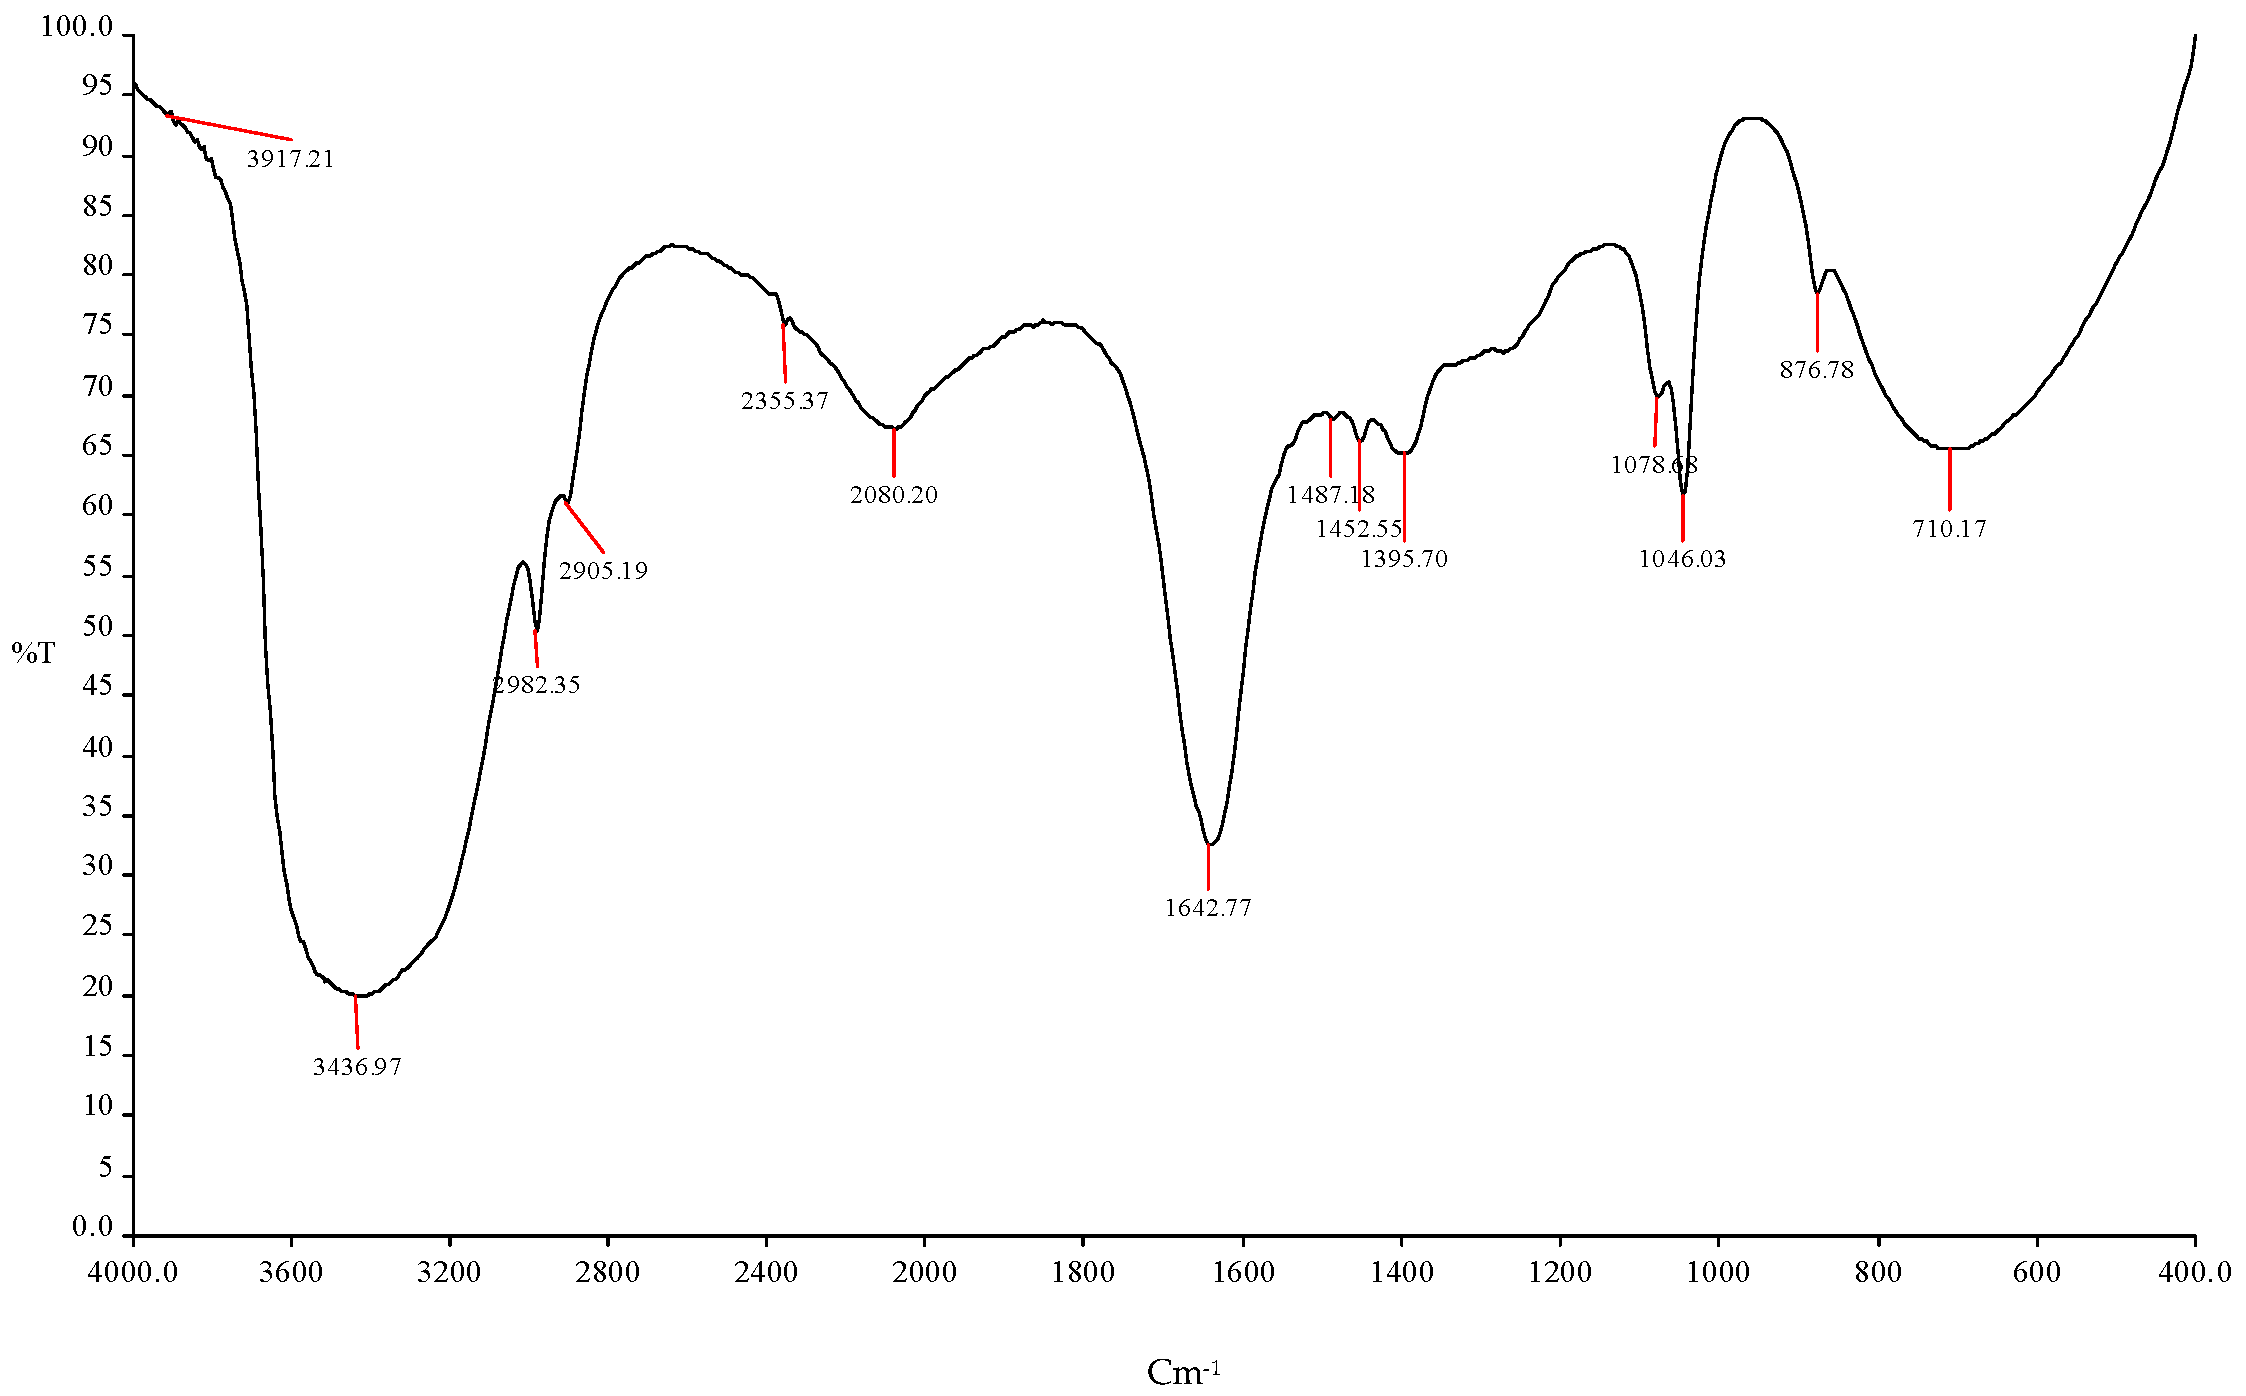
Table 9.
Prediction of the functional group using FTIR spectroscopy with different frequencies using the combination of ICPB1 + ICPB7 + ICPB15 in tapioca shell + mango peel + orange peel) bioethanol.
Table 9.
Prediction of the functional group using FTIR spectroscopy with different frequencies using the combination of ICPB1 + ICPB7 + ICPB15 in tapioca shell + mango peel + orange peel) bioethanol.
| S. No. | Frequency | Bonds | Functional Group |
|---|
| 1 | 3917.21 cm−1 | O-H | Esters |
| 2 | 3436.97 cm−1 | O-H | -COOH |
| 3 | 2982.35 cm−1 | C-H | R-CH3 |
| 4 | 2905 cm−1, 2355.37 cm−1, 2080.20 cm−1 | C-H | R-CH3 |
| 5 | 1642.77 cm−1 | C=O | Alcohols |
| 6 | 1487.18 cm−1 | C-H | R-CH3 |
| 7 | 1452.55 cm−1, 1395.70 cm−1 | C-H | R-CH3 |
| 8 | 1078.08 cm−1 | C-O | Alcohols |
| 9 | 1046.03 cm−1 | C-H | Alkynes |
| 10 | 876.78 cm−1, 710.17 cm−1 | C=O | Amides |
Figure 8.
FTIR spectroscopy analysis showed the ethanol production using (ICPB1- E. cloacae + ICPB7- P. aeruginosa + ICPB15- B. cereus).
Figure 8.
FTIR spectroscopy analysis showed the ethanol production using (ICPB1- E. cloacae + ICPB7- P. aeruginosa + ICPB15- B. cereus).

 ,
, 


