Article

Effects of Temperature Shifts on Microbial Communities and Biogas Production: An In-Depth Comparison

by
Gede Adi Wiguna Sudiartha
1,2,
Tsuyoshi Imai
1,*,
Chonticha Mamimin
3 and
Alissara Reungsang
3,4,5
1
Graduate School of Sciences and Technology for Innovation, Yamaguchi University, Yamaguchi 755-8611, Japan
2
Environmental Engineering Study Program, Faculty of Engineering, Udayana University, Bali 80361, Indonesia
3
Department of Biotechnology, Faculty of Technology, Khon Kaen University, Khon Kaen 40002, Thailand
4
Research Group for Development of Microbial Hydrogen Production Process, Khon Kaen University, Khon Kaen 40002, Thailand
5
Academy of Science, Royal Society of Thailand, Bangkok 10300, Thailand
*
Author to whom correspondence should be addressed.
Fermentation 2023, 9(7), 642; https://doi.org/10.3390/fermentation9070642
Submission received: 13 June 2023 / Revised: 5 July 2023 / Accepted: 7 July 2023 / Published: 8 July 2023
(This article belongs to the Special Issue Anaerobic Digestion: Waste to Energy)

Abstract

:
Temperature plays a significant role in anaerobic digestion (AD) as it affects the microbial communities and ultimately controls the efficiency of the process. Few studies have looked at temperature-adjusted AD, but it is unclear how the temperature shifts affect biogas production and the dynamics of microorganisms involved in methanogenesis. This study tested two temperature shift scenarios in fed-batch mode using anaerobically digested sewage sludge and glucose-based substrate. The first scenario was acclimatized to upshifting temperatures from 42 °C to 48 °C while the second was acclimatized to downshifting temperatures from 55 °C to 45 °C. Both temperature shift scenarios resulted in a decrease in biogas production, especially at 45 °C. The upshifted scenario experienced a maximum decrease of 83%, and the downshifted scenario experienced a 16–33% decrease in methane production. Next-generation 16S rRNA sequencing revealed the domination of Methanoculleus in the upshifted scenario. However, a low correlation between the number of Methanoculleus and the other hydrogenotrophic methanogens to biogas production indicates inhibition in the hydrogenotrophic pathway. The downshifted scenario showed better biogas production due to the substantial domination of acetoclastic Methanosaeta and the low abundance of sulfate-reducing bacteria. Hence, the temperature shift affects the microbial communities, significantly affecting biogas production performance.

1. Introduction

The two critical issues with global sustainable development are the escalating energy crisis and environmental degradation. Anaerobic digestion (AD) is a successful strategy that can produce bioenergy and bio-fertilizer from a wide array of residual biomass (such as sewage sludge, anaerobic sludge, agriculture waste, and food waste) to tackle those issues. A few examples of products that can be recovered through this process are volatile fatty acids (VFAs) and biogas, which typically consist of methane (CH4) (50–70%), carbon dioxide (CO2) (30–50%), and other compounds, such as hydrogen sulfide and ammonia [1]. It is also cost-effective and environmentally friendly for waste disposal, requiring less energy input or carbon footprint than landfilling and incineration, which both significantly aided in achieving carbon neutrality [2,3]. In general, CH4 synthesis from AD often relies on the involvement of physiologicaly various microorganisms involved in hydrolysis, acidogenesis, acetogenesis, and methanogenesis [4]. In order to generate methane, acetate, H2, and CO2 are the primary components, with two main methanogenic pathways: the acetoclastic and the hydrogenotrophic pathways [5]. Acetoclastic methanogens utilize acetate, while hydrogenotrophic methanogens use H2 and CO2 to produce CH4. The acetoclastic pathway is strictly regulated by Methanosarcinaceae spp. and Methanosaetaceae spp. In contrast, the hydrogenotrophic pathway is mainly driven by Methanomicrobiales spp., Methanobacteriales spp., Methanococcales spp., Methanopyrales spp., and Methanocellales spp. [6,7].
The AD process is vulnerable to perturbation from variations in operational or environmental parameters, such as pH, temperature, organic loading rate (OLR), and hydraulic retention time (HRT), which could disturb the balance of interaction among AD microorganisms and lead to poor reactor performance [4,8]. Among those parameters, the temperature is an essential parameter that heavily influences the metabolic activity of the microbial community involved in methanogenesis and subsequently determines the stability of the community [9]. According to Madigou et al. [10], temperature changes can have a substantial impact on microbial populations and the performance of AD. Previous studies have reported that the different temperature levels inflicted the population imbalance between acidogenic and methanogenic communities, which led to the instability of the output of the AD process [11,12]. Beale et al. [13] experienced a drop in biogas production due to significant microbial competition after increasing the temperature from 32 °C to 45 °C. Chen et al. [14] demonstrated the different behavior of microbial communities in different methanogenesis phases. The researchers found that the microbial communities involved in hydrolysis were more susceptible to temperature conditions. In contrast, the microbial communities showed more stability in the rest of the AD process. However, despite the known influence of temperature and the breadth of study on the topic, it is still unclear how dynamic temperature changes affect the AD process, especially regarding the temperature adaptability (thermotolerance) of microorganisms involved in the AD process.
The AD system is typically operated at three optimal temperature ranges: psychrophilic (20 °C) [15], mesophilic (20–43 °C), with optimum temperatures around 35–37 °C [16], and thermophilic (50–60 °C) [10,16]. Most commercial-scale AD systems frequently employ mesophilic and thermophilic temperatures with maximum CH4 production varying around 0.03–0.65 L/g volatile solid (VS)/day and 0.04–0.70 L/g-VS/day, respectively [9,17]. However, despite the extensive studies in these conventional temperature scenarios, there are still many challenges regarding operational practices in these temperature AD processes. For example, there is little consideration given to the range of temperatures between mesophilic and thermophilic (40–55 °C) in practice and limited understanding of the microorganisms present in this range and their ability to adapt to both mesophilic and thermophilic conditions. Furthermore, previous research in AD primarily focused on biogas production under stable temperature conditions for each reactor (with pre-treatment conditions [18]) to reduce the potential of instability in microbial communities which was the “black box” for the AD process [19]. In some cases, preserving stable temperatures in the reactor during AD would involve substantial energy in a large-scale wastewater treatment plant (WWTP), increasing operating costs, particularly in four-seasoned nations [7].
To date, few researchers worked on temperature-adjusted AD [20]. However, the effect of each temperature change on biogas production and the dynamics of methanogenesis-related bacteria have not been presented. Furthermore, to our knowledge, the full extent of microbial populations and their interactions in AD has not been fully explored due to the complexity of microbial networking. Improving our understanding of the essential ecological niches in this process and the metabolic characteristics of the microbial populations that inhabit them could aid in developing novel process designs and operational techniques for enhancing the recovery of CH4 from organic waste. This issue served as the impetus for the current work, which concentrated on investigating the fluctuation of biogas production and understanding the interconnection between microbial communities under several temperature shifts while at the same time designing active microbial communities by adjusting the operating temperature.
Therefore, the main objectives of this study were to determine the impact of two temperature shift scenarios (upshifted and downshifted) on biogas production and to demonstrate their effects on microbial compositions. Results led to a broader understanding of the behavior of microorganisms during temperature changes in methanogenesis.

2. Materials and Methods

2.1. Inoculum and Substrates

Anaerobically digested sludge from the Eastern Ube Wastewater Treatment Plant, Ube City, Yamaguchi Prefecture, Japan, was used as the inoculum source. The properties of the inoculum are presented in Table 1. This study used a glucose-based substrate containing 100 g/L glucose as the carbon source for biogas generation. The substrate solution was added to the inoculum samples before they were incubated and cultured at upshifted and downshifted temperatures. The glucose was mixed with the following essential nutrients required for bacterial growth (all in g/L): 4 NaHCO3, 4 K2HPO4, 0.1 yeast extract, 85 NH4Cl, 81 MgCl2∙6H2O, 75 KCl, 350 (NH4)2HPO4, 42 FeCl3∙6H2O, 25 MgSO4∙7H2O, 1.8 CoCl2∙6H2O, and 150 CaCl2∙2H2O [21].

2.2. Experimental Setup

Serum vials with a capacity of 160 mL and 72 mL of working volume were used in a fed-batch mode to produce methane [8]. First, 2 mL of substrate and 70 mL of sludge were added to the serum bottles. Then, they were flushed with nitrogen gas to remove any remaining oxygen to create anaerobic conditions and were covered with aluminum covers and butyl rubber stoppers. This study was subsequently divided into two scenarios, i.e., (a) upshifted and (b) downshifted temperature scenarios with various conditions. For the upshifted temperature scenario, the serum vial was initially incubated at 42 °C with shaking at 50 rpm in a shaking incubator (BT 101 and BT 300; Yamato Scientific Co., Ltd., Tokyo, Japan) for self-fermentation to allow microbial communities to acclimatize appropriately and eliminate recalcitrant organic contaminants that had remained during the transition from the wastewater treatment plant (WWTP) to the laboratory for 1 month [22]. Self-fermentation has been widely performed by previous studies to undergo initial acclimatization process and establish a sustainable anaerobic condition inside the vials [23,24,25,26].
For the downshifted temperature scenario, the self-fermentation was conducted at 55 °C. Upon self-fermentation process, 2 mL of glucose-based substrate solution with a glucose concentration of 100 g/L was regularly injected into the vial everytime biogas production, showing a considerable decline for both temperature shifts scenario. Finally, the serum vials were treated in three sets of temperature conditions. For the upshifted scenario, the temperature was increased from 42 °C to 45 °C and finally to 48 °C. With the similar pattern, the downshifted scenario was initially incubated at 55 °C, and then the temperature decreased to 48 °C and finally to 45 °C. The datasets, such as biogas production and microbial communities, obtained from each temperature condition were labeled as described in Table 2. For each temperature shift, the incubation period was 100 days.

2.3. Data Collection and Analysis

The total gas volume and composition were monitored regularly during the incubation period using gas chromatography. The volume of biogas generated was measured using a glass syringe. Gas chromatography (GC-8APT/TCD; Shimadzu Corp., Kyoto, Japan) with a 60/80 activated charcoal mesh column (1.5 m × 3.0 mm internal diameter) and argon as the carrier gas was used to analyze the gas composition of the samples, such as H2, N2, CH4, and CO2. During operation, the injector, column, and detector temperatures were set to 50 °C, 60 °C, and 50 °C, respectively. The biogas production was standardized to STP conditions (273.15 K, 101.325 kPa).

2.4. NGS and Microbial Diversity Analysis

As much as 1.5 mL of DNA samples was taken following the shifts in temperature. DNA was isolated using the NucleoSpin® kit according to the NucleoSpin® Soil Manual. After extraction, the DNA samples were sent to the Faculty of Medicine, Yamaguchi University, Yamaguchi, Japan, for 16S rRNA using NGS analysis. Notably, using these approaches, the genome (all 3 billion base pairs), all coding genes (exome; 1% of the genome or 30 million base pairs—that is, 20,000 genes made of 180,000 exons), all RNA produced from genes (transcriptome), and any subset of these can be sequenced [7]. Methanogen diversity analysis was performed to determine any changes in methanogen populations during AD under shifted temperature conditions using the Shannon Diversity Index, Simpson’s Index, and Inverse Simpson’s Index with R studio. Statistical significance was determined using Principal Component Analysis (PCA) with correlation matrix analysis. The heatmap was analyzed using MeV 4.9.0. The other data analysis was accomplished using OriginPro 2022 version.

3. Results

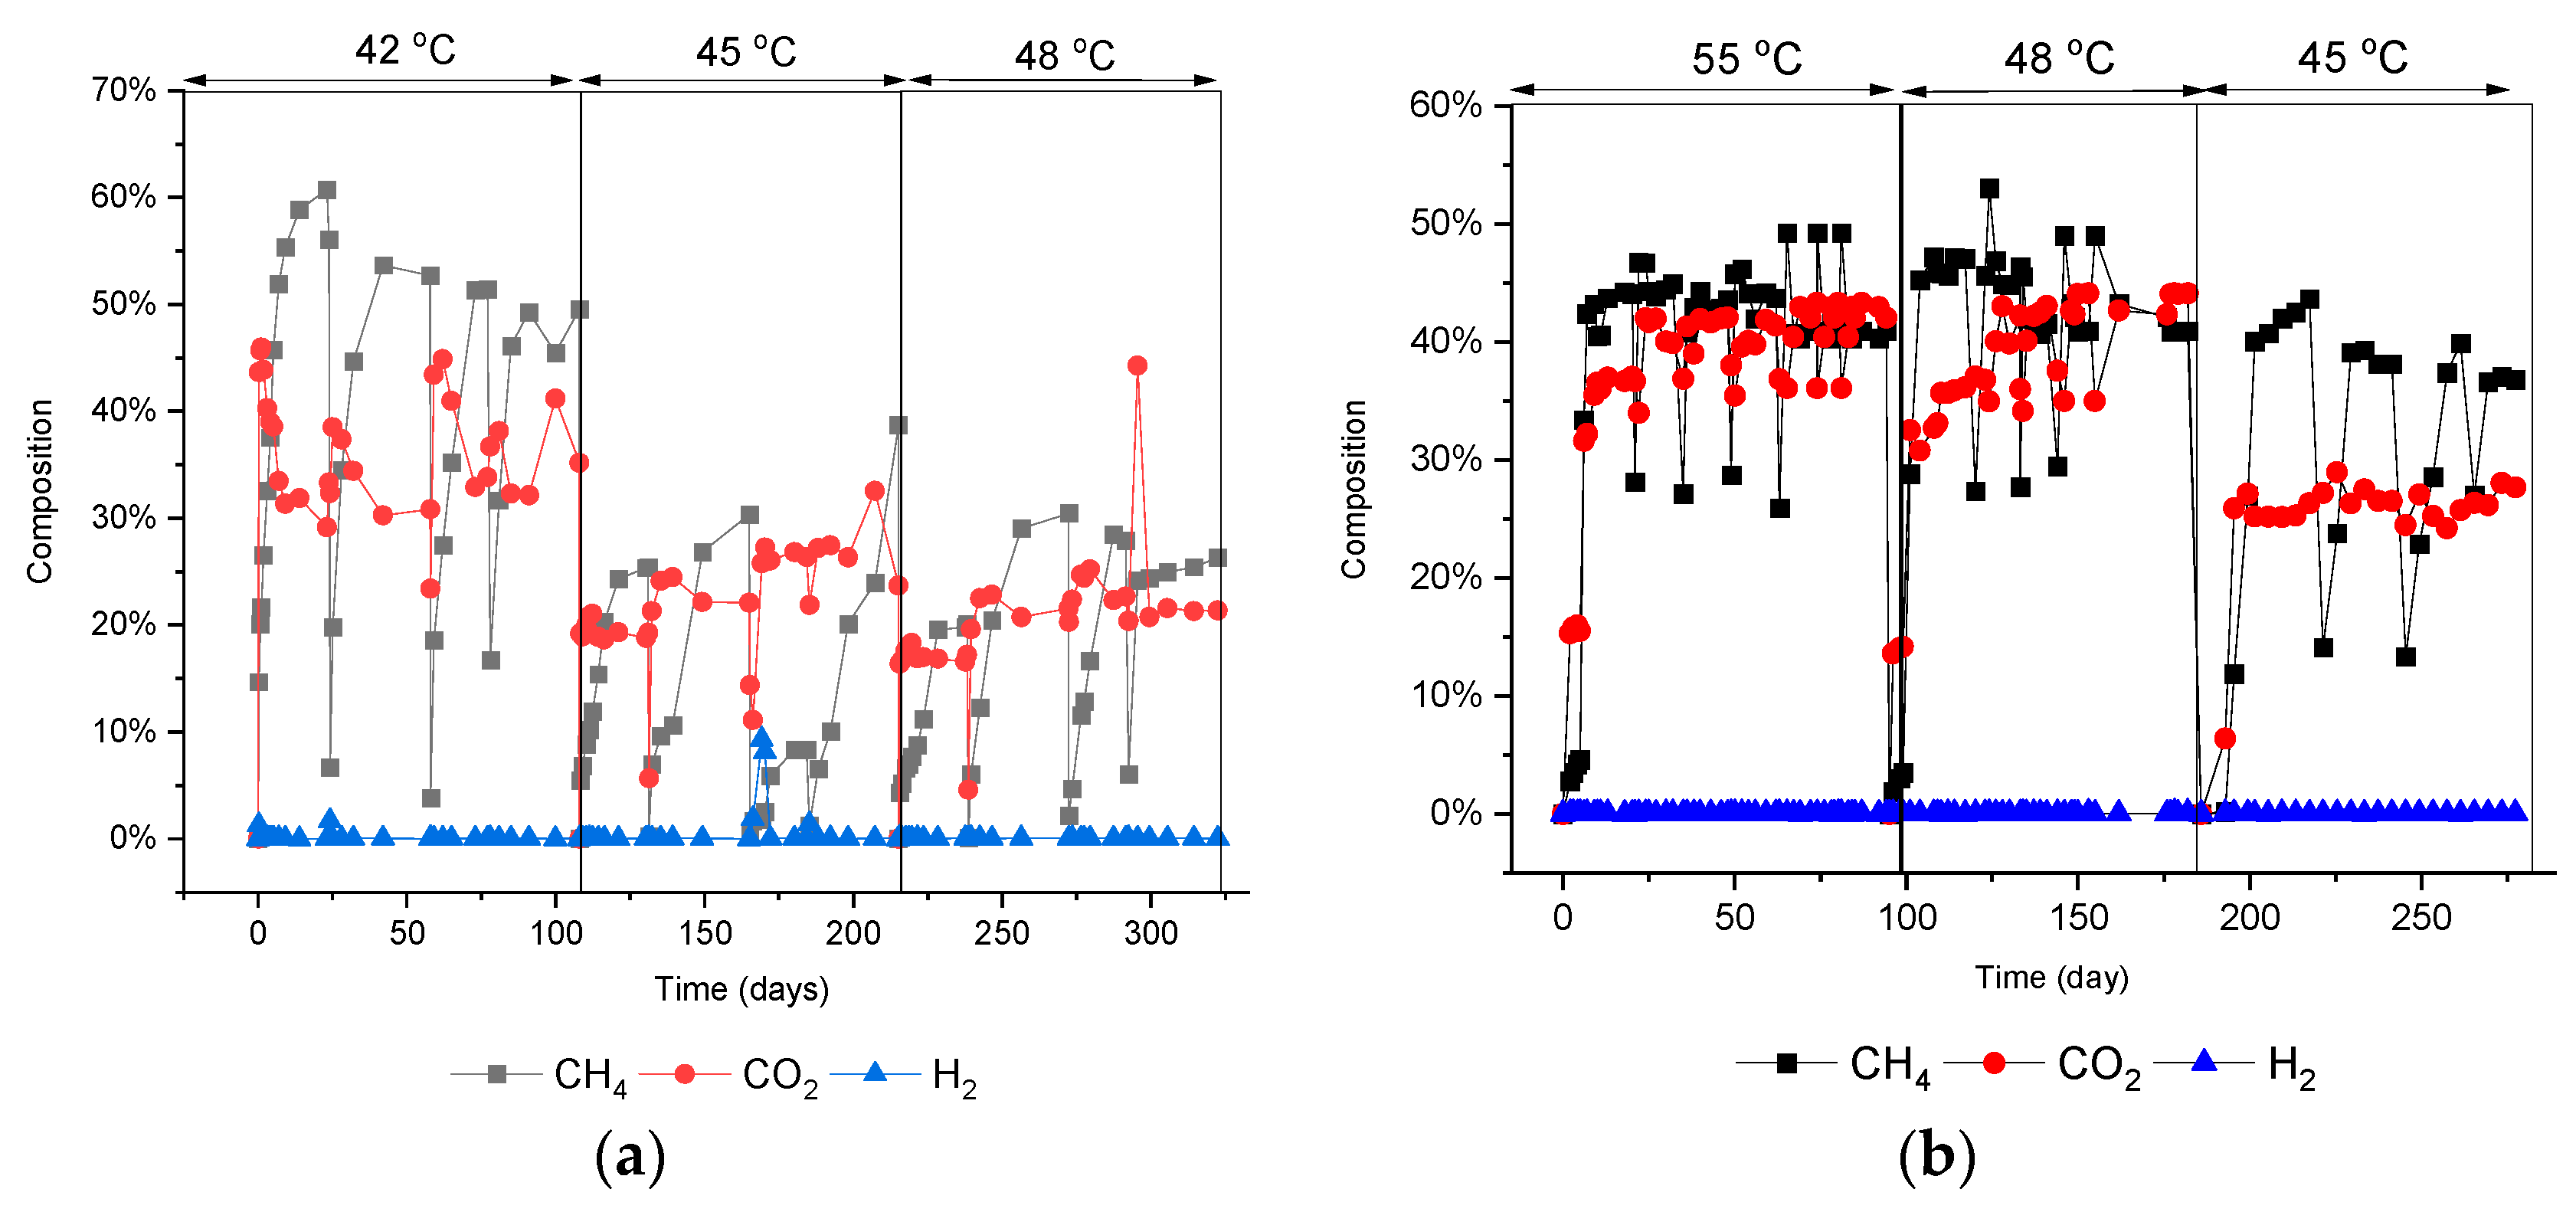
3.1. Biogas Production during Temperature Shifts

The cumulative biogas production during the temperature shift in AD is shown in Figure 1. Each vial was incubated for 100 days, as the AD process to convert sewage sludge into biogas involves several metabolic pathways, including hydrolysis, acetogenesis, acidogenesis, and methanogenesis. Previous research has proposed incubation periods of 21 days [27,28,29]. However, in the case of temperature shift conditions, a more extended operating period is preferable, allowing microorganisms to acclimatize to harsh conditions and achieve more stable operation [30,31,32]. After start-up, in the upshifted temperature scenario, the performance of the vial at 42 °C showed better biogas yield compared to those after upshifted to 45 °C and 48 °C. The vial yielded 0.184 L CH4/g COD and 0.189 L CO2/g COD. There was a roughly 77% decline in CO2 and 83% decline in CH4 production after the temperature shifted from 42 °C to 45 °C. As seen in Figure 1a, the cumulative biogas yield at 45 °C decreased to 0.036 L CH4/g COD and 0.058 L CO2/g COD at the end of the incubation period. The decline in biogas production is also confirmed by the decline in cumulative biogas yield from producing 4.8 Lbiogas/Lvial at 42 °C to 1.26 Lbiogas/Lvial at 45 °C presented in Figure 1b. However, there was no significant difference in CH4 and CO2 production after the increased temperature to 48 °C. CH4 production showed a slight increase of 33% to 0.05 L CH4/g COD, while CO2 emissions increased to 0.074 L CH4/g COD in U48 during the 100 day incubation period.
In contrast, the downshifted temperature scenario showed a more stable biogas production in the first temperature shift. As shown in Figure 1c, the vial produces 0.19 L CH4/g COD and 0.189 L CO2/g COD at 55 °C, from which after a temperature shift to 48 °C, the biogas production decreases 16% to the level of 0.16 L CH4/g COD and 0.15 L CO2/g COD. Despite the lower biogas production, incubation at 48 °C yields more CH4 than CO2, indicating potential CH4 production from hydrogenotrophic pathways where the methanogens convert CO2 to CH4 by using H2 as an electron donor. However, after further temperature downshift to 45 °C, biogas production outpaced the performances at 48 °C and 55 °C. When incubated at 45 °C, the vial generated 0.123 L CH4/g COD and 0.136 L CO2/g COD, 30% lower than that produced on 55 °C and 48 °C vials. The downturn of the biogas production at 45 °C was also confirmed by the diminishing volume of biogas yield per vial volume, as shown in Figure 1d.
The anomalies in CH4 and CO2 production were also confirmed by the gradual changes in the biogas composition with temperature shifts. As can be seen in Figure 2a, the CH4 and CO2 contents produced at 42 °C fluctuated within the ranges 4–61% and 23–46%, respectively, and then decreased significantly along with the temperature shift to 45 °C in which the CH4 and CO2 contents varied within the ranges 0–30% and 6–24%, respectively. Interestingly, at 45 °C, there is a modest spike in H2 composition to 8–9%, followed by increasing H2 production (Figure 1a), signifying the potential absence of hydrogenotrophic methanogen activity, which consumed CO2 and H2 to produce CH4. High CO2 and H2 in the AD process indicate that the CH4 was primarily produced from acetate via acetoclastic pathways. After the temperature was further shifted to 48 °C, other than a sharp decline in H2 production, there was no noticeable difference in biogas composition.
Meanwhile, in the downshifted temperature scenario, as Figure 2b illustrated, a stable biogas composition was generated from the vial, especially during incubation at 55 °C and 48 °C. The vial consistently yielded around 30–53% CH4 and 30–44% CO2 over time. However, at 45 °C, the CH4 and CO2 composition fluctuated in a broader range below 50% and could not recover during the 100 day incubation periods. In the downshift scenario, no detectable level of H2 was produced, which denotes that the CH4 production was mainly conducted in an acetoclastic pathway.

3.2. Microbial Response on the Temperature Shift Conditions

To understand the influence of the temperature shifts on microbial community, the alpha diversity analysis was performed on each vial using the Shannon Diversity Index, Simpson’s Index, and Inverse Simpson’s Index. The diversity index has been used in several earlier studies to analyze microbial communities’ abundance at various temperatures to understand better how the communities responded to temperature changes [7,33,34]. As shown by Figure 3a, all three diversity indexes in the upshifted temperature scenario show the highest diversity score at U45 despite the significant downfall of biogas production. Meanwhile, both Shannon’s and Simpson’s indices display equal diversity scores at D55 and D45 in the downshifted temperature scenario. However, Inverse Simpson’s Index provides a clearer picture, demonstrating that D45 has greater microbial diversity than D55. Interestingly, despite the decrease in biogas generation at 45 °C, the trends in the alpha diversity indices indicated that the microbial communities grew significantly at the same temperature for both scenarios, suggesting that the diversity of microbial communities had no significant correlation to the biogas production.
Since biogas production, particularly CH4, was mainly generated by methanogens via multiple methanogenesis pathways, the abundance of methanogens in the communities may be a reliable indicator to explain the fluctuation of biogas production levels. As seen in Figure 3b, in the upshifted temperature conditions, the methanogen community was dominated by Methanoculleus, Methanosaeta, Methanosarcina, and Methanobacterium. Nevertheless, at 42 °C, the relative abundance of methanogens only comprises 3.3% of the total microbial communities and decreases with the temperature shifts to 45 °C (2.9%) and 48 °C (2.1%), followed by the depletion of biogas production. In this community, Anaerobaculum, Petrotoga, and Moorella, belonging to phyla Synergistetes, Thermotogae, and Firmicutes, respectively, were dominant microorganisms in all three temperature conditions. There was a significant difference in the composition of microbial communities among the three temperature conditions. The abundance of Clostridium (Firmicutes) as syntrophic acetate-oxidizing bacteria (SAOB), which support CH4 production through the hydrogenotrophic pathway, fell sharply when the temperature was shifted to 45 °C and 48 °C. Meanwhile, the abundance of sulfate-reducing bacteria (SRB) such as Desulfonatronum, Desulfurispora, and Desulfotomaculum increased significantly and became dominant bacteria when the temperature was upshifted to 45 °C. The rising abundance of SRB, followed by a sharp decline in CH4, may indicate a potential negative correlation between SRB’s growth and biogas production.
Desulfonatronum was the only species predominant in the SRB community in the downshifted temperature scenario. As shown by Figure 3c, this microorganism’ abundance escalated once the temperature was downshifted to 45 °C, while the other SRB was detected below 0.05% in all temperature conditions. The microbial community was dominated by Anaerobaculum, Coprothermobacter, Clostridium, Tepidanaerobacter, Thermodesulfovibrio, and Methanosaeta. The dominance of Methanosaeta over the SRB community at 55 °C and 48 °C helps stabilize the vial to produce less fluctuated biogas yield compared to the upshifted temperature vial. However, when the temperature was lowered to 45 °C, Methanosaeta abundance decreased, whereas Desulfonatrum grew substantially at the same temperature, leading to a considerable decline in biogas production.
In summary, both temperature-shift conditions showed different microbial diversity and abundance. However, it is unclear whether the temperature shift increases the microbial diversity in the vials as the diversity index fluctuates in every temperature shift. Nevertheless, our findings discovered that the temperature shifts might disrupt methanogen populations that primarily regulate the CH4 production while mildly affecting the population of SRB due to its thermotolerance.

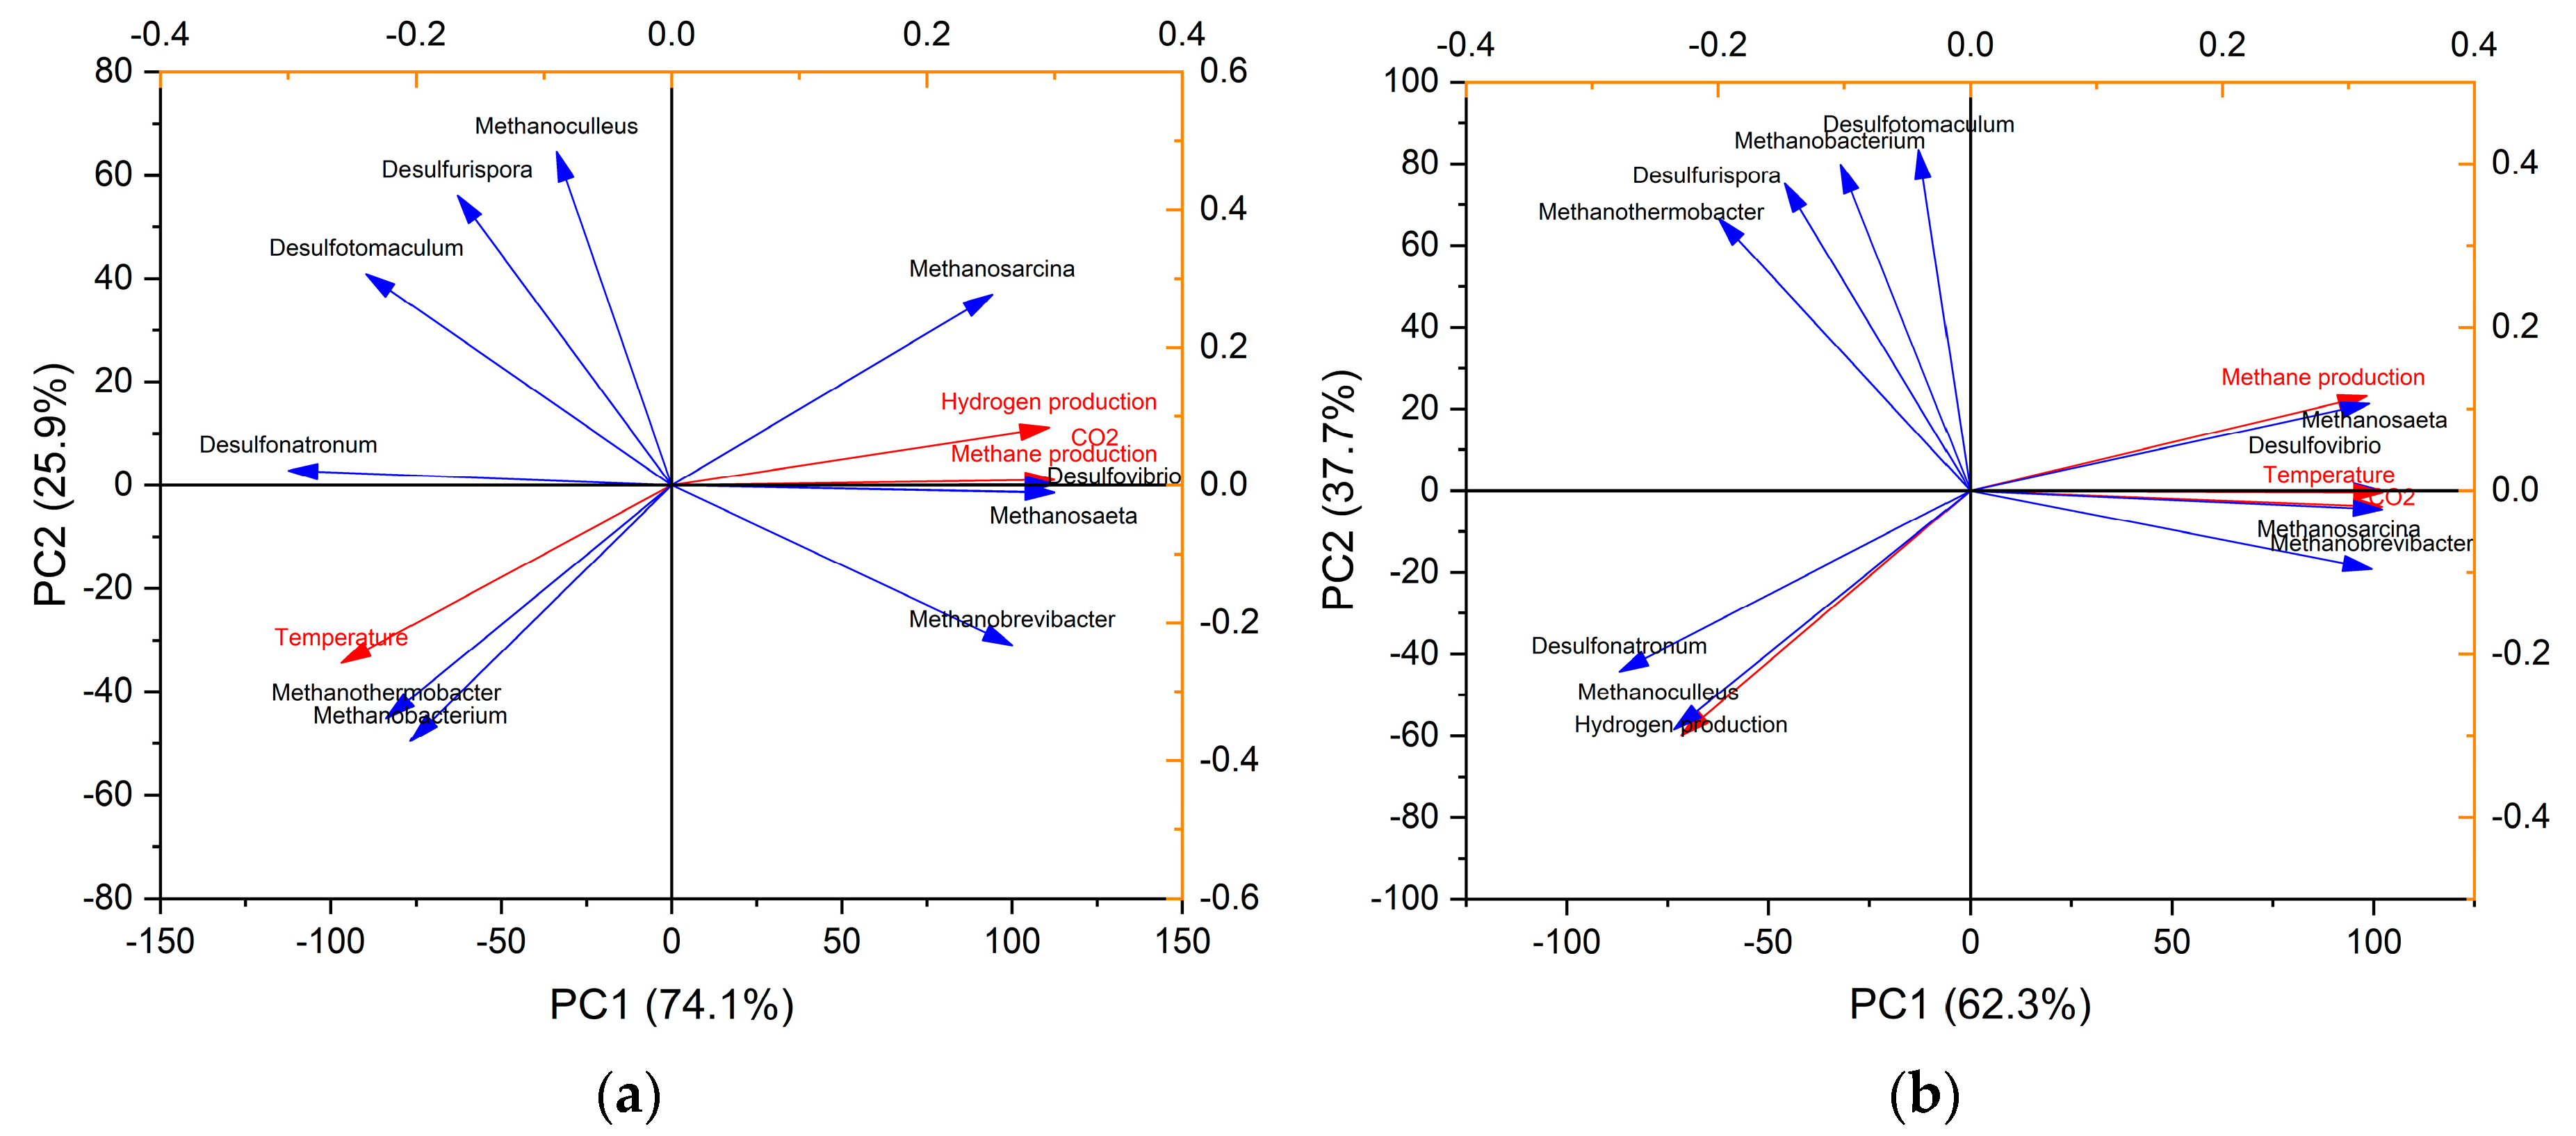
3.3. Correlation Analysis between Methanogen and SRB Populations on Biogas Production

The correlation between the methanogen and SRB populations on biogas production and temperature influences was analyzed using PCA (Figure 4). Biogas production in the upshifted temperature scenario had a strong negative correlation to temperature changes (Figure 4a), indicating that the temperature shift severely inhibits biogas production, such as CH4, H2, and CO2. The population of SRBs, such as Desulfonatronum and Desulfurispora, also exhibits an inverse influence on biogas production and the growth of several prominent methanogens, such as Methanosaeta and Methanobrevibacter. Figure 3a shows that Methanoculleus was the most prominent methanogen among microbial communities; however, there was almost no correlation between the growth of Methanoculleus and biogas production. Other methanogens, such as Methanothermobacter and Methanobacterium, were positively correlated with temperature shifts as they favor higher incubation temperatures. However, their opposite position to biogas production suggests they are not prominent producers.
In the downshifted temperature scenario, both CH4 and CO2 production positively correlated to the temperature shift in which the biogas production declined along with the decrease of the incubation temperature (Figure 4b). In this condition, the growth of acetoclastic methanogens, Methanosarcina and Methanosaeta, had a strong positive influence on the CH4 production, which signifies that the CH4 was primarily produced through the acetoclastic pathway. This finding was confirmed by the inverse position of major hydrogenotrophic methanogens such as Methanoculleus, Methanobacterium, and Methanothermobacter to the CH4 production, denoting a negative or no correlation. The abundance of SRB almost had no (or weak) correlation to the biogas production due to their low abundance in downshifted temperatures conditions.

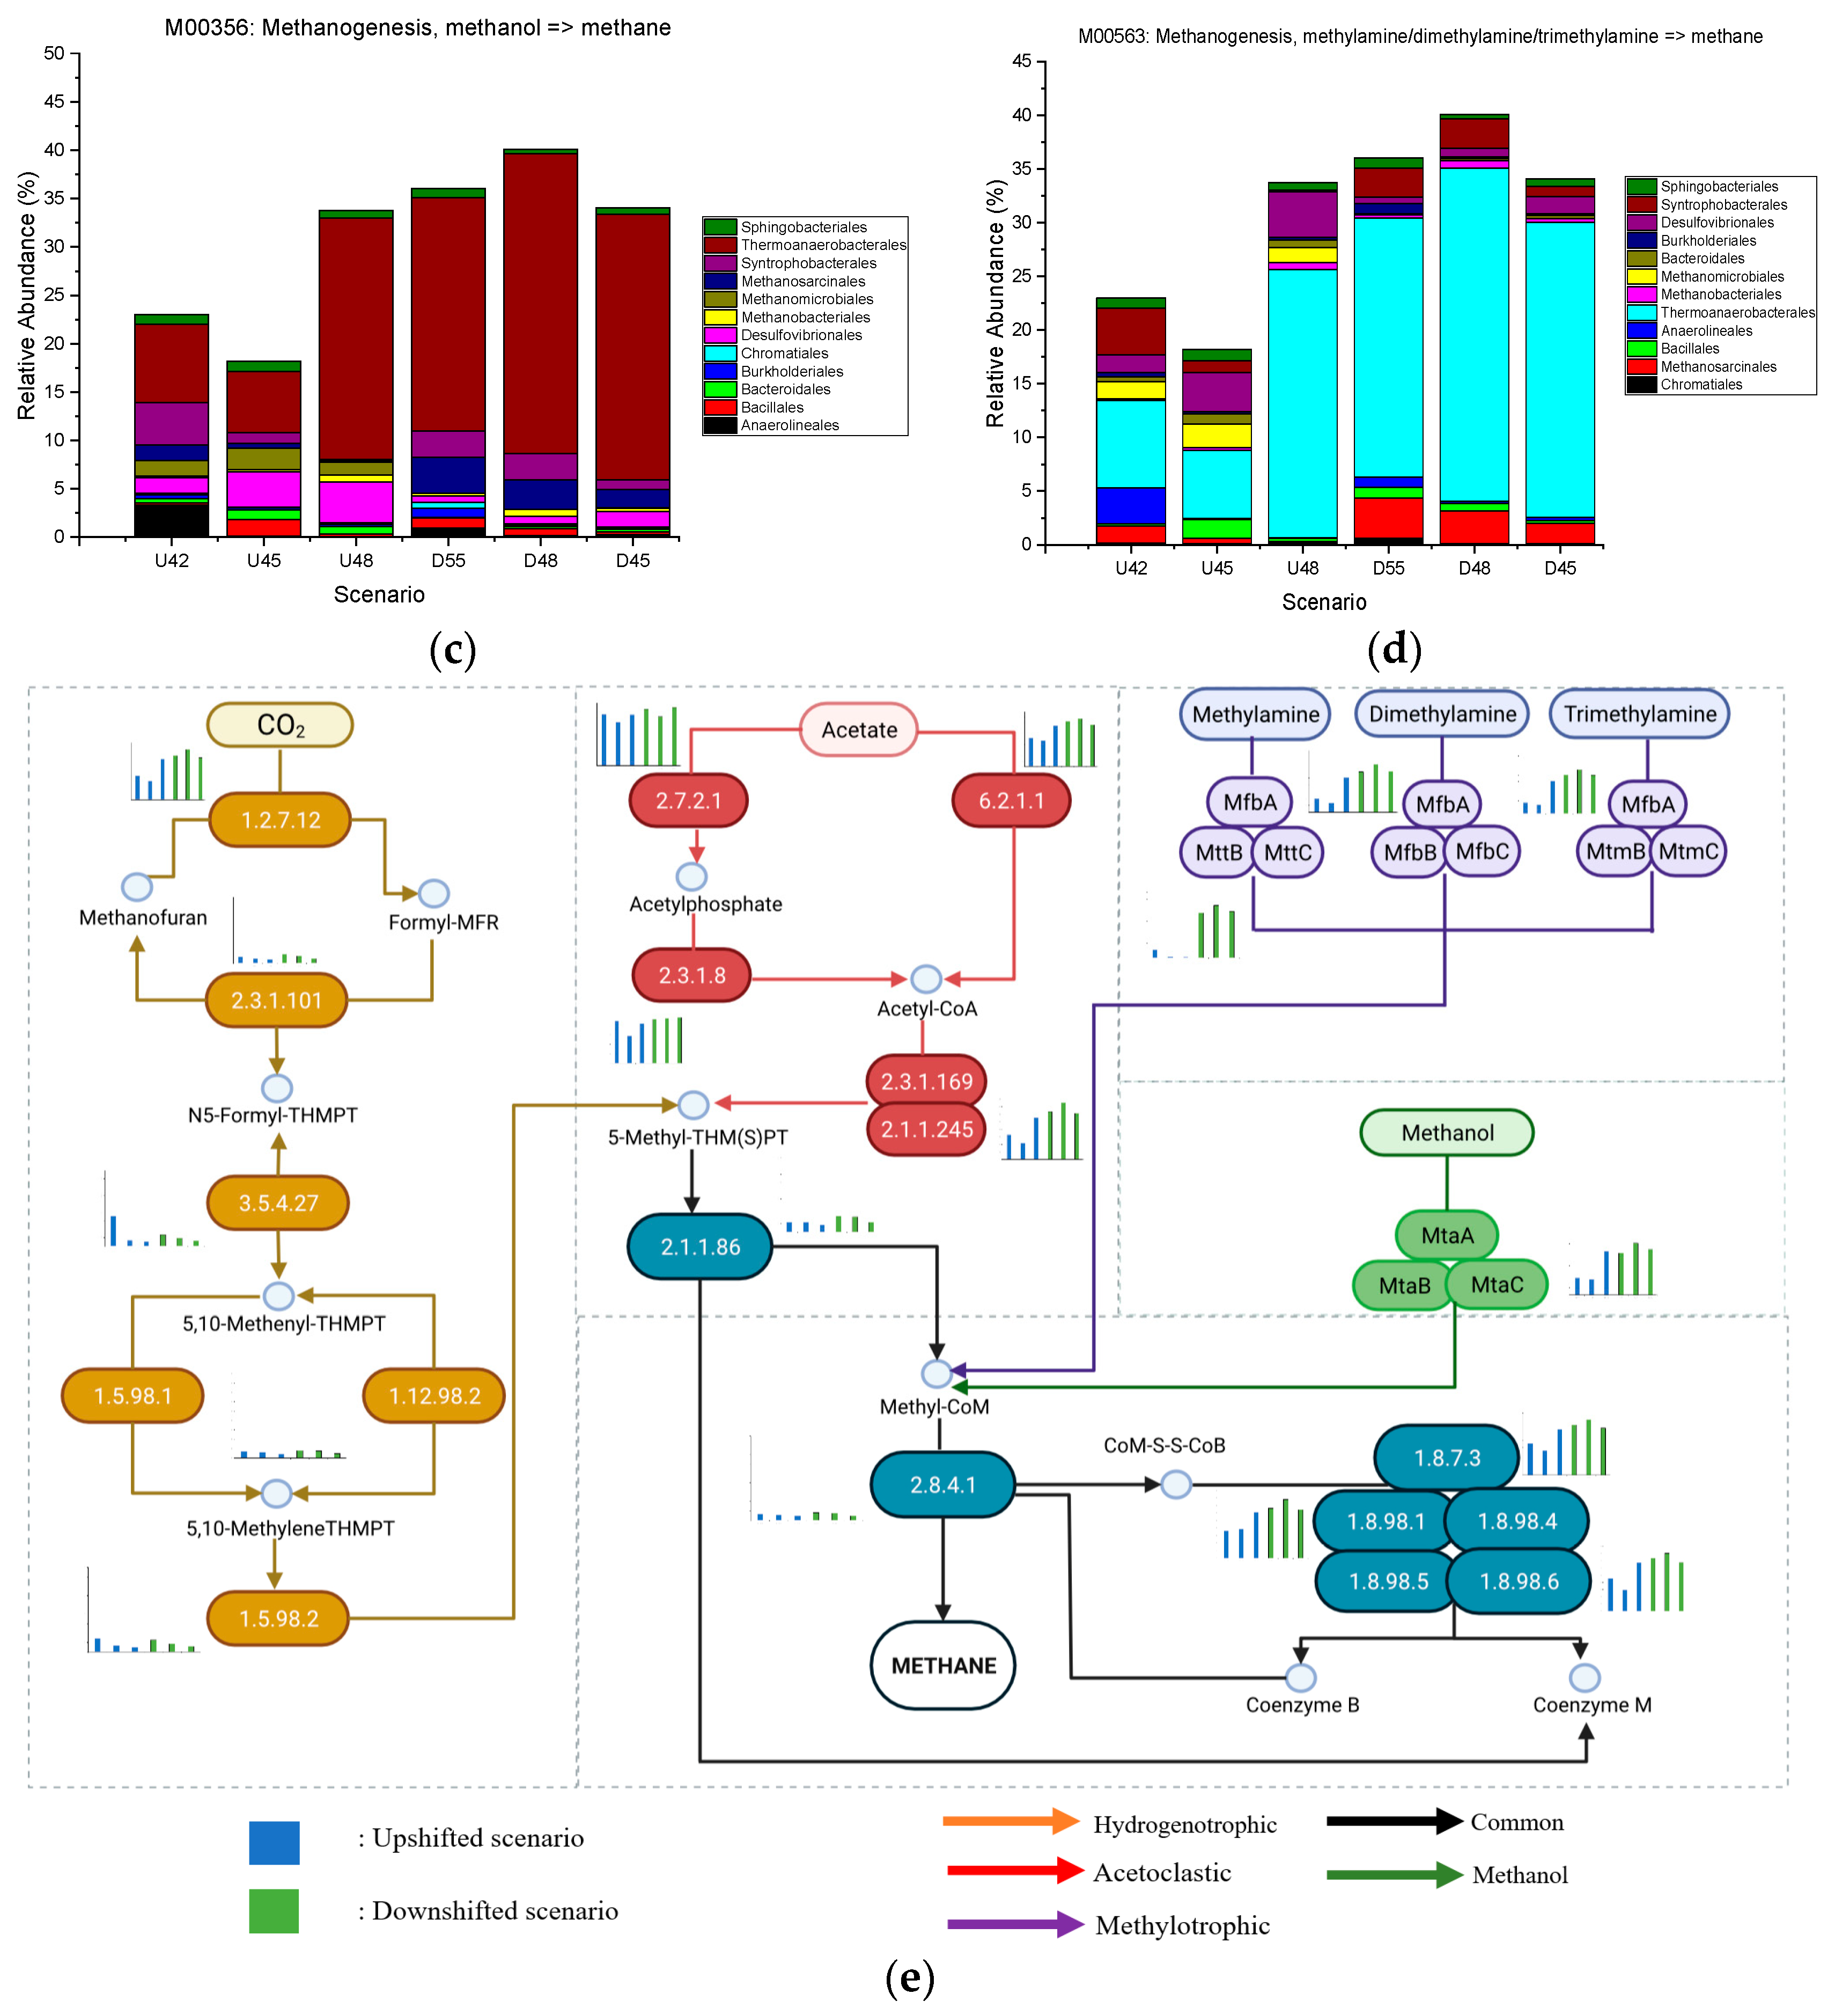
3.4. Effect of Upshifted and Downshifted Temperatures on CH4 Metabolism

The present study utilized the Kyoto Encyclopedia of Gene and Genomes (KEGG) database to annotate various genes and examine the genes encoding important enzymes associated with methanogenesis to determine how temperature changes may affect the process. CH4 was produced through four different modules, such as CH4 production from CO2 (M00567), from acetic acid (M00357), from methanol (M00356), and from methylamine, dimethylamine, and trimethylamine (M00563). Figure 5a–d show that the microbial communities involved in all four methanogenesis modules exhibited less fluctuation in the downshifted temperature scenario compared to the upshifted temperature scenario. This indicates that the transition from thermophilic to mesophilic conditions reduced the likelihood of unstable methanogenesis processes caused by sudden thermal changes. The increasing temperature has disturbed the methanogenesis process. Reduced methanogen levels at 45 °C incubation heightened the instability risk in CH4 production. The abundance of Methanomicrobiales in module M00567 exhibited a significant decline from 1.57% at 42 °C to 0.25% at 45 °C, followed by a gradual recovery to 1.35% at 48 °C. Methanobacteriales, a significant hydrogenotrophic methanogen responsible for regulating the M00567 modules, exhibited a decline in abundance from 0.17% to 0.02% at 45 °C but increased to 0.67% at 48 °C. The dominant methanogen in module M00357, Methanosarcinales, encountered a significant decline in relative abundance as temperature increased from 42 °C to 45 °C and 48 °C, dropping from 1.62% to 0.018% and 0.145%, respectively. Module M00357 exhibited the highest microbial abundance among the four modules, indicating that acetoclastic methanogenesis was the primary methanogenic pathway in both upshifted and downshifted temperature scenarios. According to the enzymes involved in the process, the microbial community abundance in the four methanogenesis modules is outlined in Figure 5e. Both upshifted and downshifted temperature scenarios showed low abundances in hydrogenotrophic, methanol, and methylamine pathways. In the hydrogenotrophic pathway (M00567), the highest abundance was achieved during the formyl-MFR dehydrogenase (EC:1.2.7.12) enzyme reaction, which reduces CO2 and methanofuran through N-carboxymethanofuran (carbamate) to N-formylmethanofuran [35,36]. The abundance decreased in the reaction to produce N-formylmethanofuran via the 5,6,7,8-tetrahydromethanopterin 5-formyltransferase enzyme (E.C.: 2.3.1.101) significantly due to fewer types of microorganisms being involved in this process. Both upshifted and downshifted temperature scenarios demonstrated a decreasing number of abundances in each temperature during the 5,6,7,8-tetrahydromethanopterin 5-formyltransferase process, suggesting that the temperature changes inflicted an adverse impact on the enzyme reaction. Since the synthesis of formyl-MFR is essential for the energy metabolism of hydrogenotrophic methanogens, as they derive energy from CO2, inhibition in this process may explain the low correlation between hydrogenotrophic methanogen abundance and biogas production in both temperature shift conditions.
In the acetoclastic methanogenesis pathway (M00357), two enzymes play an essential role in methane metabolism: acetate phosphotransferase (EC: 2.7.2.1) and acetyl-CoA synthetase (EC:6.2.1.1). Acetate phosphotransferase/acetate kinase (Ack) is responsible for switching and catalyzing acetate to acetyl phosphate and adenosine diphosphate (ADP) [37]. At the same time, acetyl-CoA synthetase is also a crucial component of the large multienzyme complex known as acetyl-CoA decarbonize/synthase (ACDS) and is responsible for breaking down acetate and producing methyl and reducing equivalents [38,39]. Both upshifted and downshifted temperature scenarios demonstrated a relatively high abundance of Ack genes. However, the downshifted temperatures scenario had a higher and less oscillating abundance of ACS genes than the upshifted temperature scenario, contributing to a more stable biogas production. The resiliency of the downshift temperature scenario was also exhibited by the high abundance of genes involved in CH4 production through methylamine, dimethylamine, trimethylamine (M00563), and methanol (M00356) pathways. Methanosaeta and Methanosarcina were the only methanogens known to produce CH4 via coenzyme-M methyltransferase for M00563 and M00356 synthesis, and they dominated the methanogen community in downshifted temperature scenario.

4. Discussion

The microbial community is a complicated system in which numerous species constantly adapt their ecological features or interactions in response to perturbations or changes in the environment [33]. In the AD process, the temperature changes significantly influence the abundance and the species of microbial communities, which may also impact biogas production [7,8,9]. Previously, we attempted to investigate the effect of temperature upshifts [7] and downshifts [8] using a similar method as demonstrated in the present study. However, the microbiome analysis was briefly performed, and the intercorrelation between microbial communities during temperature shift conditions was not widely elucidated. We realized that microbial communities were the ‘black box’ of the AD process; hence, in the present study, we performed extensive metagenomic analysis by determining how the microbial communities involved in the methanogenesis process reacted to the temperature shifts and how the changes in microbial communities affect the methane production pathway (causing inhibition on one specific pathway). A higher glucose concentration of 100 g/L was used in this study. Nevertheless, the biogas production decreased after the temperature was gradually downshifted and upshifted within 100 days of incubation for each temperature shift. These findings were supported by previous studies that showed a considerable decrease in biogas production (mainly CH4) when the reactor was given a shock temperature raise [13,20,40] and a temperature decrease [8,41,42], despite the different thermal changing methods and source of inoculum and substrates used in these studies.
NGS was employed as the DNA sequencing method in this study, with all reads passing the quality filter. The study utilized the relative abundance approach to compare microbial abundance in each temperature shift scenario, as the total number of reads in each temperature condition was not similar. NGS-based microbial network analysis demonstrated distinct microbial communities at upshifted and downshifted temperatures. In upshifted temperatures, Methanoculleus from the family Methanomicrobiaceae was the community’s most predominant methanogen. Methanoculleus is a hydrogenotrophic methanogen that requires CO2 and H2, provided by syntrophic acetate-oxidizing bacteria, to produce CH4 [42]. However, as previously mentioned in Figure 4a, the abundance of Methanoculleus had a weak correlation to biogas production, suggesting that the biogas was less likely to be produced predominantly via a hydrogenotrophic pathway. The relative rates of CH4 production between the two pathways can vary depending on the specific conditions and the availability of acetate and hydrogen. CH4 from H2/CO2 synthesis accumulates more slowly than acetate [43,44]. Previous studies supported this finding by demonstrating that lower CH4 production was obtained when the methanogenesis pathway shifted, indicated by the low abundance of acetoclastic methanogen and increasing abundance of hydrogenotrophic methanogen [43,45]. Furthermore, from the CH4 metabolism pathway shown by Figure 5b, it was further demonstrated that acetoclastic methanogens were the primary contributors to the methane metabolism pathway during upshifted temperature conditions since the abundances of critical enzymes in the process of acetoclastic methanogenesis were much higher than the abundances of key enzymes in the hydrogenotrophic pathway. This finding was also supported by a previous study [46].
The domination of acetoclastic genes can be clearly shown in the downshifted temperature conditions. From the KEGG database, order Methanosarcinales is involved in all vital enzyme reactions such as Ack, ACS, phosphate acetyltransferase, acetyl-CoA decarbonylase, and tetrahydromethanopterin S-methyltransferase. Methanosaeta was the most prevalent methanogen in the downshifted temperature microbial community, representing the dominant Methanosarcinales. Methanosaeta often predominates at low acetate concentrations of 100 to 150 mg COD/L, despite having a stronger affinity for acetate than the other acetoclastic methanogen, Methanosarcina, which also belongs to the Methanosarcinales order [6]. With the higher acetate affinity, Methanosaeta can efficiently adsorb acetic acid on its surface and utilize it as its energy source to grow and produce CH4 faster than Methanosarcina [46]. The domination of Methanosaeta from the beginning of the incubation at 55 °C and after downshifting to 48 and 45 °C can indicate strong thermotolerance. This finding negates previous studies that reported that acetoclastic methanogens (Methanosaeta and Methanosarcina) are mostly predominant at mesophilic temperatures.
In contrast, at thermophilic temperature, the methanogen composition will be shifted to hydrogenotrophic (Methanoculleus, Methanobacterium, and Methanothermobacter) [9,47]. In the present study, we demonstrated the capability of Methanosaeta to exist in both mesophilic and thermophilic conditions and its resiliency in surviving temperature changes while becoming the most predominant biogas producer via an acetoclastic pathway. This finding strengthens the earlier discovery that the abundance of acetoclastic methanogen (such as Methanosaeta) can provide reliable CH4 production and stability indicators [48]. Instead of temperature, the metabolic shift of abundance from Methanosaeta to Methanosarcina may occur if Methanosaeta cannot produce methane due to specific environmental changes such as acetate availability, decreasing pH, increasing organic loading rates, high levels of salts, and ammonia nitrogen [6,49,50].
To explain the downfall in biogas production in both temperature shifts conditions, the SRB community plays a crucial role that may interrupt the methanogenesis process and decrease biogas production. These bacteria compete with methanogens for the same hydrogen and acetate substrates required to decrease sulfate into sulfide [51,52]. The present study detected a high abundance of SRB, led by Desulfonatronum, Desulfurispora, and Desulfotomaculum, in an upshifted temperature scenario. Along with the increase in temperature, the abundance of SRB increased significantly, followed by a sharp reduction in biogas production. The existence of SRB in anaerobic digestion is disadvantageous primarily to the growth of methanogens as they consume similar substrates as methanogens, and they can obtain the substrates faster than the methanogens.
Furthermore, Desulforispora, Desulfotomaculum, Desulfonatronum, and the other Desulfovibrionales orders were one of the SRBs that can reduce sulfate to hydrogen sulfide (H2S) [52,53,54]. This poisonous and corrosive gas may slow down the rate of methane production and cause odors in the AD reactor. It also has an inhibiting influence on the growth of acetogens and methanogens [52]. Unlike methanogens that heavily rely on the availability of acetate or H2, SRB can live in an extended range of temperatures and pH without sulfate by competing with methanogens in the consumption of available acetate and H2 [53,54,55].
However, despite being able to survive in a broad range of temperatures, the SRB communities exhibited slower growth in the thermophilic scenario. In the downshifted temperature conditions that started from 55 °C, the SRB was detected in lower than 0.05% even after downshifting to 48 °C. Desulfonatronum abundance began to rise noticeably at 45 °C, followed by a decrease in methanogen abundance and a steep fall in biogas production. This finding indicates that most SRBs flourished only in mesophilic temperature conditions and struggled to survive in thermophilic conditions for 100 days. Hence, the present study suggests that high-temperature early incubation or pre-treatment treatment will potentially help eliminate several types of SRBs that inhibit the growth of methanogens. This measure may create a stable methanogenesis process and enhance biogas production. This study has taken a step toward understanding the relationship between the temperature shift representing ecosystem change and a long-term disturbance. The comprehensive strategies for understanding the impact of the other environmental factors such as VFA, higher loading rate, pH changes, and the addition of free ammonia in multiple temperature shift conditions can also be applied to future research in this field or the other research field that also works to explore the dynamic transitions in a microbial population under several circumstances.

5. Conclusions

Our findings highlight the effect of temperature upshift and downshift on biogas production and how microbial communities respond to temperature changes every 100 days. The upshifting and downshifting of the temperature during AD results in the deterioration of biogas production and changes in microbial communities. The increase in temperature from 42 °C to 45 °C depletes up to 83% of the CH4 production, followed by the decrease in Methanosaeta and Methanosarcina. The CH4 production increased by 33% after the further shift to 48 °C. The hydrogenotrophic Methanoculleus dominates the methanogen community in the upshifted temperature scenario. However, it weakly influenced biogas production, signifying inhibition via a hydrogenotrophic pathway. The increased SRB population may cause perturbations of biogas production due to the intense nutrient competition as they also crave available acetate and H2 to survive. The downshift temperature scenario facilitated a better AD performance by experiencing a maximum of 33% drawdown of CH4 production only at 45 °C. Despite the multiple temperature shifts, the treatment exhibited a resiliency of Methanosaeta that predominantly produced biogas through the acetoclastic pathway. In addition, the SRB abundance was found to be minimal in the downshift temperature treatment. Hence, we propose that early incubation or pre-treatment at high temperatures may assist in removing various SRBs that impede the growth of the methanogens. This action could stabilize the methanogenesis process and increase the generation of biogas.

Author Contributions

G.A.W.S.: conceptualization, methodology, formal analysis, investigation, data curation, writing—original draft, and visualization. T.I.: conceptualization, methodology, resources, writing—review and editing, supervision, project administration, and funding acquisition. C.M.: conceptualization, methodology, resources, and writing—review and editing. A.R.: conceptualization, methodology, resources, reviewing, and supervision. All authors have read and agreed to the published version of the manuscript.

Funding

This work was supported by JSPS KAKENHI Grant Number JP23K04089.

Institutional Review Board Statement

Not applicable.

Informed Consent Statement

Not applicable.

Data Availability Statement

Not applicable.

Acknowledgments

The first author would like to thank Japanese Ministry of Education, Culture, Sports, Science and Technology (Monbukagakusho) for the full support through the Doctoral Degree Scholarship Program.

Conflicts of Interest

The authors declare that they have no known competing financial interest or personal relationship that could have appeared to influence the work reported in this paper.

References

  1. Porté, H.; Kougias, P.G.; Alfaro, N.; Treu, L.; Campanaro, S.; Angelidaki, I. Process Performance and Microbial Community Structure in Thermophilic Trickling Biofilter Reactors for Biogas Upgrading. Sci. Total Environ. 2019, 655, 529–538. [Google Scholar] [CrossRef] [PubMed]
  2. Ma, Y.; Liu, Y. Turning Food Waste to Energy and Resources towards a Great Environmental and Economic Sustainability: An Innovative Integrated Biological Approach. Biotechnol. Adv. 2019, 37, 107414. [Google Scholar] [CrossRef] [PubMed]
  3. Xu, R.Z.; Fang, S.; Zhang, L.; Huang, W.; Shao, Q.; Fang, F.; Feng, Q.; Cao, J.; Luo, J. Distribution Patterns of Functional Microbial Community in Anaerobic Digesters under Different Operational Circumstances: A Review. Bioresour. Technol. 2021, 341, 125823. [Google Scholar] [CrossRef] [PubMed]
  4. Wu, Z.-L.; Zhang, Q.; Xia, Z.-Y.; Gou, M.; Sun, Z.-Y.; Tang, Y.-Q. The Responses of Mesophilic and Thermophilic Anaerobic Digestion of Municipal Sludge to Periodic Fluctuation Disturbance of Organic Loading Rate. Environ. Res. 2022, 218, 114783. [Google Scholar] [CrossRef] [PubMed]
  5. Tian, H.; Fotidis, I.A.; Mancini, E.; Treu, L.; Mahdy, A.; Ballesteros, M.; González-Fernández, C.; Angelidaki, I. Acclimation to Extremely High Ammonia Levels in Continuous Biomethanation Process and the Associated Microbial Community Dynamics. Bioresour. Technol. 2018, 247, 616–623. [Google Scholar] [CrossRef] [Green Version]
  6. Kurade, M.B.; Saha, S.; Salama, E.; Patil, S.M.; Govindwar, S.P. Acetoclastic Methanogenesis Led by Methanosarcina in Anaerobic Co-Digestion of Fats, Oil and Grease for Enhanced Production of Methane. Bioresour. Technol. 2019, 272, 351–359. [Google Scholar] [CrossRef]
  7. Sudiartha, G.A.W.; Imai, T.; Hung, Y.-T. Effects of Stepwise Temperature Shifts in Anaerobic Digestion for Treating Municipal Wastewater Sludge: A Genomic Study. Int. J. Environ. Res. Public Health 2022, 19, 5728. [Google Scholar] [CrossRef]
  8. Sudiartha, G.A.W.; Imai, T. An Investigation of Temperature Downshift Influences on Anaerobic Digestion in the Treatment of Municipal Wastewater Sludge. J. Water Environ. Technol. 2022, 20, 154–167. [Google Scholar] [CrossRef]
  9. Nie, E.; He, P.; Zhang, H.; Hao, L.; Shao, L.; Lü, F. How Does Temperature Regulate Anaerobic Digestion? Renew. Sustain. Energy Rev. 2021, 150, 111453. [Google Scholar] [CrossRef]
  10. Madigou, C.; Lê Cao, K.A.; Bureau, C.; Mazéas, L.; Déjean, S.; Chapleur, O. Ecological Consequences of Abrupt Temperature Changes in Anaerobic Digesters. Chem. Eng. J. 2019, 361, 266–277. [Google Scholar] [CrossRef]
  11. Kovalovszki, A.; Treu, L.; Ellegaard, L.; Luo, G.; Angelidaki, I. Modeling Temperature Response in Bioenergy Production: Novel Solution to a Common Challenge of Anaerobic Digestion. Appl. Energy 2020, 263, 114646. [Google Scholar] [CrossRef]
  12. Hupfauf, S.; Plattner, P.; Wagner, A.O.; Kaufmann, R.; Insam, H.; Podmirseg, S.M. Temperature Shapes the Microbiota in Anaerobic Digestion and Drives Efficiency to a Maximum at 45 °C. Bioresour. Technol. 2018, 269, 309–318. [Google Scholar] [CrossRef] [PubMed]
  13. Beale, D.J.; Karpe, A.V.; McLeod, J.D.; Gondalia, S.V.; Muster, T.H.; Othman, M.Z.; Palombo, E.A.; Joshi, D. An “omics” Approach towards the Characterisation of Laboratory Scale Anaerobic Digesters Treating Municipal Sewage Sludge. Water Res. 2016, 88, 346–357. [Google Scholar] [CrossRef] [PubMed]
  14. Chen, H.; Chang, S. Bioresource Technology Dissecting Methanogenesis for Temperature-Phased Anaerobic Digestion: Impact of Temperature on Community Structure, Correlation, and Fate of Methanogens. Bioresour. Technol. 2020, 306, 123104. [Google Scholar] [CrossRef]
  15. Fernández-Rodríguez, J.; Pérez, M.; Romero, L.I. Semicontinuous Temperature-Phased Anaerobic Digestion (TPAD) of Organic Fraction of Municipal Solid Waste (OFMSW). Comparison with Single-Stage Processes. Chem. Eng. J. 2016, 285, 409–416. [Google Scholar] [CrossRef]
  16. Wang, S.; Ruan, Y.; Zhou, W.; Li, Z.; Wu, J.; Liu, D. Net Energy Analysis of Small-Scale Biogas Self-Supply Anaerobic Digestion System Operated at Psychrophilic to Thermophilic Conditions. J. Clean. Prod. 2018, 174, 226–236. [Google Scholar] [CrossRef]
  17. Kasinski, S. Mesophilic and Thermophilic Anaerobic Digestion of Organic Fraction Separated during Mechanical Heat Treatment of Municipal Waste. Appl. Sci. 2020, 10, 2412. [Google Scholar] [CrossRef] [Green Version]
  18. Hidaka, T.; Nakamura, M.; Oritate, F.; Nishimura, F. Comparative Anaerobic Digestion of Sewage Sludge at Different Temperatures with and without Heat Pre-Treatment. Chemosphere 2022, 307, 135808. [Google Scholar] [CrossRef]
  19. Roopnarain, A.; Rama, H.; Ndaba, B.; Bello-Akinosho, M.; Bamuza-Pemu, E.; Adeleke, R. Unravelling the Anaerobic Digestion ‘Black Box’: Biotechnological Approaches for Process Optimization. Renew. Sustain. Energy Rev. 2021, 152, 111717. [Google Scholar] [CrossRef]
  20. Westerholm, M.; Isaksson, S.; Karlsson Lindsjö, O.; Schnürer, A. Microbial Community Adaptability to Altered Temperature Conditions Determines the Potential for Process Optimisation in Biogas Production. Appl. Energy 2018, 226, 838–848. [Google Scholar] [CrossRef]
  21. Zhou, W.; Imai, T.; Ukita, M.; Sekine, M.; Higuchi, T. Triggering Forces for Anaerobic Granulation in UASB Reactors. Process Biochem. 2006, 41, 36–43. [Google Scholar] [CrossRef]
  22. Sakaveli, F.; Petala, M.; Tsiridis, V.; Darakas, E. Enhanced Mesophilic Anaerobic Digestion of Primary Sewage Sludge. Water 2021, 13, 348. [Google Scholar] [CrossRef]
  23. García-Depraect, O.; Martínez-Mendoza, L.J.; Diaz, I.; Muñoz, R. Two-Stage Anaerobic Digestion of Food Waste: Enhanced Bioenergy Production Rate by Steering Lactate-Type Fermentation during Hydrolysis-Acidogenesis. Bioresour. Technol. 2022, 358, 127358. [Google Scholar] [CrossRef] [PubMed]
  24. Sittijunda, S.; Reungsang, A.; O-thong, S. Biohydrogen Production from Dual Digestion Pretreatment of Poultry Slaughterhouse Sludge by Anaerobic Self-Fermentation. Int. J. Hydrogen Energy 2010, 35, 13427–13434. [Google Scholar] [CrossRef]
  25. Kobayashi, T.; Yasuda, D.; Li, Y.-Y.; Kubota, K.; Harada, H.; Okaniwa, Y. Start-up Method of Anaerobic Digestion by Anaerobic Self-Degradation of Waste Activated Sludge and Microbial Community Shift during Self-Degradation. J. Jpn. Soc. Water Environ. 2008, 31, 525–532. [Google Scholar] [CrossRef]
  26. Signorini, A.; Lembo, G.; Giulia, M.; Pizzichini, D.; Fenice, M. Self-Fermentation: Innovative Pretreatment for Use High Concentration of Olive Mill Wastewater in Anaerobic Digestion Plant. In Proceedings of the 24th European Biomass Conference and Exhibition, Amsterdam, The Netherlands, 6–9 June 2016. [Google Scholar]
  27. Tetteh, E.K.; Rathilal, S. Biophotocatalytic Reduction of CO2 in Anaerobic Biogas Produced from Wastewater Treatment Using an Integrated System. Catalysts 2022, 12, 76. [Google Scholar] [CrossRef]
  28. Ángeles, R.; Vega-Quiel, M.J.; Batista, A.; Fernández-Ramos, O.; Lebrero, R.; Muñoz, R. Influence of Biogas Supply Regime on Photosynthetic Biogas Upgrading Performance in an Enclosed Algal-Bacterial Photobioreactor. Algal Res. 2021, 21, 102350. [Google Scholar] [CrossRef]
  29. Zhao, J.; Li, Y.; Dong, R. Recent Progress towards In-Situ Biogas Upgrading Technologies. Sci. Total Environ. 2021, 800, 149667. [Google Scholar] [CrossRef]
  30. Moestedt, J.; Nordell, E.; Schnürer, A. Comparison of Operating Strategies for Increased Biogas Production from Thin Stillage. J. Biotechnol. 2014, 175, 22–30. [Google Scholar] [CrossRef]
  31. Sun, L.; Pope, P.B.; Eijsink, V.G.H.; Schnürer, A. Characterization of Microbial Community Structure during Continuous Anaerobic Digestion of Straw and Cow Manure. Microb. Biotechnol. 2015, 8, 815–827. [Google Scholar] [CrossRef] [Green Version]
  32. Westerholm, M.; Müller, B.; Isaksson, S.; Schnürer, A. Trace Element and Temperature Effects on Microbial Communities and Links to Biogas Digester Performance at High Ammonia Levels. Biotechnol. Biofuels 2015, 8, 154. [Google Scholar] [CrossRef] [PubMed] [Green Version]
  33. Shaw, G.T.W.; Weng, C.Y.; Chen, C.Y.; Weng, F.C.H.; Wang, D. A Systematic Approach Re-Analyzing the Effects of Temperature Disturbance on the Microbial Community of Mesophilic Anaerobic Digestion. Sci. Rep. 2019, 9, 6560. [Google Scholar] [CrossRef] [PubMed] [Green Version]
  34. Arelli, V.; Mamindlapelli, N.K.; Begum, S.; Juntupally, S.; Anupoju, G.R. Solid State Anaerobic Digestion of Food Waste and Sewage Sludge: Impact of Mixing Ratios and Temperature on Microbial Diversity, Reactor Stability and Methane Yield. Sci. Total Environ. 2021, 793, 148586. [Google Scholar] [CrossRef] [PubMed]
  35. Hochheimer, A.; Schmitz, R.A.; Thauer, R.K.; Hedderich, R. The Tungsten Formylmethanofuran Dehydrogenase from Methanobacterium Thermoautotrophicum Contains Sequence Motifs Characteristic for Enzymes Containing Molybdopterin Dinucleotide. Eur. J. Biochem. 1995, 234, 910–920. [Google Scholar] [CrossRef]
  36. Vorholt, J.A.; Thauer, R.K. The Active Species of “CO2” Utilized by Formylmethanofuran Dehydrogenase from Methanogenic Archaea. Eur. J. Biochem. 1997, 248, 919–924. [Google Scholar] [CrossRef] [Green Version]
  37. Barnhart, E.P.; Mcclure, M.A.; Johnson, K.; Cleveland, S.; Hunt, K.A.; Fields, M.W. Potential Role of Acetyl-CoA Synthetase (Acs) and Malate Dehydrogenase (Mae) in the Evolution of the Acetate Switch in Bacteria and Archaea. Sci. Rep. 2015, 5, 12498. [Google Scholar] [CrossRef] [Green Version]
  38. Grahame, D.A. Methods for Analysis of Acetyl-CoA Synthase: Applications to Bacterial and Archaeal Systems, 1st ed.; Elsevier Inc.: Amsterdam, The Netherlands, 2011; Volume 494, ISBN 9780123851123. [Google Scholar]
  39. Zhang, S.; Xiao, M.; Liang, C.; Chui, C.; Wang, N.; Shi, J.; Liu, L. Multivariate Insights into Enhanced Biogas Production in Thermophilic Dry Anaerobic Co-Digestion of Food Waste with Kitchen Waste or Garden Waste: Process Properties, Microbial Communities and Metagenomic Analyses. Bioresour. Technol. 2022, 361, 127684. [Google Scholar] [CrossRef]
  40. Ziembińska-Buczyńska, A.; Banach, A.; Bacza, T.; Pieczykolan, M. Diversity and Variability of Methanogens during the Shift from Mesophilic to Thermohilic Conditions While Biogas Production. World J. Microbiol. Biotechnol. 2014, 30, 3047–3053. [Google Scholar] [CrossRef]
  41. Wang, S.; Ma, F.; Ma, W.; Wang, P.; Zhao, G.; Lu, X. Influence of Temperature on Biogas Production Efficiency and Microbial Community in a Two-Phase Anaerobic Digestion System. Water 2019, 11, 133. [Google Scholar] [CrossRef] [Green Version]
  42. Babaei, A.; Shayegan, J. Effects of Temperature and Mixing Modes on the Performance of Municipal Solid Waste Anaerobic Slurry Digester 09 Engineering 0907 Environmental Engineering 09 Engineering 0904 Chemical Engineering. J. Environ. Health Sci. Eng. 2019, 17, 1077–1084. [Google Scholar] [CrossRef]
  43. Conrad, R. Contribution of Hydrogen to Methane Production and Control of Hydrogen Concentrations in Methanogenic Soils and Sediments. FEMS Microbiol. Ecol. 1999, 28, 193–202. [Google Scholar] [CrossRef]
  44. Metje, M.; Frenzel, P. Methanogenesis and Methanogenic Pathways in a Peat from Subarctic Permafrost. Environ. Microbiol. 2007, 9, 954–964. [Google Scholar] [CrossRef] [PubMed]
  45. Liebner, S.; Ganzert, L.; Kiss, A.; Yang, S.; Wagner, D.; Svenning, M.M. Shifts in Methanogenic Community Composition and Methane Fluxes along the Degradation of Discontinuous Permafrost. Front. Microbiol. 2015, 6, 356. [Google Scholar] [CrossRef] [PubMed] [Green Version]
  46. Ni, R.; Xu, C.; Shi, X.; Yang, S.; Li, L.; Peng, X.; Song, L. Acetoclastic Methanogenesis Pathway Stability despite the High Microbial Taxonomic Variability in the Transition from Acidogenesis to Methanogenesis during Food Waste Anaerobic Digestion. J. Clean. Prod. 2022, 372, 133758. [Google Scholar] [CrossRef]
  47. Ho, D.P.; Jensen, P.D.; Batstone, D.J. Methanosarcinaceae and Acetate-Oxidizing Pathways Dominate in High-Rate Thermophilic Anaerobic Digestion of Waste-Activated Sludge. Appl. Environ. Microbiol. 2013, 79, 6491–6500. [Google Scholar] [CrossRef] [Green Version]
  48. Krohn, C.; Dias, D.A.; Den Akker, V.; Rees, C.A.; Crosbie, N.D.; Carroll, D.M.O.; Stuetz, R.M.; Batstone, D.J.; Ball, A.S. The Role of Microbial Ecology in Improving the Performance of Anaerobic Digestion of Sewage Sludge. Front. Microbiol. 2022, 13, 1079136. [Google Scholar] [CrossRef]
  49. De Vrieze, J.; Hennebel, T.; Boon, N.; Verstraete, W. Bioresource Technology Methanosarcina: The Rediscovered Methanogen for Heavy Duty Biomethanation. Bioresour. Technol. 2012, 112, 1–9. [Google Scholar] [CrossRef]
  50. Tian, H.; Fotidis, I.A.; Kissas, K.; Angelidaki, I. Bioresource Technology E Ff Ect of Di Ff Erent Ammonia Sources on Aceticlastic and Hydrogenotrophic Methanogens. Bioresour. Technol. 2018, 250, 390–397. [Google Scholar] [CrossRef] [Green Version]
  51. Demirel, B.; Yenigu, O. Two-Phase Anaerobic Digestion Processes: A Review. J. Chem. Technol. Biotechnol. 2002, 77, 743–755. [Google Scholar] [CrossRef]
  52. Harirchi, S.; Wainaina, S.; Sar, T.; Nojoumi, S.A.; Parchami, M.; Varjani, S.; Khanal, S.K.; Awasthi, M.K.; Taherzadeh, M.J.; Harirchi, S.; et al. Microbiological Insights into Anaerobic Digestion for Biogas, Hydrogen or Volatile Fatty Acids (VFAs): A Review. Bioengineered 2022, 13, 6521–6557. [Google Scholar] [CrossRef]
  53. St-pierre, B. Implications from Distinct Sulfate-Reducing Bacteria Populations between Cattle Manure and Digestate in the Elucidation of H2S Production during Anaerobic Digestion of Animal Slurry. Appl. Microbiol. Biotechnol. 2017, 101, 5543–5556. [Google Scholar] [CrossRef] [PubMed]
  54. Tran, T.T.T.; Kannoorpatti, K.; Padovan, A.; Thennadil, S. Sulphate-Reducing Bacteria’s Response to Extreme pH Environments and the Effect of Their Activities on Microbial Corrosion. Appl. Sci. 2021, 11, 2201. [Google Scholar] [CrossRef]
  55. Wang, F.; Peng, S.; Fan, L.; Li, Y. Improved Sulfate Reduction Efficiency of Sulfate- Reducing Bacteria in Sulfate-Rich Systems by Acclimatization and Multiple-Grouting. Alexandria Eng. J. 2022, 61, 9993–10005. [Google Scholar] [CrossRef]
Figure 1. Biogas production in response to temperature shift conditions: (a) CH4, CO2, and H2 yield with (b) volumetric biogas yield in the upshifted temperature and (c) CH4, CO2, and H2 yield with (d) volumetric biogas yield in the downshifted temperature.
Fermentation 09 00642 g001
Figure 2. Biogas composition in two different temperature shift scenarios: (a) upshifted and (b) downshifted.
Fermentation 09 00642 g002
Figure 3. Microbial diversity analysis (a); and microbial communities with >0.5% relative abundance heatmap (scale in %) in upshifted temperatures scenario (b) and downshifted temperatures scenario (c).
Fermentation 09 00642 g003aFermentation 09 00642 g003b
Figure 4. PCA of methanogens, SRB, and biogas production for (a) an upshifted temperatures scenario and (b) a downshifted temperatures scenario. Microorganisms were selected at the genus level of each group. The blue lines and red lines represent bacteria and biogas production factors, respectively.
Fermentation 09 00642 g004
Figure 5. The relative abundance of genes associated with methanogenesis in U42, U45, U48, D55, D48, and D45 in four methanogenesis pathway modules: (a) M00567, (b) M00357, (c) M00356, and (d) M00563. (e) The relative abundance of genes in each enzyme involved in four KEGG methanogenesis modules.
Fermentation 09 00642 g005aFermentation 09 00642 g005b
Table 1. Characteristics of anaerobically digested sludge as inoculum.
ParametersAnaerobic SludgeUnits
pH8.17-
Total Solid (TS)8% w/v
Volatile Solid (VS)3% w/v
Fixed Solid (FS)5% w/v
VS/TS ratio0.6-
Table 2. Labels for biogas production and microbial communities obtained from each temperature conditions.
ConditionsLabelsScenario
42 °CU42Upshifted
42 °C → 45 °C U45Upshifted
45 °C → 48 °CU48Upshifted
55 °CD55Downshifted
55 °C→48 °CD48Downshifted
48 °C → 45 °CD45Downshifted
Disclaimer/Publisher’s Note: The statements, opinions and data contained in all publications are solely those of the individual author(s) and contributor(s) and not of MDPI and/or the editor(s). MDPI and/or the editor(s) disclaim responsibility for any injury to people or property resulting from any ideas, methods, instructions or products referred to in the content.

