1. Introduction
The growing field of biotechnology will become a more influential fraction of the economy, gradually replacing chemical (synthesis) technologies with more environmentally sustainable ones [
1]. At the same time, the sustainability of biotechnology itself is an important issue. Currently, in many cases, the limiting factor of biotechnology is the economic factor—biotechnology frequently is unable to compete with the chemical industry due to higher costs [
2,
3]. In other words, biotechnological solutions are less economically sustainable than chemical technologies. Knowing that there are two more components of sustainability, economic and social, Stalidzans and Dace [
4] have proposed sustainable metabolic engineering (SME) as an approach for the selection of more sustainable metabolic engineering designs taking into account the economic, environmental and social components of sustainability. That way, the advantages of biotechnology in environmental and social aspects over chemical technologies are taken into account and enable optimisation of all three sustainability aspects already during strain selection and design.
The assessment and design of sustainable biotechnological processes is a complex multi-criteria and multi-objective decision-making problem, not only regarding the multi-level evaluation but also due to the significant amount of input data required for the analysis, which may come from different sources with varying degrees of uncertainties [
5]. Sustainability assessment is crucial in the early stages of process design as a guide for balancing economic benefits with the environmental and social impacts of the operation; however, because the end design itself is still unknown, parameters necessary for sustainability assessment are uncertain and therefore estimated [
6]. Although this approach comes with uncertainty, the output generated can still help in guiding sustainable design decisions [
5].
The implementation of the proposed SME concept is suggested using constraint-based stoichiometric modelling [
7,
8] as the key element for the calculation of sustainability because:
(1) constraint-based stoichiometric modelling enables analysis of an organism at the genome scale providing steady-state balance calculations of all incoming (substrates) and outgoing (products, biomass and by-products) metabolic fluxes and produced biomass, and
(2) the structure of the model and the metabolic flux calculation results enable the assessment of different sustainability parameters using all metabolite exchange fluxes between the cell and the media.
The further development of the SME concept depends on its implementation at the computational level to acquire applicable results—sustainable production strain designs. The paper of Stalidzans and Dace hints at using constraint-based modelling without an example of practical implementation of the SME concept and examples of SME-based designs.
There are several challenges to be solved when implementing SME. One of them is the complexity of the objective function. Instead of classical constraint-based modelling cases where one of the exchange reactions (usually biomass or product formation) should be maximized or minimized, in the case of SME, the objective function value must be calculated considering the impact of all exchange fluxes on the three components of sustainability. Another SME implementation issue is flux variability [
9]. The flux variability is determined by the complexity and redundancy of the metabolic network and frequently leads to variability of the exchange fluxes between the organism and the environment that are used in sustainability calculations. As a result, the variability of exchange fluxes causes the variability of sustainability, creating uncertainty when ranking metabolic designs.
The calculation of sustainability as an objective function can be implemented in several ways. One of the opportunities is also a promising tool of flux variability reduction by design—a popular and well-developed metabolic engineering approach—growth-coupled product synthesis [
10,
11,
12]. Growth-coupled production relies on coupling biomass production with the target product flux through deletion of some metabolic reactions to transform the metabolism in a way that the fastest growing strains in the media will produce the product. Growth coupling relies on the dominance of the fastest growing strain phenotype in the media, aiming to limit the metabolic behaviour solution space to minimal variability of a possibly high product formation rate. Growth coupling helps also in variability reduction at the most probable point of operation—the one with the highest growth rate.
In this study, a growth-coupling algorithm was modified to implement the economic, environmental and social sustainability calculations using a complex objective function.
Escherichia coli is taken as a test-case organism due to its relatively well-known metabolism and the availability of high-quality genome-scale metabolic models (GSMM) [
13,
14]. The generated
E. coli designs and their generation process are discussed.
2. Methods
2.1. Creation of a Complex Objective Function for Integrated Sustainability Score Calculation
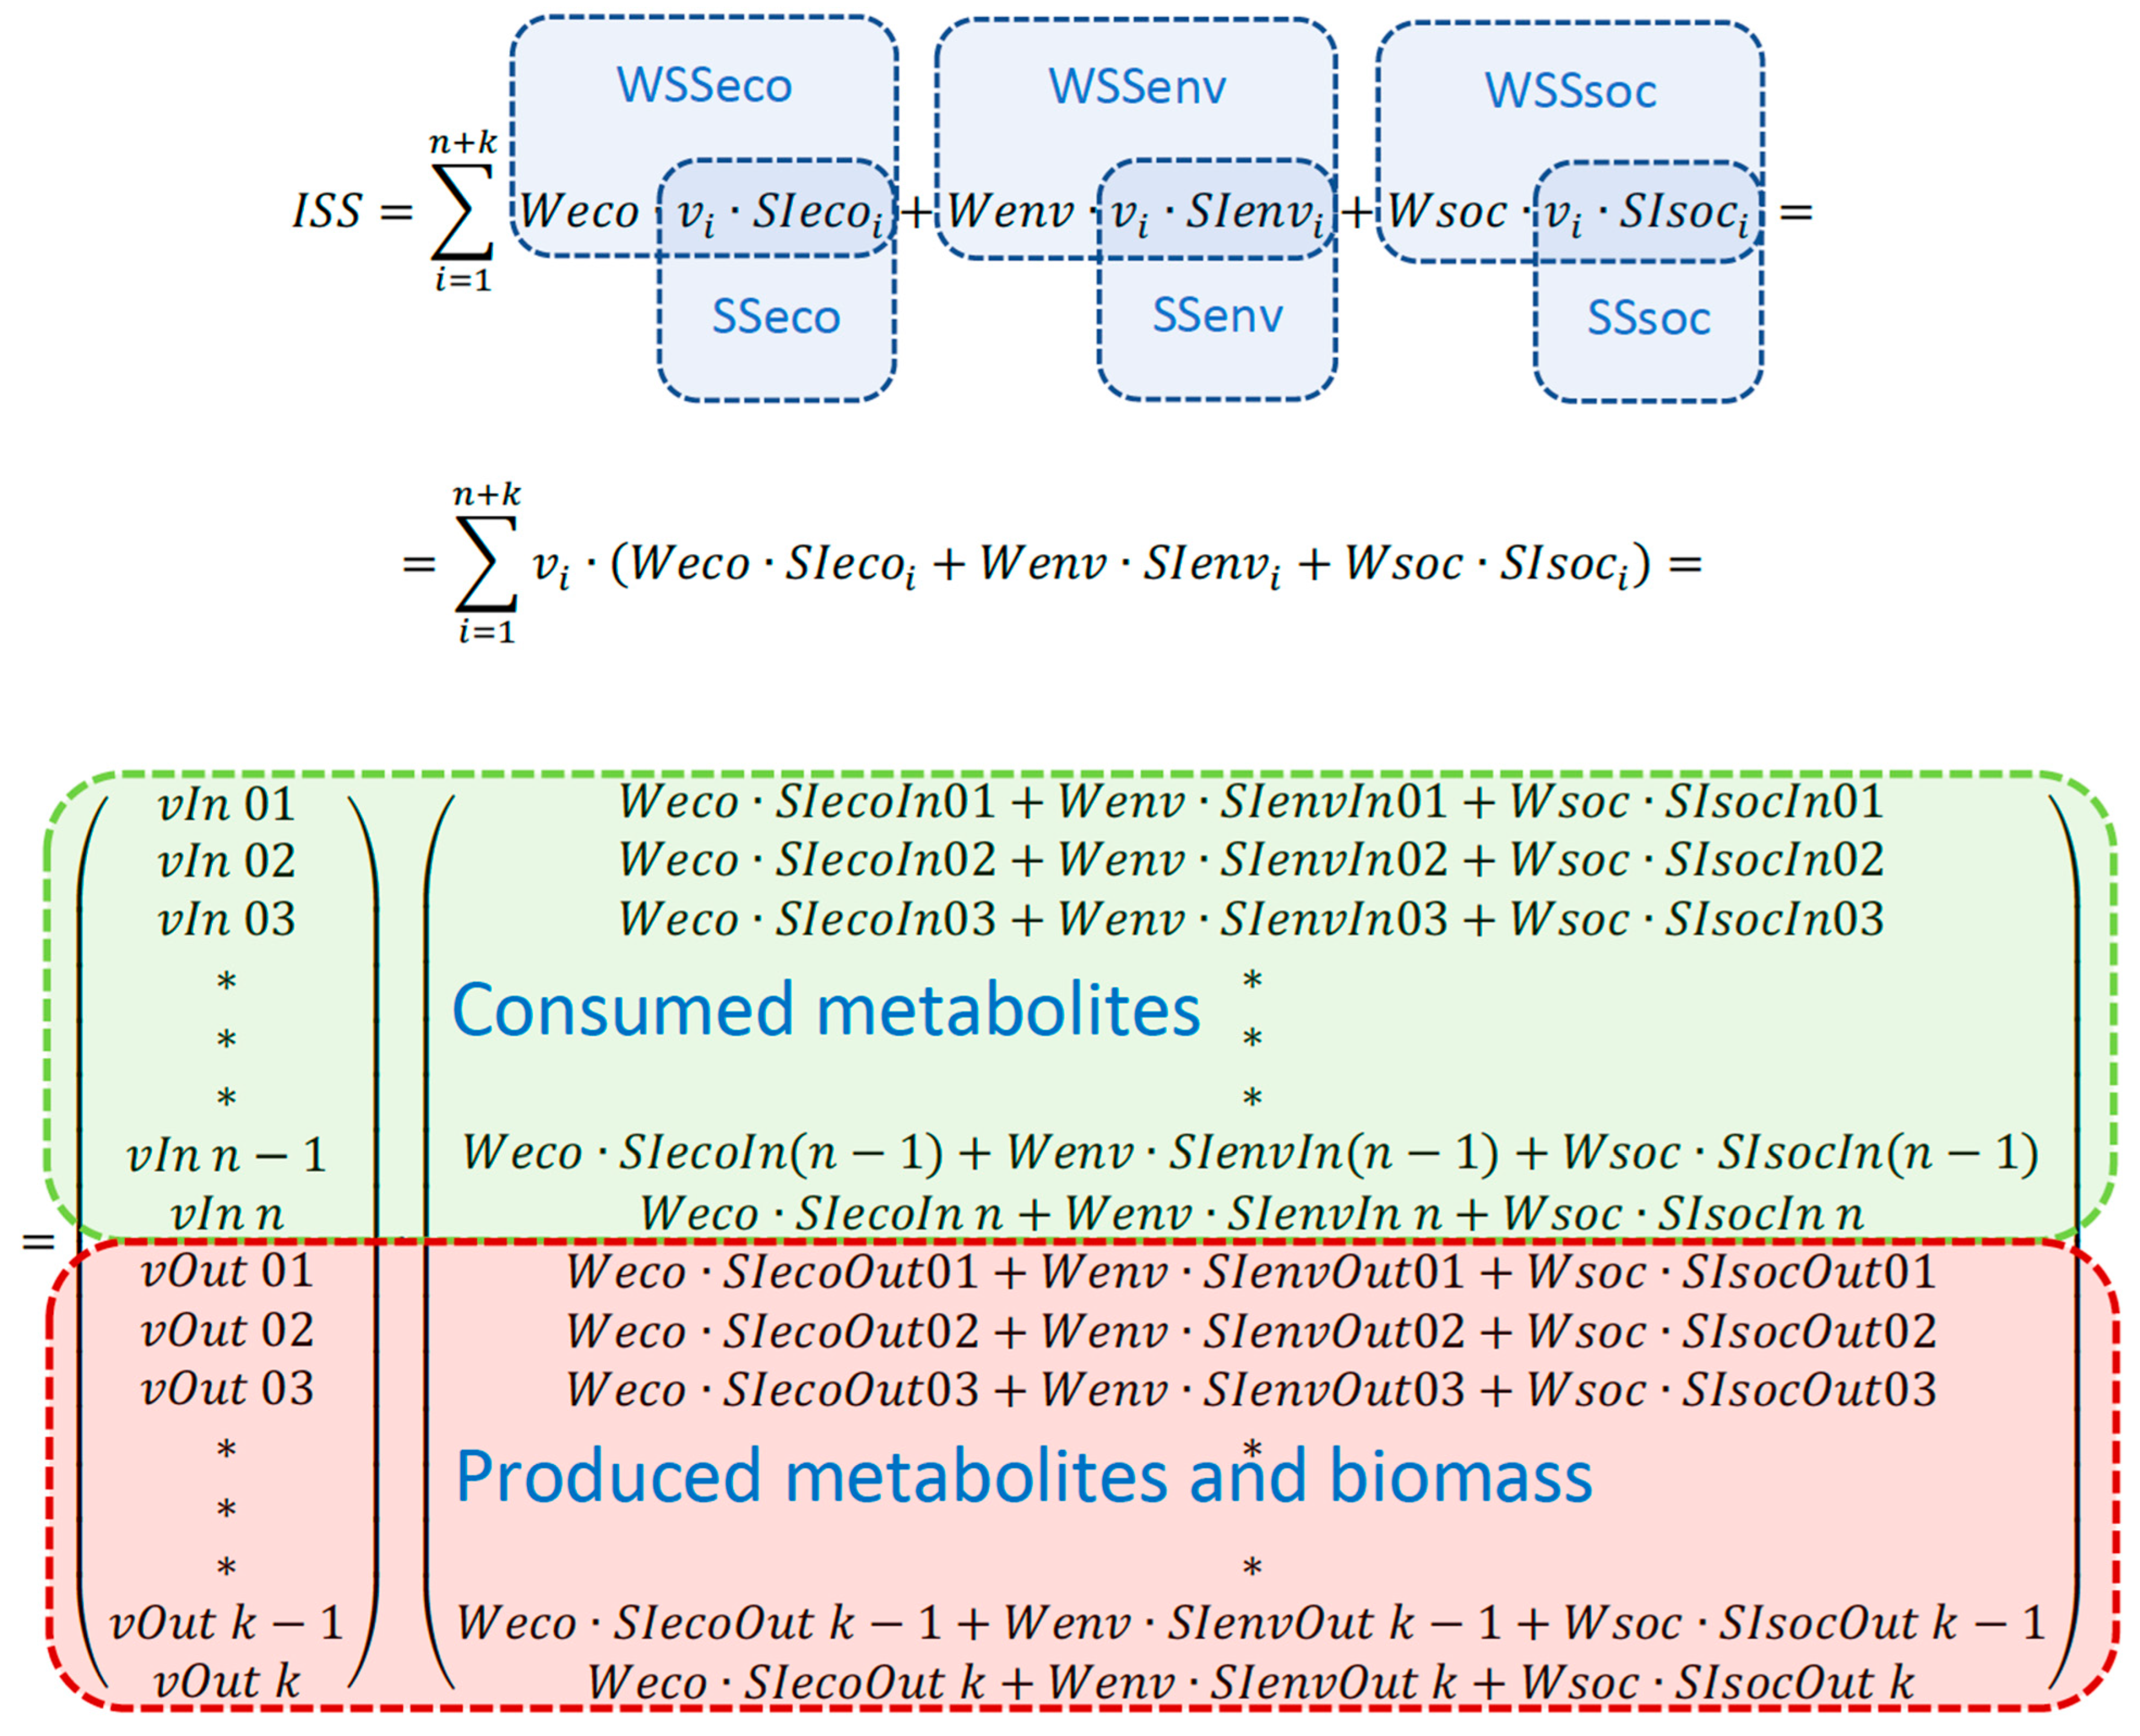
The sustainability-characterizing objective function is named the integrated sustainability score (ISS), underlining the fact that ISS integrates the values of three sustainability components, each of which may be a subject of detailed calculations and analysis. ISS is introduced as a weighed sum of the economic, environmental and social components of sustainability (
Figure 1).
The weights can be used to bring the sustainability scores to the same unit and/or to change the priority or importance of one sustainability component over the others.
The sustainability indicators (SI) of each produced and/or consumed metabolite are stored in three SI vectors—one for each sustainability component: economic, environmental and social (
Figure 1). Sustainability indicators (for example, price and environmental impact) can be assigned to a particular metabolite exchange flux. Should a part of a sustainability score be not related to a particular metabolite, it can be added for the whole design (for instance, the social impact of genetically modifying an organism cannot be related to a flux of a particular metabolite). A mathematical representation of ISS calculation and the main terms used in calculations are depicted in
Figure 1.
2.2. Calculation of Sustainability Indicators (SI)
To merge economic, environmental, and social impacts in one parameter, these impacts either need to share a common measurement unit or they need to be scaled with weights to create an arbitrary unit of measurement. In this study, all SI were reduced to a monetary value. Using a monetary value for sustainability assessment has been suggested previously [
15,
16]. The same measurement unit for all three sustainability components enables the application of dimensionless weight coefficients. All of them were set to “1”, assigning equal importance to economic, environmental and social sustainability components in this study.
Most of the data used for SIeco and SIenv vector calculations were gathered from the BREW project [
17]. The cost and environmental impact of malic acid production were gathered from the technoeconomic analysis of Bharathiraja et al. [
18]. The prices for the products were gathered from the website
www.chemanalyst.com during the 4th quarter of 2022. The economic impact was calculated through subtracting the production cost of a product from the price. The unit used for the economic impact of each metabolite was USD/mmol. After the economic impact was found for the metabolites, they were matched to exchange reactions using Kegg database IDs [
19].
A monetary value was also used for the environmental impacts as suggested by Ögmundarson et al. [
16]. Although environmental impact consists of many factors, in this study only 2 of these factors were assessed—non-renewable energy use (NREU) and land use. To create the environmental impacts of the assessed metabolites, several assumptions were made. It was assumed that one disability-adjusted life year (DALY) is equivalent to USD 100,000 [
15] and that lost species years are equal to USD 65,000 [
20]. For environmental assessment, the non-renewable energy consumption and land use from the BREW project [
17] were converted to DALYs and species years, respectively. It was assumed that land use of 1 ha is equivalent to 2.5 × 10
–9 lost species years [
21]. These were then converted to USD, as previously mentioned. The energy consumption was first converted to CO
2 equivalent assuming that 111.39 kg of CO
2 is generated to make 1 GJ of energy (
https://www.epa.gov/energy/greenhouse-gases-equivalencies-calculator-calculations-and-references (accessed on 2 December 2022)). Then, the CO
2 equivalent was converted to DALYs, assuming that 1 kg of CO
2 is equal to 6.20 × 10
–7 DALYs [
22].
Among the eight aspects of the social dimension of sustainability proposed by von Geibler and colleagues [
23], five aspects do not depend on the characteristics of the used strain; therefore, they were not taken into account. The remaining three, (1) health and safety, (2) employment and (3) product acceptance and social benefit, are dependent on the strain design; however, only the factor of employment was quantified in this study, because the remaining two have the same values for all designs. In terms of “Health and safety”, the design of the strain can involve hazardous substances that can be avoided or reduced through selecting the organism or engineering it. However, we could not identify any exchange metabolites used in the case study of the
E. coli model as particularly hazardous. Hazardous substances might be involved in the downstream processes of some products; however, a detailed study of the chemicals involved in these processes is out of scope for this study. The “Product acceptance and social benefit” aspect is assumed to be equal for all designs, because all of them involve genetic modifications. To assess the “Employment” aspect of different products, the number of created workplaces was taken into account, assuming that every EUR 150,000 of turnover per year creates one workplace [
24] and that the average salary is EUR 33,500 per year (the average European salary) [
25]. Therefore, the social aspect in this study was calculated as the salary gained by the working population when a product is produced. The price of the product was used to determine the turnover. This is different from the economic indicator calculation, where the possible profit is calculated through subtracting costs from the price.
The model was allowed to consume glucose as a carbon source. NH
4+ and SO
4−2 were used to supply other nutrients. Glucose, NH
4+ and SO
4−2 are consumed—as opposed to produced, as other metabolites are—so the only variable for its economic impact is their price, which was gathered from
www.chemanalyst.com (accessed on 2 December 2022), as mentioned previously. In the case of NH
4+ and SO
4−2, the price of (NH
4)
2SO
4 was used, which was divided by the mol mass proportion to get the price for NH
4+ and SO
4−2. The environmental and social impacts of glucose, NH
4+ and SO
4−2 were not taken into account due to similar consumption among designs.
2.3. Sustainable Metabolic Engineering of E. coli as a Case Study
Escherichia coli has been used for calculations due to the availability of data and metabolic models. Genome-scale metabolic model (GSMM) iML1515 [
26] has been selected for the case study. The sustainability indicators of each metabolite consumed and produced were matched with the exchange reactions of
iML1515. The ISS value (
Figure 1) was used in the objective function for design evaluation and ranking. The model was set to anaerobic growth through setting the oxygen exchange reaction bounds to 0. All the other exchange reactions were left unchanged; therefore, glucose was used as the substrate at a consumption rate of 10 mmol/gDW/h.
The SME approach has been implemented using COBRA toolbox [
27] for calculations, while Paint4net [
28] and IMFLer [
29] were used for visualisation. The optimization was run with
iML1515, allowing the deletions of genes that were determined as non-essential by Baba et al. [
30].
2.4. Design Development with Genetic Algorithms
To create designs using sustainability as an objective function,
optGene [
31] was used as a growth-coupling framework. Genetic algorithms use populations of individuals, which can mutate and evolve, to maximize a score which is derived from a fitness function [
32]. In the case of
optGene, each individual is a design that consists of either reactions or genes to be deleted. The default fitness function of
optGene calculates the minimal production rate of a desired reaction at the maximum growth rate of a design. To create the designs in this publication,
optGene was modified to work with the ISS as an objective function. The obtained objective function was introduced into the
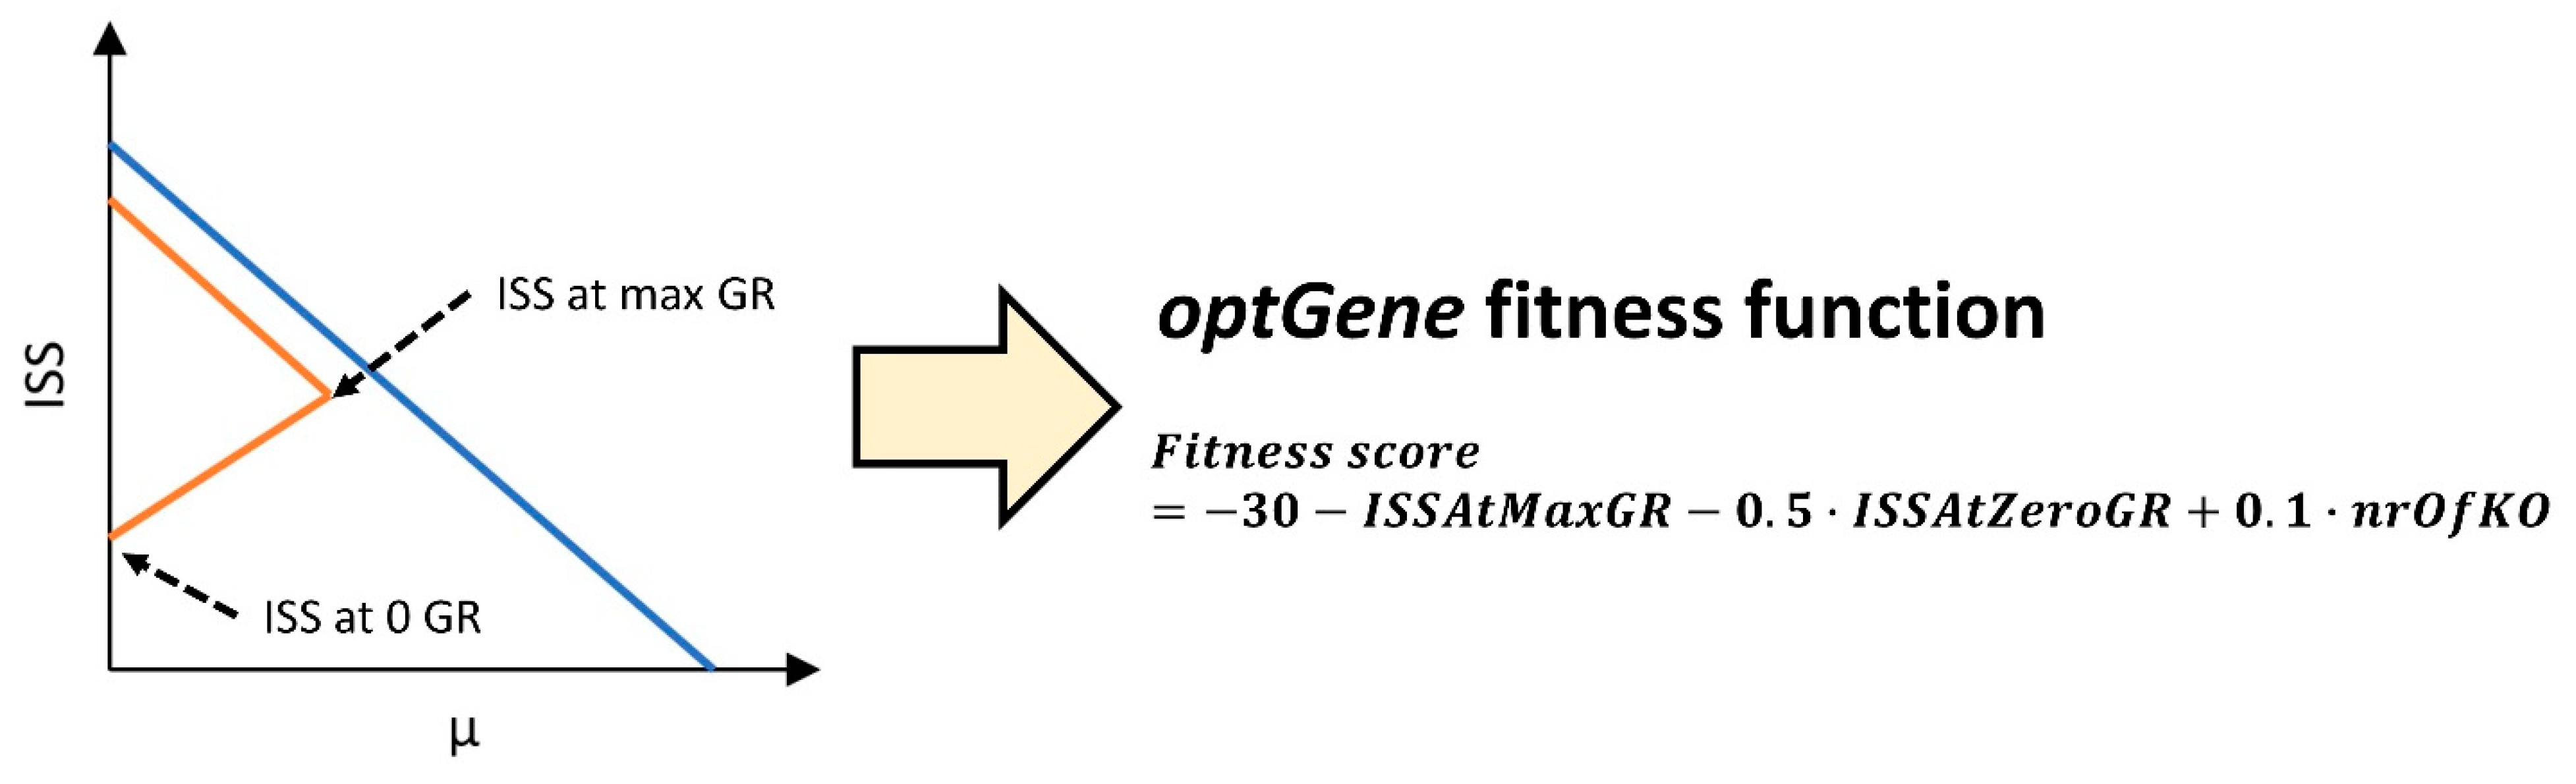
optGeneFitnessTilt.m function as a global variable, where it was used to assess the fitness score of individual designs from the population. The fitness score was calculated using the minimal sustainability values at the minimal and maximal growth-rates of a design. To limit the use of unnecessary knockouts, the number of knockouts was used to negatively impact the fitness score. The fitness score of an individual was derived from Equation (1):
where
ISSAtZeroGR is the integrated sustainability score at minimal growth-rate,
ISSAtMaxGR is the integrated sustainability score at maximal growth-rate and
nrOfKO is the number of knockouts in a design.
The ISS values used in the
optGene fitness function are visualized in
Figure 2. It should be noted that
optGene is designed to minimize the fitness score; therefore, the negatives of the ISS are used. The subtraction of 30 from the fitness score is used to make all the individuals from the population have a negative fitness score, because the minimal sustainability of a design can be a negative value, therefore making the fitness score positive. It was found that when positive fitness scores are allowed, the genetic algorithm task stagnates, as
optGene assigns a fitness score of 0 to designs which cannot obtain growth. This, in turn, can make the fittest individuals at the start of the optimization process the ones who are infeasible. Because mostly the fittest individuals are used to create the next populations, the process stagnates.
optGene was also modified to return the hash table of all the generated designs, so that not only the fittest design is accessible after the optimization, but also other less fit designs can be analysed.
In the SME approach, the objective function is ISS instead of product or biomass. Therefore, the selection of target products is an outcome of optimization determined via the way a product can improve the three components of sustainability.
A maximum of 7 gene deletions were allowed in the
E. coli (
Section 2.2.) use case. The
optGene task was run until stagnation was achieved, which took around 2 h. The SME implementation code in MATLAB (R2020a) is available online at
https://github.com/lv-csbg/SME_code (accessed on 2 December 2022).
3. Results
3.1. Integrated Sustainability Score as an Objective Function for Sustainable Metabolic Engineering
To assess sustainability using genome-scale metabolic models (GSMMs), the flux of each exchange reaction can be multiplied by a corresponding value, which signifies the sustainability when the metabolite is either produced or consumed. This value should come from the economic, environmental and social indicators from the production or consumption of the metabolite and is called the sustainability indicator (SI) [
4]. The objective function of a GSMM (the
c vector of a COBRA model structure) holds a value for each reaction in the model, which during optimization (COBRA
optimizeCbModel.m function) is multiplied by the corresponding reactions’ flux and summed together. Thus, if the objective function holds coefficients for the sustainability impact of exchange reactions, sustainability can be assessed.
Sustainability indicator values for different metabolite products were created as described in the Methods Section.
Table 1 shows the SI values; the economic, environmental and social indicators that make up this coefficient and the corresponding metabolites. The environmental and economic impacts are mostly made up of the downstream processing of the exchange products. The highest sustainability impact of a product, as seen in
Table 1, is for malic acid and the lowest is for lactic acid. The only carbon substrate in
Table 1 is glucose, which also has a low SI value that is composed only of its economic impact. The SI of glucose is positive; however, when glucose is consumed as a substrate, its exchange reaction has a negative value. Therefore, during optimization with the sustainability objective function, glucose has a negative impact on the optimization value. The opposite can be said about CO
2, which has a negative SI comprising its environmental impact.
The sustainability indicator values for the metabolites from
Table 1 were matched with their corresponding exchange reactions to calculate the ISS (
Figure 1). The sustainability objective function was used with the COBRA model structure and optimized with the
optimizeCbModel.m COBRA function to obtain the ISS. The objective value returned represents sustainability in USD per gram of biomass per hour. Through changing the bounds of the biomass reaction, values for the minimum and maximum sustainability at specific growth rates can be obtained. Thus, a sustainability envelope can be obtained instead of the traditional production envelope (
Figure 2). Furthermore, this sustainability envelope can be used to rank growth-coupled designs according to the features of the production envelope. Designs are ranked according to the envelope fitness function (Equation (1),
Figure 2).
3.2. Sustainable Metabolic Engineering Designs
Through using the created sustainability objective function together with the genetic algorithm framework optGene, metabolic engineering designs were obtained. The advantage of using optGene instead of other growth-coupling software is the ability to use different properties of the GSMM designs in the fitness function. In this study, the fitness function of optGene was modified according to Equation (1) (see Methods). A maximum of seven knockouts were allowed. The fitness score includes a penalty for the number of gene knockouts so that designs with marginally better or the same sustainability scores, which require more gene knockouts, are less fit.
Thousands of designs have been generated and ranked according to Equation (1). All the top designs produce succinate as the main product. The first 9000 designs are very similar with regard to their sustainability envelope characterizing parameters (see the first 1000 designs in
Supplementary Table S1). The high number of similar alternatives arises because of the combinatorial explosion of different deleted gene combinations that result in the interruption of the same metabolic reaction or pathway yielding the same sustainability parameters. The high number of alternatives enables the selection of the most convenient gene deletion set. Starting from rank 9000, the designs start to become slightly different (see the 9000–10,000 ranked designs in
Supplementary Table S2). The hash table containing all the evaluated designs and their fitness scores is also available as
Supplementary File S1). In
Table 2, designs ranked 1st, 9025nd and 9031st are compared with the
E. coli wild type.
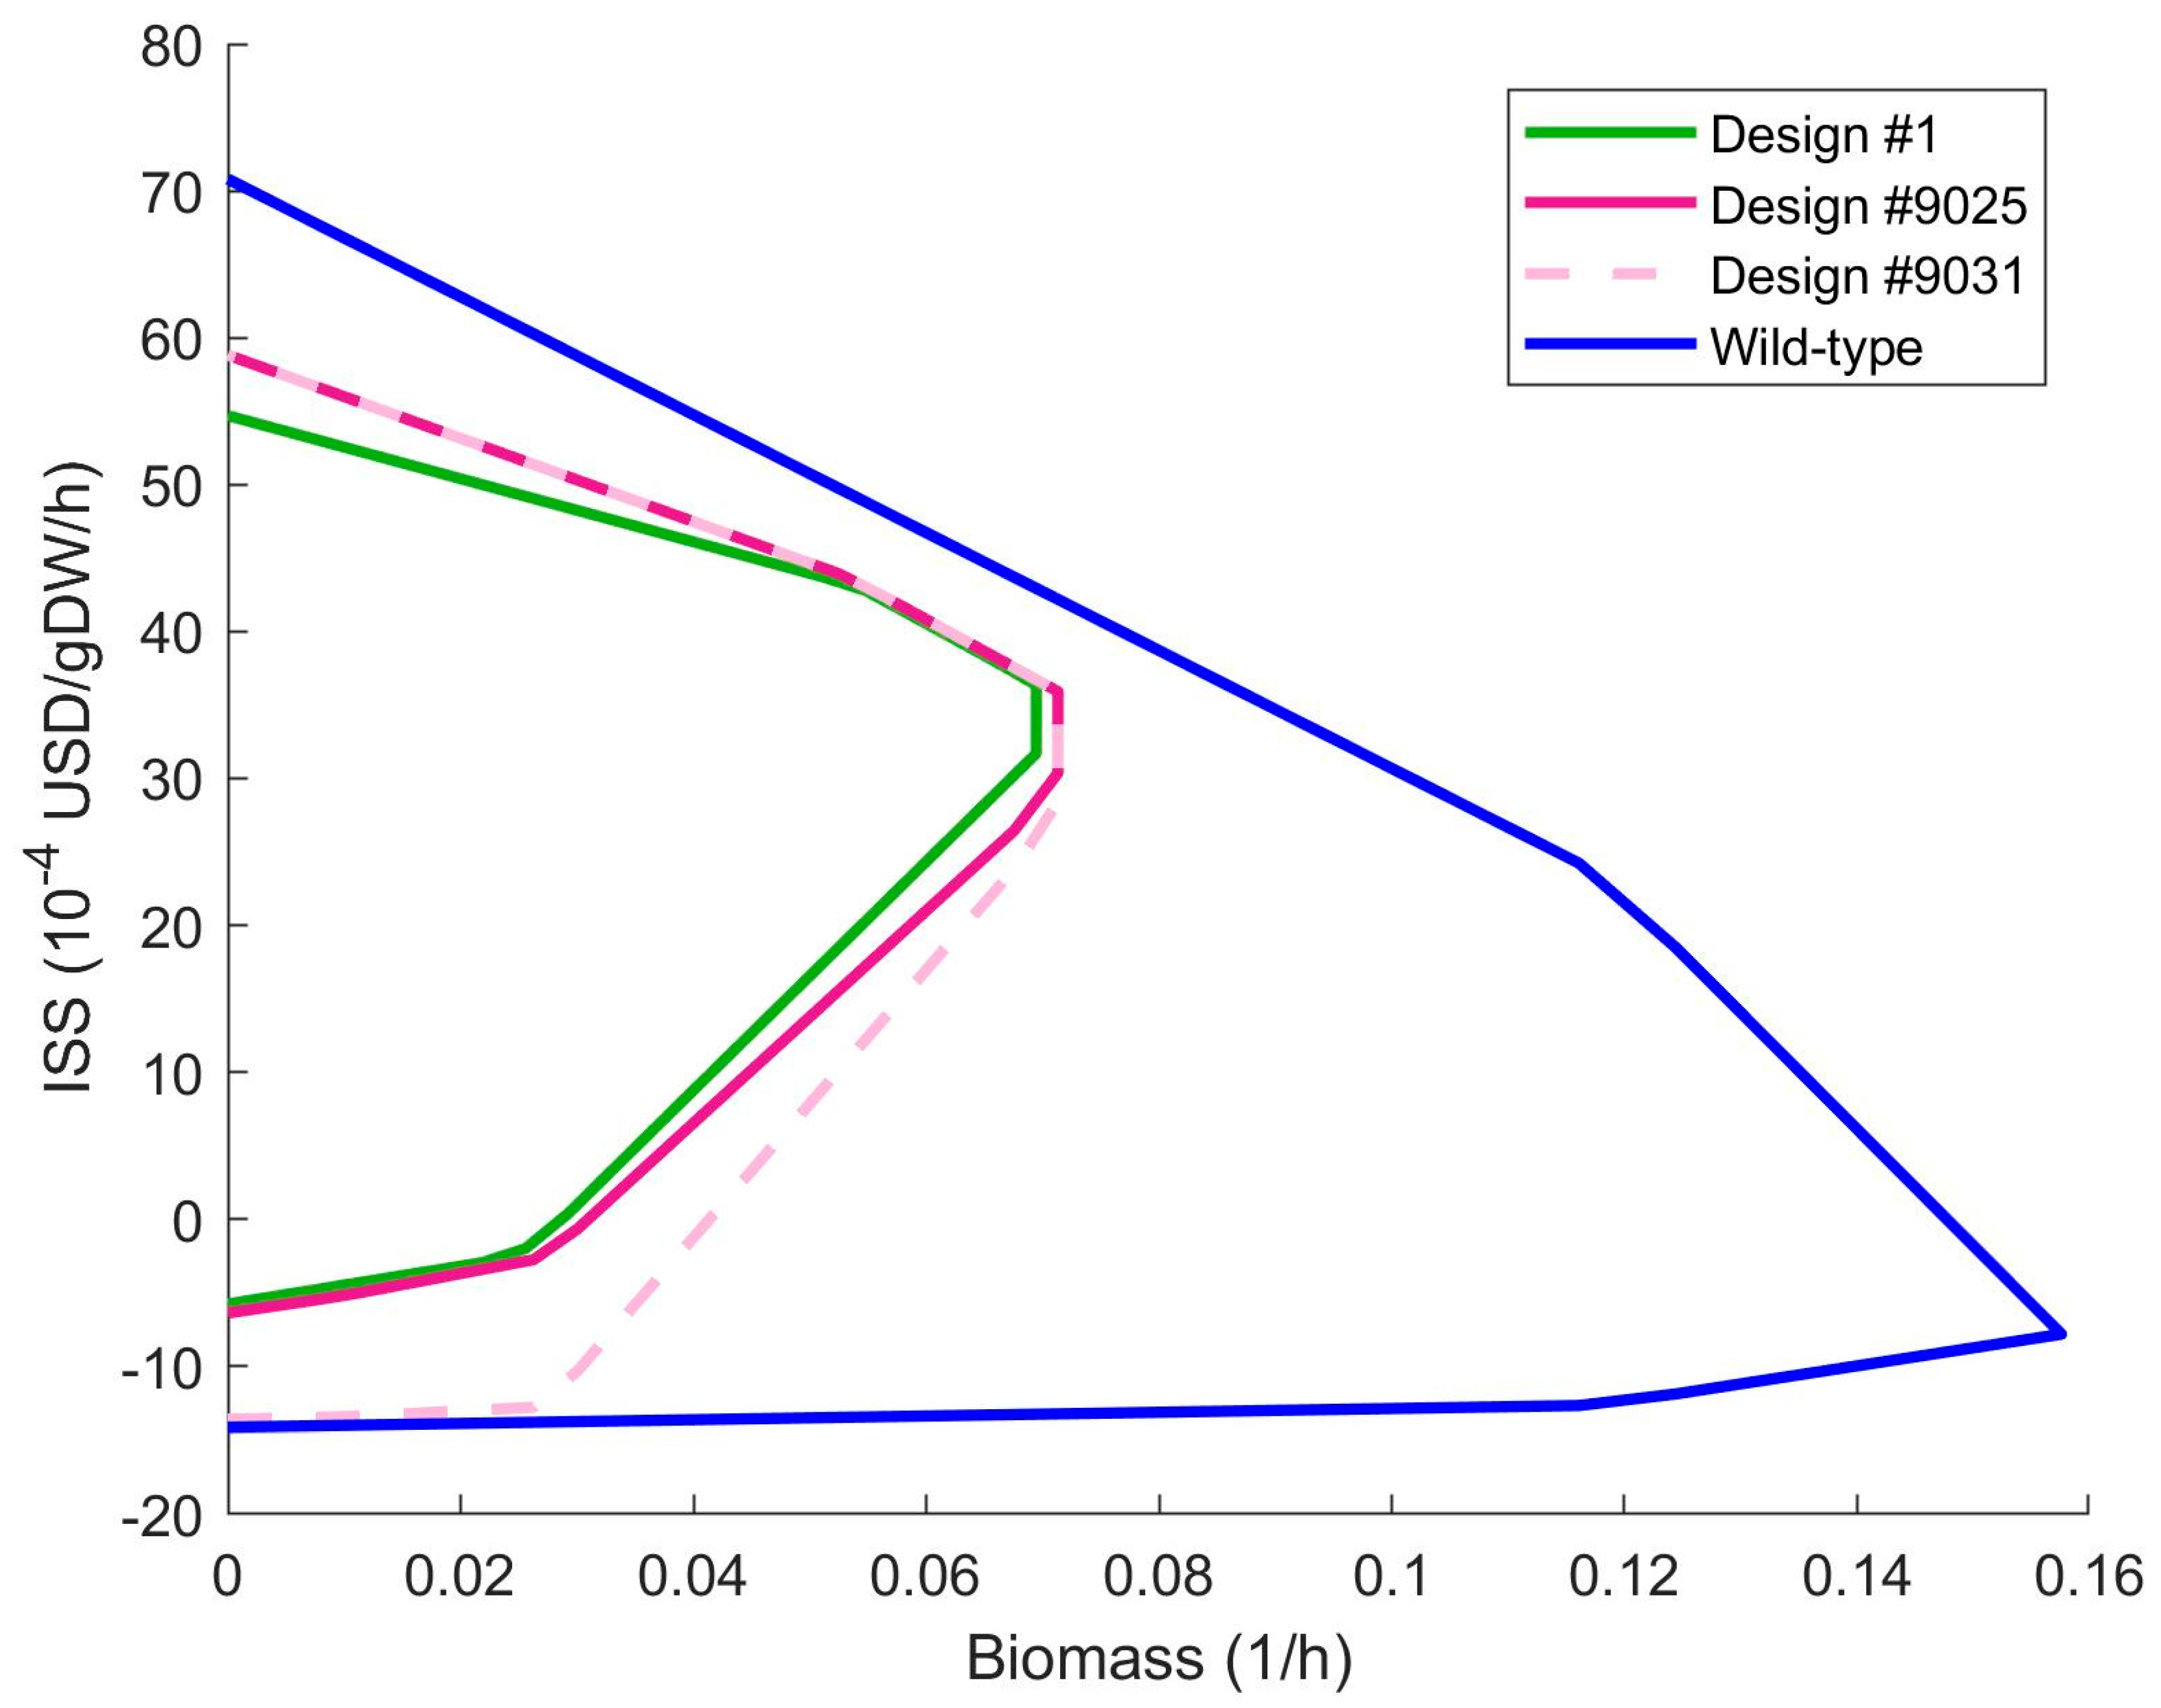
The sustainability envelopes of designs #1, #9025, #9031 and wild type are shown in
Figure 3. The envelopes of the designs are quite similar and differ greatly from the wild type. The ISS at maximal and zero growth-rate of design #1 are higher than the same values for designs #9025 and #9031. Design #9031 uses only two gene deletions but designs #1 and #9025 use three and seven gene deletions, respectively. The benefits of the designs should be weighed against the difficulties of implementation. These similar envelopes suggest that the gene deletion cost in the fitness function (Equation (1)) could be increased if the extra deletions seem to offer results which are not worth the implementation.
Although succinate is the main contributor to the ISS for the three designs, the ISS is made up from exchange fluxes that have reaction sustainability coefficients assigned to them. In
Table 3, The active exchange reactions and their impact on the ISS are shown for design #1 at maximal growth. Design #1 produces not only succinate but also ethanol, although at a lower rate. Extracting both ethanol and succinate from the medium could be considered if possible.
4. Discussion
A method for assessing and optimizing sustainability at early strain design stages according to the sustainable metabolic engineering (SME) concept using GSMM has been demonstrated. The use of a complex objective function together with genetic algorithms within the framework of growth-coupled production allows optimization of economic, environmental and social sustainability during in silico metabolic engineering design development. Generally, the SME mission is finding the best combination of available variables: organism, substrate, product and metabolic engineering interventions. As a result, the mentioned variables, which are usually pre-defined during the design of biotechnological production, become instruments of sustainability improvement in the case of SME.
SME can also be useful when choosing the best production process for a specific industrial setting, substrate, organism or product. That means some SME task-setting variables are fixed. To implement that, the sustainability related features of fixed variables should be artificially improved via correction of corresponding SI values. The list of candidate organisms can be limited by the number of models made available for the algorithm.
In the current study, the main aim was to practically demonstrate the implementation of SME in a simplified task setting. Therefore, only one organism (
E. coli) with a single substrate (glucose) was used with a limited number of exchange metabolites. For simplicity, insertions of reactions were not considered. Even this simple task setting resulted in a large number of designs, indicating the computational challenge if more degrees of freedom are enabled. The proposed approach has been applied in another study for sustainable design development to utilize amino acids of spent microbial biomass [
33].
The three pillars of sustainability—economic, environmental and social impact—were assessed for seven metabolites in a simplified way. Generally, simplified values for the first screening of designs using SME tools may be sufficient to identify the designs that stand out among the others with respect to great sustainability features. In the next stage, more accurate information about the key metabolites could be collected to assess a smaller number of designs with higher accuracy. For example, the environmental impact was assessed using only non-renewable energy use (NREU) and land use, which were then converted to monetary value. Life cycle analysis (LCA) could be used to better assess the environmental impact through including more impact categories, such as eutrophication, ecotoxicity and acidification [
34]. However, to gather more accurate sustainability coefficients for each metabolite, more specific information about the production process would be needed. The available information about different biotechnologically produced products varies in quality. For example, LCA information about lactic and succinic acid production is much more available than for 1,5-pentanediamine production, while the latter product itself is much more toxic to human health [
34,
35]. This again shows the complexity of early sustainability assessment during production design. The quantification of more social sustainability indicators than salary is not implemented during this study, because two other strain design-related parameters were equal for all designs: we did not use any dangerous metabolite in terms of health and safety and all designs contained genetic manipulations. Generally, SME is intended for the screening of design ideas, and the accuracy of SI data at SME stage is not critical, because a small number of most interesting designs should undergo more careful analysis using LCA, techno-economic analysis or other approaches.
Keeping all of this in mind, the point of this study is to show the framework of generating sustainable metabolic engineering designs, not the sustainability assessment values themselves. In other words, we demonstrate the calculation workflow where data is one of the inputs. Better quality input data will yield designs with more accuracy and reliability.
The optimization of E. coli showed that the sustainability indicators of products and the sustainability envelope of the wild-type organism do not predict the most sustainable product. The highest SI values in this study were for malic acid production. Malic acid was also found to be produced at the maximum sustainability points at different growth-rates for wild-type E. coli. However, after optimization, no design was found with malic acid as its main product in the top 1000 designs. Although the best designs might change when the SI values are altered, our findings suggest that it is not trivial to pick out which product will assure the best sustainability of design. In this study a framework of early stage sustainability assessment was shown; however, more research is needed to better assess the sustainability indicators of each product. Detailed and standardized LCA models are needed to properly assess the sustainability using a GSMM. A future perspective could be to use the by-product production as input values for LCA analysis instead of using values from already existing processes. This would mean that purification and waste management, for example, could be quantified using GSMM.
5. Conclusions
In this study, an integrated sustainability score is implemented as an objective function using genome-scale constraint-based metabolic modelling with an adapted version of the growth-coupling toolbox optGene. This implementation of sustainable metabolic engineering allows for the opportunity to change the weights of economic, environmental and social sustainability scores, which means that certain priorities can be adjusted if needed. The use of a growth coupling toolbox enables the simultaneous optimization of sustainability and flux variability reduction. With sustainability as an objective function, the selection of the main product(s) becomes one of the design factors and is not required prior to optimization.
To demonstrate the created framework, optimization of sustainability using the Escherichia coli genome-scale metabolic model iML1515 was performed. The best 10,000 designs were ranked according to sustainability. The resulting ranking contained many similar designs, which varied with respect to gene deletions but not other resulting parameters. This shows that many gene deletion combinations can have virtually the same impact on the metabolism of an organism. The best designs produced succinate as their main product. The use of ISS as an objective function creates a large solution space. To better deal with this large solution space, more sophisticated use of artificial intelligence could be helpful.
Several possible future improvements were identified for the SME framework, such as the incorporation of LCA models and more sophisticated categories for both environmental and social components of sustainability. This study is a starting point for further development of sustainability assessment and optimization in metabolic engineering.
Author Contributions
Conceptualization, R.M. and E.S.; methodology, E.S. and R.M.; software, R.M.; investigation, E.D. and R.M.; resources, E.S.; data curation, R.M. and E.D.; writing—original draft preparation, E.S. and R.M.; writing—review and editing, R.M., E.S. and E.D.; visualization, R.M.; supervision, E.S.; project administration, E.S.; funding acquisition, E.S. All authors have read and agreed to the published version of the manuscript.
Funding
This research has been supported by the European Regional Development Fund within the project No. 1.1.1.1/20/A/137 ‘‘Genome scale metabolic modelling linked bioreactor control system (GenCon)” and the University of Latvia project “Optimization of biotechnological processes for effective utilization of renewable resources” (Nr. Y5-AZ20-ZF-N-270).
Institutional Review Board Statement
Not applicable.
Informed Consent Statement
Not applicable.
Data Availability Statement
Conflicts of Interest
The authors declare no conflict of interest.
References
- Bennich, T.; Belyazid, S. The Route to Sustainability—Prospects and Challenges of the Bio-Based Economy. Sustainability 2017, 9, 887. [Google Scholar] [CrossRef] [Green Version]
- Chen, T.-L.; Kim, H.; Pan, S.-Y.; Tseng, P.-C.; Lin, Y.-P.; Chiang, P.-C. Implementation of Green Chemistry Principles in Circular Economy System towards Sustainable Development Goals: Challenges and Perspectives. Sci. Total Environ. 2020, 716, 136998. [Google Scholar] [CrossRef] [PubMed]
- Ramos, J.L.; Duque, E. Twenty-First-Century Chemical Odyssey: Fuels versus Commodities and Cell Factories versus Chemical Plants. Microb. Biotechnol. 2019, 12, 200–209. [Google Scholar] [CrossRef] [Green Version]
- Stalidzans, E.; Dace, E. Sustainable Metabolic Engineering for Sustainability Optimisation of Industrial Biotechnology. Comput. Struct. Biotechnol. J. 2021, 19, 4770–4776. [Google Scholar] [CrossRef]
- Gargalo, C.L.; Sin, G. Sustainable Process Design under Uncertainty Analysis: Targeting Environmental Indicators. Comput. Aided Chem. Eng. 2015, 37, 2579–2584. [Google Scholar] [CrossRef] [Green Version]
- Gargalo, C.L.; Cheali, P.; Posada, J.A.; Carvalho, A.; Gernaey, K.V.; Sin, G. Assessing the Environmental Sustainability of Early Stage Design for Bioprocesses under Uncertainties: An Analysis of Glycerol Bioconversion. J. Clean. Prod. 2016, 139, 1245–1260. [Google Scholar] [CrossRef]
- O’Brien, E.J.; Monk, J.M.; Palsson, B.O. Using Genome-Scale Models to Predict Biological Capabilities. Cell 2015, 161, 971–987. [Google Scholar] [CrossRef] [Green Version]
- Price, N.D.; Reed, J.L.; Palsson, B.Ø. Genome-Scale Models of Microbial Cells: Evaluating the Consequences of Constraints. Nat. Rev. Microbiol. 2004, 2, 886–897. [Google Scholar] [CrossRef]
- Gudmundsson, S.; Thiele, I. Computationally Efficient Flux Variability Analysis. BMC Bioinform. 2010, 11, 489. [Google Scholar] [CrossRef] [Green Version]
- Motamedian, E.; Berzins, K.; Muiznieks, R.; Stalidzans, E. OptEnvelope: A Target Point Guided Method for Growth-Coupled Production Using Knockouts. Biorxiv 2023. [Google Scholar] [CrossRef]
- von Kamp, A.; Klamt, S. Growth-Coupled Overproduction Is Feasible for Almost All Metabolites in Five Major Production Organisms. Nat. Commun. 2017, 8, 15956. [Google Scholar] [CrossRef] [PubMed] [Green Version]
- Klamt, S.; Mahadevan, R. On the Feasibility of Growth-Coupled Product Synthesis in Microbial Strains. Metab. Eng. 2015, 30, 166–178. [Google Scholar] [CrossRef]
- Oberhardt, M.A.; Palsson, B.O.; Papin, J.A. Applications of Genome-Scale Metabolic Reconstructions. Mol. Syst. Biol. 2009, 5, 320. [Google Scholar] [CrossRef]
- Fell, D.A.; Poolman, M.G.; Gevorgyan, A. Building and Analysing Genome-Scale Metabolic Models. Biochem. Soc. Trans. 2010, 38, 1197–1201. [Google Scholar] [CrossRef] [Green Version]
- Dong, Y.; Hauschild, M.; Sørup, H.; Rousselet, R.; Fantke, P. Evaluating the Monetary Values of Greenhouse Gases Emissions in Life Cycle Impact Assessment. J. Clean. Prod. 2019, 209, 538–549. [Google Scholar] [CrossRef]
- Ögmundarson, Ó.; Sukumara, S.; Herrgård, M.J.; Fantke, P. Combining Environmental and Economic Performance for Bioprocess Optimization. Trends Biotechnol. 2020, 38, 1203–1214. [Google Scholar] [CrossRef]
- Brew, G. Agreement I.G.-C.-2002-00014 Medium and Long-Term Opportunities and Risks of the Biotechnological Production of Bulk Chemicals from Renewable Resources. 2006. Available online: https://edepot.wur.nl/183326 (accessed on 6 June 2023).
- Bharathiraja, B.; Jayamuthunagai, J.; Sreejith, R.; Iyyappan, J.; Praveenkumar, R. Techno Economic Analysis of Malic Acid Production Using Crude Glycerol Derived from Waste Cooking Oil. Bioresour. Technol. 2022, 351, 126956. [Google Scholar] [CrossRef] [PubMed]
- Kanehisa, M.; Furumichi, M.; Sato, Y.; Kawashima, M.; Ishiguro-Watanabe, M. KEGG for Taxonomy-Based Analysis of Pathways and Genomes. Nucleic Acids Res. 2023, 51, D587–D592. [Google Scholar] [CrossRef] [PubMed]
- Weidema, B.P. Using the Budget Constraint to Monetarise Impact Assessment Results. Ecol. Econ. 2009, 68, 1591–1598. [Google Scholar] [CrossRef]
- Chaudhary, A.; Verones, F.; De Baan, L.; Pfister, S.; Hellweg, S. 11. Land Stress: Potential Species Loss from Land Use (Global; PSSRg). Transformation 2016, 1000. [Google Scholar] [CrossRef]
- Eckelman, M.J.; Sherman, J.D. Estimated Global Disease Burden from US Health Care Sector Greenhouse Gas Emissions. Am. J. Public. Health 2018, 108, S120–S122. [Google Scholar] [CrossRef]
- von Geibler, J.; Liedtke, C.; Wallbaum, H.; Schaller, S. Accounting for the Social Dimension of Sustainability: Experiences from the Biotechnology Industry. Bus. Strategy Environ. 2006, 15, 334–346. [Google Scholar] [CrossRef]
- Rafiaani, P.; Kuppens, T.; Van Dael, M.; Azadi, H.; Lebailly, P.; Passel, S. Van Social Sustainability Assessments in the Biobased Economy: Towards a Systemic Approach. Renew. Sustain. Energy Rev. 2018, 82, 1839–1853. [Google Scholar] [CrossRef]
- Eurostat New Indicator on Annual Average Salaries in the EU. Available online: https://ec.europa.eu/eurostat/web/products-eurostat-news/w/ddn-20221219-3 (accessed on 6 June 2023).
- Monk, J.M.; Lloyd, C.J.; Brunk, E.; Mih, N.; Sastry, A.; King, Z.; Takeuchi, R.; Nomura, W.; Zhang, Z.; Mori, H.; et al. IML1515, a Knowledgebase That Computes Escherichia Coli Traits. Nat. Biotechnol. 2017, 35, 904–908. [Google Scholar] [CrossRef]
- Heirendt, L.; Arreckx, S.; Pfau, T.; Mendoza, S.N.; Richelle, A.; Heinken, A.; Haraldsdóttir, H.S.; Wachowiak, J.; Keating, S.M.; Vlasov, V.; et al. Creation and Analysis of Biochemical Constraint-Based Models Using the COBRA Toolbox v.3.0. Nat. Protoc. 2019, 14, 639–702. [Google Scholar] [CrossRef] [PubMed] [Green Version]
- Kostromins, A.; Stalidzans, E. Paint4Net: COBRA Toolbox Extension for Visualization of Stoichiometric Models of Metabolism. Biosystems 2012, 109, 233–239. [Google Scholar] [CrossRef]
- Petrovs, R.; Stalidzans, E.; Pentjuss, A. IMFLer: A Web Application for Interactive Metabolic Flux Analysis and Visualization. J. Comput. Biol. 2021, 28, 1–12. [Google Scholar] [CrossRef]
- Baba, T.; Ara, T.; Hasegawa, M.; Takai, Y.; Okumura, Y.; Baba, M.; Datsenko, K.A.; Tomita, M.; Wanner, B.L.; Mori, H. Construction of Escherichia coli K-12 In-frame, Single-gene Knockout Mutants: The Keio Collection. Mol. Syst. Biol. 2006, 2, 2006-0008. [Google Scholar] [CrossRef] [Green Version]
- Patil, K.R.; Rocha, I.; Förster, J.; Nielsen, J. Evolutionary Programming as a Platform for in Silico Metabolic Engineering. BMC Bioinform. 2005, 6, 308. [Google Scholar] [CrossRef] [Green Version]
- Forrest, S. Genetic Algorithms. ACM Comput. Surv. 1996, 28, 77–80. [Google Scholar] [CrossRef]
- Stikane, A.; Baumanis, M.R.; Muiznieks, R.; Stalidzans, E. Impact of Waste as a Substrate on Biomass Formation, and Optimization of Spent Microbial Biomass Re-Use by Sustainable Metabolic Engineering. Fermentation 2023, 9, 531. [Google Scholar] [CrossRef]
- Ögmundarson, Ó.; Herrgård, M.J.; Forster, J.; Hauschild, M.Z.; Fantke, P. Addressing Environmental Sustainability of Biochemicals. Nat. Sustain. 2020, 3, 167–174. [Google Scholar] [CrossRef]
- Til, H.P.; Falke, H.E.; Prinsen, M.K.; Willems, M.I. Acute and Subacute Toxicity of Tyramine, Spermidine, Spermine, Putrescine and Cadaverine in Rats. Food Chem. Toxicol. 1997, 35, 337–348. [Google Scholar] [CrossRef] [PubMed]
| Disclaimer/Publisher’s Note: The statements, opinions and data contained in all publications are solely those of the individual author(s) and contributor(s) and not of MDPI and/or the editor(s). MDPI and/or the editor(s) disclaim responsibility for any injury to people or property resulting from any ideas, methods, instructions or products referred to in the content. |
© 2023 by the authors. Licensee MDPI, Basel, Switzerland. This article is an open access article distributed under the terms and conditions of the Creative Commons Attribution (CC BY) license (https://creativecommons.org/licenses/by/4.0/).


