Article

Layer Inoculation as a New Technology to Resist Volatile Fatty Acid Inhibition during Solid-State Anaerobic Digestion: Methane Yield Performance and Microbial Responses

1
State Key Laboratory of Sheep Genetic Improvement and Healthy Production, Xinjiang Academy of Agricultural Reclamation Sciences, 221 Wuyi Road, Shihezi 832000, China
2
Agro-Environmental Protection Institute, Ministry of Agriculture and Rural Affairs, 31 Fukang Road, Tianjin 300191, China
3
Key Laboratory of Low-Carbon Green Agriculture in North China, Ministry of Agriculture and Rural Affairs, Beijing 100193, China
4
Hangzhou Energy and Environmental Engineering Co., Ltd., 207 East Fengqi Road, Hangzhou 310020, China
*
Authors to whom correspondence should be addressed.
These authors contributed equally to this work.
Fermentation 2023, 9(6), 535; https://doi.org/10.3390/fermentation9060535
Submission received: 13 April 2023 / Revised: 26 May 2023 / Accepted: 29 May 2023 / Published: 31 May 2023
(This article belongs to the Special Issue Energy Converter: Anaerobic Digestion)

Abstract

:
Solid-state anaerobic digestion is easily inhibited by high volatile fatty acid induced by high total solids, although it is a promising technology. Previous studies on volatile fatty acid inhibition mainly focused on total solid content, co-digestion substrates, and external additives. The present study proposed a new inoculation method named layer inoculation and compared it to premixing inoculation in the solid-state anaerobic digestion of pig manure and maize straw. The results showed that the cumulative CH4 yields from layer inoculation (211.5 mL/g-VS) were 5.64 times more than premixing inoculation (37.5 mL/g-VS) under a low inoculation ratio (25%), with the values of total volatile fatty acid being greater than 30.0 mg/g. The concentrations of total VFAs and acetic acid from layer inoculation decreased dramatically during days 18–43. Layer inoculation also showed wider specific methane yield peaks and shorter startup times than premixing inoculation. Methanosphaerula and Methanothrix were the most dominant genera, while the genus Methanosphaerula did not correlate with volatile fatty acids, pH, or total ammonia nitrogen. The hydrogenotrophic methanogen pathway was predominant during solid-state anaerobic digestion; the shift from hydrogenotrophic to acetoclastic occurred in premixing inoculation, and it was stable in layer inoculation (61.20–68.88%). Overall, layer inoculation can effectively enhance methane production under high volatile fatty acid concentrations compared with premixing inoculation.

1. Introduction

China’s livestock sector has undergone significant transformation in recent decades since the country’s opening up, making it the world’s largest producer and consumer of livestock products [1]. A total of 3.8 billion tons of livestock manure and 900 million tons of crop residues are produced annually [2]. Anaerobic digestion (AD) is an appropriate method for converting biomass resources into biogas that is rich in methane. Had these wastes been utilized for AD, the biogas generated, potentially, would have been 4.23 × 10¹¹ m3 [3].
Based on the total solids (TS) content, AD can be categorized as liquid anaerobic digestion (L-AD, TS < 10%) and solid-state anaerobic digestion (Ss-AD, TS > 15%) [4]. This has an advantage over L-AD for a number of reasons, including smaller reactor volume, minimal material handling, and lower energy requirements for heating; however, the greatest advantage is that the digestate of Ss-AD is considerably easier to handle than the L-AD effluent because of the low moisture content in the former [5]. Therefore, although L-AD is still more commonly used, Ss-AD has gained increased attention in recent years and has proved to be promising. In Europe, Ss-AD capacity increased by 50% from 2010 to 2015 [6].
Despite the many advantages of Ss-AD, it has been widely observed that high total solids content presents an obstacle to liquid/gas mass transfer, causing a reduction in methanogenic degradation efficiency [7]. Xu et al. [8] reported that high TS increased the mass diffusion resistance and caused inhibition of hydrolysis and methanogenesis. As a result, the maximum volumetric production rate decreased from 1.2 to under 0.7 L CH4/day/L when TS increased from 18% to 28%. The same observations have been reported in other studies utilizing substrates such as cattle manure, municipal solid waste, and others, for digestion [9,10]. Lower moisture content also causes an accumulation of volatile fatty acids (VFAs), resulting in further inhibition of methanogen microbes [4,11]. Riya et al. [12] reported that biogas production declined whereas VFA accumulated and was inhibited by microbes when TS was higher than 28% in the Ss-AD of pig manure and rice straw.
Generally, inefficient methanization can be attributed to inadequate mass transfer and the accumulation of inhibitors, such as VFAs and ammonia [13]. To improve CH4 yield and process stability of Ss-AD, different strategies, such as the co-digestion of livestock waste with plant straw, vegetable waste, energy crops and others [14,15,16], the pretreatment of substrates to increase the accessibility of organic matter to microbes [17,18], and the optimization of the operation parameters, e.g., TS content, stirring frequency, and the feedstock-to-inoculum ratio [5,19,20], have been reported. Zhu et al. [21] compared the CH4 yields under conditions of partial premixing and complete premixing of feedstocks and inoculum. They found that premixing 50% of the inoculum and adding the remaining 50% to the top of the digester achieved almost the same CH4 yield as obtained with 100% premixing of feedstocks and inoculum. Leachate recirculation, also termed leachate percolation, is commonly used to enhance mass transfer via the redistribution of substrates, nutrients, and microorganisms [22]. However, leachate recirculation might be detrimental to methanogenesis, particularly when inhibitory compounds, such as ammonium and chloride, are present [23]. The continual percolation of leachate also results in a wetter digested product and makes the reduction in moisture content, as well as the stabilization and transport of the product, more difficult and economically unfeasible [5,10]. Thus far, preventing the accumulation of inhibitors and enhancing CH4 production during the Ss-AD of organic wastes need to be intensively investigated.
The present study focused on a new inoculation method that contained no premixing of feedstock and inoculum, named layer inoculation. It compared the methanogenic characteristics of premixing inoculation with layer inoculation in the Ss-AD of pig manure (PM) and maize straw (MS), explored the relationship between VFA accumulation and the inhibition of CH4 production, and investigated methanogenic microbial populations involved in the Ss-AD process. The findings of this study are expected to be beneficial for preventing VFA accumulation and improving the efficiency of Ss-AD, along with providing valuable information for further Ss-AD model research.

2. Materials and Methods

2.1. Substrates and Inoculum

Both PM and MS were collected from Yi Lilai Breeding Co., Ltd. (Xiqing district, Tianjin, China). The PM was intraday fresh manure that was delivered to the laboratory in a plastic bucket. MS was broken down into particles of nearly 1 mm in size. PM and MS were stored in a freezer at 4 ± 1 °C. The inoculum sludge was taken from a lab-scale solid anaerobic reactor, which was used for the anaerobic digestion of PM and MS at 35 °C. The characteristics of the substrates and inoculum sludge are shown in Table 1.

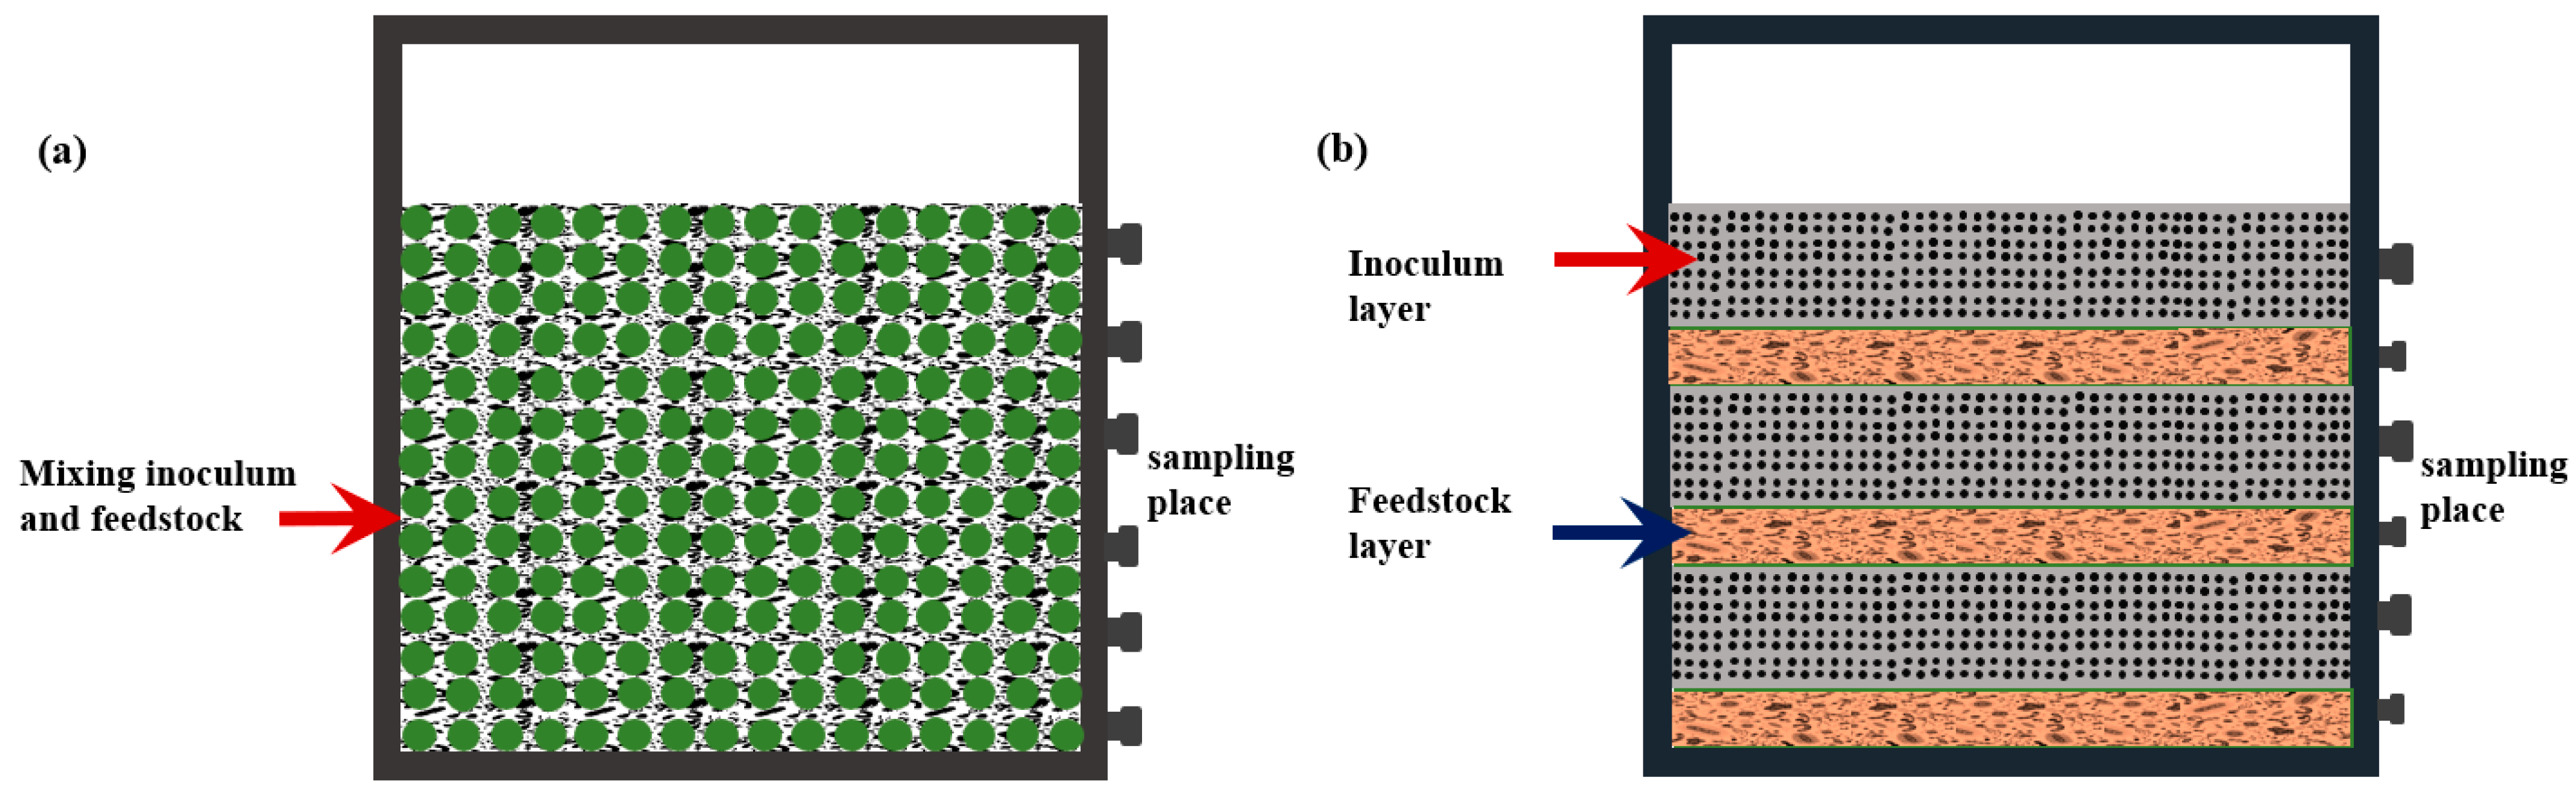
2.2. Experimental Design and Set-up

Batch digestion was carried out in vertical anaerobic reactors made of polymethyl methacrylate with a total volume of 23.6 L. The internal diameter and height of the reactors were 20 cm and 75 cm, respectively. The gas sample outlet was located at the head cover and the sampling outlets for digestate were situated around the cylinder of the reactors.
The experiments were conducted with three groups with different substrates and inoculation methods; each reactor was fed with a 10.2 kg mixture of feedstock and inoculum with an initial TS content of 20.3%. The reactors were tightly closed using rubber septa and screw caps. All treatments were conducted in triplicate. P, M, and L are the definitions of the three different treatment reactors. P means a reactor feeding the mixture of PM and inoculum. M means a reactor with PM and MS as the substrate; both the substrate and the inoculum were completely mixed. L is the reactor-feeding inoculum and substrate (PM + MS) present as layers without mixing. The details of the three treatments are shown in Table 2. A diagram of the premixing inoculation (P or M) and layer inoculation (L) devices are shown in Figure 1. The headspace of each reactor was purged with nitrogen gas for 5 min to assure anaerobic conditions prior to incubation at 25–35 °C. Biogas generated from each reactor was collected in a 20.0 L aluminum bag for production quantification and composition analyses on a daily basis. Digested samples were withdrawn through the top, middle, and bottom outlets of each reactor every 2 or 3 days.

2.3. Analytical Methods

Biogas volume was measured using a wet gas meter. Composition (CH4 and CO2 contents) was measured using gas chromatography (Thermo Trace-1300, Waltham, MA, USA) equipped with a thermal conductivity detector (TCD). The pH value, soluble chemical oxygen demand (SCOD), total ammonia nitrogen (TAN), TS, and VS were analyzed in accordance with the standard methods [24]. For analyzing VFAs (acetate, propionate, isobutyrate, butyrate, isovalerate, and valerate), the solid sample was diluted 10 times with distilled water, and then the pH was adjusted to approximately 3.0 with 5% H2SO4. The samples were centrifuged at 10,000× g rpm for 10 min, the supernatants were diluted 10 times with acetone and filtered using 0.22 µm filters and analyzed via gas chromatography (Thermo trace-1300, Waltham, MA, USA) equipped with an FID detector. The capillary column named M12 (30 m × 0.53 mm × 1 μm, Thermo) was used. Helium was used as the carrier gas at a constant flow rate of 8.0 mL/min. The initial oven temperature was 90 °C, which was held for 2 min and then increased by 5 °C/min to 150 °C. The temperatures of the injection port and the detector were 200 °C and 220 °C, respectively.

2.4. Microbial Diversity Analysis

2.4.1. Sample Collection

Biomass samples were collected in three repetitions on days 0, 13, 33, 45, and 78 based on the notable difference in the cumulative CH4 production, and immediately frozen at −80 °C. The samples were withdrawn from toward the top, middle, and bottom of the vertical part of the reactors.

2.4.2. Deoxyribonucleic Acid Extraction and Polymerase Chain Reaction Amplification

Total genomic deoxyribonucleic acid (DNA) was extracted from the biomass samples using the Fast DNAs Spin Kit for soil (MP Biomedicals, Santa Ana, CA, USA) according to the manufacturer’s protocols. The final DNA concentration and purification were determined using a NanoDrop 2000 UV-vis spectrophotometer (Thermo Scientific, Waltham, MA, USA). The extractions of the three technical repeats were mixed into a single DNA sample. The V3–V4 hypervariable regions of the archaea 16S rRNA gene were amplified with primers 349F (5′-CCCTACACGACGCTCTTCCGATCTN-3′) and 806R (5′-GACTGGAGTTCCTTGGCACCCGAGAATTCCA-3′). The thermal cycling for archaea consisted of initial denaturation at 97 °C for 1 min followed by 30 denaturation cycles at 97 °C for 10 s, annealing at 57 °C for 15 s, and extension at 72 °C for 15 s, with a final extension at 72 °C for 5 min. Polymerase chain reactions (PCRs) were carried out in 30 μL reaction mixtures containing 0.5 μM forward and reverse primers, 10–20 ng of template DNA, and 15 μL 2 × Taq master Mix (Takala, Dalian, China). The PCR products were extracted from 2% agarose gel and further purified using the AxyPrep DNA Gel Extraction Kit (Axygen Biosciences, Union, City, CA, USA) and quantified using QuantiFluor™-ST (Promega, Madison Wisconsin, WI, USA), according to the manufacturer’s protocols.

2.4.3. Illumina MiSeq Sequencing and Processing of Sequencing Data

Purified amplicons were pooled in equimolar and paired-end sequences (2 × 300) on an Illumina MiSeq platform (Illumina, San Diego, CA, USA), according to the standard protocols by Sangon Biotechnology Co., Ltd. (Shanghai, China). Raw fastq files were quality-filtered by Trimmomatic and merged by FLASH with the following criteria. (i) The reads were truncated at any site receiving an average quality score < 20 over a 50 bp sliding window. (ii) Sequences with an overlap longer than 10 bp were merged according to their overlap with a mismatch below 2 bp. (iii) Sequences of each sample were separated according to barcodes (exactly matching) and primers (allowing 2 nucleotides to mismatch), and reads containing ambiguous bases were removed. Operational taxonomic units (OTUs) were clustered with a 97% similarity cut-off using UPARSE with a novel ‘greedy’ algorithm that simultaneously performed chimera filtering and OTU clustering.

3. Results and Discussion

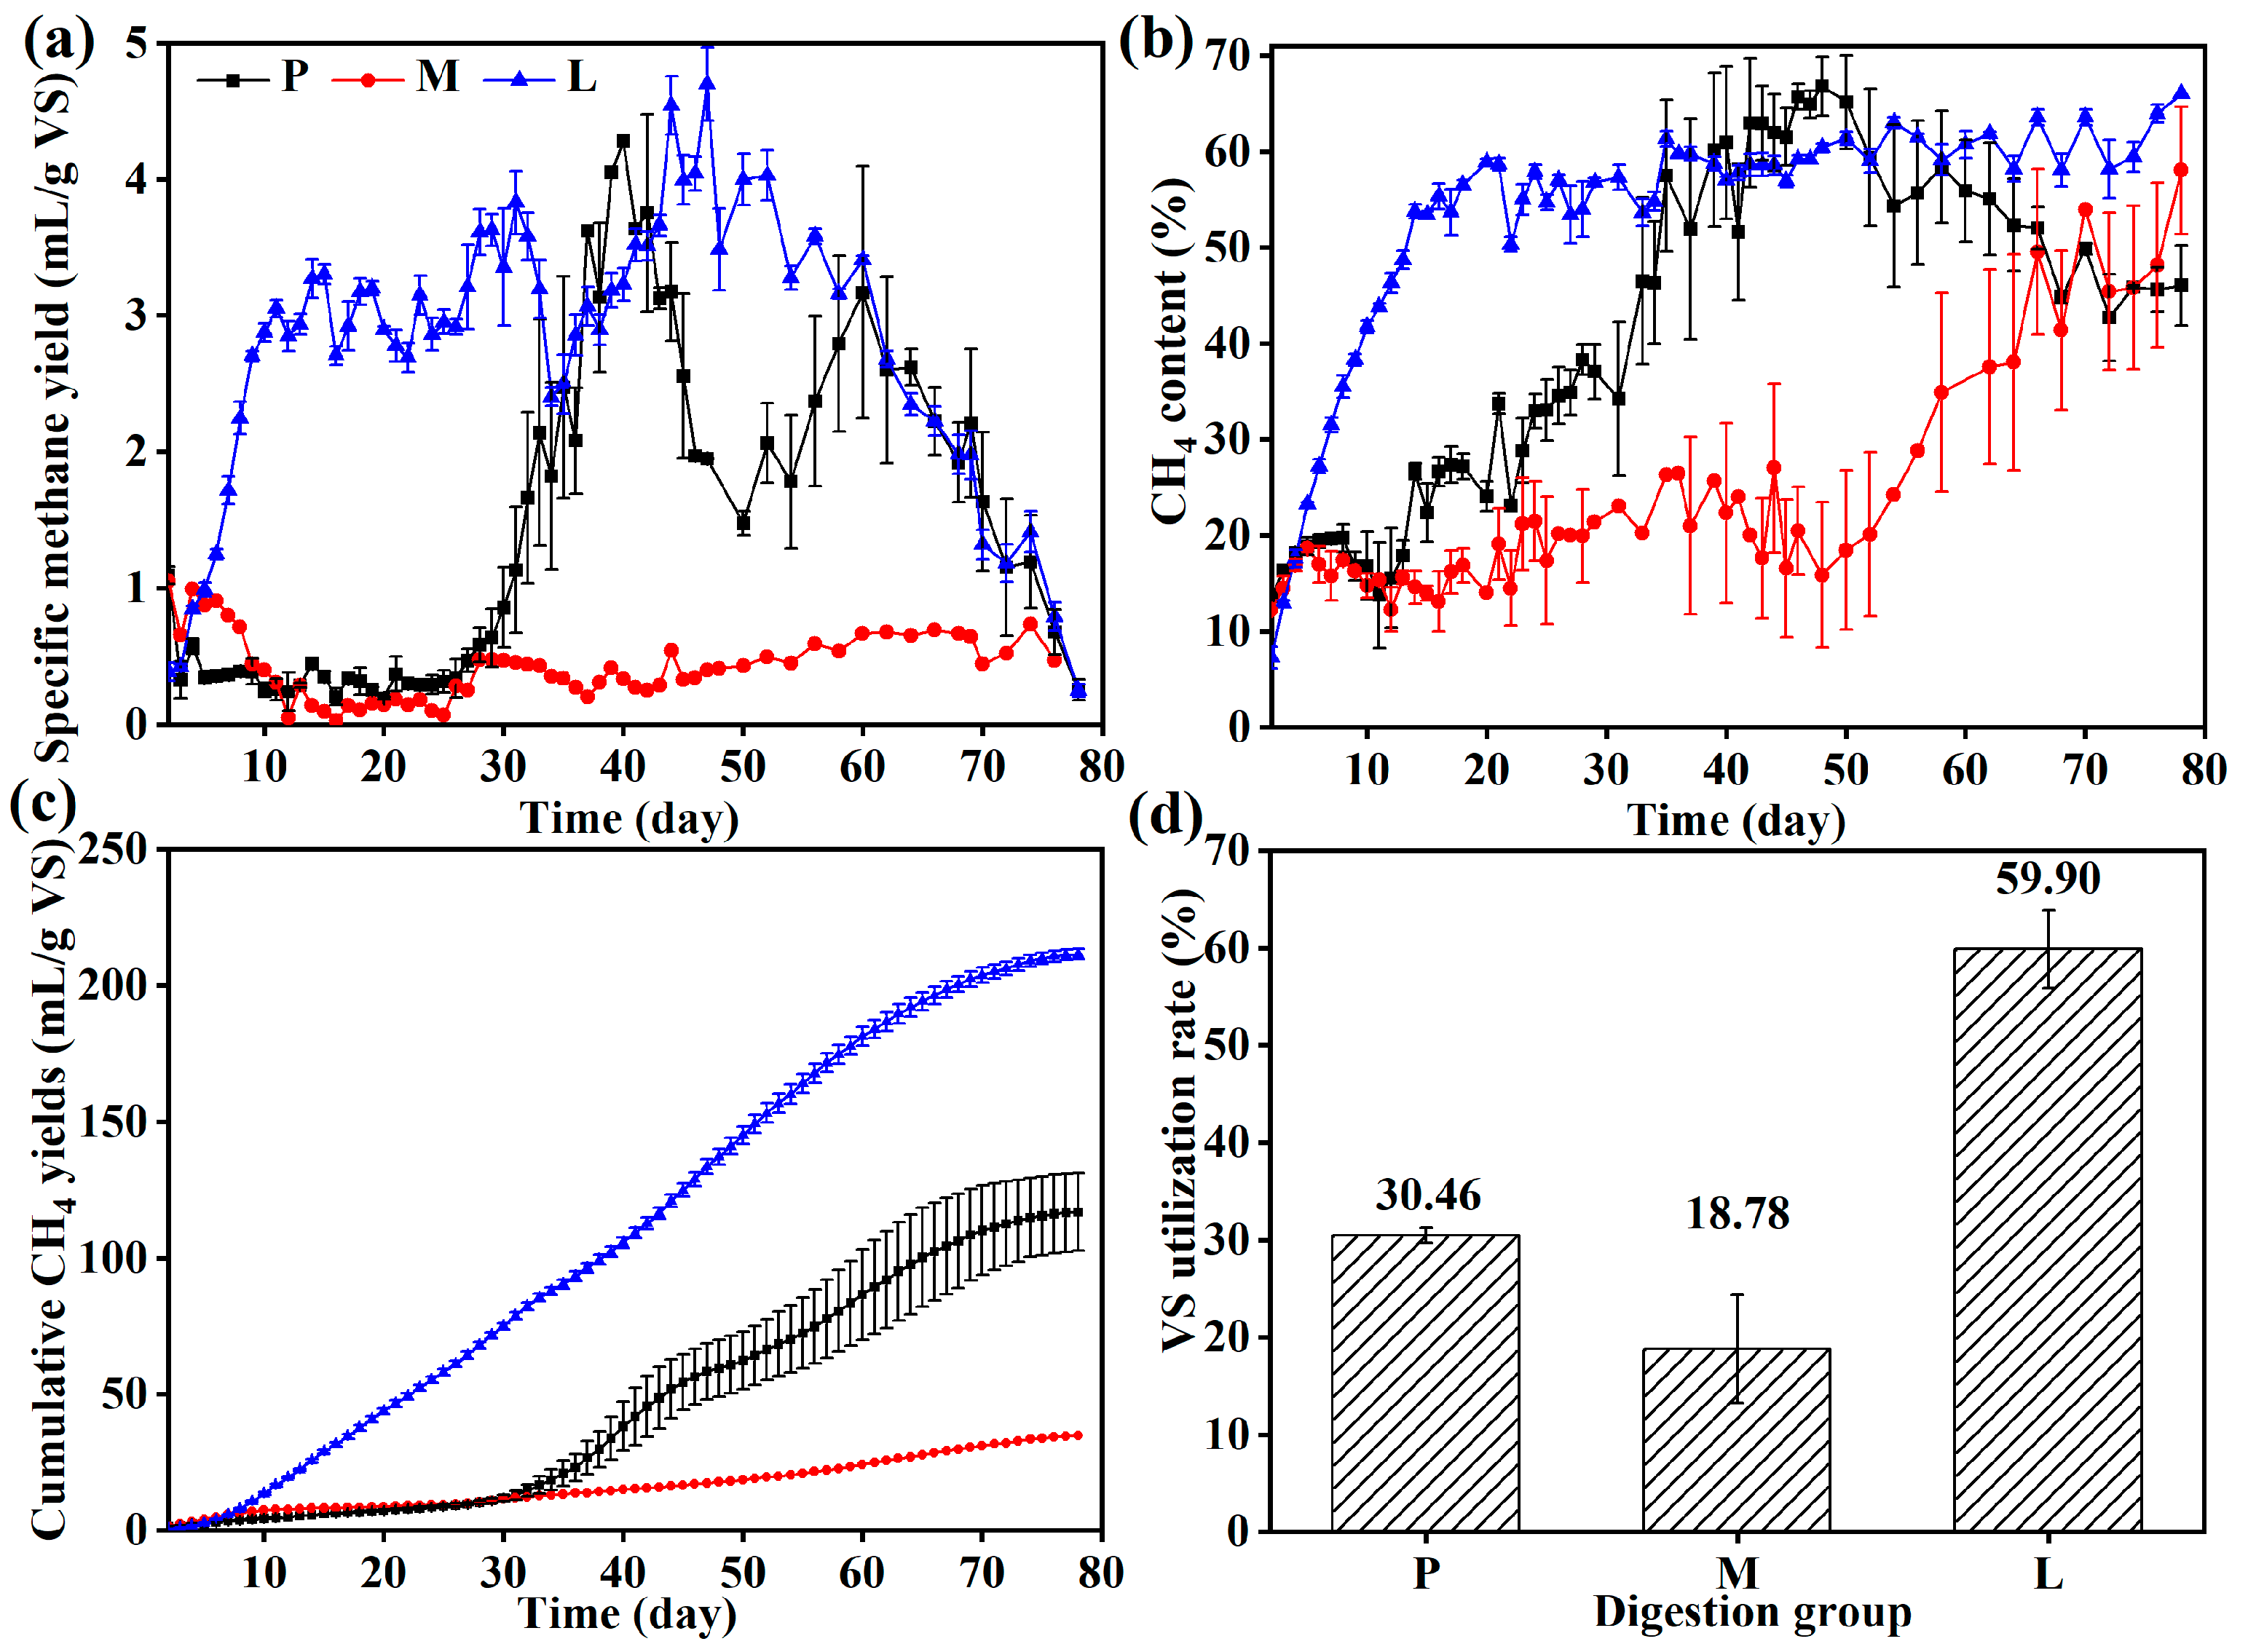
3.1. Solid-State Anaerobic Digestion Performance

The specific methane yield (SMY), methane content, and cumulative CH4 production in reactors P, M, and L during Ss-AD are shown in Figure 2. As evident, these parameters broadly reflect the changes in feedstock composition and inoculum method. The SMY of M was under 0.9 mL/g-VS during the whole experiment. The SMY of P increased from day 27 and two peaking values, at 4.3 and 3.2 mL/g-VS, appeared on day 40 and day 60, respectively. The SMY of L increased to 3.1 mL/g-VS on day 11; maximum SMY was reached on day 47 (4.7 mL/g-VS), and a relatively higher SMY was maintained for approximately 35 days. The CH4 content in biogas also indicated the stability and performance of Ss-AD. In L, the biogas CH4 content ranged from 50.3% to 66.0% after day 14; that of P increased gradually to 66.8% on day 48 and then decreased to 46.1% toward the end of the experiment. The CH4 content in M showed a rapid increase after 52 days of digestion and reached 58.1%. The cumulative yield of CH4 based on VS showed a significant difference in the three kinds of digesters. At the end of the experiment, the cumulative CH4 yields of L reached 211.5 mL/g-VS, which were 1.89 and 5.64 times higher than those of P (111.9 mL/g-VS) and M (37.5 mL/g-VS), and were slightly higher (201.9 mL/g-VS) than the AD of swine manure containing high solid content (TS = 8.9%) reported by [17]. Correspondingly, the converted efficiency of VS in reactor L (59.90%) was much higher than P (30.46%) and M (18.78%).
The performances of P and M indicated that the addition of maize straw in M increased the startup time and negatively affected CH4 production, even though several previous publications have reported that the co-digestion of manure with other organic substrates can enhance biogas production. This could be attributed to the addition of maize straw that improved the balance of C/N; therefore, accelerated hydrolysis and acidification and led to the accumulation and inhibition of intermediates, such as VFAs. Xie et al. [25] also attributed the reversible inhibition during the anaerobic co-digestion of pig manure with grass silage to the combinational effects of high concentrations of NH3, VFAs, and low pH values.
CH4 production in L was much higher than M even with the same substrate, which indicated that layer inoculation can lead to the consumption of VFAs over time, make the process run effectively, and reduce the startup time. This was consistent with the finding of [26], who premixed 50% of inoculum and feedstock and added the remaining inoculum as two layers in the Ss-AD of corn stover. The results showed that the CH4 yields of partially premixed digesters were 86 mL/g-VS, while those of completely premixed digesters were negligible at a feedstock-to-inoculum ratio of 4. Reactor L had a shorter delay period and a wider peaking time than P and M, indicating that layer inoculation achieved a balance between the production and consumption of intermediate products, such as VFAs, and accelerated methanization in the Ss-AD of pig manure and maize straw.

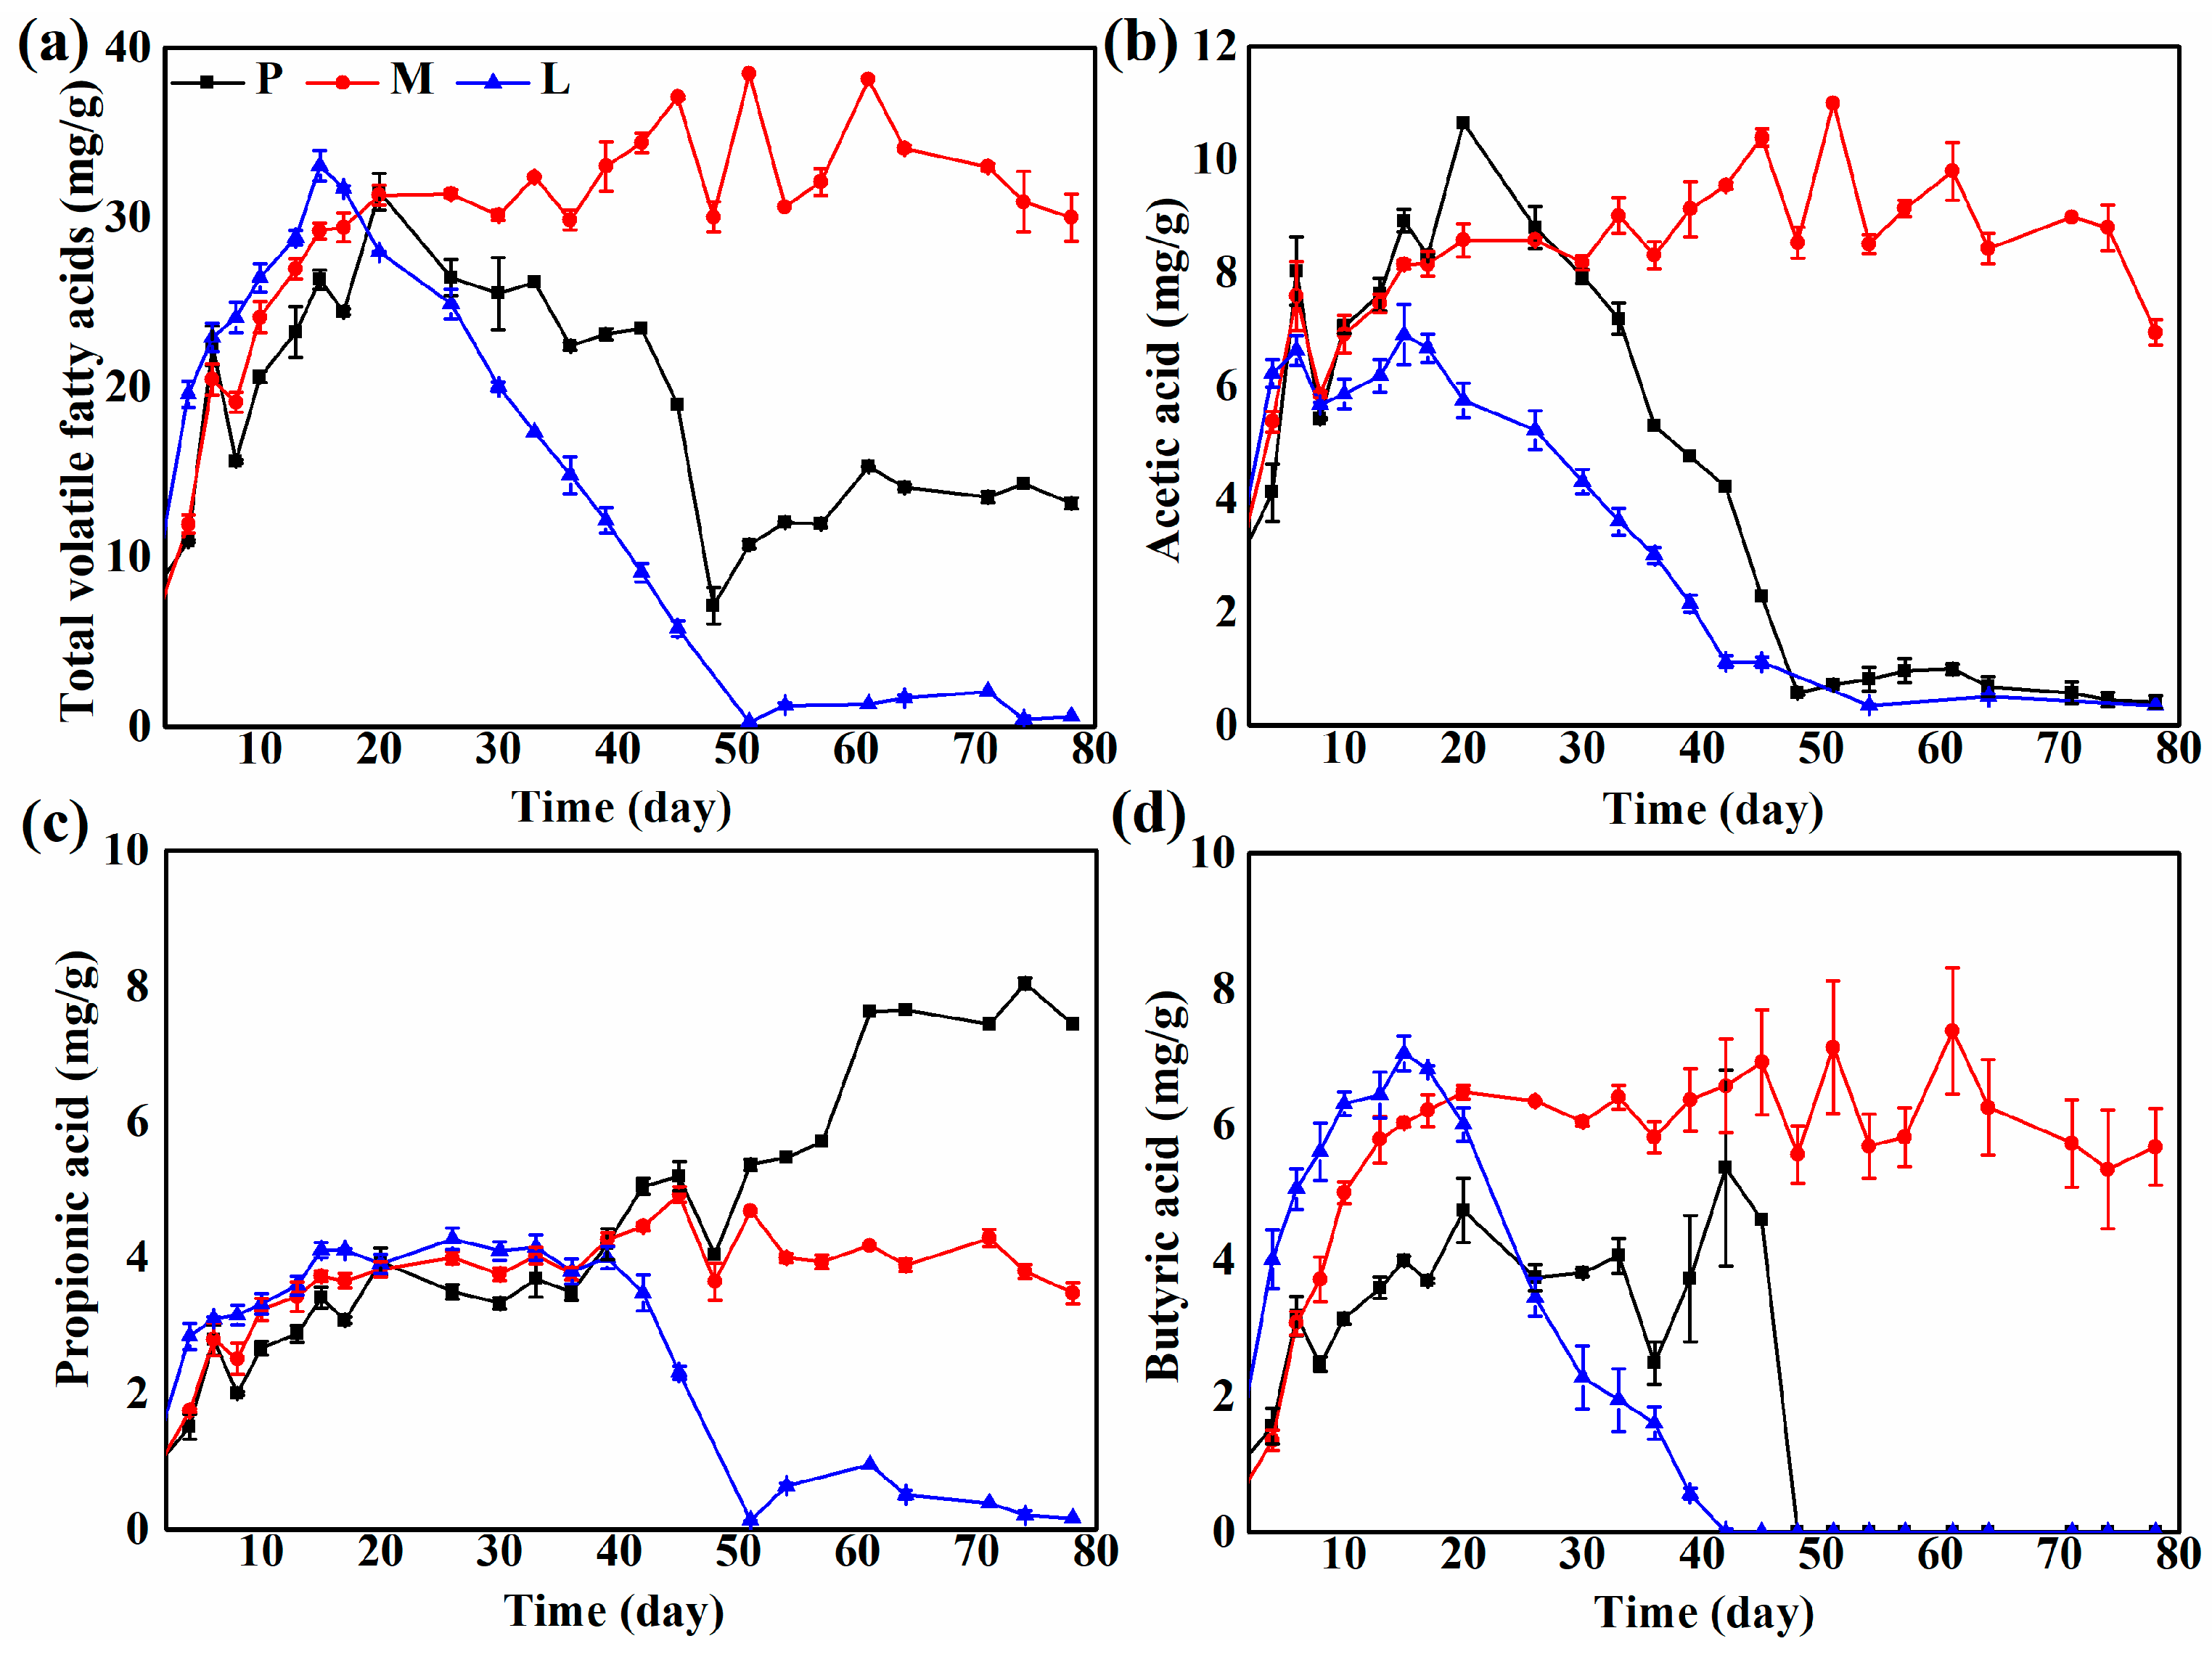
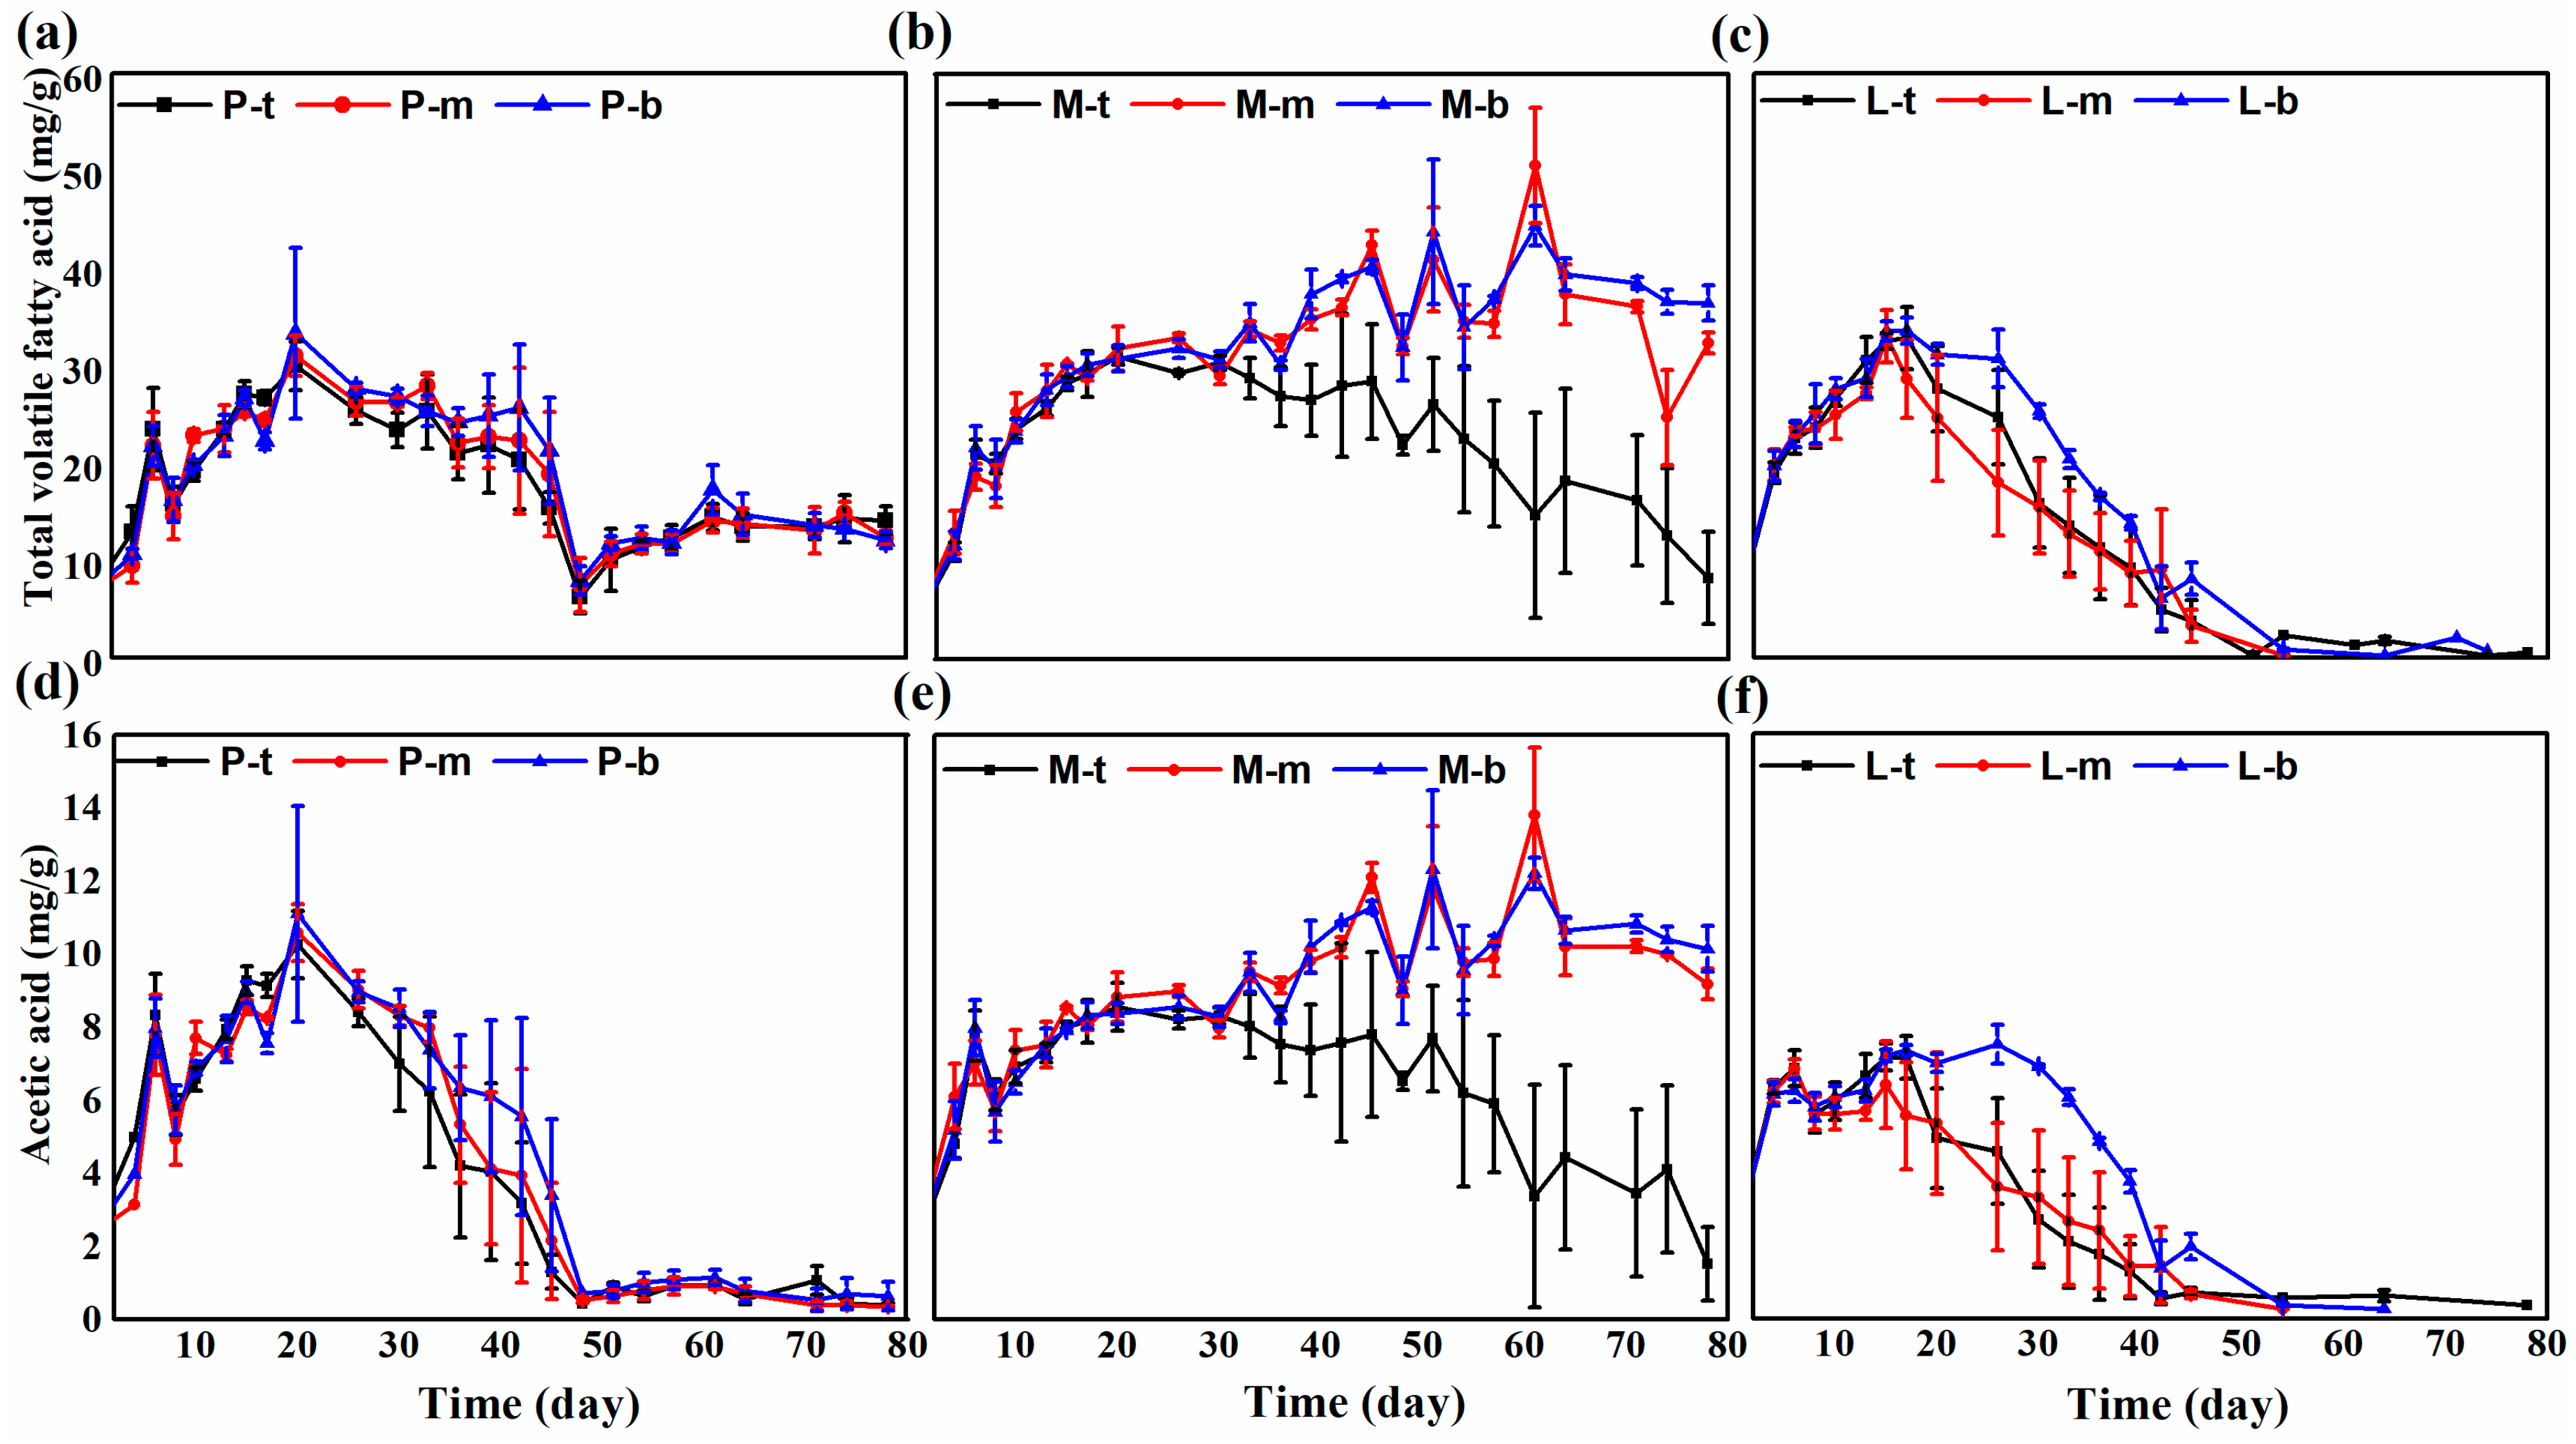
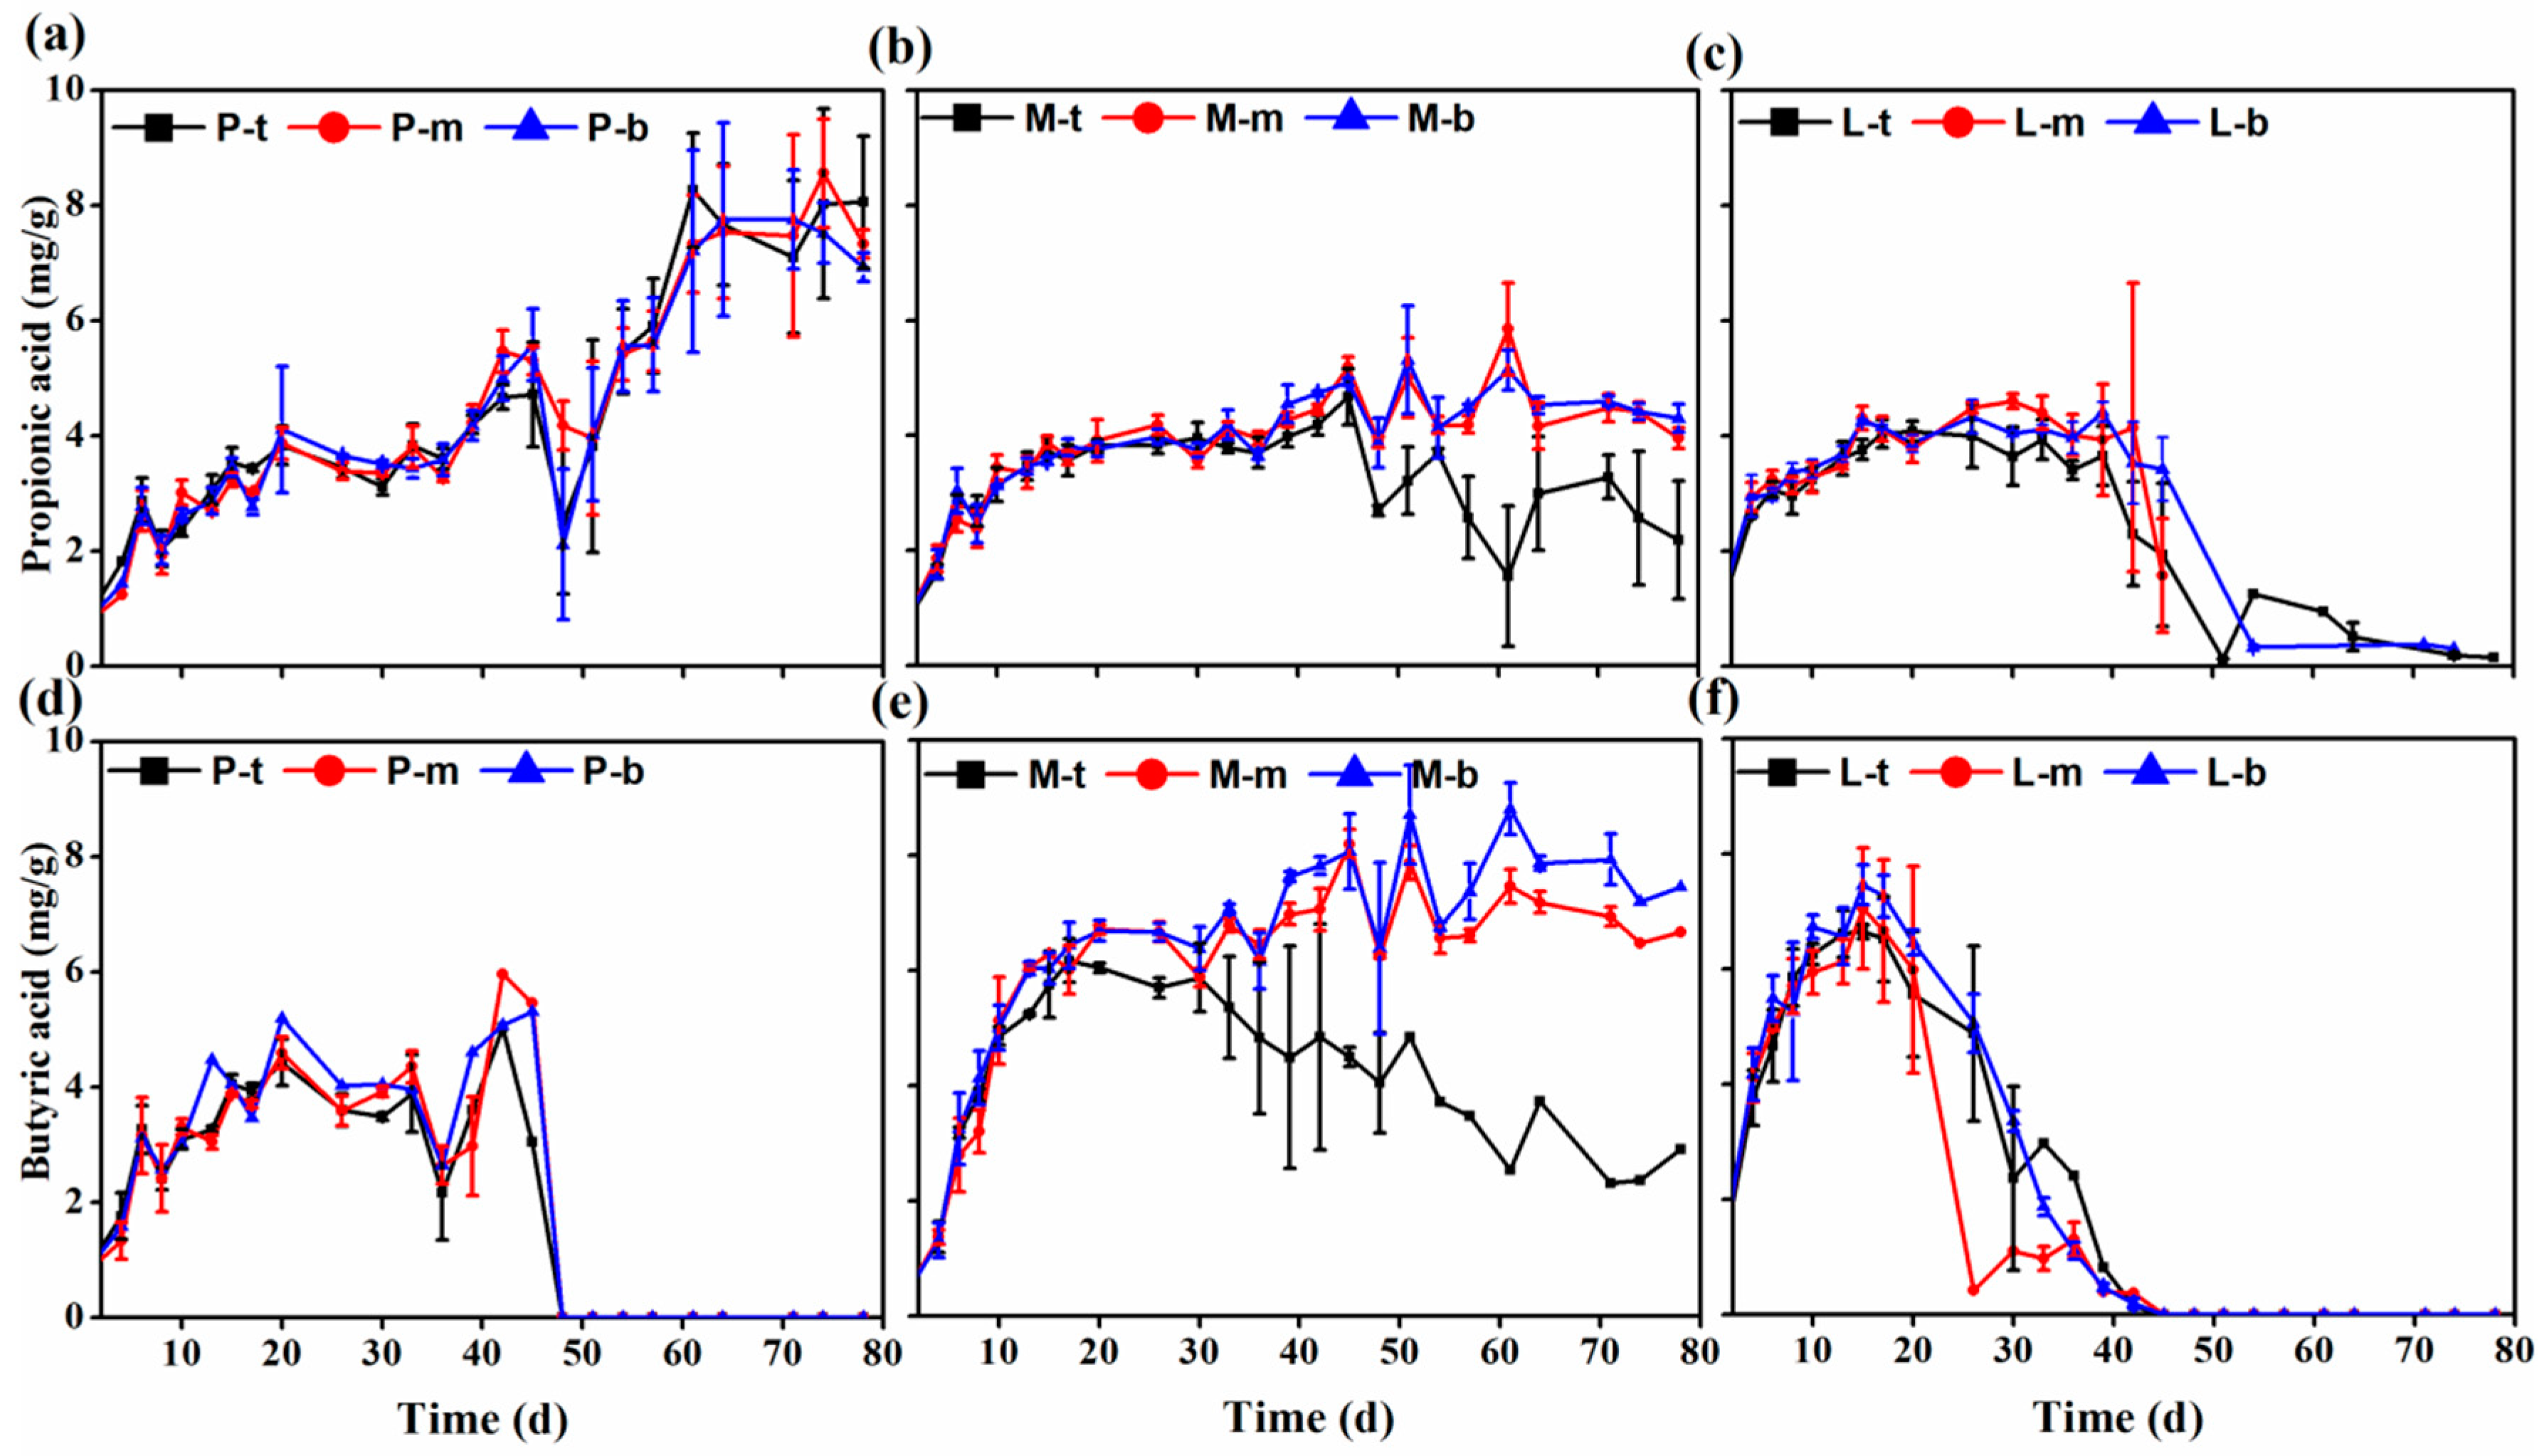
3.2. Volatile Fatty Acid Concentrations during Solid-State Anaerobic Digestion

There were significant differences in the total and individual VFA concentrations in P, M, and L, particularly after 20 days of digestion (Figure 3). The concentrations of acetic acid in P and L increased to 10.7 and 6.9 mg/g, respectively, on day 20, and then declined rapidly to approximately 0.4 mg/g after day 48. However, the concentration of acetic acid in M remained at a high level in the range of 8.2–11.1 mg/g from day 17 to the end of the experiment. The concentrations of propionic acid in P, M, and L did not differ significantly from day 0 to day 38 (below 4.3 mg/g). However, after 38 days, the concentration of propionic acid in P increased to 7.5 mg/g on day 78. Conversely, it decreased sharply from 4.0 mg/g to a very low level (0.1–1.0 mg/g) in L. The propionic concentration in M was relatively stable and varied in the range of 3.2–4.9 mg/g on days 10–78. The variation in total VFAs was similar to that in acetic acid because acetic acid was dominant in the VFAs. The peak concentrations of VFAs in P, M, and L, which were obtained on days 20, 20, and 15 were 31.5, 31.4, and 33.0 mg/g, respectively. On days 3–15, the concentration of VFAs in L was slightly higher, but it decreased sharply and became lower than P and M. The concentration of VFAs in M was the highest and was stable in the range of 30.0–38.5 mg/g after 20 days.
During Ss-AD, excessive VFAs were the main inhibitor of methanogenesis and decreased CH4 yields. Acetic acid, propionic acid, and butyric acid were the dominant organic acids among VFAs and may have been responsible for the inhibition. Zhu et al. [26] observed that the inhibition concentration of VFAs for methanogens was 16.7–20.1 mg/g in the Ss-AD of corn stover. Wang et al. [27] reported that the activity of methanogens was inhibited to a significant extent when propionic acid and total VFA concentrations reached approximately 2.9 and 10 g/L, respectively, in the anaerobic digestion of pig manure, while the inhibitor threshold concentration of acetic acid was 3.0–5.0 mg/mL for methanogenesis [28]. In this study, the concentrations of VFAs, propionic acid, and acetic acid were much higher than the inhibitor threshold concentration for methanogenesis, particularly during the period from 0–30 days. It can be concluded that VFA inhibition occurred in P and M, as indicated by the cumulative CH4 yields (Figure 2c). Compared to M, the concentrations of acetic acid in P decreased when the digestion progressed for approximately 20 days, which indicated that the VFA inhibition decreased and methanization improved gradually. The propionic acid concentration in P showed an obvious increase after 39 days, while M was stable (Figure 3c). This indicated that the main inhibitor may be degradable acetic acid rather than propionic acid, although propionic acid was more likely to accumulate and be more toxic to methanogens, even though the concentration was higher than the inhibitor threshold concentration in this study.
In reactor L, there were no significant differences in VFAs compared to P and M during the initial 20 days. In contrast, the CH4 yield in L increased dramatically to 3.1 mL/g-VS during the initial 11 days and was maintained at higher levels, which indicated that layer inoculation can effectively prevent VFA inhibition and make the process run effectively, even though VFA concentration exceeded the inhibitor threshold concentration greatly. This can be explained by the inoculum layers lowering the substrate/inoculum ratios greatly in the proximate regions of the feedstock and inoculum layers. The absolute superiority of inoculum to feedstock or VFAs overcame the inhibition of VFAs and initiated the Ss-AD process successfully, so as to show in the higher CH4 production and shorter startup time; even the accumulation in reactor L was the same as P and M during the initial 15 days. It can be concluded that mass diffusion resistance during Ss-AD does not directly limit the CH4 production rate but, without the timely conversion of hydrolysis/acidification products by downstream consumers, methanogenesis inhibition will occur [8]. At the same time, this inhibition compromised the hydrolysis/acidification rate and hydrolysis inhibition occurred; this was supported by the profiles of SCOD and pH in reactors P, M, and L (Figure S1). After day 20, the hydrolysis of particle organics toward VFAs was lower than the utilization of VFAs and, therefore, the VFA concentration decreased gradually.
The VFA concentrations in the vertical sections of the reactors are shown in Figure 4 and Figure 5. It is evident that there was no significant difference in the VFA concentrations in the top, middle, and bottom parts of P, which used substrate pig manure solely. This can be attributed to the fact that the vertical diffusion of VFAs was limited because of the high TS content in the digester and the high viscosity of swine manure, which resulted in a high mass transfer barrier. However, in reactor M, the VFA profiles in the middle and bottom parts were higher than the top part; this occurred after approximately 30 days. The VFAs in the middle and bottom parts increased gradually, while the top part increased and then declined. The acetic acid concentration in the top part reduced slowly from 8.2 mg/g, while the middle and bottom parts increased gradually to 10.2 and 10.8 mg/g, respectively, on day 71 after 30 days of digestion. The concentration of propionic acid in the top part decreased from 4.7 mg/g to 2.2 mg/g during the period of days 45–78. This indicated that the addition of maize straw accelerated the vertical mass transfer of VFAs and resulted in VFA accumulation in the middle and bottom parts of the reactors. As a result, the methanogens were inhibited by the high VFA level, which was proved by the low CH4 yields (Figure 2). For reactor L, the profiles of total and individual VFAs in the three vertical sections showed no differences during days 0–15. However, during days 18–43, the concentrations of total VFAs (TVFAs) and acetic acid in the bottom part were slightly higher than the middle and top parts.
The concentrations of propionic acid and butyric acid in the three sections did not exhibit much difference during the experiment. Propionic acid concentration increased gradually in the P reactor, which means serious accumulation, while butyric acid degraded completely after day 50. Propionic acid and butyric acid concentrations in the M reactor were basically stable. In the L reactor, propionic acid and butyric acid were completely degraded after day 45. These results indicated that the VFAs were consumed by the methanogens clustered in the inoculum layers in a timely manner. Therefore, the transfer and accumulation of VFAs in the vertical regions (layers consisting of feedstock and inoculum) were prevented. The peak concentrations in L were similar to M, but the cumulative CH4 yields on days 13 and 44 were 22.3 and 120.9 mL/g-VS (Figure 2), which were 2.8 and 7.4 times greater than reactor M, respectively. This indicated that layer inoculation could prevent VFA inhibition during Ss-AD effectively.

3.3. Ammonia Concentration during Solid-State Anaerobic Digestion

The concentrations of ammonia nitrogen (TAN) in P, M, and L (Figure S2) increased sharply within days 5–12. This can be attributed to the degradation of pig manure, which were nitrogen-rich substrates [29]. The maximum values achieved on days 28–30 in reactors P, M, and L were 4.7, 4.4, and 4.0 mg/g, respectively. After day 30, the concentrations slightly decreased, and the concentration in L was lower than P and M. TAN can be utilized as an essential nutrient for microbial growth and contribute to establishing sufficient pH buffer capacity in the AD but, it can also be toxic to microbes or affect metabolism pathways to slow down the rate of organic matter degradation. It was broadly accepted that a TAN concentration over 3.0 g/L was toxic for methanogenesis, independent of temperature and pH levels [30,31]. In this study, a comparison of TAN concentration and CH4 yields (Figure 2) indicated that TAN was not one of the key factors affecting methane yields, and it may not inhibit hydrolytic/acidification or methanogenic microbes during Ss-AD, even though the concentrations in reactors P and M were higher than the reported inhibitory levels. This finding was consistent with the results reported by Wang et al. [32] and Li et al. [33]. This was because the high concentrations of VFAs led to a reduction in the toxicity of TAN by controlling the transformation of ammonium to free ammonia, which was more toxic for methanogenic microorganisms.

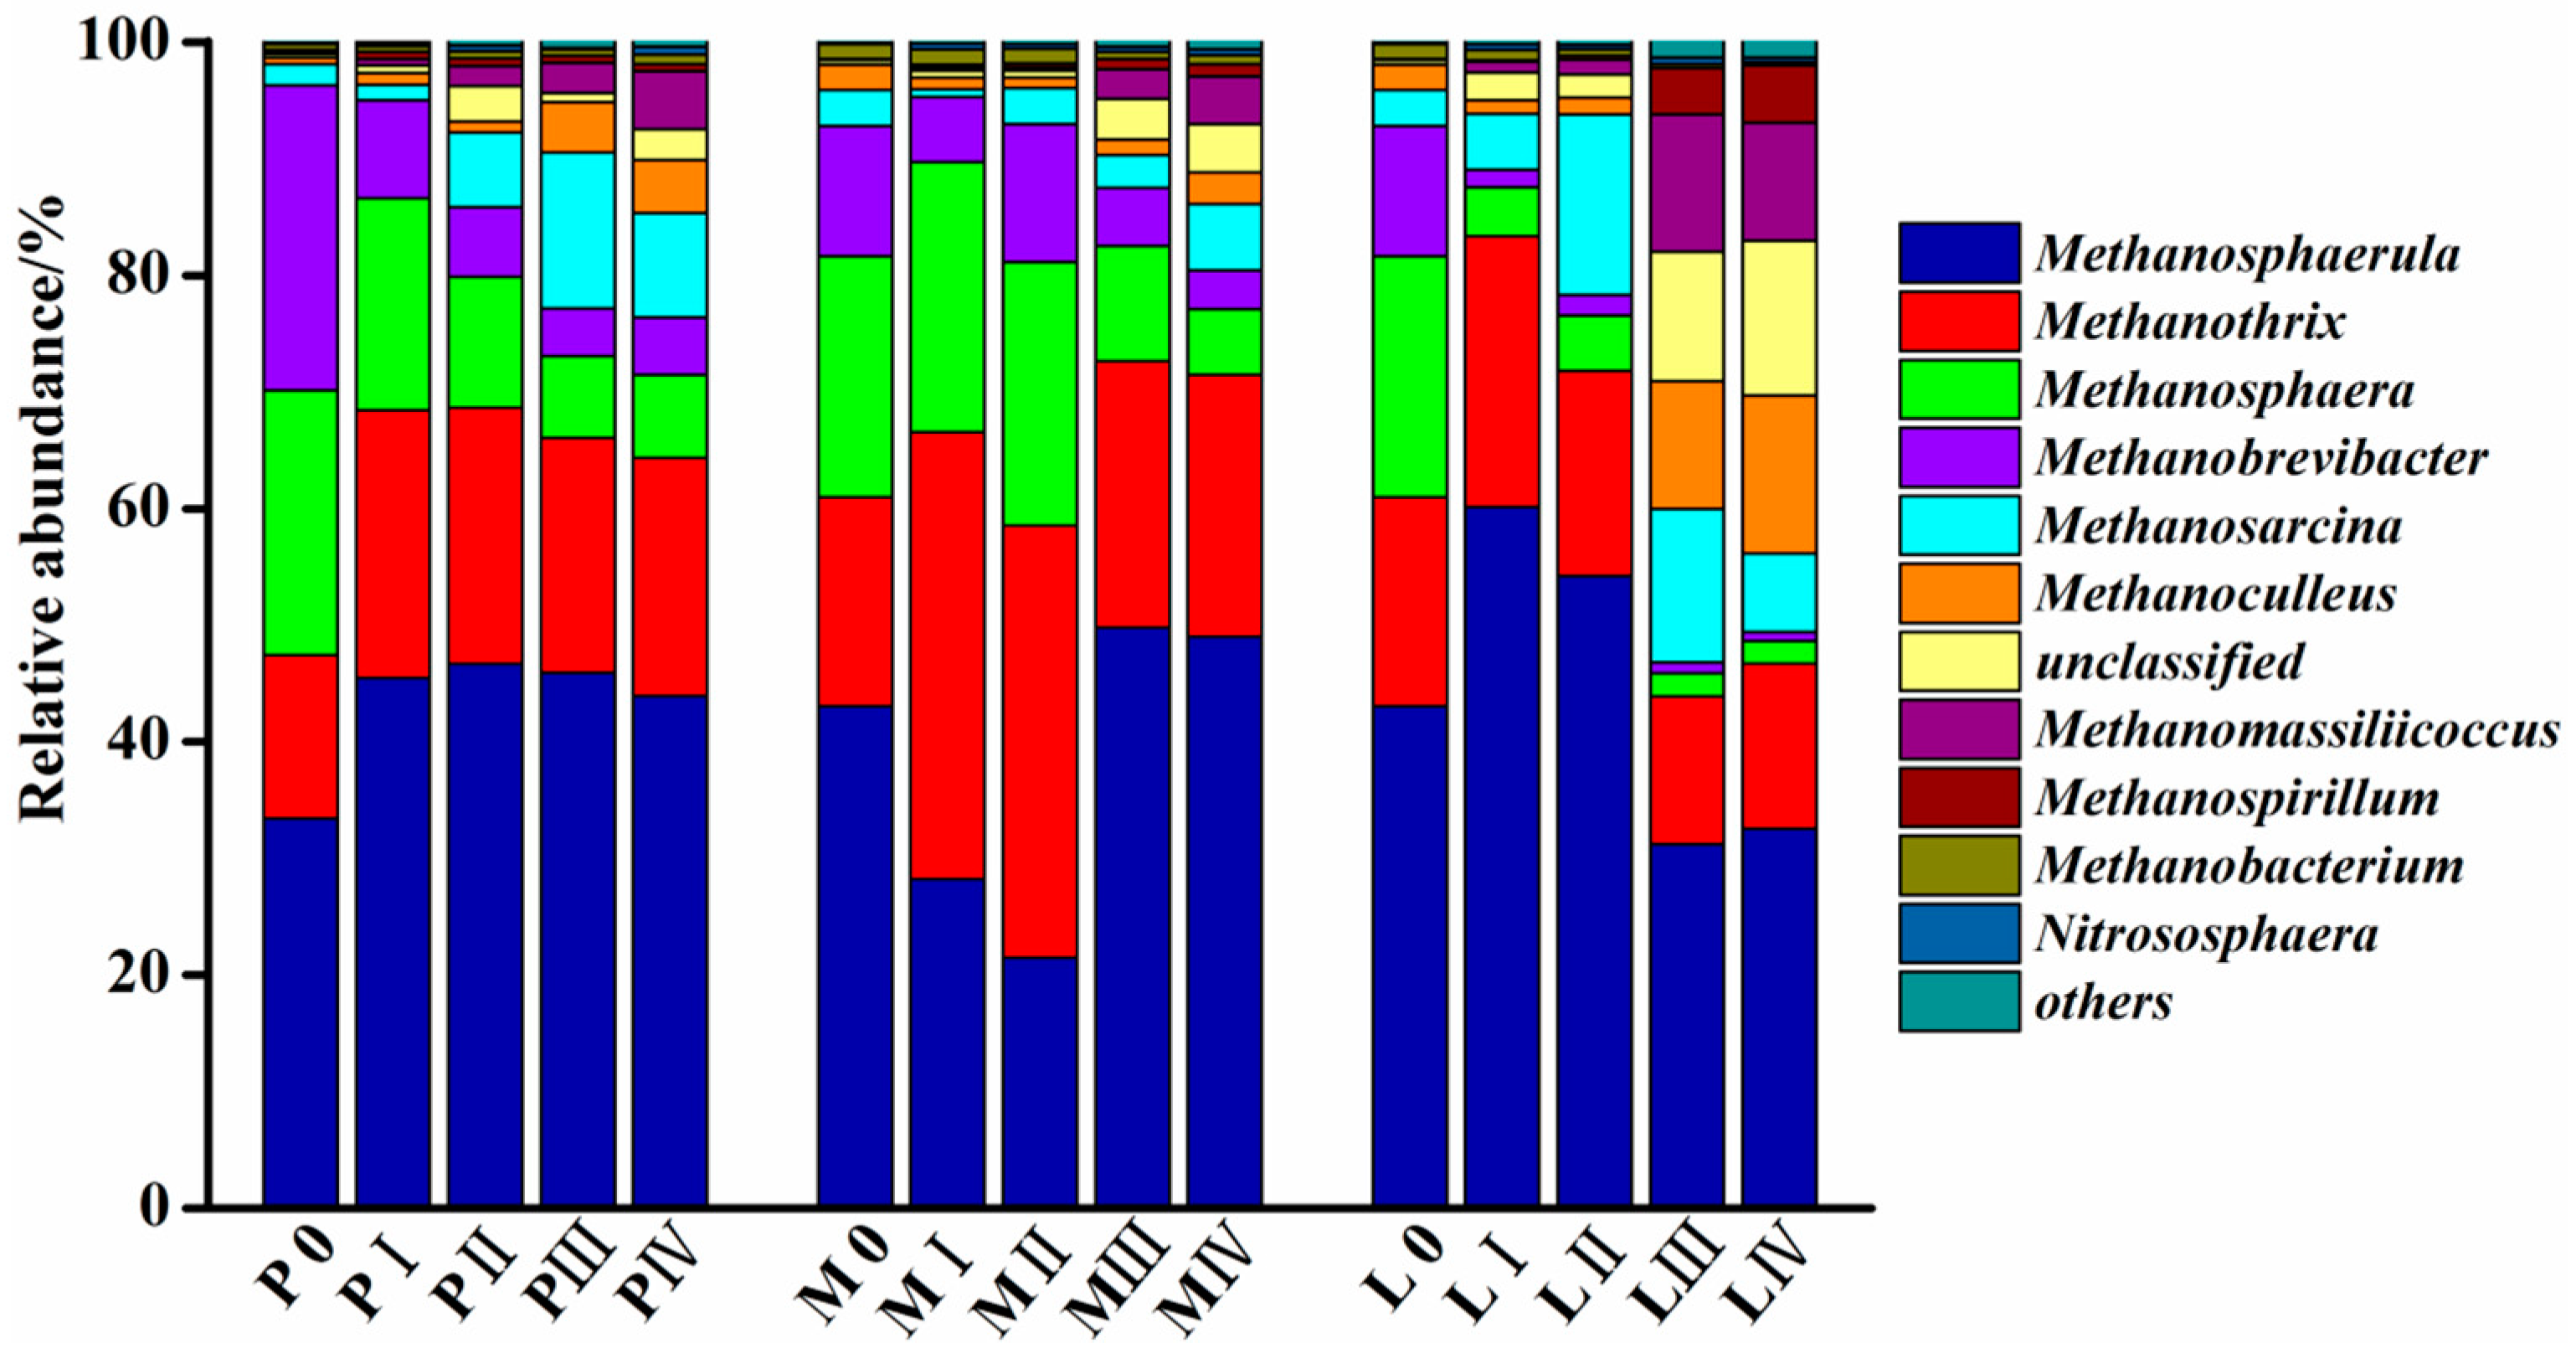
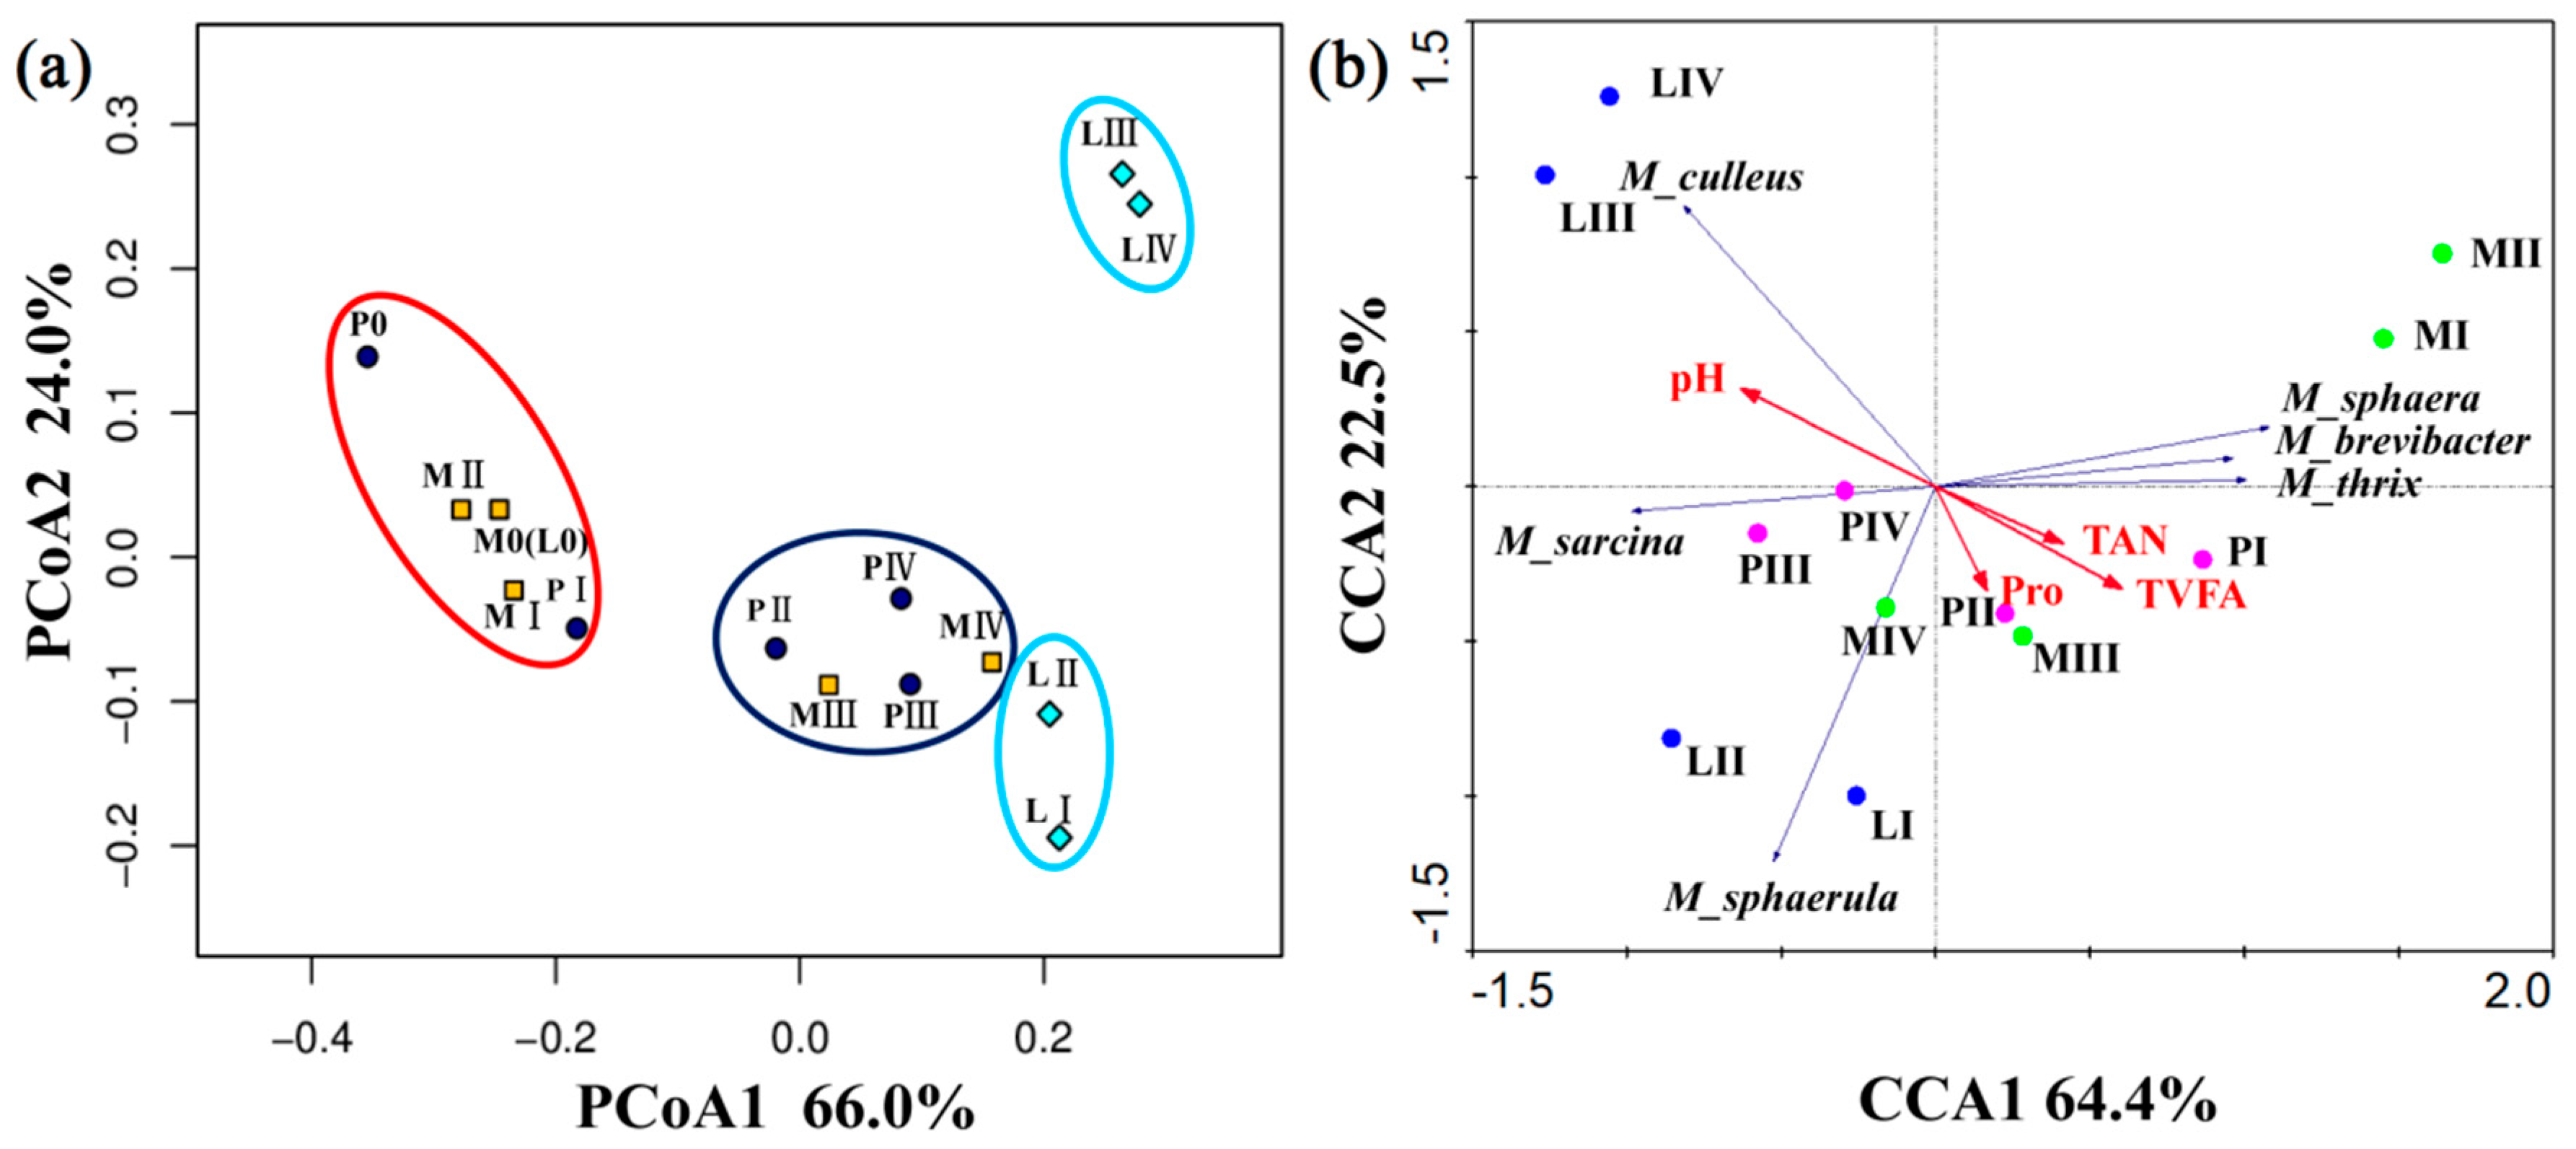
3.4. Changes in the Methanogenic Archaea Community during Solid-State Anaerobic Digestion

The variations in methanogen diversity (genus level) on days 0, 13, 33, 45, and 78 in reactors M, P, and L are shown in Figure 6. Methanosphaerula, Methanothrix, Methanosphaera, and Methanobrevibacter were the dominant genera in P and M, with a total of 76.39–96.28% classified into these genera. The genera with high abundances were identical, but the frequency of relative abundance had obvious changes, indicating that considerable changes had occurred in the methanogenic community structure as digestion progressed. Specifically, the relative abundance of the genus Methanosphaerula in P increased from 33.46% at P0 to 43.96–46.70% at PI–PIV, while M decreased from 43.04% at M0 to 21.49% at MII and then increased to 49.02%–49.79% at MIII–MIV. The relative abundance of Methanothrix in P and M increased from 13.97% and 17.93% on day 0 (P0 and M0) to 22.97% and 38.32% on day 13 (PI and MI), and then reduced to 20.12% and 22.84% on day 45 (PIII and MIII), respectively. For the genus Methanosphaera, the relative abundance in P decreased from 22.72% at P0 to 7.12% at PIV gradually but remained in the range of 20.65–23.19% on day 0–33 (M0–MII) in M, and then decreased to 5.64% at MIV. Compared with P and M, not only the frequency of relative abundance but also the genera with high abundances changed considerably in L. The relative abundance of the genus Methanosphaerula, which was predominant during the experiment, decreased from 60.12% at LI to 31.22–32.53% at LIII and LIV. Methanothrix reduced from 23.24% at LI to 12.66% at LIII, while the genera methanoculleus and methanomassiliicoccus were more dominant in LIII (10.97% and 11.76%) and LIV (13.54% and 10.11%).
The genus Methanosphaerula is a member of the Methanoregulaceae family in the Methanomicrobiales order. So far, there have been few studies about the genus Methanosphaerula in anaerobic digestion. Zinder and Cadillo-Quiroz [34] reported that this genus consists of a single species named Methanosphaerula palustris, which is mesophilic and grows within a pH range of 4.8 to 6.4; 4 mM acetate was required for growth. The predominance of Methanosphaerula in this study during the digestion process may be attributed to the inoculum used being a residue from Ss-AD, which contained a high relative abundance of Methanosphaerula and a similar microenvironment, such as high VFA concentration. Methanothrix is suitable for growing at acetic acid concentrations of 93.7–140.6 mg/L. However, in this study, the genus Methanothrix was dominant during the digestion process, especially at MI and MII when the VFA concentration was about 31.5 mg/g. This is because Methanothrix may play an important role in the degradation of high-level propionate acid. Li et al. [35] also found that Methanothrix accounted for 62.0–87.2% under near neutral pH (6.0–7.0) in the methanogenic propionate degradation bioreactor.
Methanogens are generally categorized as hydrogenotrophs and acetotrophs. Hydrogenotrophic methanogens (HMs), which mainly utilize H2 and CO2 to produce CH4, demonstrate greater diversity, while acetotrophic methanogens (AMs) only use acetic acid to produce CH4, which demonstrates lower diversity [36]. In the present study, Methanosphaerula, Methanosphaera, and Methanobrevibacter were responsible for the HM metabolic pathway in P and M. The relative abundance of HM in P decreased from 83.63% (P0) to 66.97% (PIV), while M decreased from 78.43% (M0) to 58.70% (MII), and 66.64% (MIV), which indicated that the HM pathway was predominant in P and M, although the shift from hydrogenotrophic to acetoclastic methanogenesis occurred during this experiment. The genera Methanosphaerula, Methanoculleus, and Methanomassiliicoccus were predominant HM in L. The total relative abundance of HM, which varied within the range of 61.20–68.88% during LI–LIV, was more stable than P and M, and this stable relative abundance of methanogens led to high methane production. Overall, the HM pathway was responsible for methane production during solid-state anaerobic digestion (Ss-AD), which may be attributed to the accumulation of VFAs and the fact that HM was more acid-tolerant than AM [33]. Zhou et al. [37] also reported that HM had higher activity than AM, and HM was the dominant substrate degradation pathway during the Ss-AD of swine manure. Therefore, HM could exist and play an important role in acid accumulative or acidogenic reactors.
Differences in methanogen community composition among the samples were assessed by principal coordinate analysis (PCoA, weighted uniFrac). Principal components 1 and 2 explained 66.0% and 24.0% of the variations in the methanogen community composition, respectively. It was clear that there were four groups (Figure 7a). Samples P0, M0 (L0), PI, MI, and MII were clustered in one group (group 1). Samples PII, PIII, PIV, MIII, and MIV were in group 2, but they were distinguished from group 1, which could be attributed to the different digestion times during Ss-AD. The samples in group 2 were collected on days 13 and 45, and the samples in group 1 were collected on days 0 and 13, except for MII (day 33). The digestion time appeared to play an important role in the changes in the methanogen community composition in P and M because the VFA inhibition recovered gradually as the digestion progressed. This was also supported by the digestion performance (Figure 2 and Figure 3) and the methanogenic community (Figure 6). Samples of L were clustered together relatively more closely, according to the first coordinate axis, than P and M, which indicated a more dynamic change in methanogen communities in P and M than L. This was supported by the relatively stable methane production, which was carried out by methanogens. Nevertheless, samples LI and LII were clustered in group 3, and LIII and LIV were clustered in group 4, according to the second coordinate axis (PCoA2), which contributed 24.0% of variation, and group 4 drifted apart from other groups. This result indicated that the methanogen communities in layer inoculation in the later stages significantly differed from others. The differences may be attributable to the change in pH value and the volatile fatty acid (VFA) concentration.
Changes in environmental factors during Ss-AD had a considerable influence on the methanogenic community. The community shifts were more significantly correlated with VFAs, pH, and TAN as digestion progressed. Figure 7b shows the relationships between the relative abundance of the dominant methanogens and the environmental variables VFAs, pH, and TAN. It can be seen that the genera Methanothrix, Methanosphaera, and Methanobrevibacter had a positive correlation with VFA concentration and TAN and a negative correlation with pH value. This was consistent with the anaerobic co-digestion of fruit and vegetable waste and food waste [32]. The genera Methanoculleus and Methanosarcina exhibited a negative correlation with VFA concentration and TAN and a positive correlation with pH value. This indicated that genera Methanoculleus and Methanosarcina were more sensitive to VFAs and TAN than Methanothrix, Methanosphaera, and Methanobrevibacter. Notably, the most dominant genus Methanosphaerula had no correlation with these environmental variations. This can be attributed to the fact that the inoculum used was the residue of the Ss-AD of pig manure and maize straw, which had been acclimated to the micro-environment, especially the high VFA concentrations. However, although the relative abundance of Methanosphaerula had no correlation with these environmental factors, the methane production in different reactors indicated that the methanogenic activity was influenced greatly by different inoculation methods.

4. Conclusions

Herein, the performance and microbial populations during the solid-state anaerobic digestion of pig manure or the mixture of pig manure and maize straw were investigated under premixing and layer inoculation. Layer inoculation accelerated volatile fatty acid consumption and prevented volatile fatty acid inhibition during solid-state anaerobic digestion, avoiding the inhibition of total ammonia nitrogen on hydrolysis/acidification or methangenic microorganisms, thereby improving CH4 yields and shortening the start-up time. Mixed inoculation is prone to volatile fatty acid inhibition; the addition of maize straw will increase the start-up time and reduce CH4 yields. Acetic acid inhibition was responsible for the low methane production under premixing inoculation. The inoculum method also affected the methanogenic community. Methanosphaerula and Methanothrix were the most dominant genera, and the hydrogenotrophic methanogen pathway was predominant during solid-state anaerobic digestion under both layer and premixing inoculation. Layered inoculation provides a new strategy to improve the efficiency of solid-state anaerobic digestion.

Supplementary Materials

The following supporting information can be downloaded at https://www.mdpi.com/article/10.3390/fermentation9060535/s1, Figure S1: Variations in SCOD and pH values during Ss-AD; Figure S2: TAN concentration during Ss-AD in reactors P, M, and L.

Author Contributions

Conceptualization, X.G. and F.L.; methodology, Z.L. and X.G.; software, J.L. and K.Z.; validation, X.G., L.D. and K.Z.; formal analysis, D.K.; investigation, Z.L.; resources, X.G., J.L.; data curation, X.G., W.G. and D.K.; writing—original draft preparation, Z.L.; writing—review and editing, Z.L, and F.L.; visualization, F.L.; supervision, L.D.; project administration, L.D.; funding acquisition, X.G. and L.D. All authors have read and agreed to the published version of the manuscript.

Funding

This research was financially supported by the major project of the State Key Laboratory of Sheep Genetic Improvement and Healthy Production (2021ZD09), the National Key Research and Development Plan Project (2017YFD0800800), and the Chinese Academy of Agricultural Sciences Collaborative Innovation Task (CAAS-XTCX2016015).

Institutional Review Board Statement

Not applicable.

Informed Consent Statement

Not applicable.

Data Availability Statement

Then data are available from the corresponding author.

Conflicts of Interest

The authors declare no conflict of interest.

Abbreviations

AbbreviationEnglish Full Name
ADAnaerobic digestion
TSTotal solids
Ss-ADSolid-state anaerobic digestion
L-ADLiquid anaerobic digestion
VFAVolatile fatty acid
VSVolatile solids
PMPig manure
MSMaize straw
AVAverage value
SDStandard deviation
TOCTotal organic carbon
TNTotal nitrogen
C/NCarbon-to-nitrogen ratio
TCDThermal conductivity detector
SCODSoluble chemical oxygen demand
TANTotal ammonia nitrogen
DNADeoxyribonucleic acid
PCRPolymerase chain reaction
OTUOperational taxonomic unit
SMYSpecific methane yield
HMHydrogenotrophic methanogens
AMAcetotrophic methanogens
PCoAPrincipal coordinates analysis
CCACanonical correspondence analysis

References

  1. Gu, X.; Du, H.; Khan, J. Disentangling the heterogeneous effects of different support policies on livestock and poultry farmers’ willingness to utilize manure resources: Evidence from central China. Front. Environ. Sci. 2023, 11, 1070423. [Google Scholar]
  2. Chen, H.; Huang, R.; Wu, J.; Zhang, W.; Han, Y.; Xiao, B.; Wang, D.; Zhou, Y.; Liu, B.; Yu, G. Biohythane production and microbial characteristics of two alternating mesophilic and thermophilic two-stage anaerobic co-digesters fed with rice straw and pig manure. Bioresour. Technol. 2021, 320, 124303. [Google Scholar] [CrossRef] [PubMed]
  3. Li, K.; Liu, R.H.; Sun, C. A review of methane production from agricultural residues in China. Renew. Sust. Energ. Rev. 2016, 54, 857–865. [Google Scholar] [CrossRef]
  4. Wang, Y.; Zhang, J.; Li, Y.; Jia, S.; Song, Y.; Sun, Y.; Zheng, Z.; Yu, J.; Cui, Z.; Han, Y.; et al. Methane production from the co-digestion of pig manure and corn stover with the addition of cucumber residue: Role of the total solids content and feedstock-to-inoculum ratio. Bioresour. Technol. 2020, 306, 123172. [Google Scholar] [CrossRef]
  5. Li, Y.B.; Park, S.Y.; Zhu, J.Y. Solid-state anaerobic digestion for methane production from organic waste. Renew. Sust. Energ. Rev. 2011, 15, 821–826. [Google Scholar] [CrossRef]
  6. Charlottenburg, A.; Rosenheim, H. Anaerobic digestion. Eur. Bioplastics e.V. 2015, 8. Available online: https://docs.european-bioplastics.org/publications/bp/EUBP_BP_Anaerobic_digestion.pdf (accessed on 10 May 2023).
  7. Di Maria, F.; Gigliotti, G.; Sordi, A.; Micale, C.; Zadra, C.; Massaccesi, L. Hybrid solid anaerobic digestion batch: Biomethane production and mass recovery from the organic fraction of solid waste. Waste Manag. Res. 2013, 31, 869–873. [Google Scholar] [CrossRef]
  8. Xu, F.; Wang, Z.W.; Tang, L.; Li, Y. A mass diffusion-based interpretation of the effect of total solids content on solid-state anaerobic digestion of cellulosic biomass. Bioresour. Technol. 2014, 167, 178–185. [Google Scholar] [CrossRef]
  9. Le, H.R.; Benbelkacem, H.; Bollon, J.; Bayard, R.; Escudie, R.; Buffiere, P. Influence of moisture content on the specific methanogenic activity of dry mesophilic municipal solid waste digestate. J. Chem. Technol. Biotechnol. 2012, 87, 1032–1035. [Google Scholar]
  10. Li, H.; Wang, Y. Influence of total solid and stirring frequency on performance of dry anaerobic digestion treating cattle manure. Appl. Mech. Mater. 2011, 79, 48–52. [Google Scholar] [CrossRef]
  11. Abbassi-Guendouz, A.; Brockmann, D.; Trably, E.; Dumas, C.; Delgenés, J.P.; Steyer, J.P.; Escudié, R. Total solids content drives high solid anaerobic digestion via mass transfer limitation. Bioresour. Technol. 2012, 111, 55–61. [Google Scholar] [CrossRef]
  12. Riya, S.; Suzuki, K.; Meng, L.Y.; Zhou, S.; Terada, A.; Hosomi, M. The influence of the total solid content on the stability of dry-thermophilic anaerobic digestion of rice straw and pig manure. Waste Manag. 2018, 76, 350–356. [Google Scholar] [CrossRef]
  13. Xu, F.; Li, Y.; Wang, Z. Mathematical modeling of solid-state anaerobic digestion. Prog. Energy Combust. Sci. 2015, 51, 49–66. [Google Scholar] [CrossRef]
  14. Brown, D.; Li, Y. Solid state anaerobic co-digestion of yard waste and food waste for biogas production. Bioresour. Technol. 2013, 127, 275–280. [Google Scholar] [CrossRef] [PubMed]
  15. Lin, Y.; Ge, X.; Li, Y. Solid-state anaerobic co-digestion of spent mushroom substrate with yard trimmings and wheat straw for biogas production. Bioresour. Technol. 2014, 169, 468–474. [Google Scholar] [CrossRef]
  16. André, L.; Durante, M.; Pauss, A.; Lespinard, O.; Ribeiro, T.; Lamy, E. Quantifying physical structure changes and non-uniform water flow in cattle manure during dry anaerobic digestion process at lab scale: Implication for biogas production. Bioresour. Technol. 2015, 192, 660–669. [Google Scholar] [CrossRef] [PubMed]
  17. Wu, J.; Hu, Y.Y.; Wang, S.F.; Cao, Z.P.; Li, H.Z.; Fu, X.M.; Wang, K.J.; Zuo, J.E. Effects of thermal treatment on high solid anaerobic digestion of swine manure: Enhancement assessment and kinetic analysis. Waste Manag. 2017, 62, 69–75. [Google Scholar] [CrossRef]
  18. Yang, L.; Xu, F.; Ge, X.; Li, Y. Challenges and strategies for solid-state anaerobic digestion of lignocellulosic biomass. Renew. Sustain. Energy Rev. 2015, 44, 824–834. [Google Scholar] [CrossRef]
  19. Motte, J.C.; Escudie, R.; Bernet, N.; Delgenes, J.P.; Steyer, J.P.; Dumas, C. Dynamic effect of total solid content, low substrate/inoculum ratio and particle size on solid-state anaerobic digestion. Bioresour. Technol. 2013, 144, 141–148. [Google Scholar] [CrossRef]
  20. Xu, F.; Wang, F.; Lin, L.; Li, Y. Comparison of digestate from solid anaerobic digesters and dewatered effluent from liquid anaerobic digesters as inocula for solid state anaerobic digestion of yard trimmings. Bioresour. Technol. 2016, 200, 753–760. [Google Scholar] [CrossRef]
  21. Zhu, J.; Zheng, Y.; Xu, F.; Li, Y. Solid-state anaerobic co-digestion of hay and soybean processing waste for biogas production. Bioresour. Technol. 2014, 154, 240–247. [Google Scholar] [CrossRef]
  22. Yu, J.D.; Zhao, L.X.; Feng, J.; Yao, Z.L.; Huang, K.M.; Luo, J.; Wei, S.M.; Chen, J.K. Sequencing batch dry anaerobic digestion of mixed feedstock regulating strategies for methane production: Multi-factor interactions among biotic and abiotic characteristics. Bioresour. Technol. 2019, 284, 276–285. [Google Scholar] [CrossRef] [PubMed]
  23. Fagbohungbe, M.O.; Dodd, I.C.; Herbert, B.M.J.; Li, H.; Ricketts, L.; Semple, K.T. High solid anaerobic digestion: Operational challenges and possibilities. Environ. Technol. Innov. 2015, 4, 268–284. [Google Scholar] [CrossRef]
  24. Federation, W.E.; Association, A. Standard Methods for the Examination of Water and Wastewater; American Public Health Association: Washington, DC, USA, 2005; p. 21. [Google Scholar]
  25. Xie, S.H.; Hai, F.I.; Zhan, X.M.; Guo, W.S.; Ngo, H.H.; Price, W.E.; Nghiem, L.D. Anaerobic co-digestion: A critical review of mathematical modelling for performance optimization. Bioresour. Technol. 2016, 222, 498–512. [Google Scholar] [CrossRef] [PubMed]
  26. Zhu, J.; Yang, L.; Li, Y. Comparison of premixing methods for solid-state anaerobic digestion of corn stover. Bioresour. Technol. 2015, 175, 430–435. [Google Scholar] [CrossRef]
  27. Wang, Y.; Zhang, Y.; Meng, L.; Wang, J.; Zhang, W. Hydrogen–methane production from swine manure: Effect of pretreatment and VFAs accumulation on gas yield. Biomass Bioenergy 2009, 33, 1131–1138. [Google Scholar] [CrossRef]
  28. Stronach, S.; Rudd, T.; Lester, J.N. Anaerobic Digestion Processes in Industrial Waste Water Treatments; Springer: Berlin/Heidelberg, Germany, 1986. [Google Scholar]
  29. Wang, Y.Y.; Li, G.X.; Chi, M.H.; Sun, Y.B.; Zhang, J.X.; Jiang, S.X.; Cui, Z.J. Effects of co-digestion of cucumber residues to corn stover and pig manure ratio on methane production in solid state anaerobic digestion. Bioresour. Technol. 2018, 250, 328–336. [Google Scholar] [CrossRef]
  30. Cuetos, M.J.; Gómez, X.; Otero, M.; Morán, A. Anaerobic digestion of solid slaughterhouse waste (SHW) at laboratory scale: Influence of co-digestion with the organic fraction of municipal solid waste (OFMSW). Biochem. Eng. J. 2008, 40, 99–106. [Google Scholar] [CrossRef]
  31. Duan, N.; Dong, B.; Wu, B.; Dai, X. High-solid anaerobic digestion of sewage sludge under mesophilic conditions: Feasibility study. Bioresour. Technol. 2012, 104, 150–156. [Google Scholar] [CrossRef]
  32. Wang, P.; Wang, H.T.; Qiu, Y.Q.; Ren, L.H.; Jian, B. Microbial characteristics in anaerobic digestion process of food waste for methane production–A review. Bioresour. Technol. 2018, 248, 29–36. [Google Scholar] [CrossRef]
  33. Li, Y.Y.; Wang, Y.Q.; Yu, Z.H.; Lu, J.X.; Li, D.Y.; Wang, G.Y.; Li, Y.; Wu, Y.; Li, S.Y.; Xu, F.Q.; et al. Effect of inoculum and substrate/inoculum ratio on the performance and methanogenic archaeal community structure in solid state anaerobic co-digestion of tomato residues with dairy manure and corn stover. Waste Manag. 2018, 81, 117–127. [Google Scholar] [CrossRef]
  34. Whiman, W.B.; Rainey, F.; Kämpfer, P.; Trujillo, M.; Chun, J.; DeVos, P.; Hedlund, B.; Dedysh, S. Bergey’s Manual of Systematics of Archaea and Bacteria; Wiley Online Library: Hoboken, NJ, USA, 2015; p. 410. [Google Scholar]
  35. Li, Y.; Sun, Y.M.; Li, L.H.; Yuan, Z.H. Acclimation of acid-tolerant methanogenic propionate-utilizing culture and microbial community dissecting. Bioresour. Technol. 2018, 250, 117–123. [Google Scholar] [CrossRef] [PubMed]
  36. Joshi, A.; Lanjekar, V.B.; Dhakephalkar, P.K.; Dagar, S.S. Cultivation of multiple genera of hydrogenotrophic methanogens from different environmental niches. Anaerobe 2018, 50, 64–68. [Google Scholar] [CrossRef] [PubMed]
  37. Zhou, M.; Yang, H.N.; Zheng, D.; Pu, X.D.; Liu, Y.; Wang, L.; Zhang, Y.H.; Deng, L.W. Methanogenic activity and microbial communities characteristics in dry and wet anaerobic digestion sludges from swine manure. Biochem. Eng. J. 2019, 152, 1073–1790. [Google Scholar] [CrossRef]
Figure 1. A schematic diagram of the mixed inoculation (a) and layer inoculation (b) devices.
Fermentation 09 00535 g001
Figure 2. Variations in specific methane yield (SMY) (a), CH4 content (b), cumulative CH4 yields (c), and the converted efficiency of VS (d).
Fermentation 09 00535 g002
Figure 3. Variations in concentrations of total volatile fatty acids (TVFAs) (a), acetic acid (b), propionic acid (c), and butyric acid (d).
Fermentation 09 00535 g003
Figure 4. Concentrations of total volatile fatty acids (TVFAs) and acetic acid in the P (a,d), M (b,e), L (c,f) reactors at the top, middle, and bottom parts of the digesters.
Fermentation 09 00535 g004
Figure 5. Concentrations of propionic acid and butyric acid in the P (a,d), M (b,e), L (c,f) reactors at the top, middle, and bottom parts of the digesters.
Fermentation 09 00535 g005
Figure 6. Methanogenic community during solid-state anaerobic digestion (Ss-AD). P, M, and L represent the digestion reactors, and 0, I, II, III, and IV represent the digestion time (days 0, 13, 33, 45, and 78, respectively).
Fermentation 09 00535 g006
Figure 7. Methanogen succession and its correlation to environmental conditions during Ss-AD. (a) Weighted uniFrac principal coordinates analysis (PCoA); (b) canonical correspondence analysis (CCA). P, M, and L represent the Ss-AD reactors; 0, I, II, III, and IV represent sampling on days 0, 13, 33, 45, and 78, respectively.
Fermentation 09 00535 g007
Table 1. Characteristics of PM, MS, and inoculum.
AV ± SDTotal Solid (TS)%Volatile Solid (VS)%Total Organic Carbon (TOC)%Total Nitrogen (TN)%Carbon-to-Nitrogen Ratio (C/N)
PM27.5 ± 0.722.0 ± 0.339.4 ± 0.23.9 ± 0.310.1
MS90.0 ± 0.281.3 ± 0.177.0 ± 0.81.3 ± 0.059.2
Inoculum20.9 ± 0.110.4 ± 0.232.0 ± 0.43.5 ± 0.09.3
Note: average value (AV), standard deviation (SD), pig manure (PM), maize straw (MS).
Table 2. Experimental design of Ss-AD.
ReactorPML
SubstratePMPM + MS aPM + MS a
Substrate/inoculum3:13:13:1
Inoculation methodMixed bMixed bLayer c
Feeding (kg TS)10.210.210.2
Total solid (TS) (%)20.320.320.3
a PM:MS = 1:1 based on VS. b Completely mixed substrate with inoculum. c Feeding inoculum and substrate present as layers without mixing, with three layers each of both the inoculum and substrate.
Disclaimer/Publisher’s Note: The statements, opinions and data contained in all publications are solely those of the individual author(s) and contributor(s) and not of MDPI and/or the editor(s). MDPI and/or the editor(s) disclaim responsibility for any injury to people or property resulting from any ideas, methods, instructions or products referred to in the content.

