Article

Omics Sequencing of Saccharomyces cerevisiae Strain with Improved Capacity for Ethanol Production

1
National Key Laboratory of Non-food Biomass Technology, Guangxi Academy of Sciences, Nanning 530007, China
2
CAS Key Laboratory of Environmental and Applied Microbiology, Environmental Microbiology Key Laboratory of Sichuan Province, Chengdu Institute of Biology, Chinese Academy of Sciences, Chengdu 610041, China
3
Guangxi Key Laboratory of Polysaccharide Materials and Modification, School of Marine Sciences and Biotechnology, Guangxi Minzu University, 158 West Daxue Road, Nanning 530008, China
*
Author to whom correspondence should be addressed.
These authors contributed equally to this work.
Fermentation 2023, 9(5), 483; https://doi.org/10.3390/fermentation9050483
Submission received: 12 April 2023 / Revised: 6 May 2023 / Accepted: 11 May 2023 / Published: 18 May 2023
(This article belongs to the Special Issue Anaerobic Fermentation of Biomass Waste for Methane Production)

Abstract

:
Saccharomyces cerevisiae is the most important industrial microorganism used to fuel ethanol production worldwide. Herein, we obtained a mutant S. cerevisiae strain with improved capacity for ethanol fermentation, from 13.72% (v/v for the wild-type strain) to 16.13% (v/v for the mutant strain), and analyzed its genomic structure and gene expression changes. Kyoto Encyclopedia of Genes and Genomes (KEGG) enrichment revealed that the changed genes were mainly enriched in the pathways of carbohydrate metabolism, amino acid metabolism, metabolism of cofactors and vitamins, and lipid metabolism. The gene expression trends of the two strains were recorded during fermentation to create a timeline. Venn diagram analysis revealed exclusive genes in the mutant strain. KEGG enrichment of these genes showed upregulation of genes involved in sugar metabolism, mitogen-activated protein kinase pathway, fatty acid and amino acid degradation, and downregulation of genes involved in oxidative phosphorylation, ribosome, fatty acid and amino acid biogenesis. Protein interaction analysis of these genes showed that glucose-6-phosphate isomerase 1, signal peptidase complex subunit 3, 6-phosphofructokinase 2, and trifunctional aldehyde reductase were the major hub genes in the network, linking pathways together. These findings provide new insights into the adaptive metabolism of S. cerevisiae for ethanol production and a framework for the construction of engineered strains of S. cerevisiae with excellent ethanol fermentation capacity.

1. Introduction

Ethanol is a potential environmentally friendly alternative to fossil fuels that can be used to propel light vehicles with gasoline, thereby improving octane numbers and reducing environmental pollution [1]. In addition, it is the premier biotechnological global product in terms of volume and economic value [2,3]. Sucrose is an abundant, cheap, and readily available substrate for industrial fermentation, and its use in the production of fuel ethanol has proved successful in Brazil [4,5]. Sugarcane contains 11–18% (wet W/W) sugars, comprised of 90% sucrose and 10% glucose and fructose [6]. During the edible sugar-making process, cane molasses is generated as a by-product in vast amounts, containing 45–60% sucrose and ~5–20% glucose and fructose [5,7]. Sucrose production is the most important industry in the Guangxi Zhuang Autonomous Region, accounting for ~60% of the total planting area and yield of sugarcane in China.
Sucrose-based fuel ethanol production is one of the world’s major biotechnological processes, which utilizes the microorganism Saccharomyces cerevisiae due to its ability to efficiently ferment sugars to ethanol and resist industrial environmental stresses [8,9]. Strains with optimal ethanol fermentation capacities can improve the efficiency of bioethanol production and reduce energy consumption and production costs considerably [3]. Thus, various strategies have been employed with the aim of developing new strains and improving ethanol production, ranging from early hybridization, protoplast fusion, and mutagenesis to recent genetic engineering, gene editing, and synthetic biology [10,11,12].
In the fermentation process, ethanol production, carbon dioxide generation, redox balancing, energy production, and cell growth are all coupled. Although the physiological and biochemical processes of yeast ethanol fermentation have been well characterized, there remains much to learn about the relationship between gene expression and cell characteristics [13]. Omics sequencing is a powerful tool that can be used to explore the relationship between gene mutations, gene expression differences, and cell trait changes to better understand the principles underlying physiological homeostasis and potentially uncover additional molecular phenotypes associated with specific characteristics [14,15,16,17,18].
In this study, two strains of S. cerevisiae were characterized, a wild type (WT) and a mutant (MT) strain, with an obvious advantage over the WT strain in ethanol fermentation when grown in a 30% (w/v) sucrose medium. Whole genome sequencing (WGS) and RNA sequencing (RNA-Seq) were used to analyze genomic differences and gene expression trends during the fermentation process between the two strains. Venn diagram analysis, KEGG enrichment analysis, and protein interaction analysis were used to characterize changes in gene expression in the MT strain during fermentation and identify key hub genes of metabolic adaptability. This study will help to better understand the metabolic characteristics of S. cerevisiae with a high capacity for ethanol fermentation and provide ideas for the construction of engineered S. cerevisiae.

2. Materials and Methods

2.1. Strains and Culture Conditions

S. cerevisiae WT (MATa/MATα) (CGMCC 2.4748) [19] is a wild-type diploid strain isolated from year-old sugar mill waste in Nanning, China, and S. cerevisiae MT (MATa/MATα) is a mutant of the WT strain. The MT strain was obtained by random mutation using UV irradiation; the screening process was as follows: the mutated cell solution was coated on a culture dish (150 mm) with a yeast peptone dextrose (YPD) medium (20 g L−1 tryptone, 10 g L−1 yeast extract, and 20 g L−1 glucose), cultured at 30 °C for two days. The grown cell moss on the culture dish was evenly divided into 16 regions, and each was scraped into 5 mL YPD medium for overnight culture at 30 °C, then 100 uL cell solution was absorbed into 5 mL YPD medium for overnight culture. Cell concentrations were measured, comparative amounts of cells were inoculated into 100 mL YPS30 medium (20 g L−1 tryptone, 10 g L−1 yeast extract, and 300 g L−1 sucrose) in 250 mL Erlenmeyer flasks, and ethanol fermentation was allowed to proceed at 30 °C, 180 rpm. Cells with the highest ethanol yield were coated on a culture dish again, repeated the above process five times, then isolated single colonies from the stain with the highest ethanol yield. After two rounds of isolation, we got the purified mutant with the highest ethanol yield. When the fermentation experiment was performed in this paper, cells were cultivated in a YPD medium at 30 °C, 180 rpm. Comparative amounts of freshly cultured WT and MT cells were inoculated into a 100 mL YPS30 medium in 250 mL Erlenmeyer flasks, and ethanol fermentation was allowed to proceed at 30 °C, 180 rpm.

2.2. Detection of the Fermentation Process

The number of cells was counted using an automated cell counter (IY1200 Counstar, Ruiyu, Shanghai, China) every 4 h. Ethanol production was quantified using a gas chromatograph (6890, Agilent, Palo Alto, CA, USA). In the fermentation broth, reducing sugar was determined using the dinitrosalicylic acid response. Following HCl hydrolysis, the total residual sugar content of the broth was quantified using the dinitrosalicylic acid response every 8 h. RNA-Seq was used to analyze gene expression at 16 h (T1), 40 h (T2), and 64 h (T3) during fermentation. Three parallel experiments were performed for each sample.

2.3. Whole Genome DNA Extraction, Library Construction, and Sequencing

Total genomic DNA was obtained by completely grinding cells in liquid nitrogen, decontaminating, adding cetyltrimethylamine bromide to facilitate the removal of polysaccharides, deproteinizing with phenol and chloroform, precipitating with isopropanol and absolute ethyl alcohol, washing with 75% alcohol to remove the sediment, and finally dissolving the pellet in ddH2O. DNA quality was assessed using a Nanodrop Microspectrophotometer (Nanodrop 2000, Thermo Fisher Scientific, Waltham, MA, USA) and agarose gel electrophoresis. At least 3 µg of genomic DNA was used to construct paired-end libraries with an insert size of 500 bp using a Paired-end DNA Sample Prep kit (Illumina Inc., San Diego, CA, USA). These libraries were then sequenced on a NovaSeq6000 system using a PE 150 strategy by GeneDenovo Biotechnology Co., Ltd. (Guangzhou, China).

2.4. RNA Extraction, Library Construction, and Sequencing

Total RNA was extracted using a Trizol reagent kit (Invitrogen, Carlsbad, CA, USA) according to the manufacturer’s protocol. RNA quality was assessed on an Agilent 2100 Bioanalyzer (Agilent Technologies, Palo Alto, CA, USA) and checked using RNase-free agarose gel electrophoresis. mRNA was enriched using Oligo (dT) beads. The enriched mRNA was fragmented into short fragments using a fragmentation buffer and reverse transcribed into complementary DNA (cDNA) using a NEB_Next Ultra RNA Library Prep Kit for Illumina (NEB #7530, New England Biolabs, Ipswich, MA, USA). The purified double-stranded cDNA fragments were end-repaired, followed by the addition of an adenylate (A) base; then, the fragments were ligated to Illumina sequencing adapters. The ligation reaction product was purified using AMPure XP Beads (1.0×). The ligated fragments were subjected to size selection using agarose gel electrophoresis and amplified using polymerase chain reaction (PCR). The resulting cDNA libraries were sequenced using an Illumina NovaSeq 6000 by GeneDenovo Biotechnology Co., Ltd (Guangzhou, China).

2.5. Sequence Data Analysis

The WGS and RNA-Seq raw reads were deposited in the Sequence Read Archive database with accession number PRJNA885247.
Raw WGS reads were processed to obtain high-quality clean reads by removing reads with ≥10% unidentified nucleotides (N), reads with >50% bases having Phred quality scores ≤ 20, and reads aligned to the barcode adapter. To identify single nucleotide polymorphisms (SNPs) and insertion–deletion mutations (InDels), the Burrows–Wheeler Aligner was used to align the clean reads from each sample against the reference genome (Ensembl_release100 of S. cerevisiae) [20]. Variant calling was performed for all samples using the GATK Unified Genotyper. SNPs and InDels were filtered using GATK’s Variant Filtration with proper standards [21]. To determine the physical positions of each SNP, the software tool ANNOVAR was used to align and annotate SNPs or InDels [22]. Structural variation [23] was determined using the software BreakDancer (Max1.1.2., Ken Chen, The Genome Center, St. Louis, MO, USA) [24].
Raw RNA-Seq reads were further filtered using fastp (version 0.18.0) [25]. Reads containing adapters, ≥10% of unknown nucleotides, low-quality reads containing ≥50% low-quality (Q-value ≤ 20) bases, and reads mapped to rRNA were removed. The remaining clean reads were further used in assembly and gene abundance calculations. Using Ensembl_release100 of the S. cerevisiae genome FASTA file as the reference genome, the index of the reference genome was built, and paired-end clean reads were mapped to the reference genome using HISAT2.2.4 [26]. The fragment per kilobase of transcript per million mapped reads (FPKM) value was calculated to quantify gene expression abundance and variations using RSEM software (v1.3.1, Bo Li, Departmet of Comuter Sciences, University of Wisconsin-Madison, Madison, WI, USA) [27]. Correlation analysis of two parallel experiments was performed using R Correlation. Gene differential expression analysis was performed using DESeq2 [28]. Gene expression pattern analysis was used to cluster genes of similar expression patterns from multiple samples (at least three in a specific time point, space, or treatment dose size order). To examine the expression pattern of differentially expressed genes (DEGs), the expression data of each sample (in the order of treatment) were normalized to 0, log2(v1/v0), and log2(v2/v0), and then clustered using Short Time-series Expression Mine software (STEM, Jason Ernst, School of Computer Science, Carnegie Mellon University, Pittsburgh, PA, USA) [29]. The clustered profiles with p-values ≤ 0.05 were considered significant profiles. KEGG enrichment analysis of the target DEGs was performed using the KOBAS 3.0 package. The protein interaction network was analyzed using the interaction relationships in the STRING protein interaction database (http://string-db.org, accessed on 28 February 2022) [30], and the interaction network diagram was constructed using Cytoscape [31].

2.6. Quantitative Reverse Transcription PCR (qRT-PCR)

Two comparison groups, MT-T1 vs. MT-T2 and WT-T2 vs. MT-T2 were selected as objects, and qRT-PCR of 21 genes from the two comparison groups were used to verify the RNA-Seq accuracy. The amplified primers were shown in Table S1. Biological replicates of each gene were identical to those used for RNA-Seq. Reverse transcription was performed using the HiScrip II Q RT SuperMix kit for qPCR (R223, Vazyme, Nanjing, China), and qPCR was performed using the ChanQ SYBR qPCR Master Mix kit (Q341, Vazyme, Nanjing, China) on a TianLong 988 system (Tianlong, Xi’an, China). Data were analyzed using the 2−ΔΔCt method, with bifunctional DRAP deaminase/tRNA pseudouridine synthase RIB2 as the reference gene.

3. Results

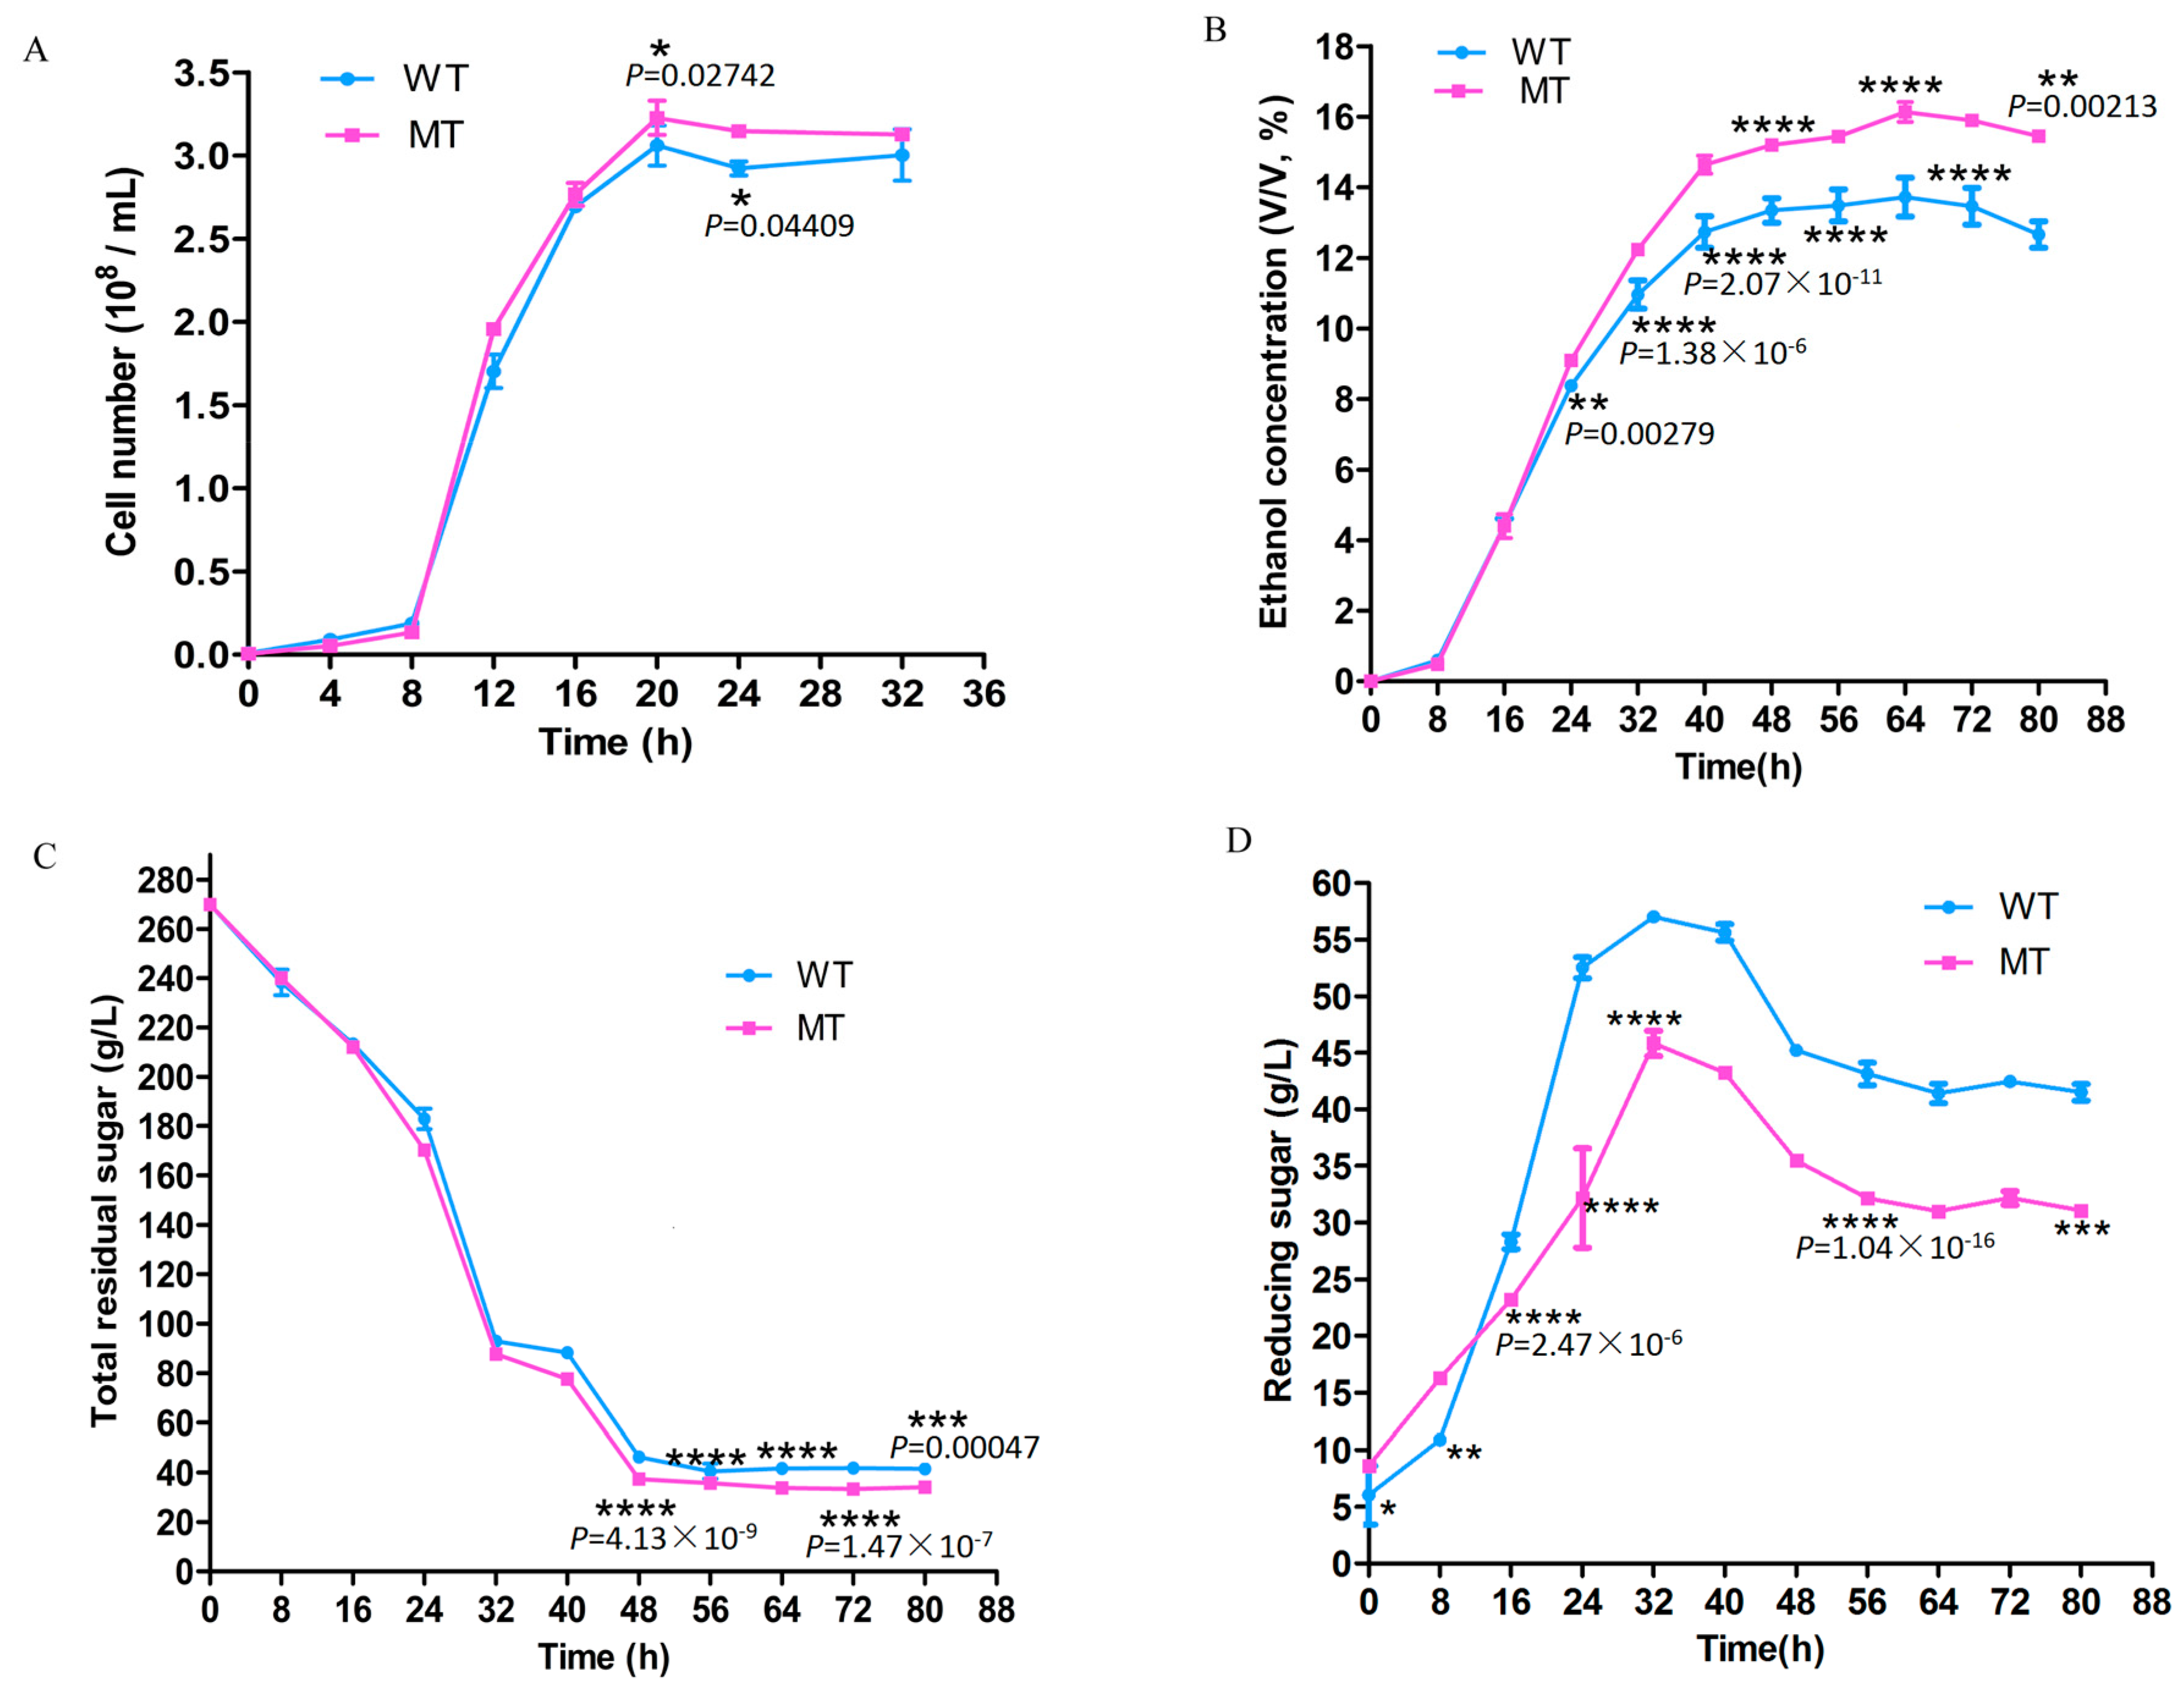
3.1. Cell Growth and Fermentation

The S. cerevisiae MT strain had obvious advantages in growth and ethanol fermentation in 30% (w/v) sucrose medium compared to that of the WT strain. During the cell growth phase, the difference in cell number between the MT and WT strains was pronounced after 20 h, with a maximum mean cell number for the two strains of 3.06 × 10⁸ and 3.23 × 10⁸, respectively (Figure 1A). The trend in sugar consumption was consistent with that of ethanol yield; the difference between the two strains was shown after 24 h, and the ethanol yields were the highest at 64 h (13.72% v/v for the WT strain and 16.13% v/v for the MT strain (Figure 1B)). The total residual sugar content in the fermentation broth was stable from 48 h, while at the end of 80 h fermentation, the total residual sugar content was 41.52 g/L (WT) and 34.03 g/L (MT) (Figure 1C). The reduced sugar content in the fermentation broth showed an initial increase and subsequently decreased, peaking at 32 h. The sugar reduction of MT was significantly lower than that of WT after 16 h, at 31.0667 g/L (MT) and 41.5 g/L (WT) after 80 h fermentation (Figure 1D). Almost all the sucrose in the fermentation broth of the WT strain became reducing sugar.

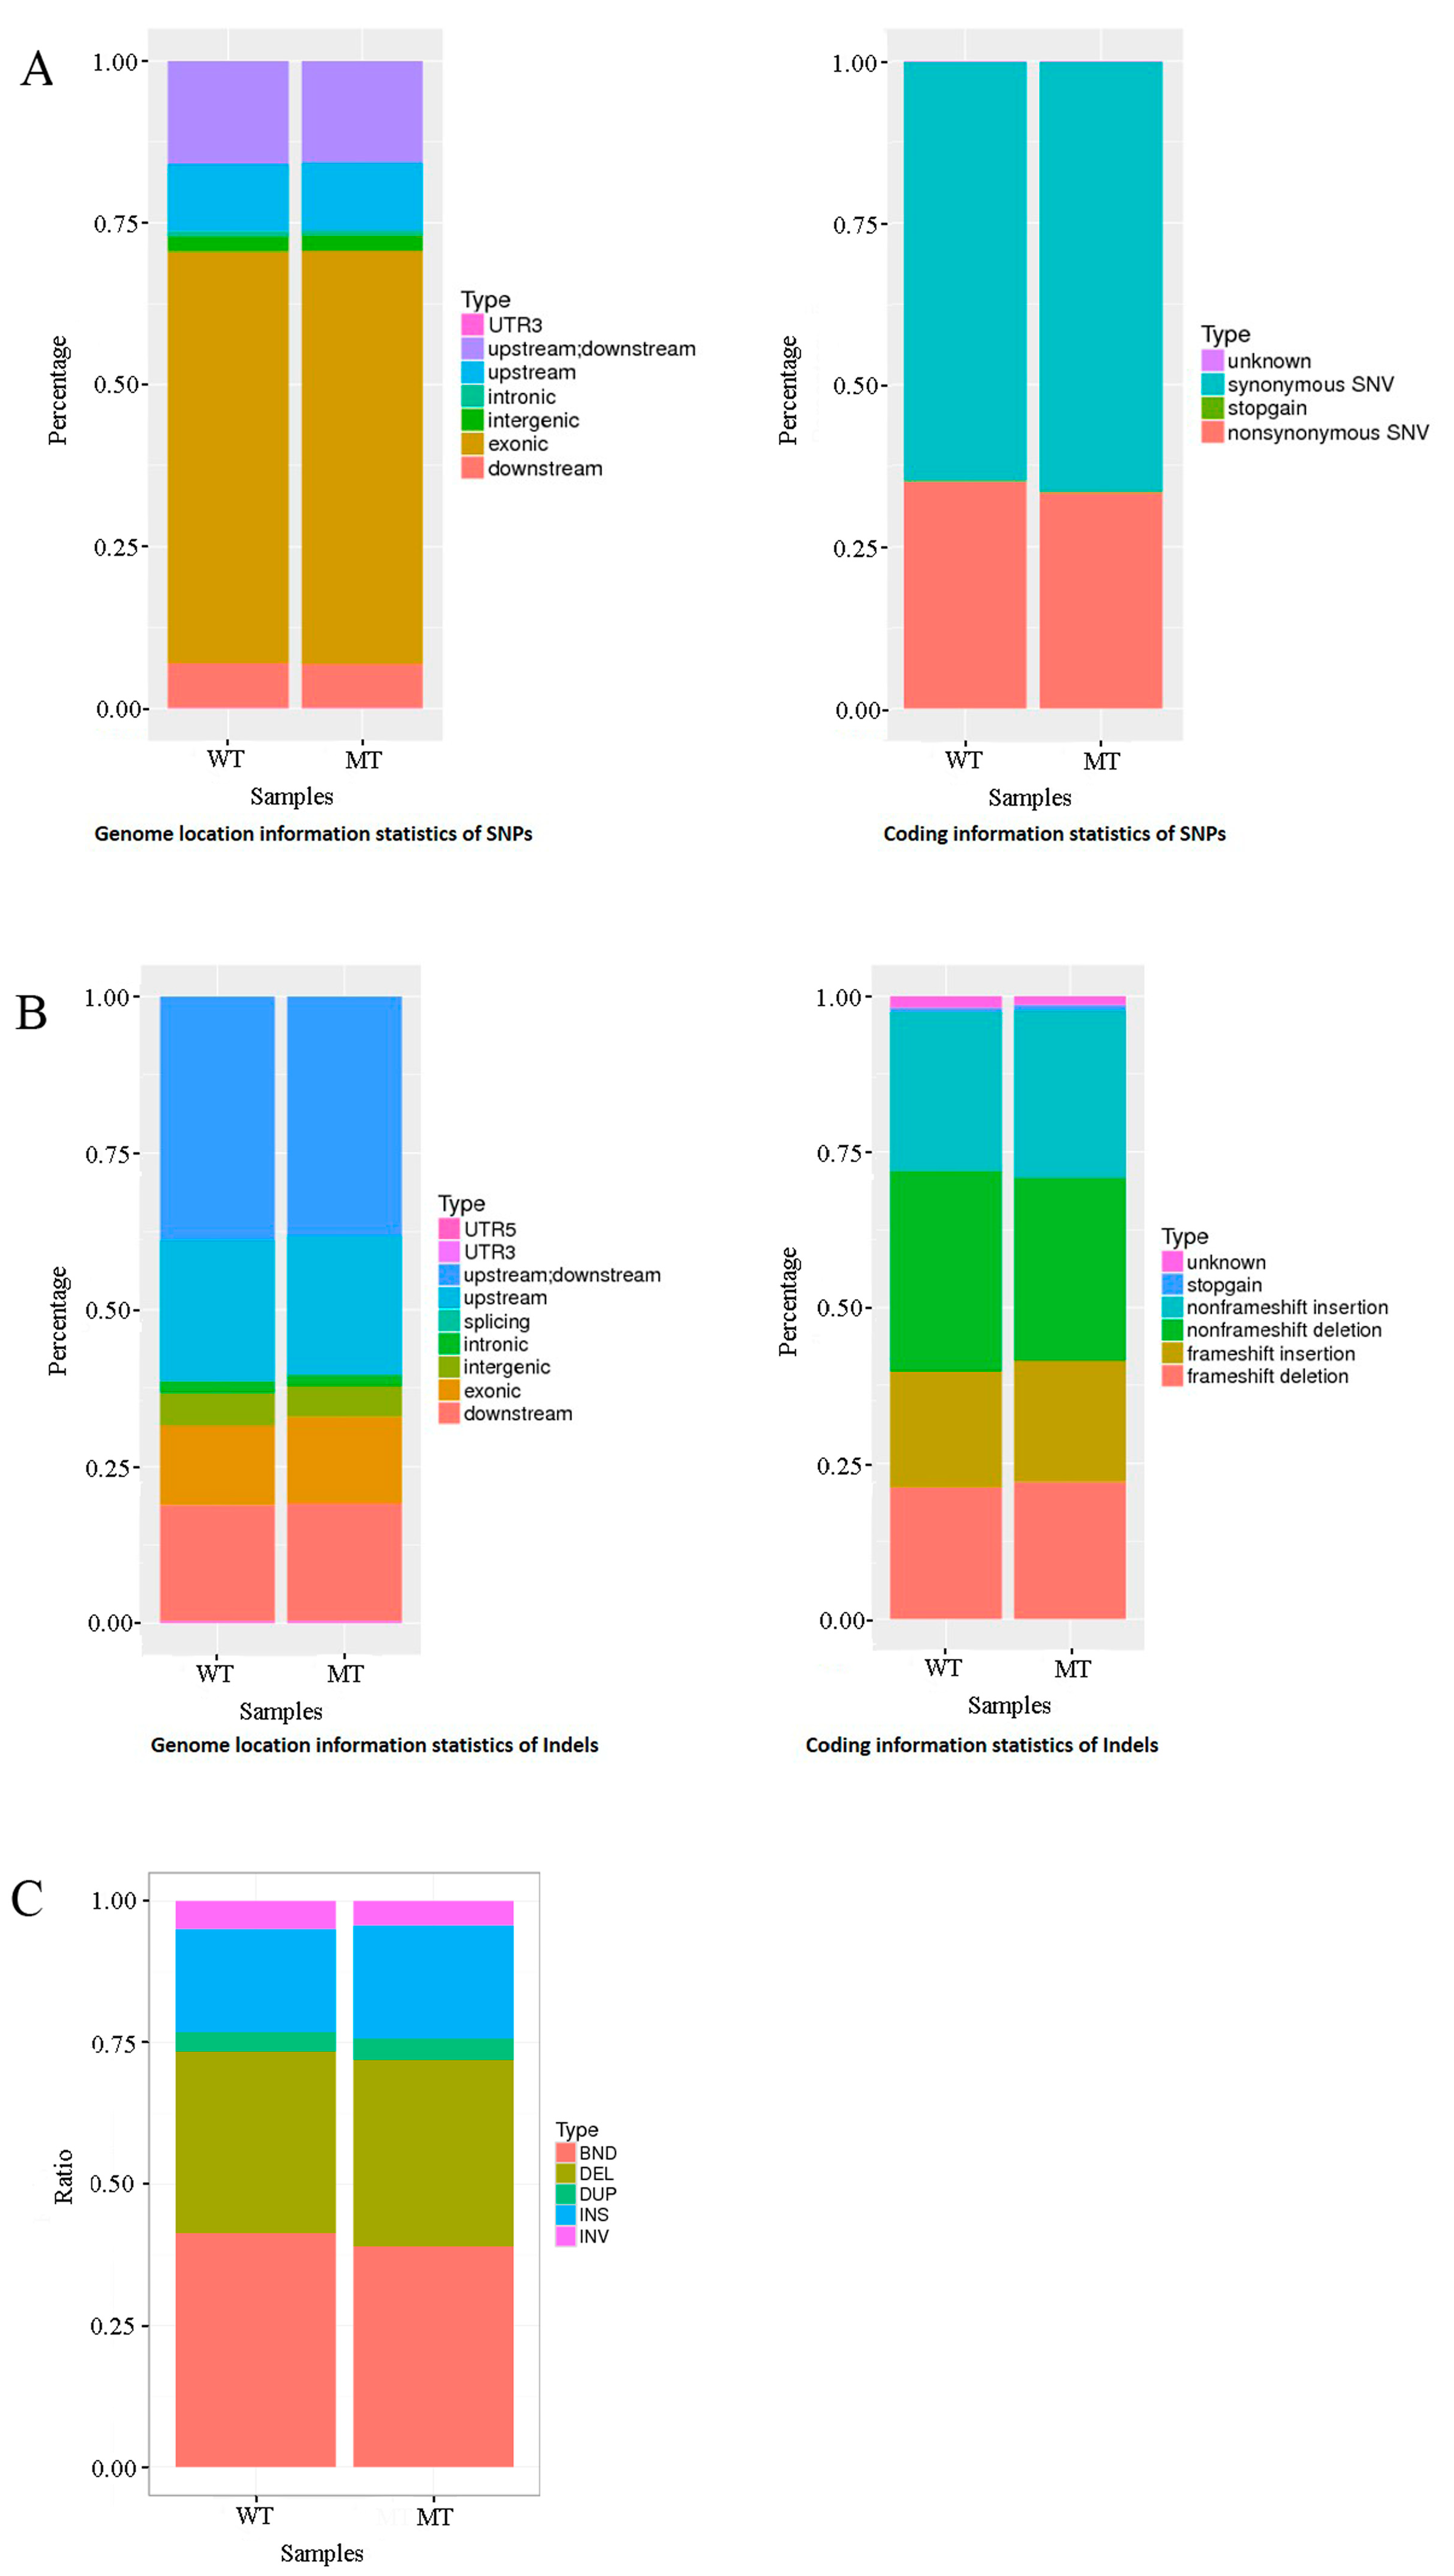
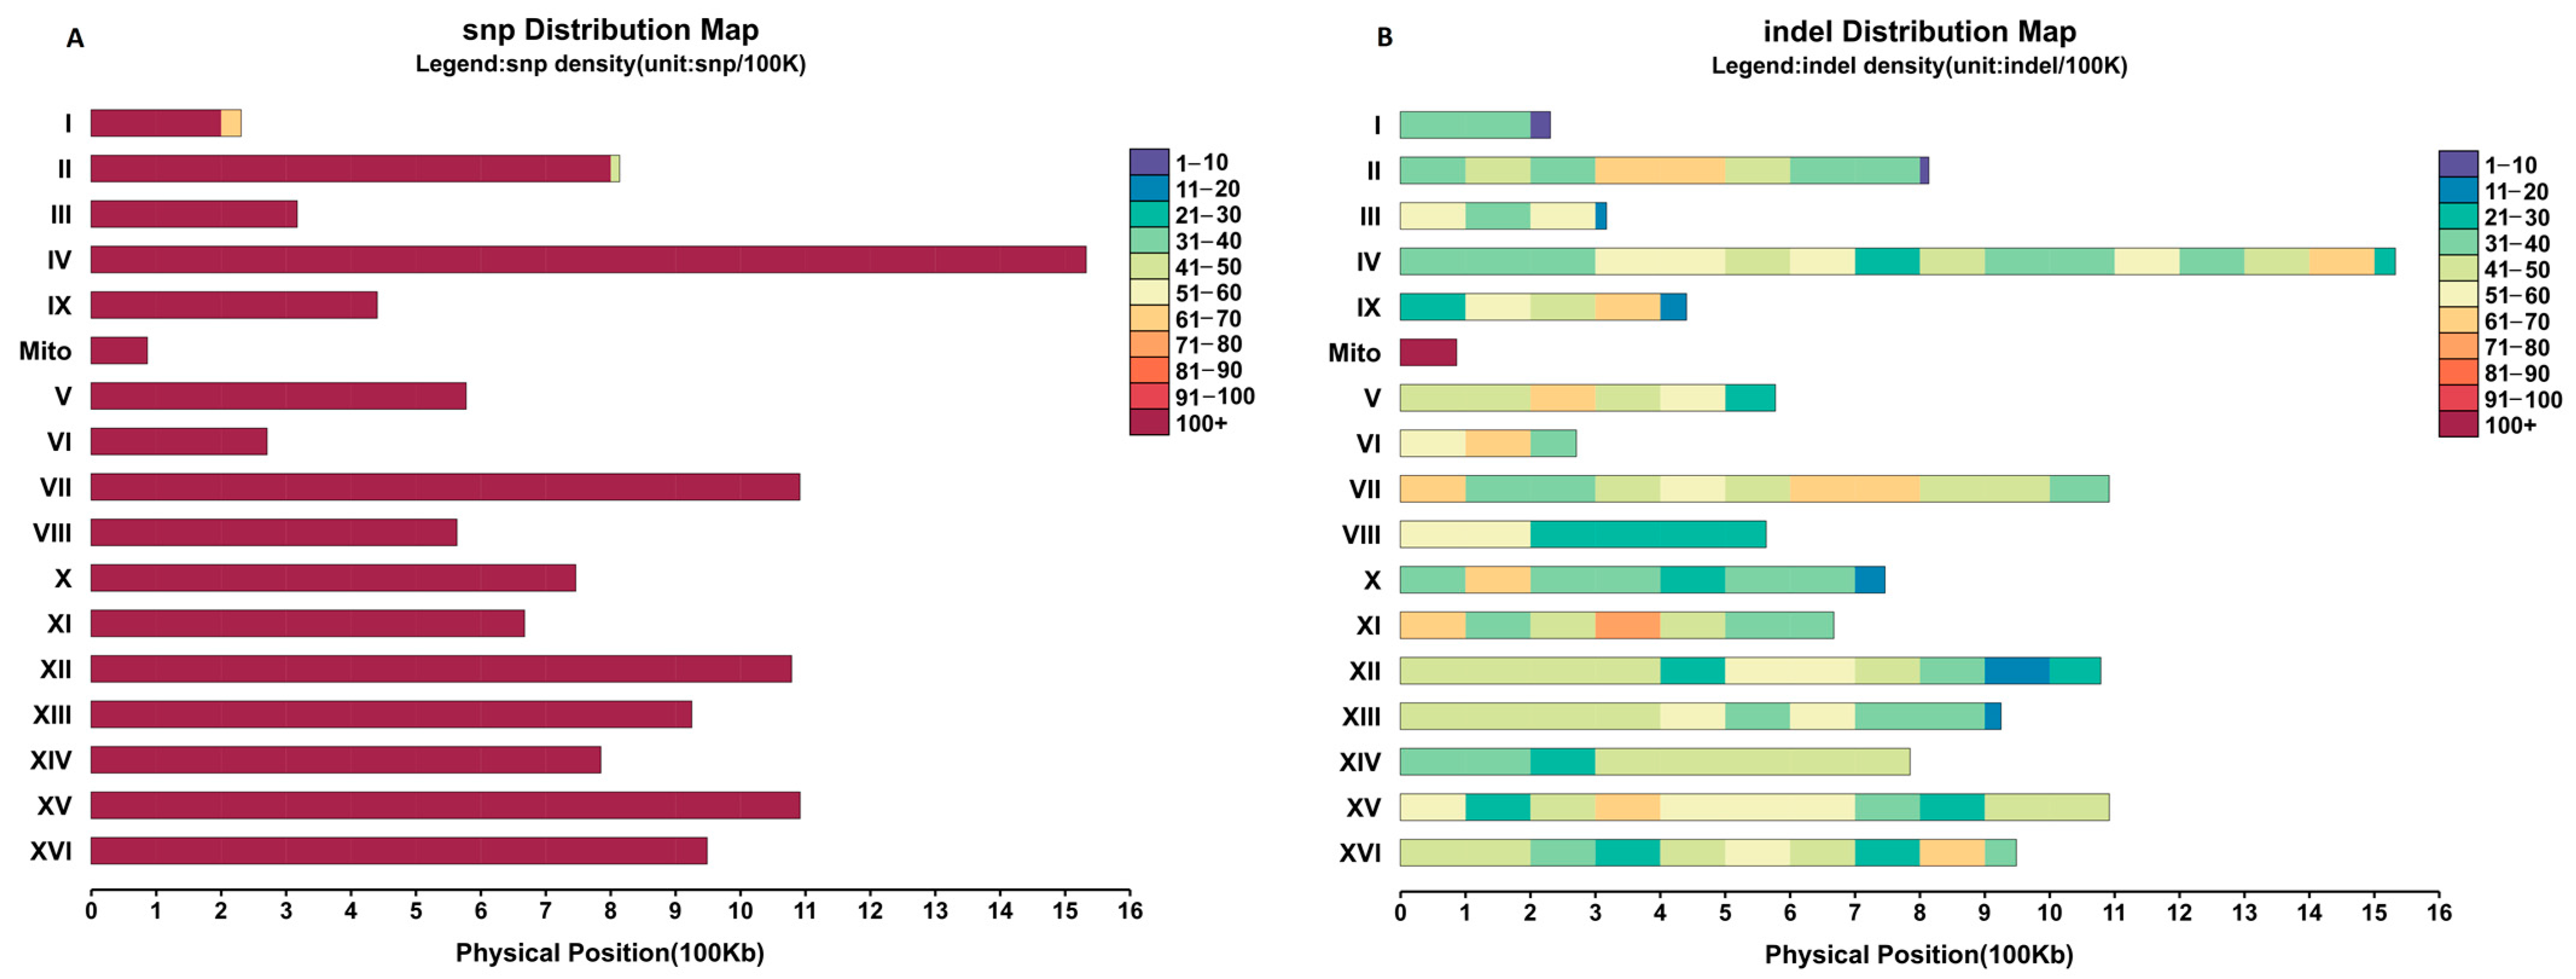
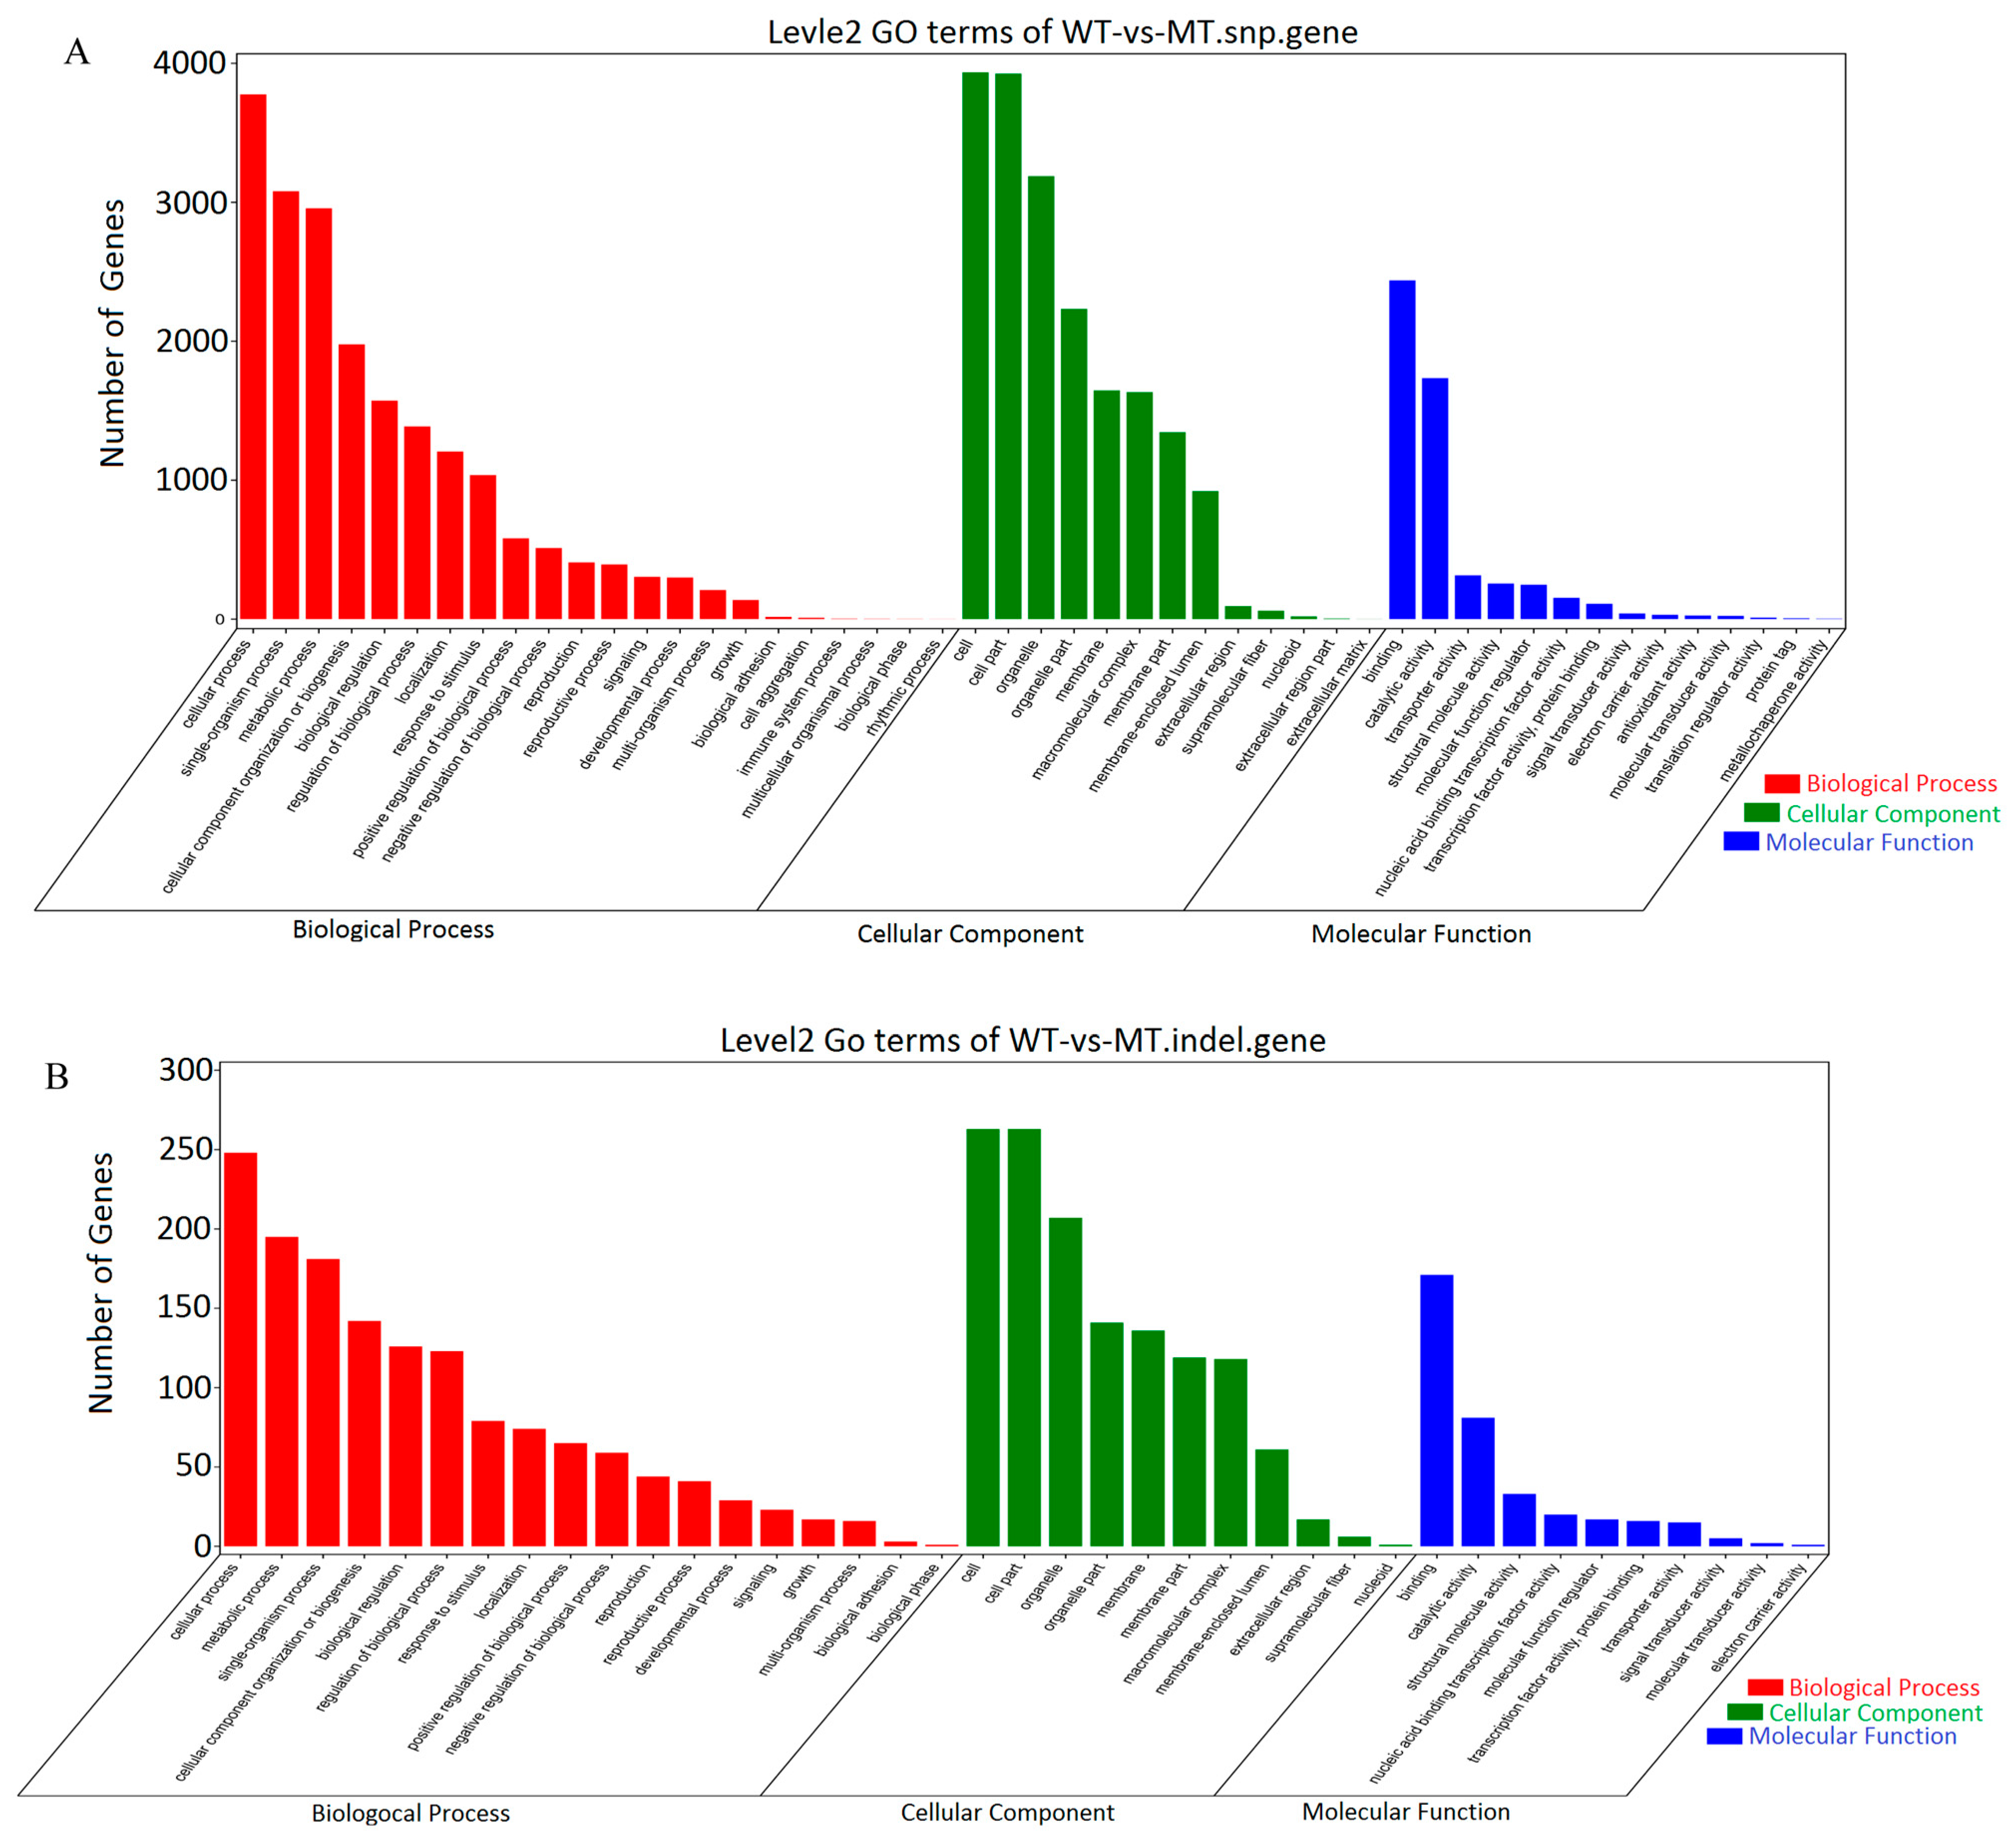
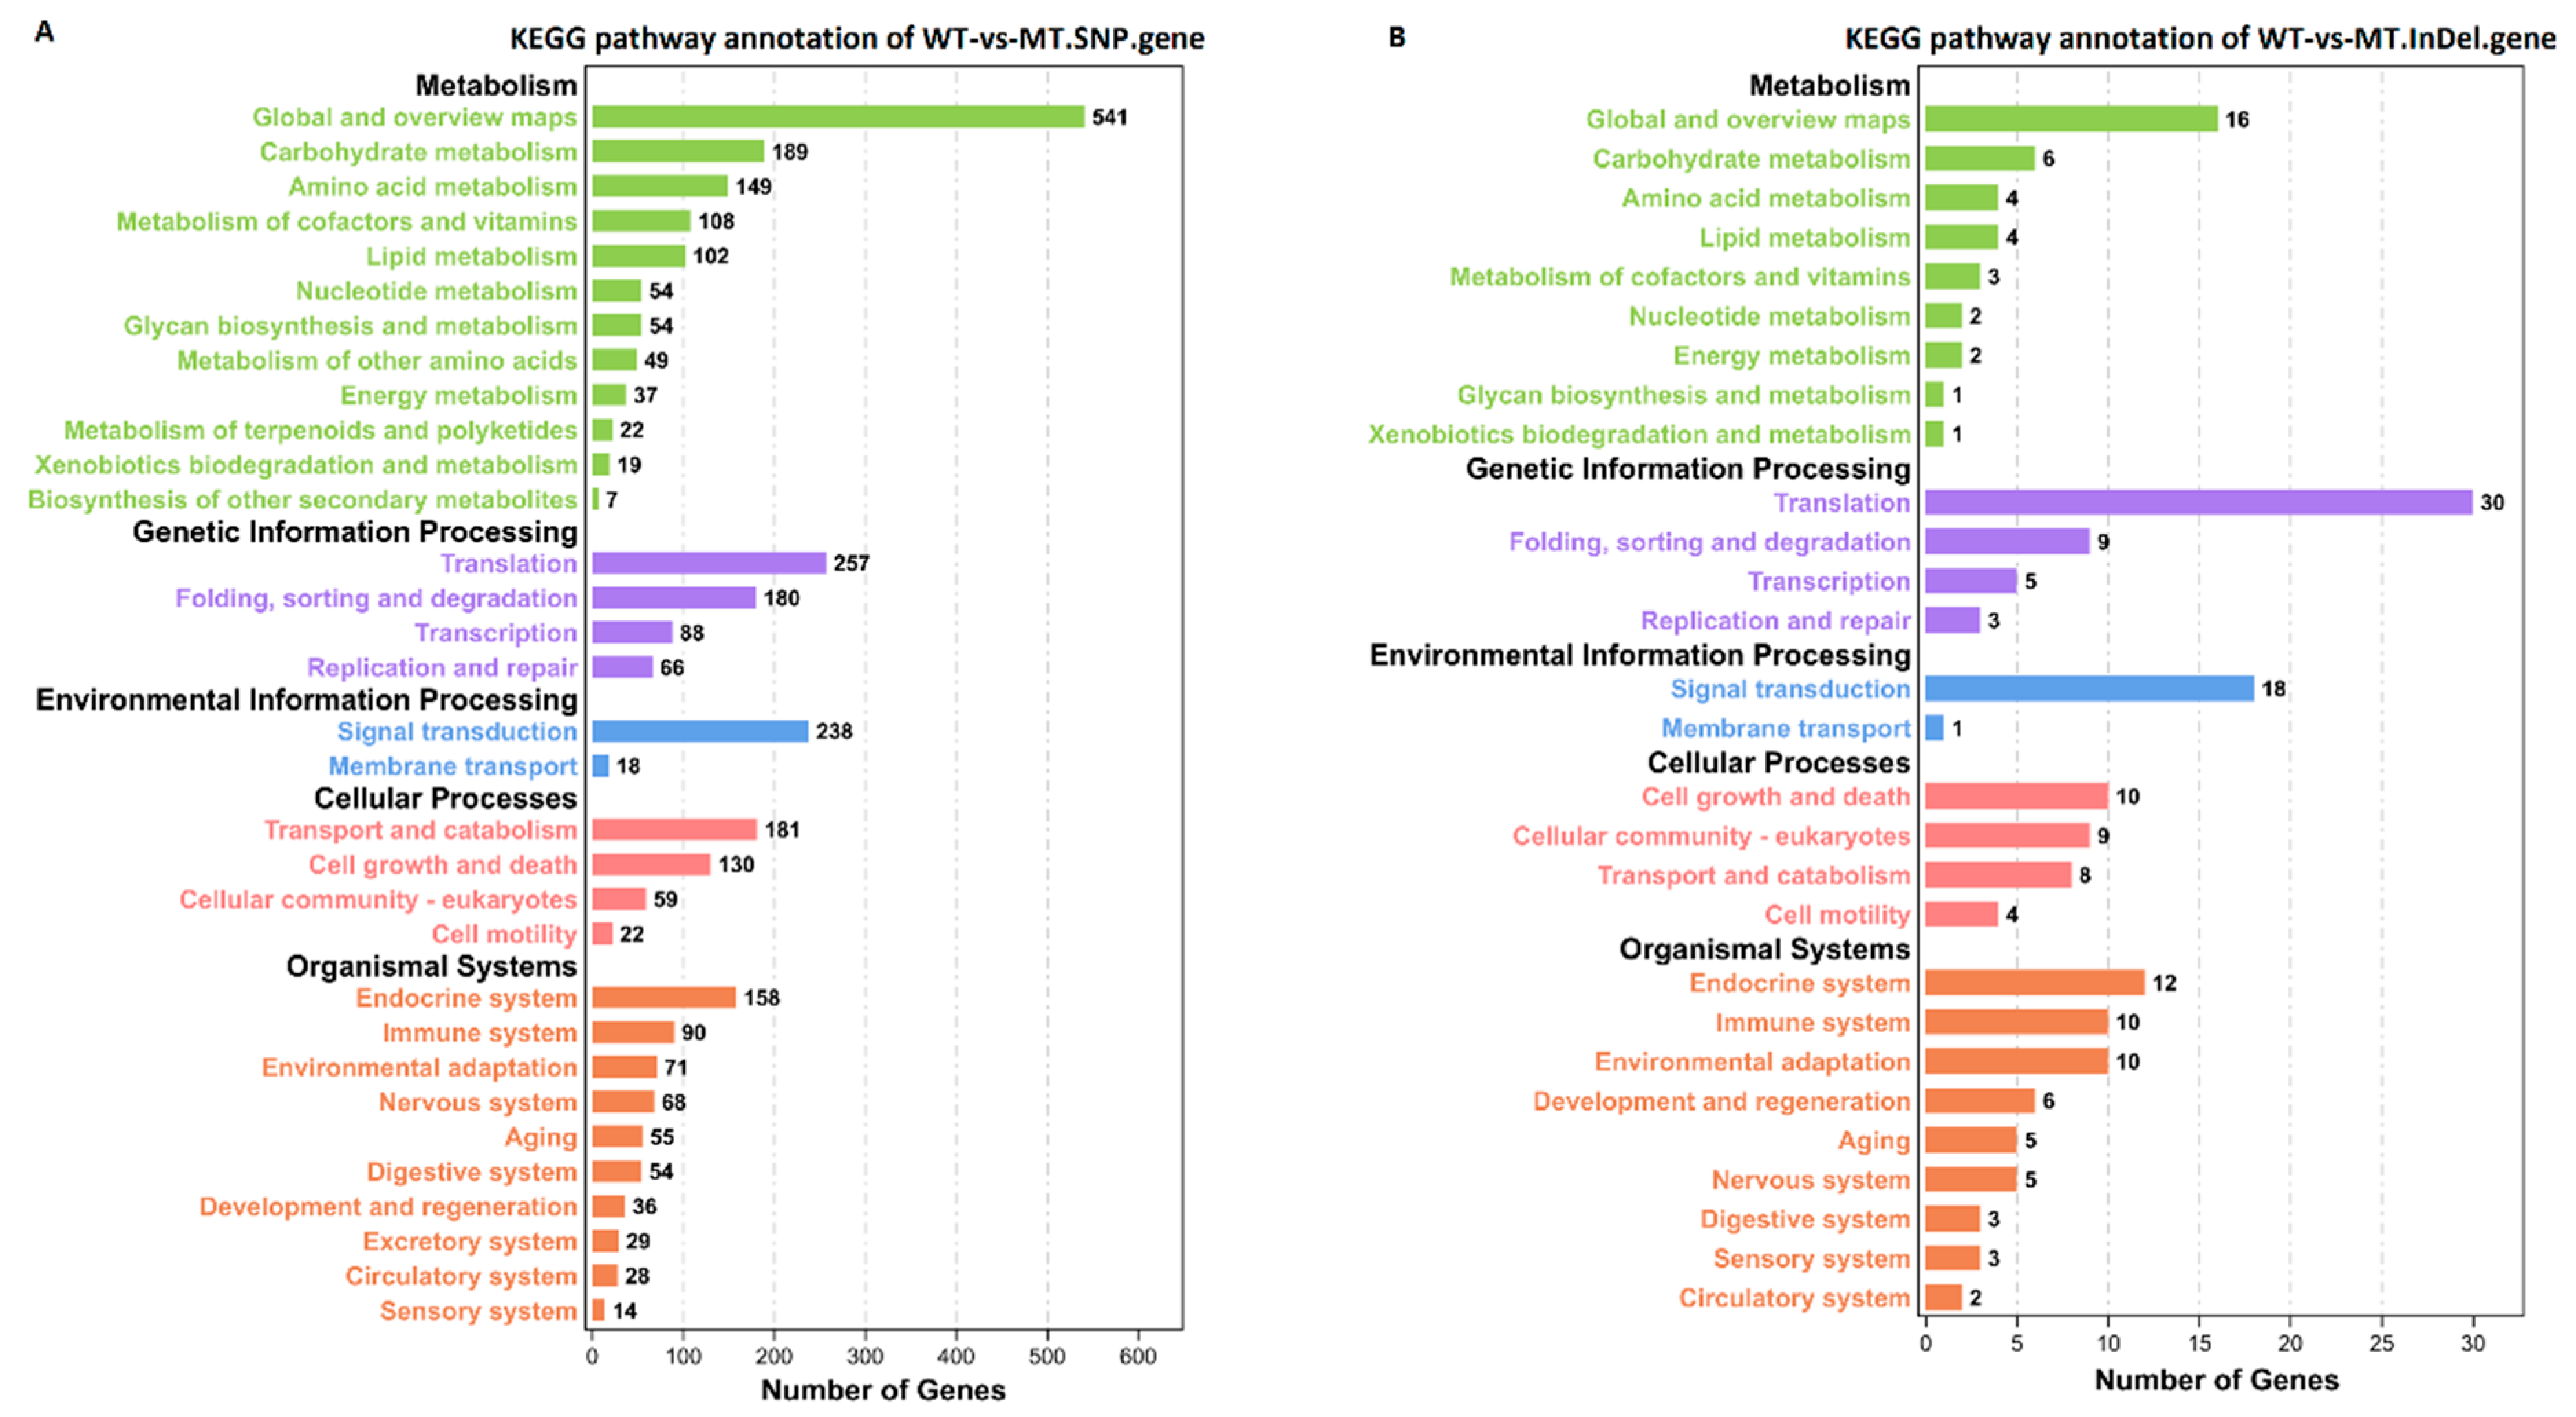
3.2. Genome Sequencing

Strict quality control and data filtering were performed on the original data to obtain the high-quality clean reads used in the data analysis. Genome coverage, sequencing depth, SNPs, and InDels in the two samples were analyzed by aligning the sequences with the reference genome of S. cerevisiae (Ensembl_release100). The statistics on quality of sequencing data were shown in Tables S2–S5, on information of SNPs and InDels were shown in Tables S6–S10. There was no obvious difference in the genome location of SNPs between the two strains, but SNP coding information in the MT strain contained significant changes compared to that of the WT; synonymous single-nucleotide variants (SNVs) increased, while nonsynonymous SNVs decreased (Figure 2A). The location of InDels in the MT genome changed in both the exons and upstream of the coding region, while the coding information changed in frameshift and nonframeshift deletions (Figure 2B). SV included translocation breakends (BND), deletions (DEL), tandem duplications (DUP), insertions (INS), and inversions (INV), shown in Figure 2C. Compared to that of the WT strain, the proportion of BNDs decreased, and INSs increased in the MT strain. The distribution density of SNPs on each chromosome was relatively high (Figure 3A), while the distribution density of InDels was high only on mitochondria (Figure 3B). The GO enrichment of the SNPs and InDels in MT strain was significantly enriched in cellular process, single-organism process, metabolic process (Biological Process), cell, cell part, and organelle (Cellular Component), binding and catalytic activity (Molecular Function) (Figure 4). The KEGG enrichment result of SNPs was basically consistent with the result of InDels (Figure 5). Significantly enriched metabolic pathways include carbohydrate metabolism, amino acid metabolism, metabolism of cofactors and vitamins, and lipid metabolism.

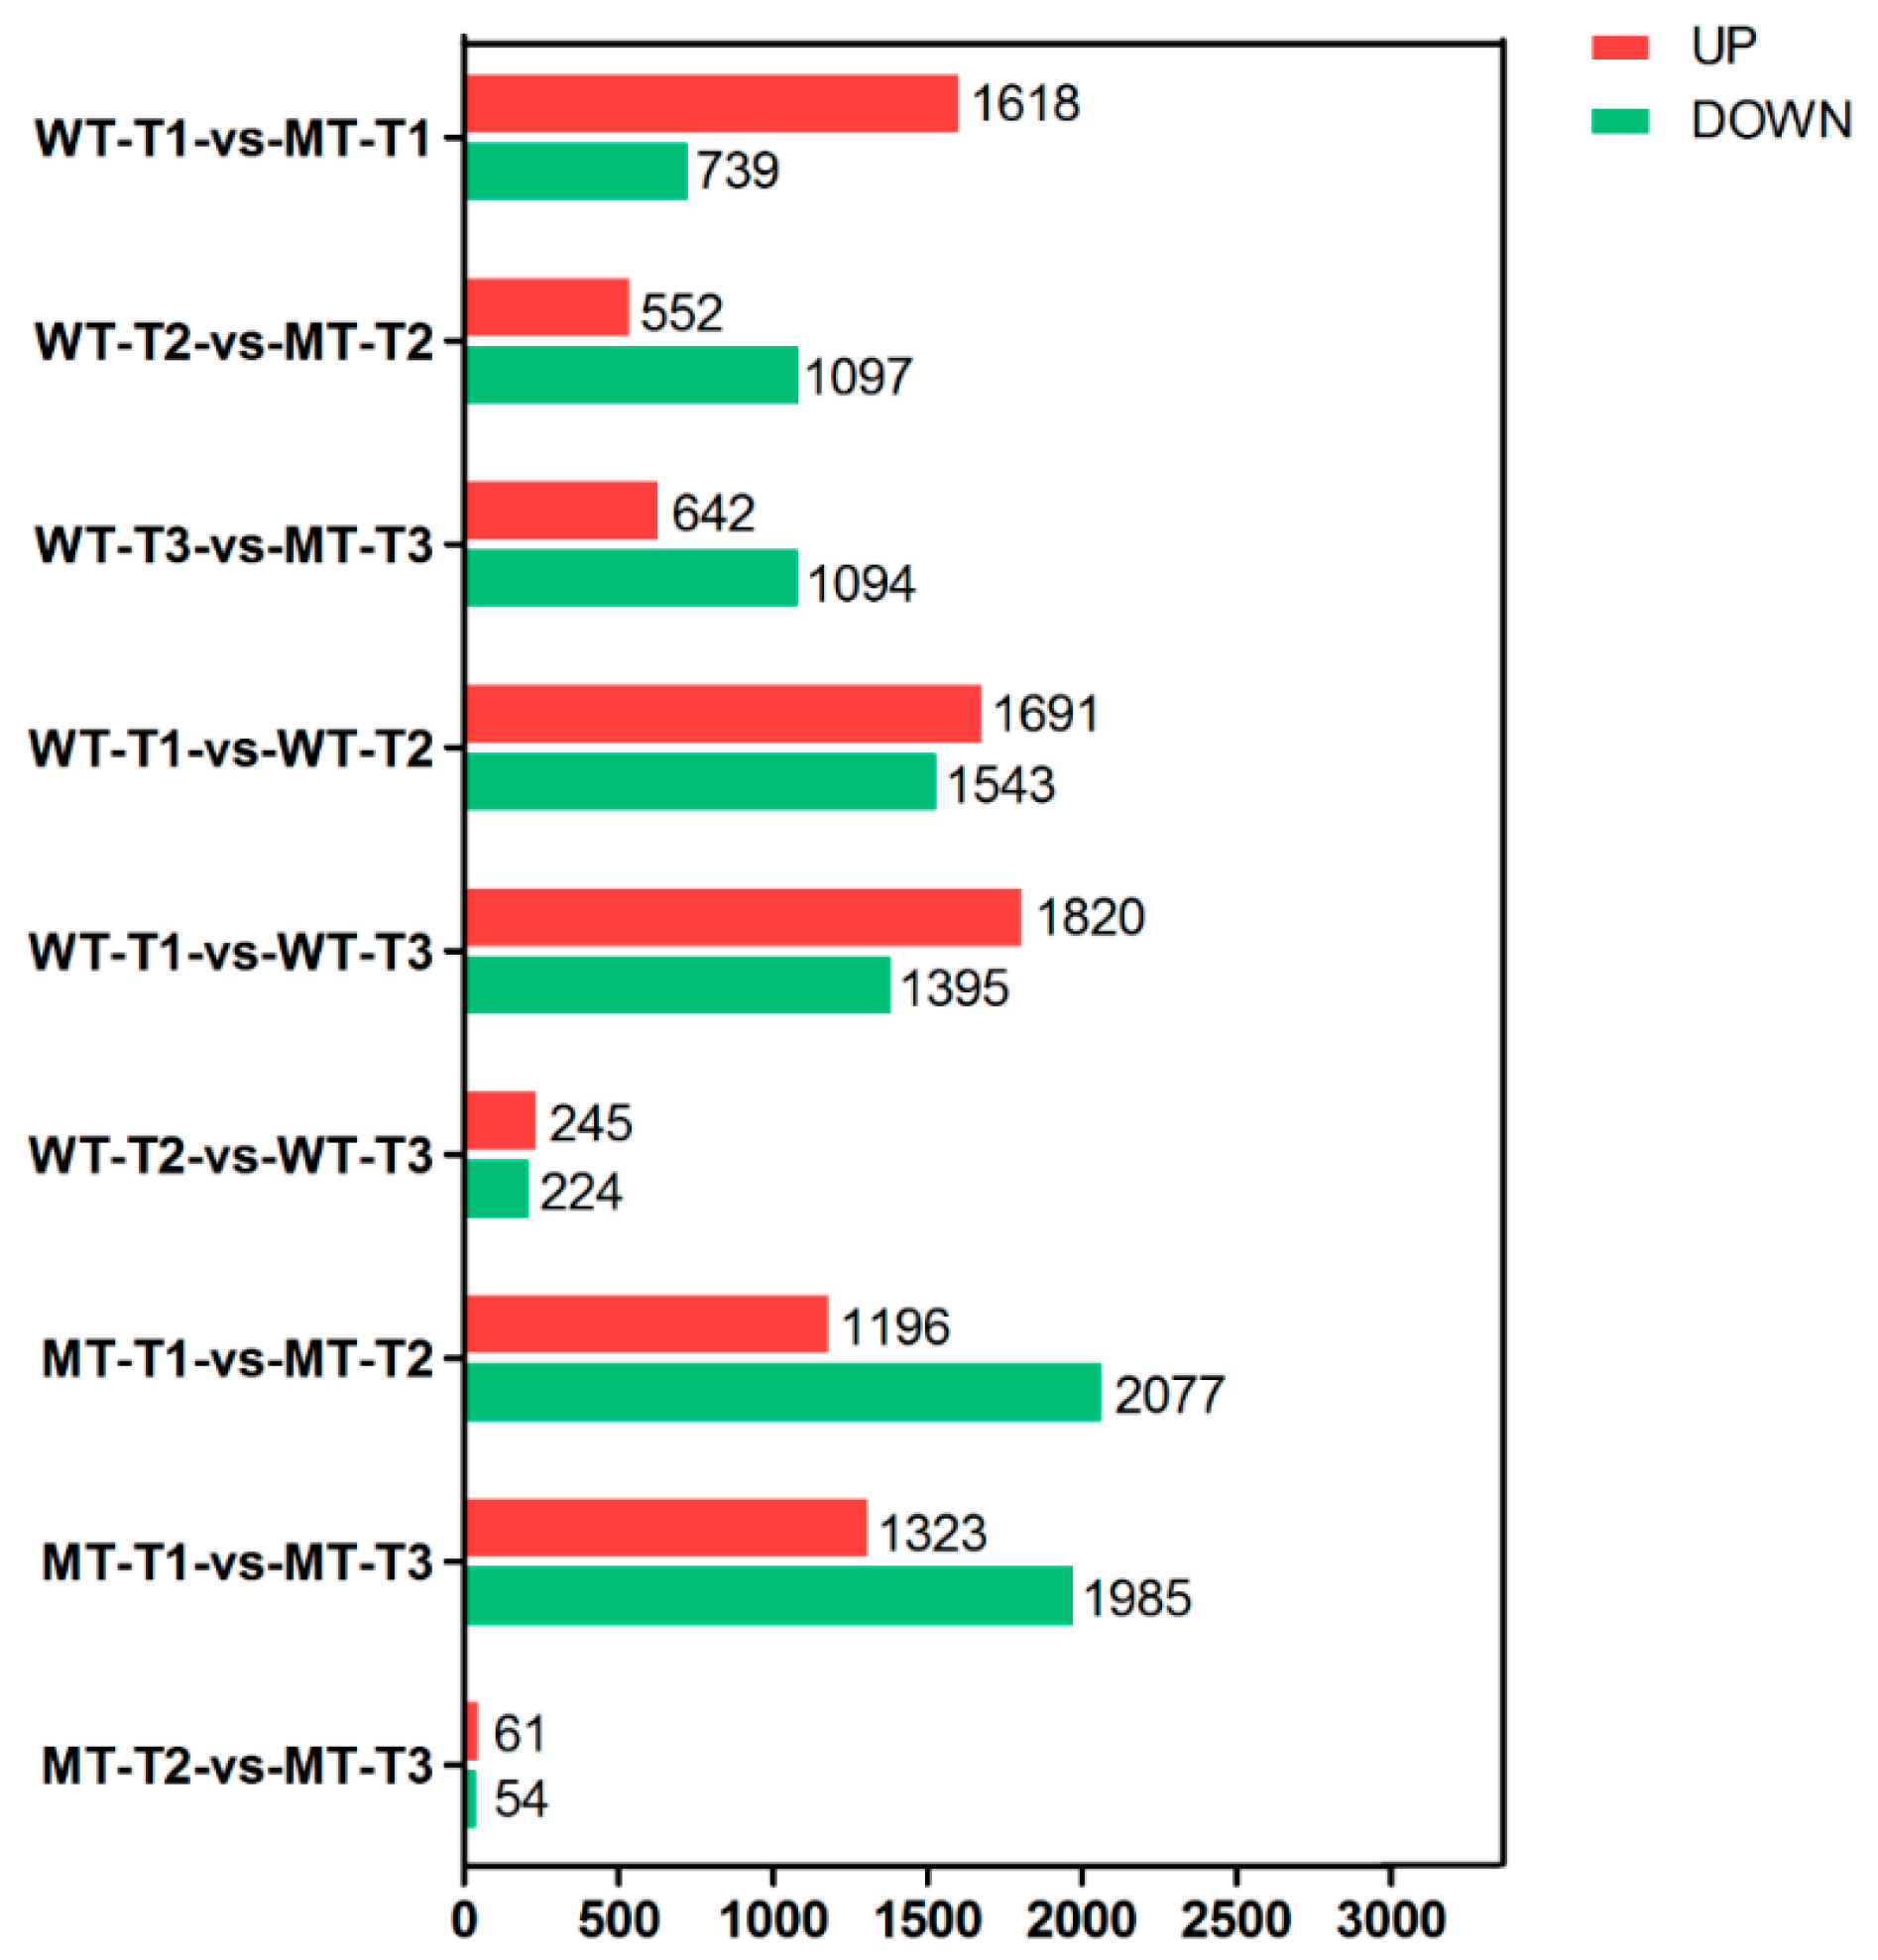
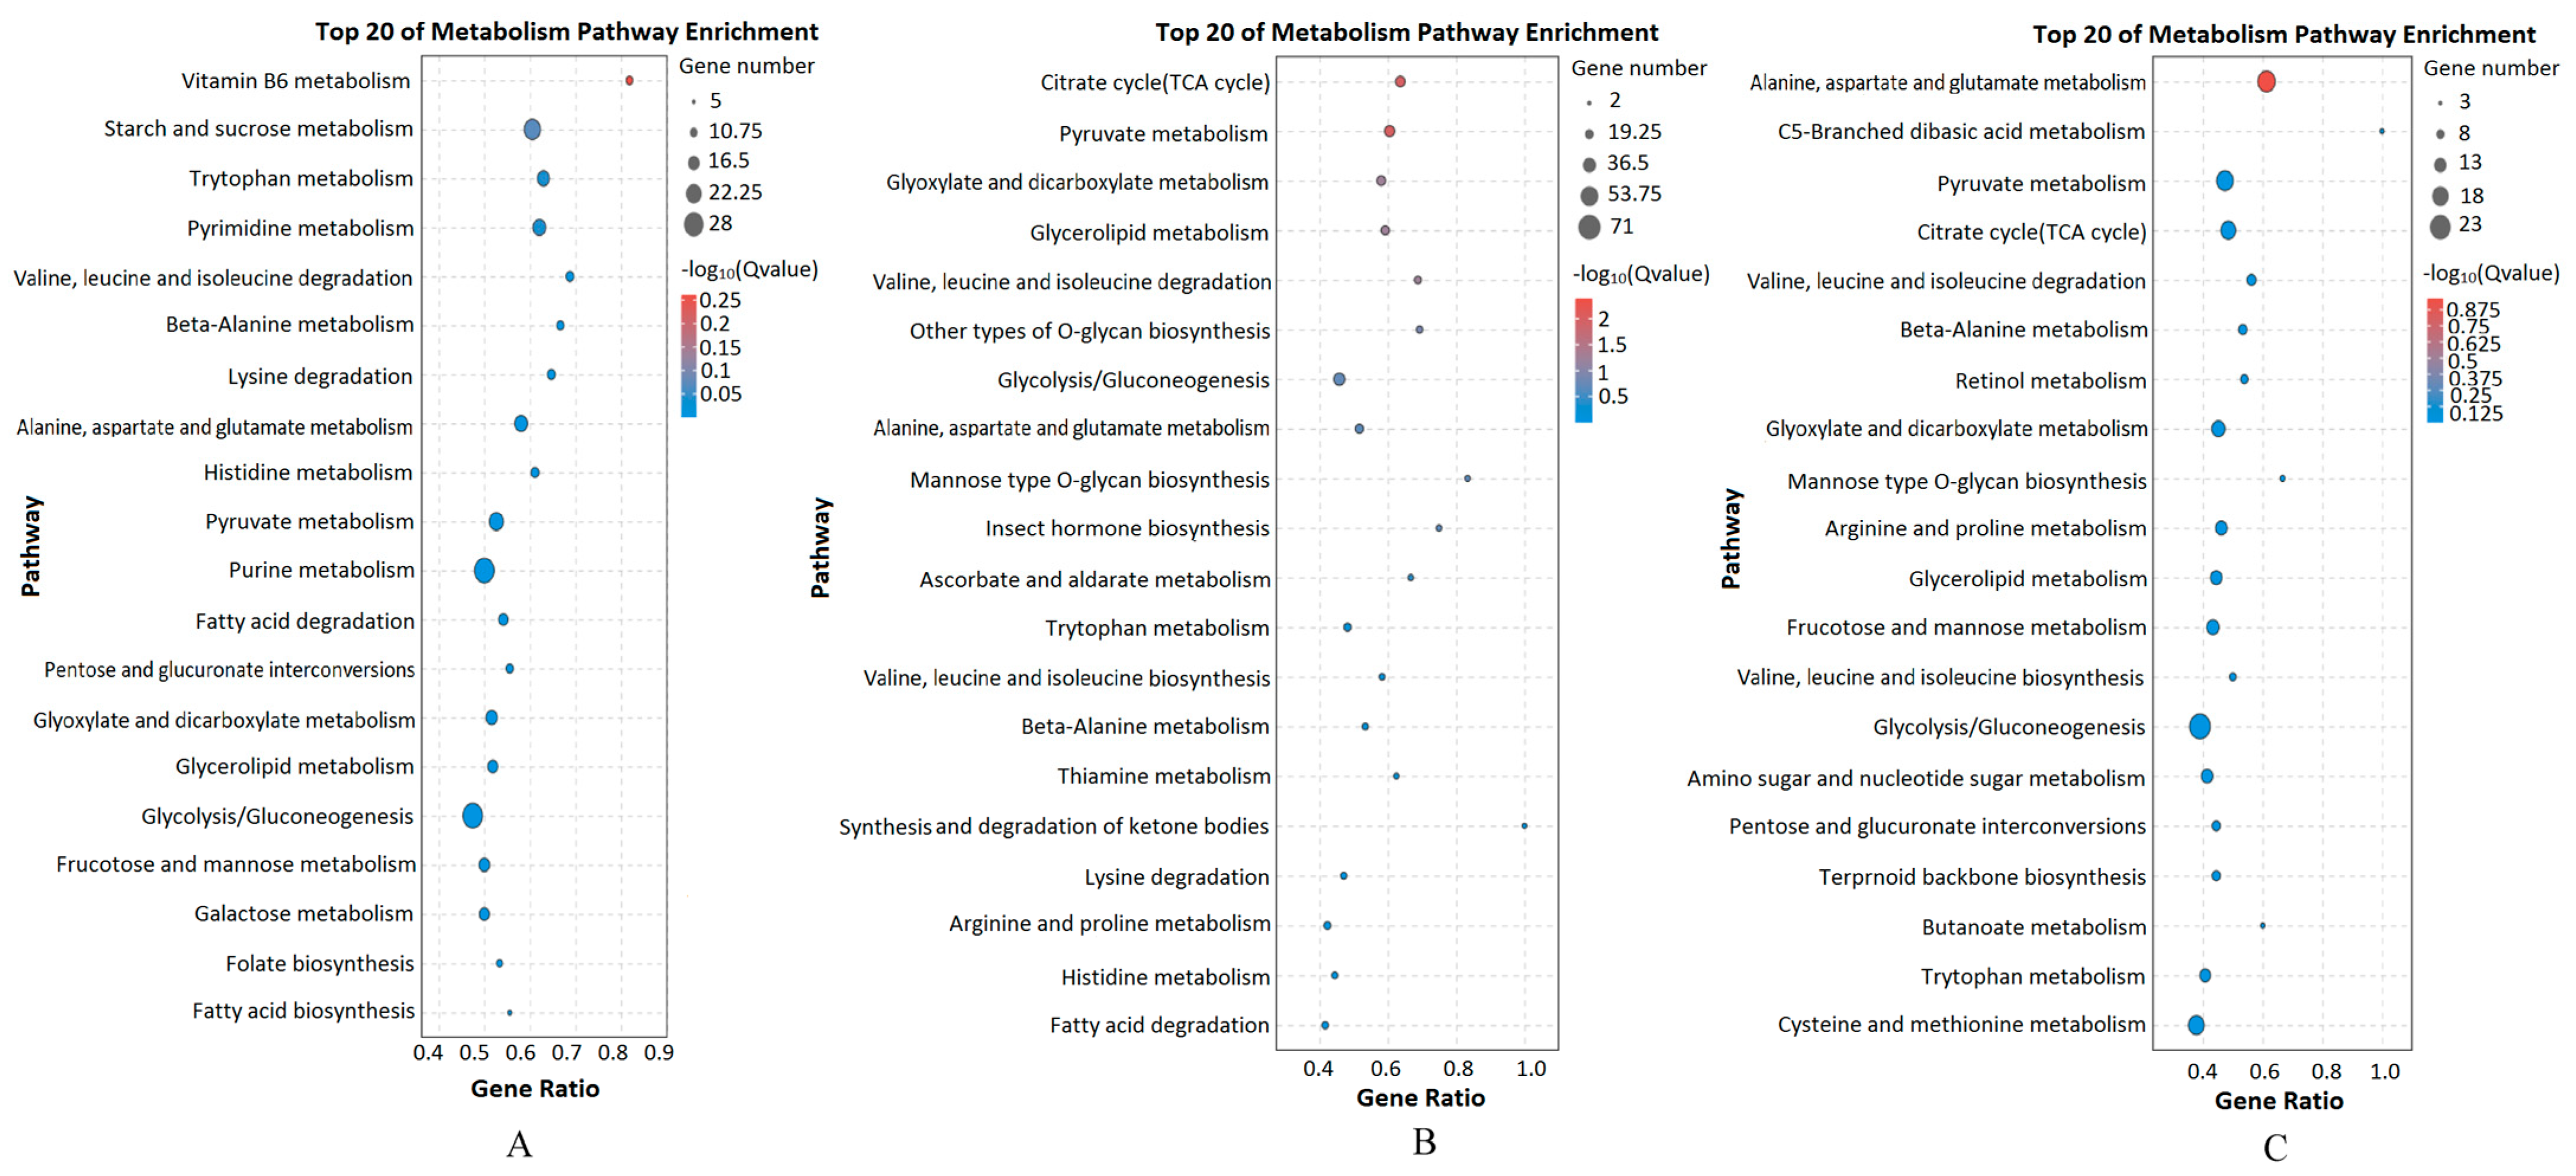
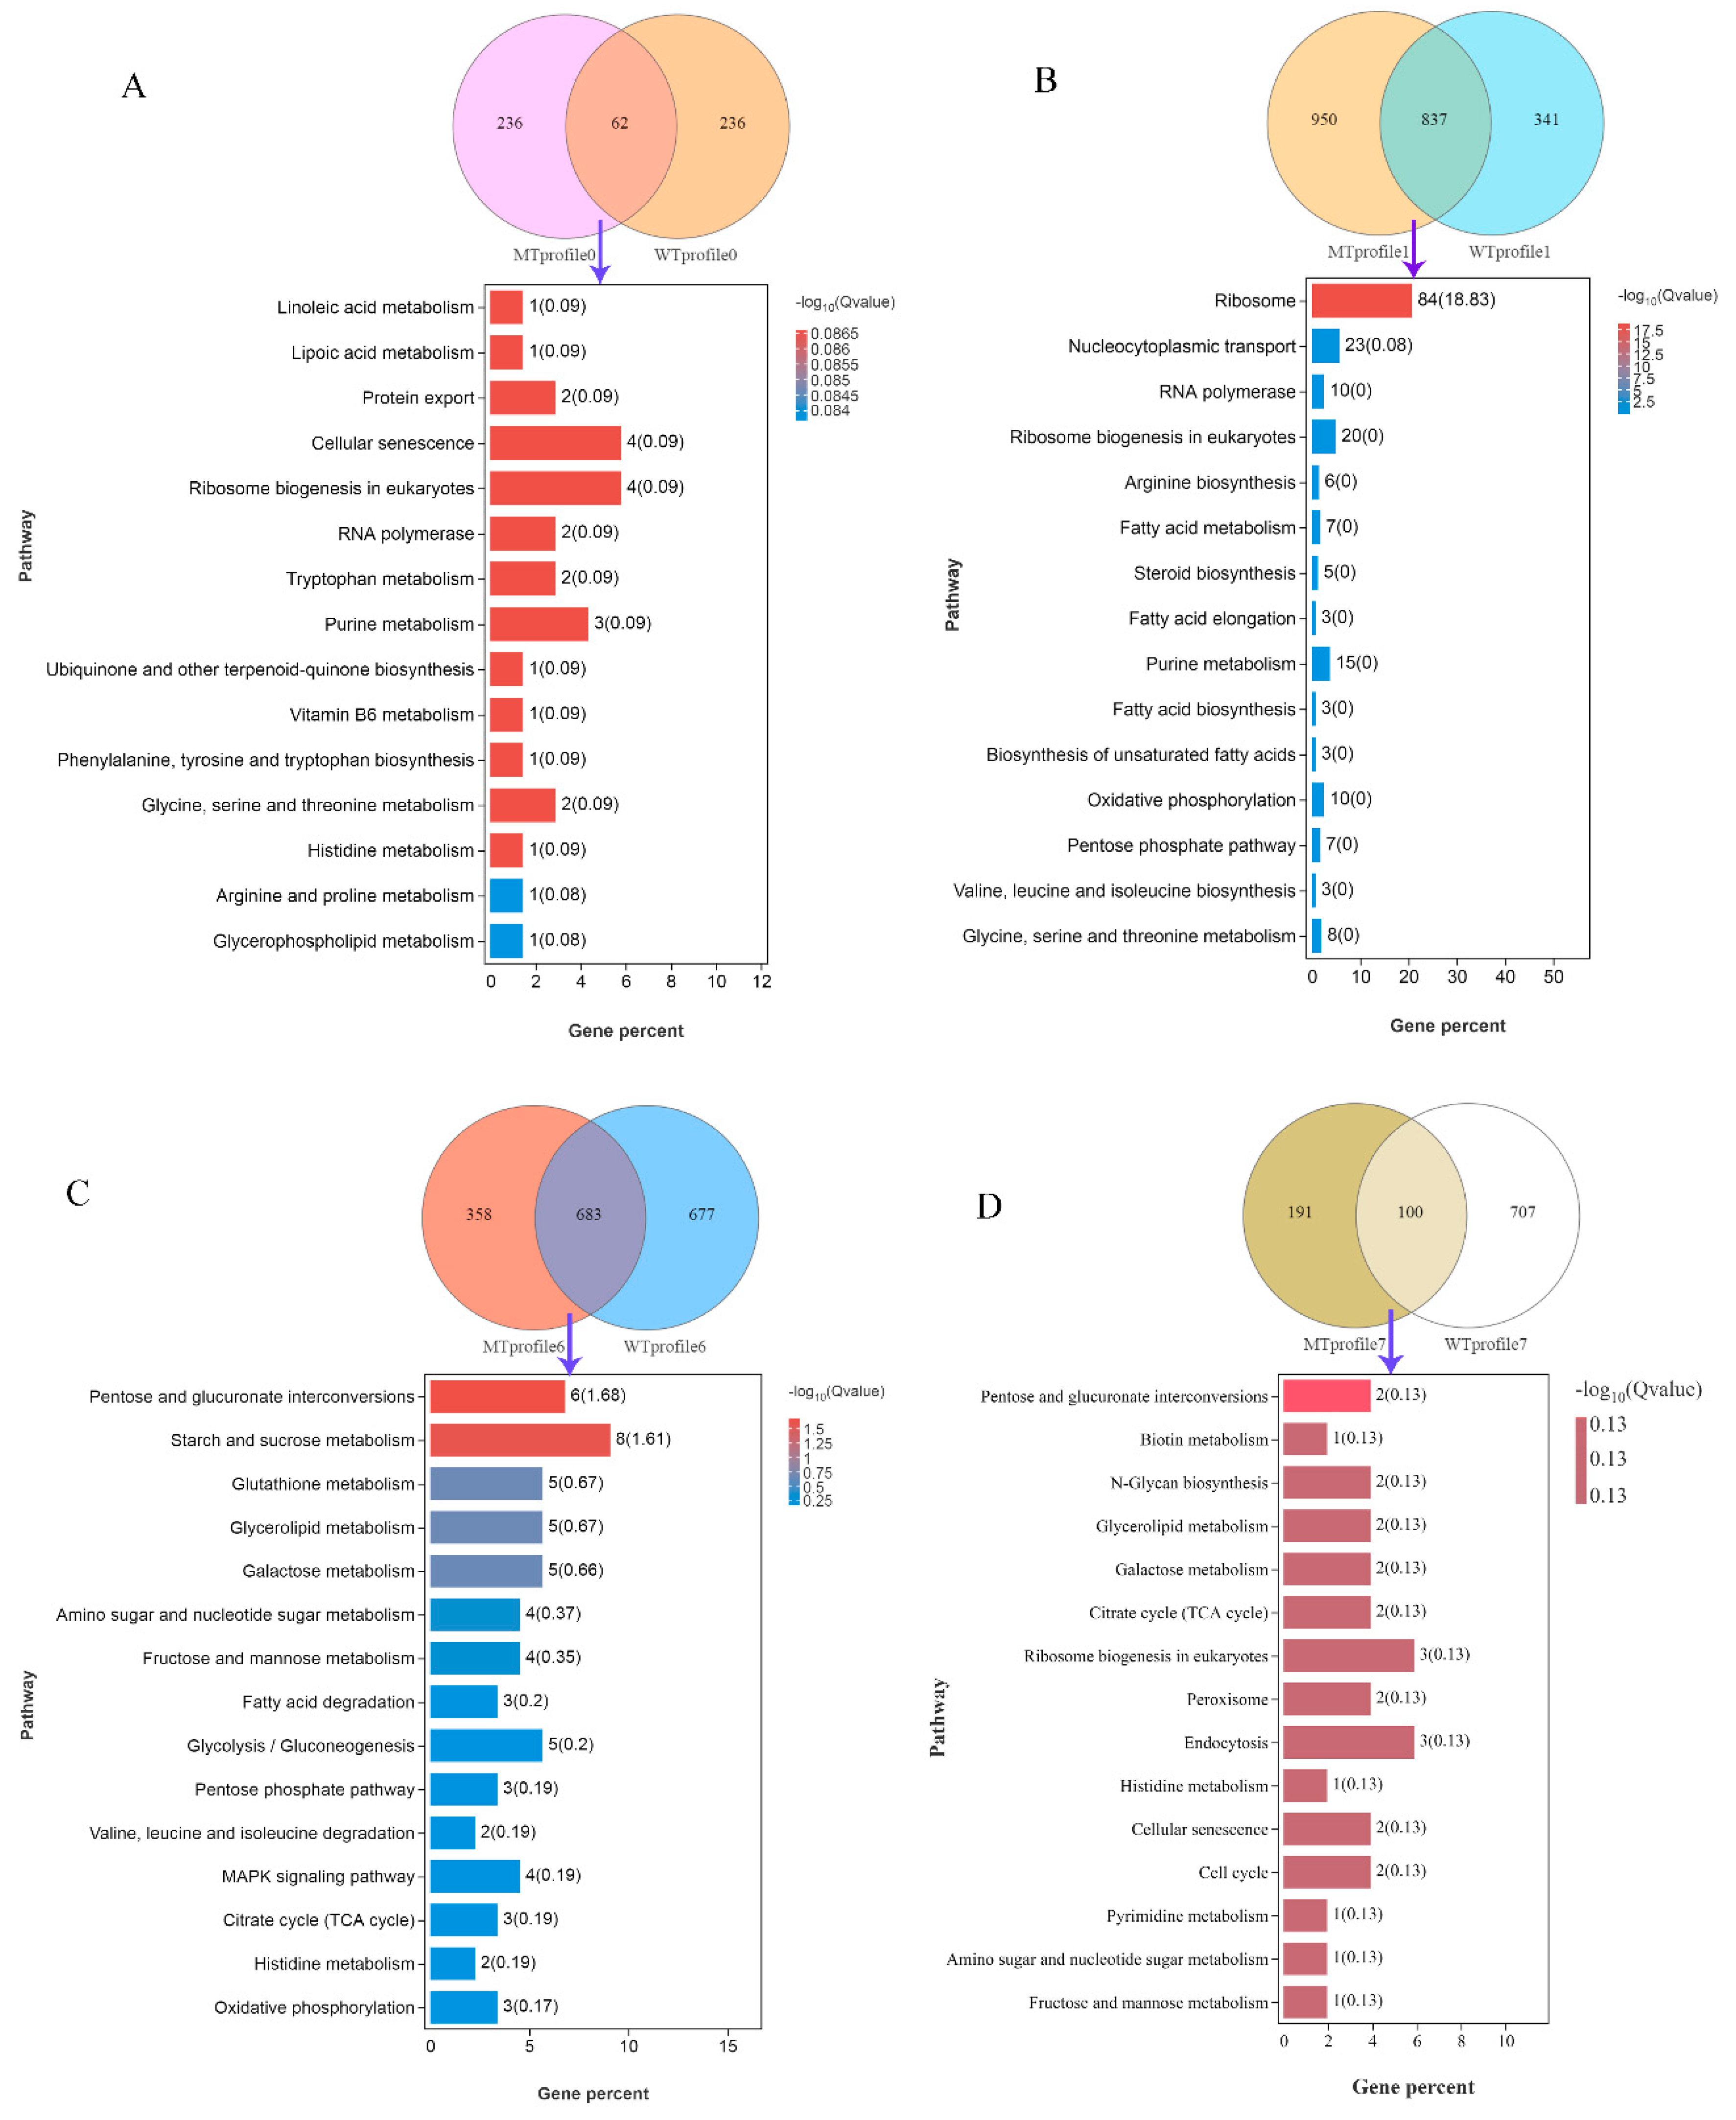
3.3. DEGs and KEGG Enrichment Analysis between Different Groups

The statistics on quality of sequencing data were shown in Tables S11–S15. Plot FPKM distribution for all samples were shown in Figure S1. The heat map of the Pearson correlation coefficient R between sanmples was shown in Figure S2. Genes with a false discovery rate ≤ 0.05 and an absolute fold change ≥ 2 were considered DEGs. DEGs between different comparison groups are shown in Figure 6. Compared to the WT strain, the MT strain had significantly upregulated gene expression at the T1 time point and significantly downregulated gene expression at the T2 and T3 time points. There were more upregulated genes in the WT strain and more downregulated genes in the MT strain at the T2 and T3 time points than at the T1 time point. For both the WT and MT strains, there was little expression difference between the T2 and T3 time points.
The top 20 metabolism pathways of the enriched DEGs between the WT and MT strains at three time points are shown in Figure 7. The enriched genes were mainly involved in sugar, amino acid, and fatty acid metabolism. Between WT-T1 and MT-T1, the vitamin B6 metabolism was significantly enriched, and starch and sucrose metabolism, Purine metabolism, and glycolysis/gluconeogenesis were the most enriched pathways. The citrate cycle and pyruvate metabolism pathways were significantly enriched between WT-T2 and MT-T2; the citrate cycle, pyruvate metabolism, and glycolysis/gluconeogenesis pathways collectively enriched the most genes between the two strains. Between WT-T3 and MT-T3, the significantly enriched pathway was alanine, aspartate, and glutamate metabolism, together with pyruvate metabolism, citrate cycle, glycolysis/gluconeogenesis, cysteine, and methionine metabolism enriched the most genes between the two strains. The results were consistent with the enrichment of genomic variation genes, including SNPs and InDels.

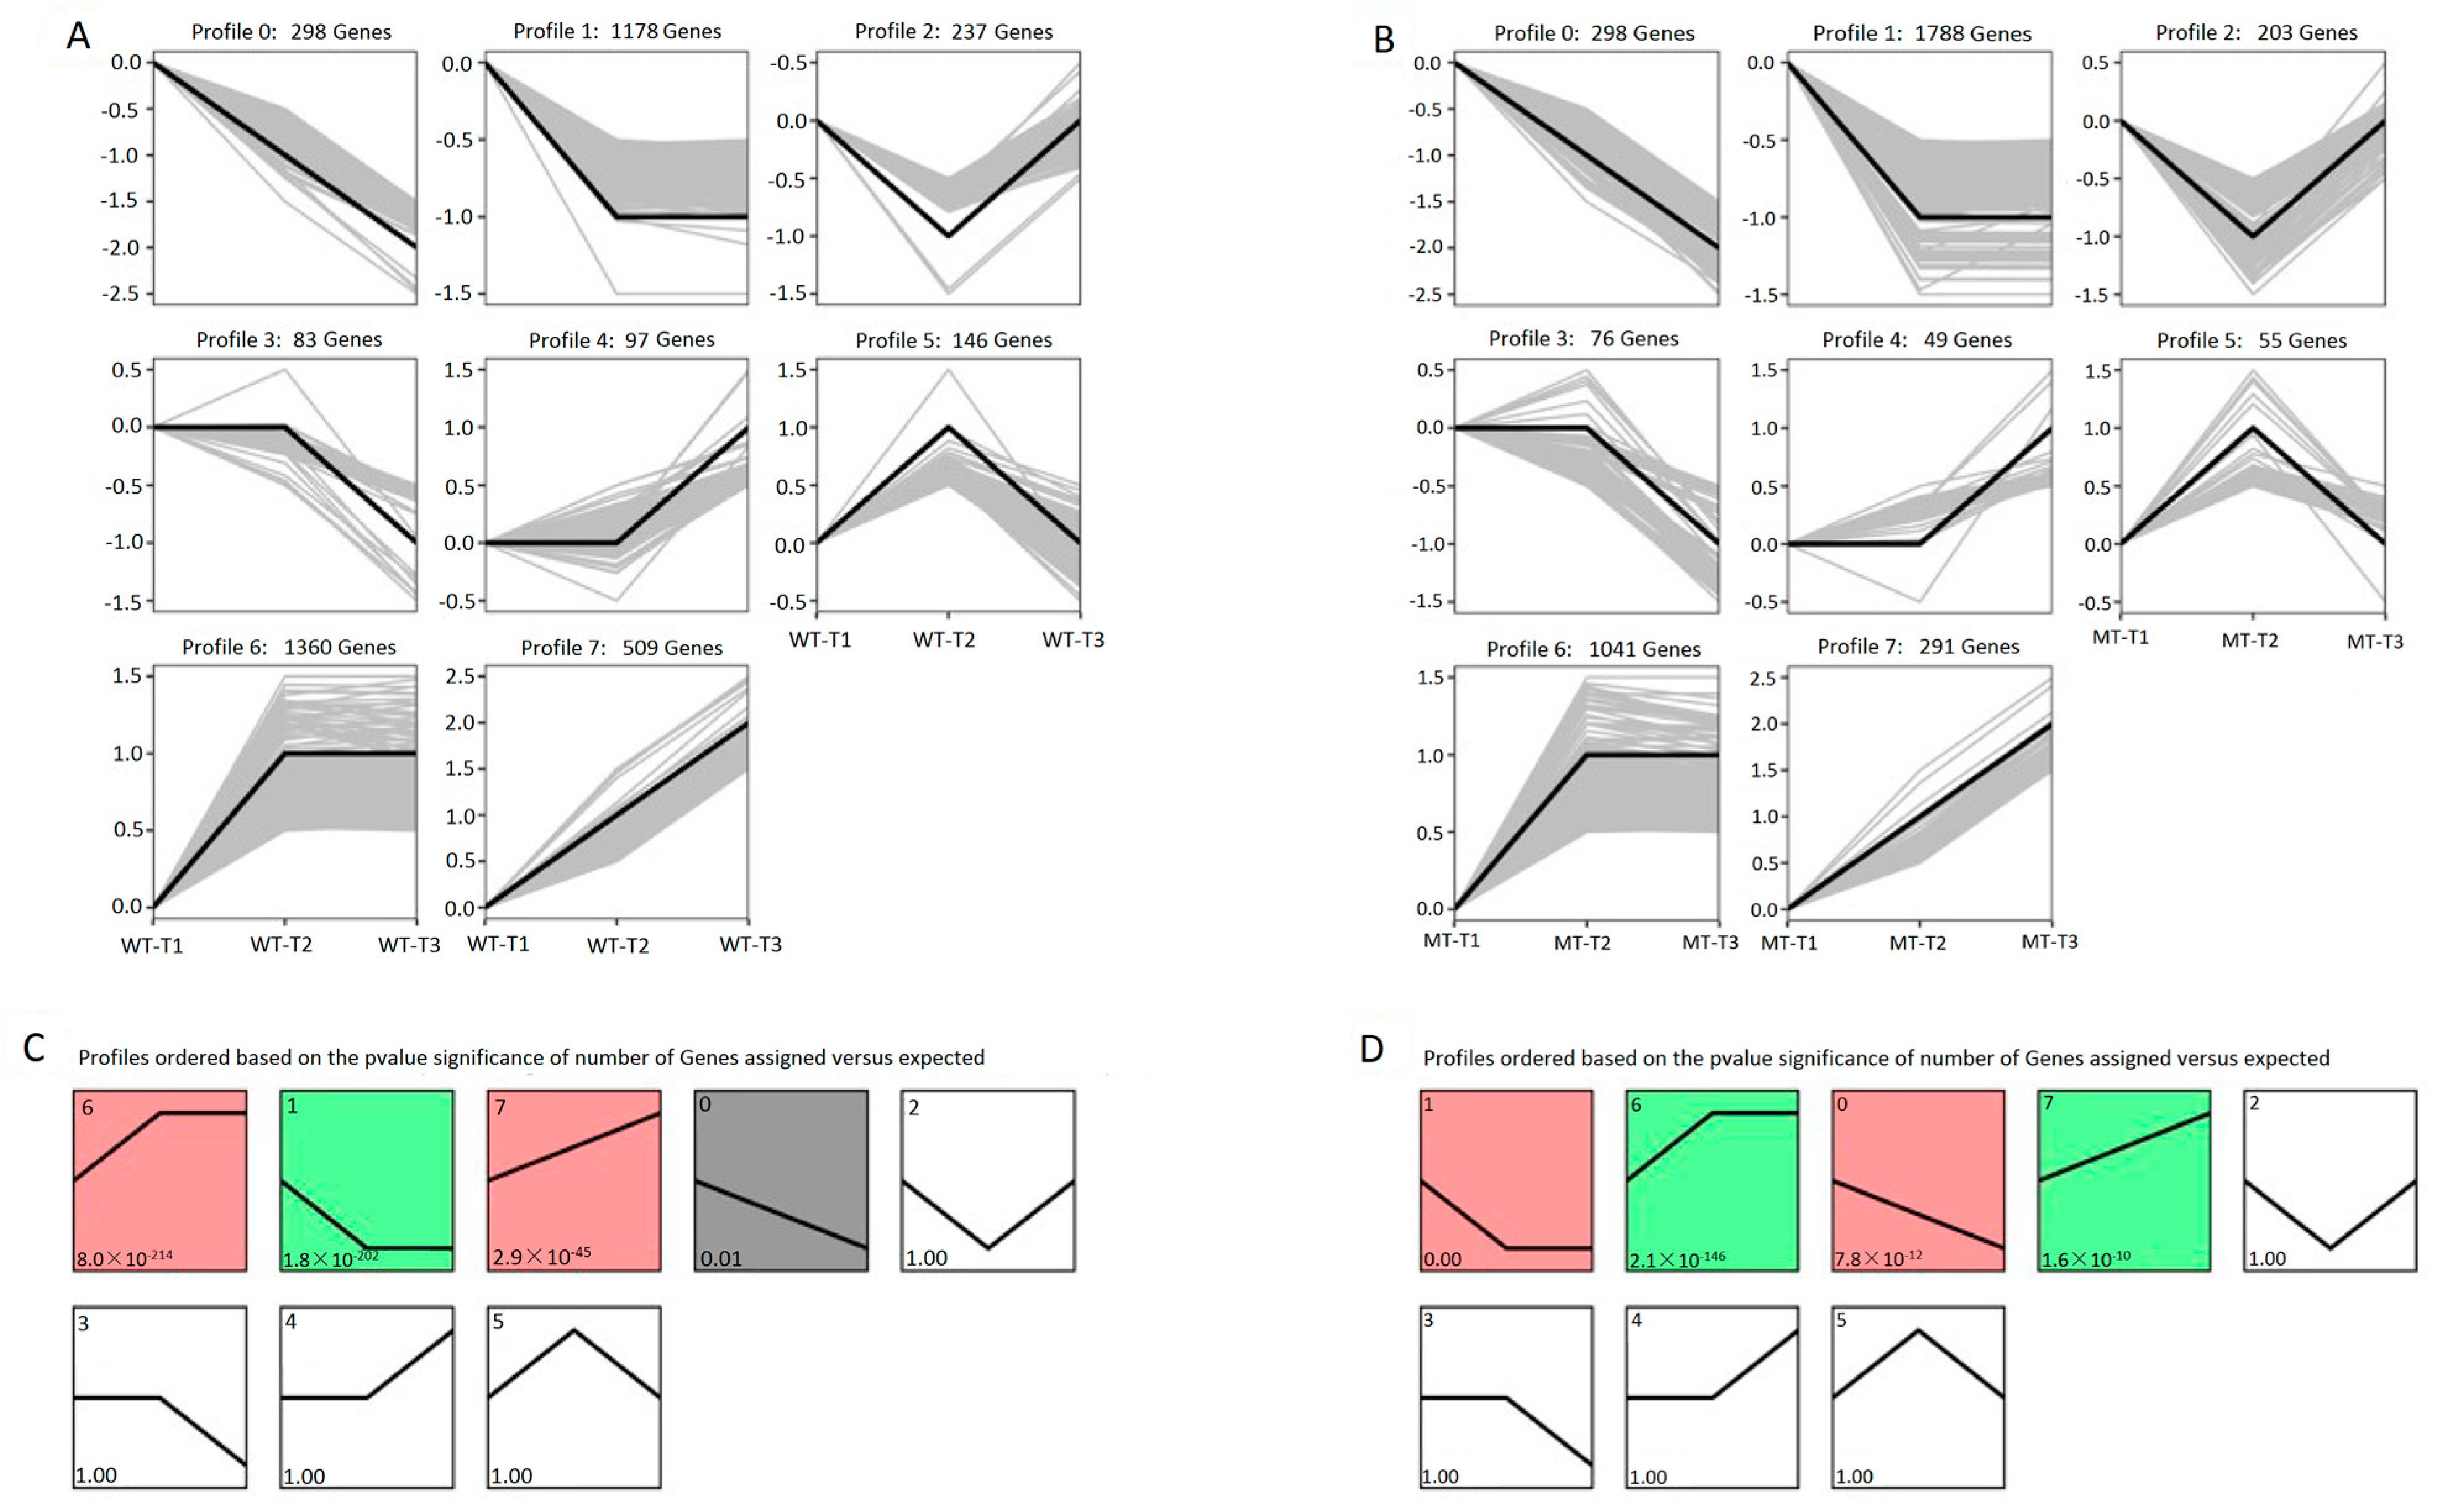
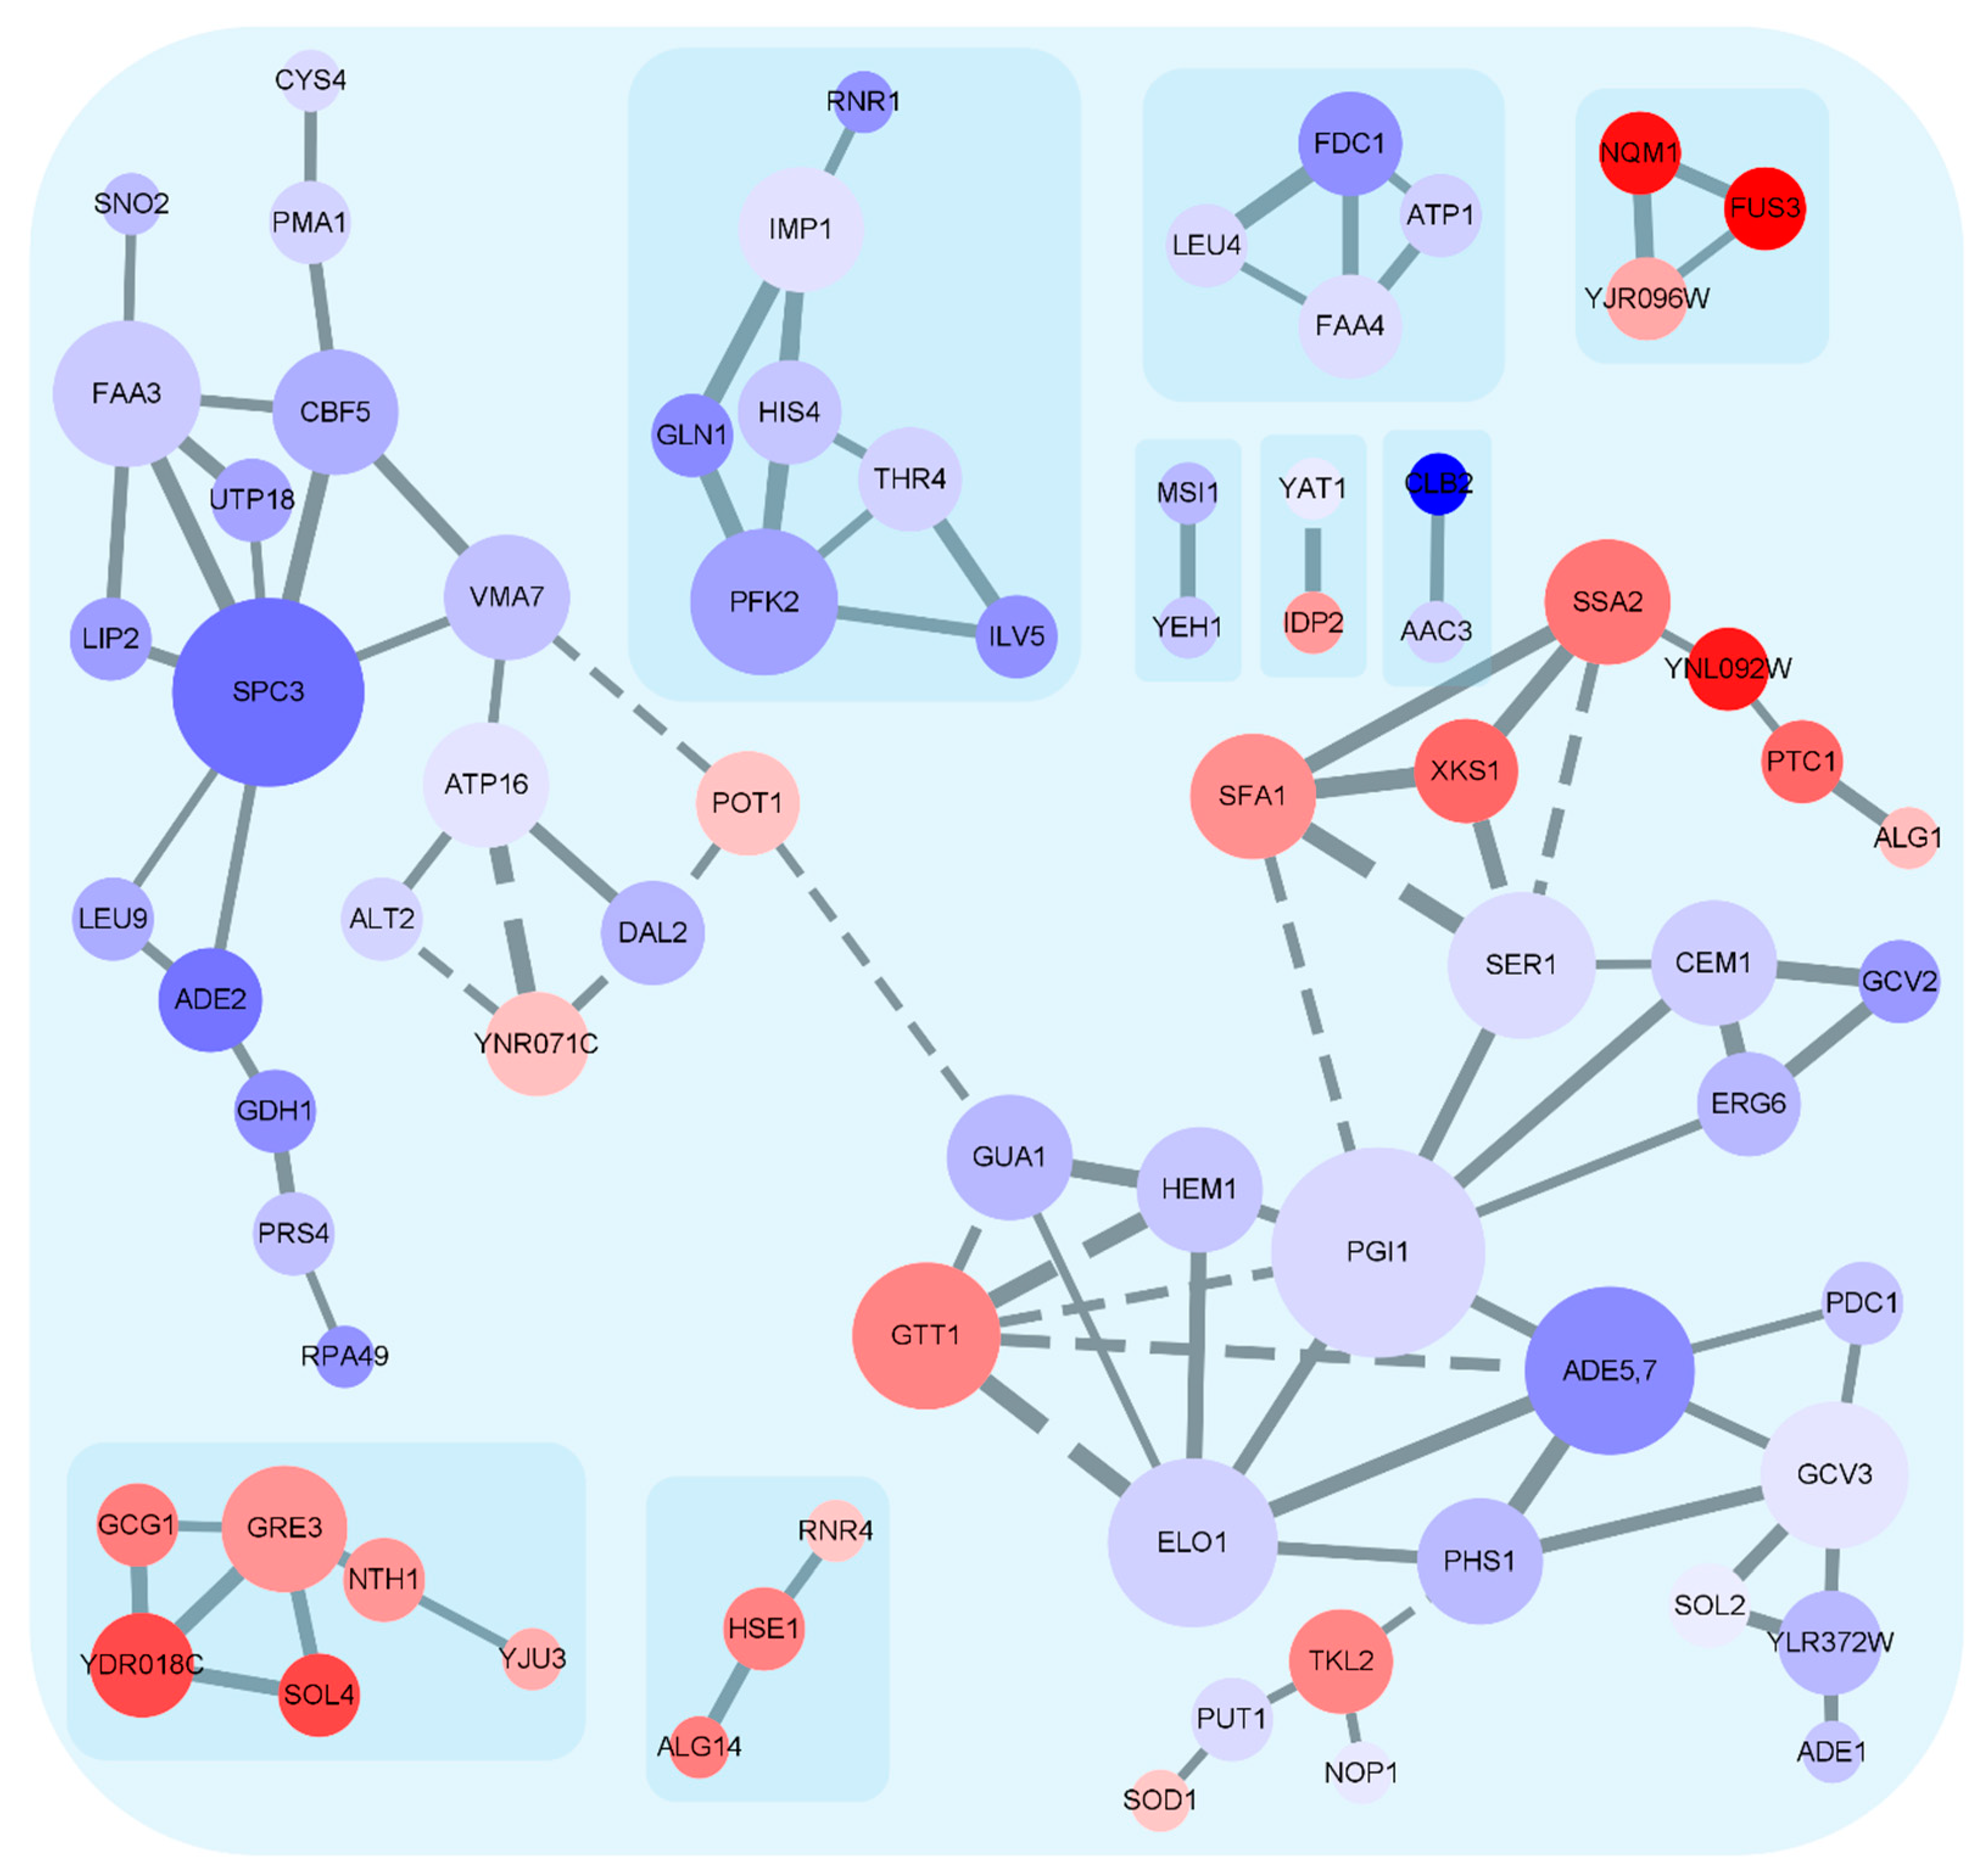
3.4. Expression Trends of DEGs on the Timeline and Exclusive Genes in the MT Strain

To examine the expression patterns of DEGs, the expression data of each sample (in the order of treatment) were normalized to 0, log2(v1/v0), log2(v2/v0), and then clustered using STEM. The parameters of “Maximum unit change in model profiles between time points” = 1, “Maximum output profiles number” = 20, and “Minimum ratio of fold change of DEGs” was ≥2.0. The clustered profiles with p-values ≤ 0.05 were considered significant profiles. There were eight expression trend profiles, and four profiles were significantly enriched for each strain for the fermentation process: profile 0—downregulation; profile 1—initial downregulation and then no change; profile 6—initial upregulation and then no change; and profile 7—upregulation (Figure 8).
Exclusive genes in the MT strain of each significantly enriched profile were determined using Venn diagram analysis, and KEGG pathway enrichment analysis of the exclusive genes was conducted. As shown in Figure 9, the exclusive genes in profiles 6 and 7 with upregulated trends are mainly enriched in carbon and sugar metabolism pathways, whereas the exclusive genes in profiles 0 and 1 with downregulated trends are mainly enriched in the ribosome and amino acid and fatty acid biosynthesis. Genes involved in the top 15 metabolic pathways are shown in Table 1.
The interaction network of the genes in Table 1 was analyzed, except for those involved in ribosomes. The Pearson correlation and significance between pairwise genes were calculated, and the top 100 pairs of absolute correlation were shown when the p-value was ≤0.05. As shown in Figure 10, there were nine groups in the interaction network. The largest group consisted of 45 genes and centered on SPC3 and PGI1, the two central blocks being connected by the protection of telomeres 1 (POT1) and GMP synthase (GUA1). The second group consisted of seven genes, with PFK2 as the hub gene. The third group consisted of six genes, with GRE3 as the hub gene. There were low numbers of genes and relatively simple relationships in the remaining six groups.
As a hub gene in the first group, SPC3 is involved in protein export. The connected genes complement factor B (CFB5) and small subunit processome component (UTP18) are involved in ribosome biogenesis in eukaryotes; FAA3 is involved in fatty acid metabolism; lipase (LIP2) is involved in lipoic acid metabolism; LEU9 is involved in valine, leucine, and isoleucine biosynthesis; phosphoribosylaminoimidazole carboxylase (ADE2) is involved in purine metabolism; and VMA7 is involved in oxidative phosphorylation. These connections demonstrate the relationship among protein export, ribosome biogenesis, and oxidative phosphorylation, as well as fatty acid and amino acid metabolism. SPC3 encodes a signal-anchored protein subunit that enters the endoplasmic reticulum (ER) as a signal peptidase [32]. The ER plays an important role in maintaining the balance and stability of cellular proteins; misfolded proteins accumulate in the ER when cells are under different kinds of stress, known as ER stress [33]. The role that SPC3 and other interacting genes play in ER stress is worth investigating.
PGI1 is involved in the pentose phosphate pathway, whereas the genes bifunctional purine biosynthetic protein (ADE5,7), bifunctional glutathione transferase (GTT1), 5-aminolevulinate synthase (HEM1), O-phosphol-L-serine:2-oxoglutarate transaminase (SER1), SFA1, ELO1, CEM1, and sterol 24-C-methyltransferase (ERG6) are involved in purine metabolism; glutathione metabolism; glycine, leucine, and isoleucine biosynthesis; and fatty acid metabolism. Genes involved in fatty acid biosynthesis (ELO1 and CEM1) were downregulated, whereas SFA1 involved in fatty acid degradation was upregulated, which is beneficial to the accumulation of acetyl-CoA. SFA1 is also a bifunctional alcohol dehydrogenase, and its synergic upregulation with ALD6 and POT1 increases the catalytic degradation of fatty acids to alcohol. The effect of SFA1 on ethanol production in yeast cells has been studied, but the mechanisms regulating the different effects under different conditions remain unclear [34]. This module mainly showed the relationship between the pentose phosphate pathway and fatty acid and amino acid metabolism. The Hsp70 family chaperone (SSA2) and PTC1, involved in the MAPK pathway, were located at the edge of this module. Glutathione transferase (Gtt1) of S. cerevisiae is crucial to the response to hydrogen peroxide stress. Increasing glutathione content might enhance yeast cell tolerance to lignocellulose inhibitors and increase the production of ethanol [35,36]. GTT1 expression was negatively correlated with interlinked genes in the network of this module; these interactions help to better understand GTT1.
The second group comprised the hub gene PFK2, with glutamate–ammonia ligase (GLN1), trifunctional histidinol dehydrogenase (HIS4), threonine synthase (THR4), ILV5, endopeptidase catalytic subunit (IMP1), and ribonucleotide–diphosphate reductase subunit (RNR1). This group demonstrated the relationship between the pentose phosphate pathway (PFK2), amino acid metabolism (GLN1, HIS4, THR4, ILV5, RNR1), and protein export (IMP1).
The third group comprised GRE3, gamma–glutamylcyclotransferase (GCG1), putative acyltransferase (YDR018C), 6-phosphogluconolactonase (SOL4), NTH1, and acylglycerol lipase (YJU3), and demonstrated the connection between pentose and hexose metabolism. GRE3 was the hub gene and was directly linked to four of these genes. An engineered S. cerevisiae strain overexpressing GRE3, xylitol dehydrogenase (XYL2), and xylulokinase (XYL3) ferments xylose resulting in high ethanol yields [37]. Thus, GRE3 has a coordinated role in ethanol fermentation in yeast using different sugars.
PGI1, SPC3, PFK2, and GRE3 were the major hub genes in the network. In the future, these metabolic pathways may be optimized by overexpressing or deleting these hub genes to obtain S. cerevisiae strains with a higher capacity for ethanol fermentation.

3.5. qRT-PCR

qRT-PCR of 21 genes from two comparison groups was carried out to verify the accuracy of the RNA-Seq data and the expression level of important genes. The log2 n value of each gene is shown in Figure 11. All gene expression determined using qPCR was consistent with that obtained from RNA-Seq, thereby indicating the credibility of the RNA-Seq data. In the MT strain, the expression of sucrose invertase gene SUC2 was downregulated; furthermore, the content of total sugar and reducing sugar in MT fermentation broth was lower than that of the WT strain after 16 h. The difference in sucrose utilization between the two strains highlights the need for further study.

4. Discussion

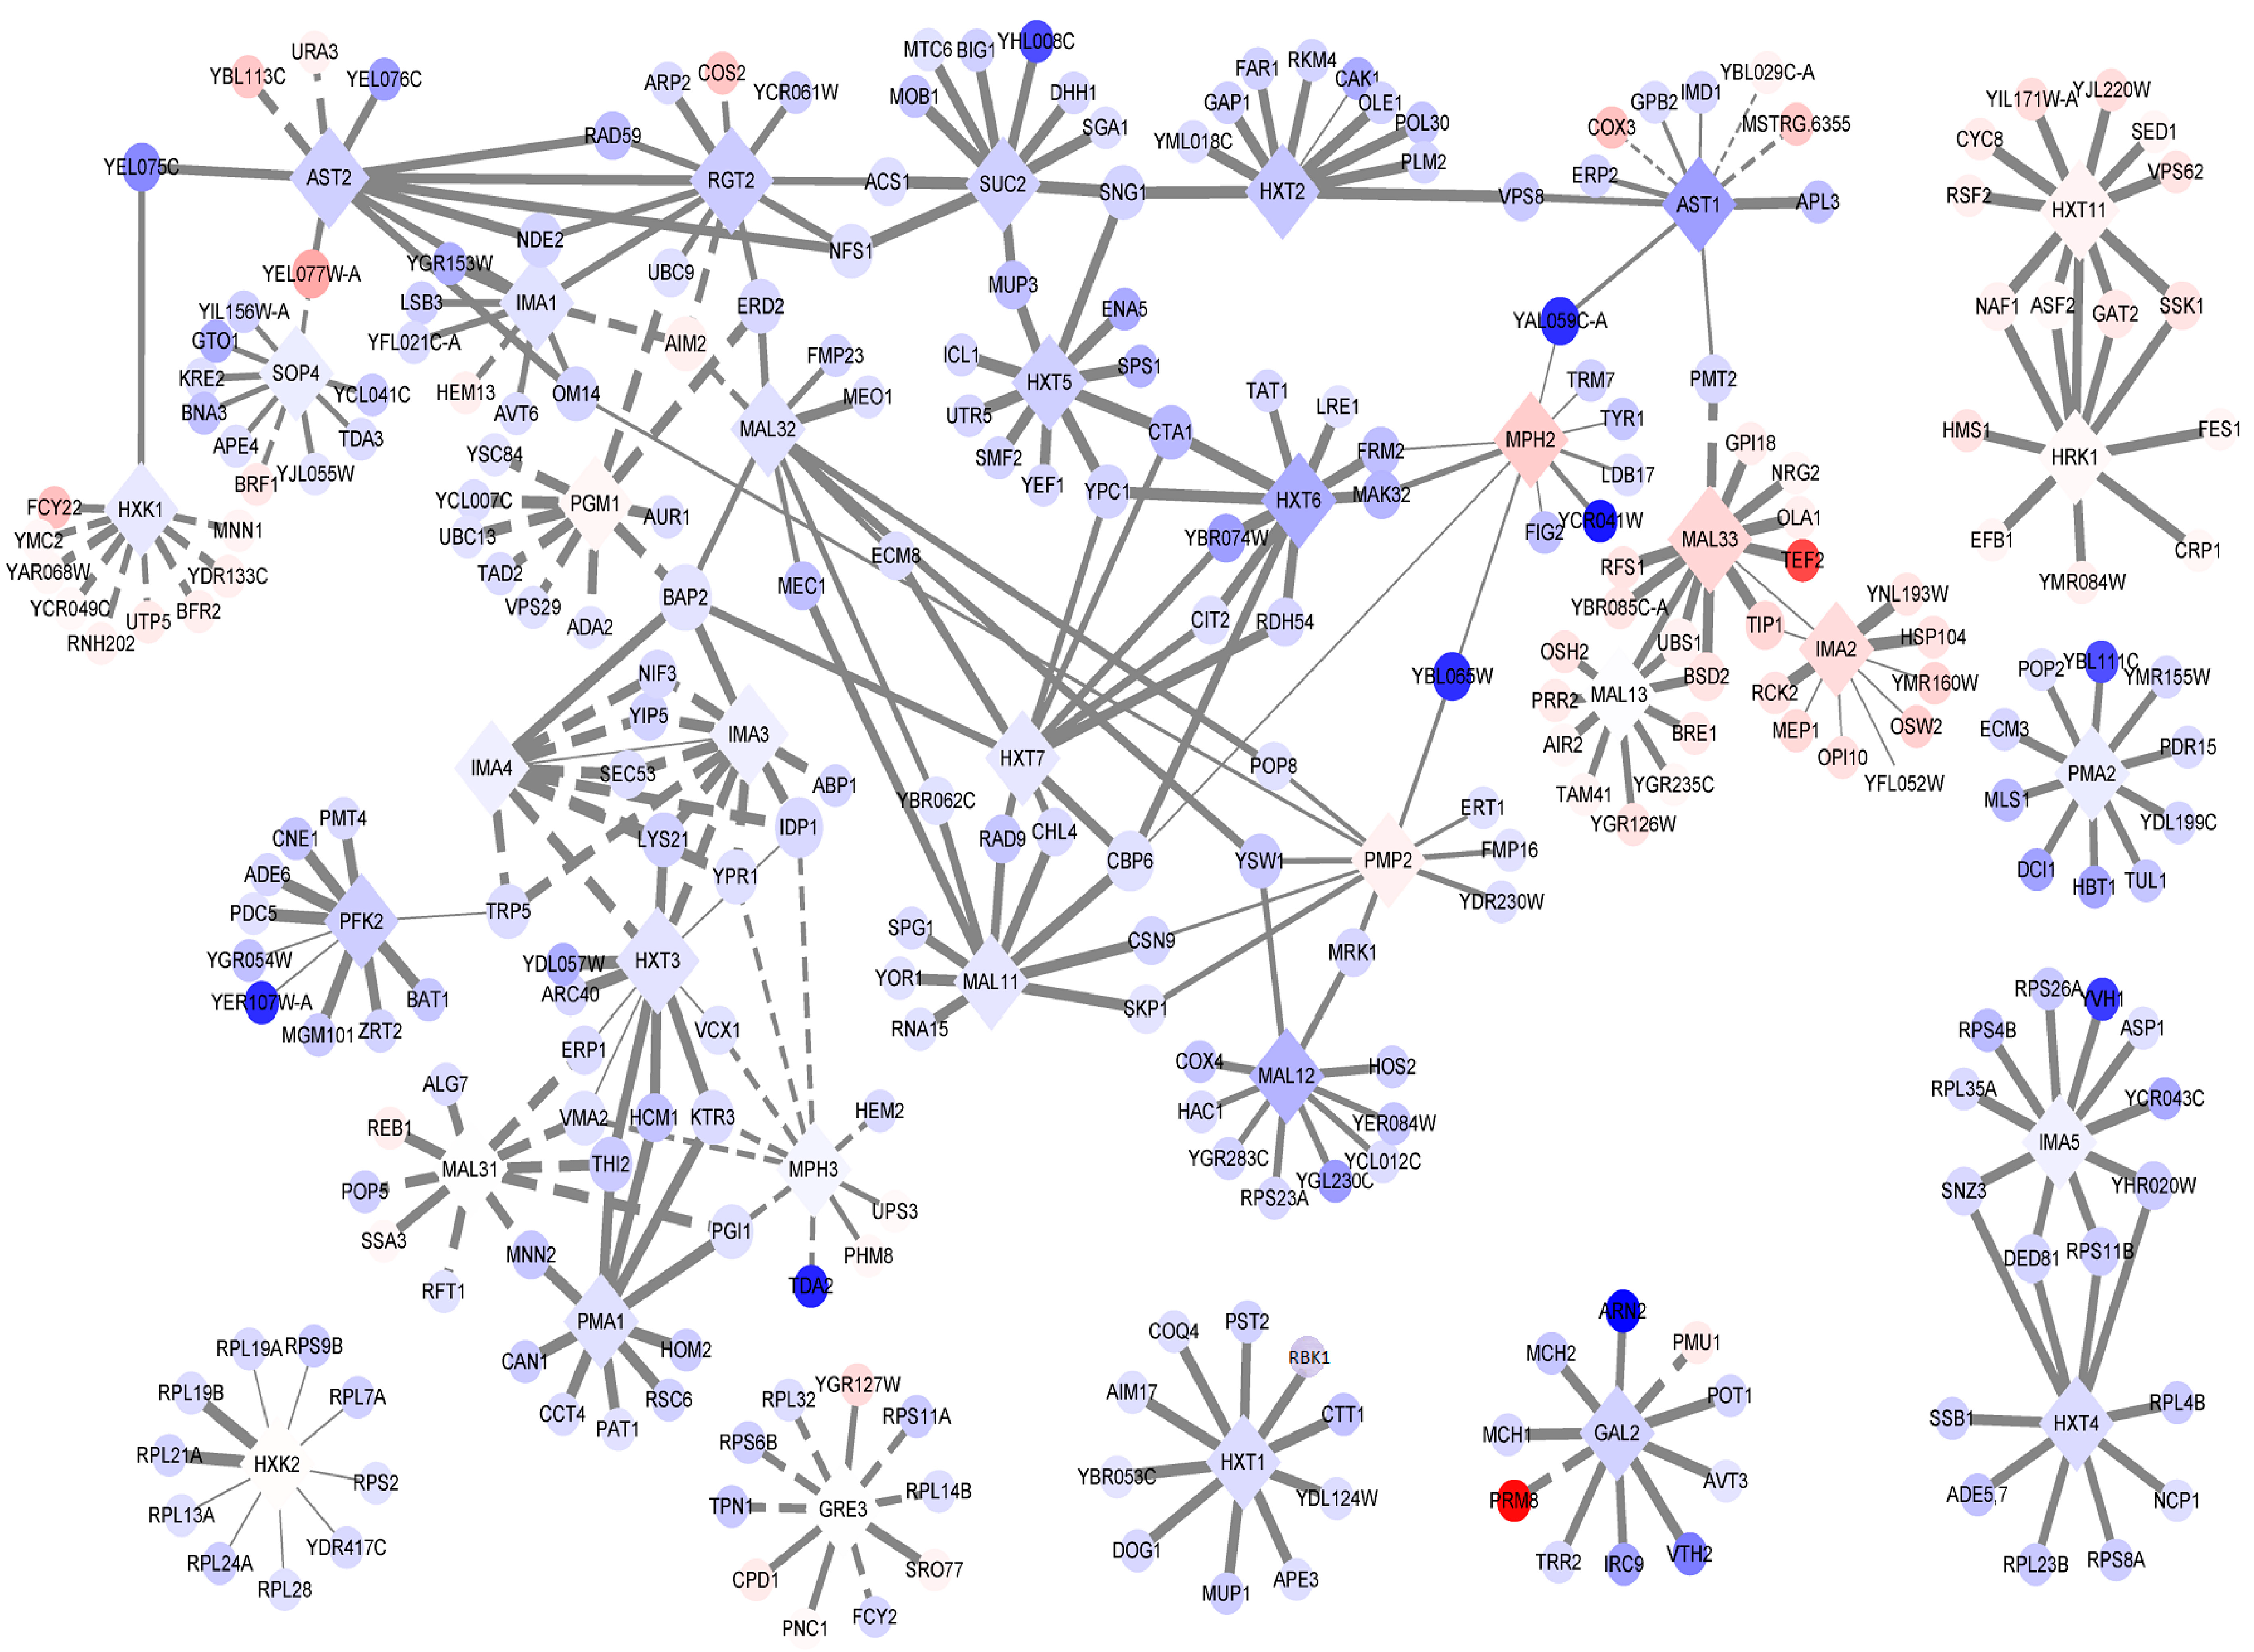
4.1. Sucrose Consumption of the WT and MT Strains

S. cerevisiae consumes sucrose in two ways. (1) The hydrolyzation of sucrose into glucose and fructose by extracellular sucrose invertase encoded by the SUC gene family. In this process, monosaccharides enter cells by facilitated diffusion to participate in the carbon metabolism pathway; (2) Sucrose enters cells via the proton-coupled transporter and is hydrolyzed in the cytosol by maltose metabolizing enzyme and intracellular sucrose invertase [5,38]. The sucrose invertase gene SUC2, maltose permease genes (MALx1), maltase genes (MALx2), and some regulatory genes (e.g., MALx3) are the key genes in sucrose consumption of S. cerevisiae [38]. Invertases of S. cerevisiae coded by SUC2 can be transcribed into two mRNAs that differ in their 5′ ends (1.8 Kb and 1.9 Kb). The longer of the two invertases with a signal peptide can be secreted outside the cell, and its synthesis level is regulated by glucose repression. The shorter invertase lacking a signal peptide encodes the intracellular invertase [39,40]. In the absence of extracellular invertase activity of S. cerevisia, sucrose was internalized by proton symporters using ATP, which led to improving the anaerobic fermentation and ethanol yield from sugar [5]. In addition, the replacement of all endogenous hexose transporters with hexose–proton symport and extracellular invertase (SUC2) can increase ethanol yield and anaerobic growth of S. cerevisiae [41].
In this study, both RNA sequencing and qPCR showed that the MT strain had lower expression of SUC2, PMA1 (H (+)-exporting P2-type ATPase), MAL32 genes, and higher expression of MAL31, IMA2 (oligo-1,6-glucosidase) genes than that of the WT strain during fermentation. Wesley Leoricy Marques et al. constructed several mutants to investigate sucrose metabolism in S. cerevisiae. Mutants IMU051 (malΔ mphΔ suc2Δ), IMU054 (malΔ mphΔ suc2Δ MAL12), and IMK700 (malΔ mphΔ suc2Δ MAL11 imaΔ cas9) could not grow on mediums with sucrose as the sole carbon source; however, the growth of mutants IMU055 (malΔ mphΔ suc2Δ MAL11 MAL12) and IMU048 (malΔ mphΔ suc2Δ MAL11) was not limited by these types of medium [38]. These results show the importance of maltose permease (MALx1) and oligo-1,6-glucosidase (IMAx) for sucrose consumption in S. cerevisiae. However, the transportation of sucrose by MAL31 and hydrolyzation by IMA2 in the MT strain requires verification.
We analyzed the protein interaction network of DEGs (WT-T2 vs. MT-T2) and extracted the network of genes related to sucrose consumption in Table 2. Pearson correlations between pairwise genes of DEGs were calculated. Considering the genes in Table 2 as core genes, the top 10 correlation pairs in the absolute value of each core gene were shown when the p-value was ≤ 0.05. As shown in Figure 12, most core genes were connected by complex nodes. MAL33, MPH2, and IMA2 showed significant upregulation. PMP2, PGM1, HXT11, HRK1, MAL31, GRE3, and HXK2 showed marginal upregulation. The remaining core genes were downregulated. Among the core genes, RGT2, AST2, HXT2, and HXT5 are closely related to the SUC2 gene. All of them are related to the plasma membrane and glucose transporter. As a glucose-sensing receptor, the glucose-sensing signal generated by RGT2 can lead to the inhabitation of the RGT1 transcriptional repressor and, thus, the derepression of HXT genes that encode glucose transporters [42,43]. RGT2 was downregulated in response to glucose starvation [42]. Does the down expression of SUC2, RGT2, and HXTx indicate that the sucrose is primarily hydrolyzed intracellularly in the MT strain? However, plasma membrane H+-ATPase PMA1 and PMA2, which are related to the transmembrane transport of sucrose, are also downregulated in the MT strain. How the MT strain efficiently uses sucrose to produce ethanol is our next research objective. Our network diagram results revealed the potential pathway of sucrose absorption and provided a basis for subsequent study of the sucrose mode of absorption.

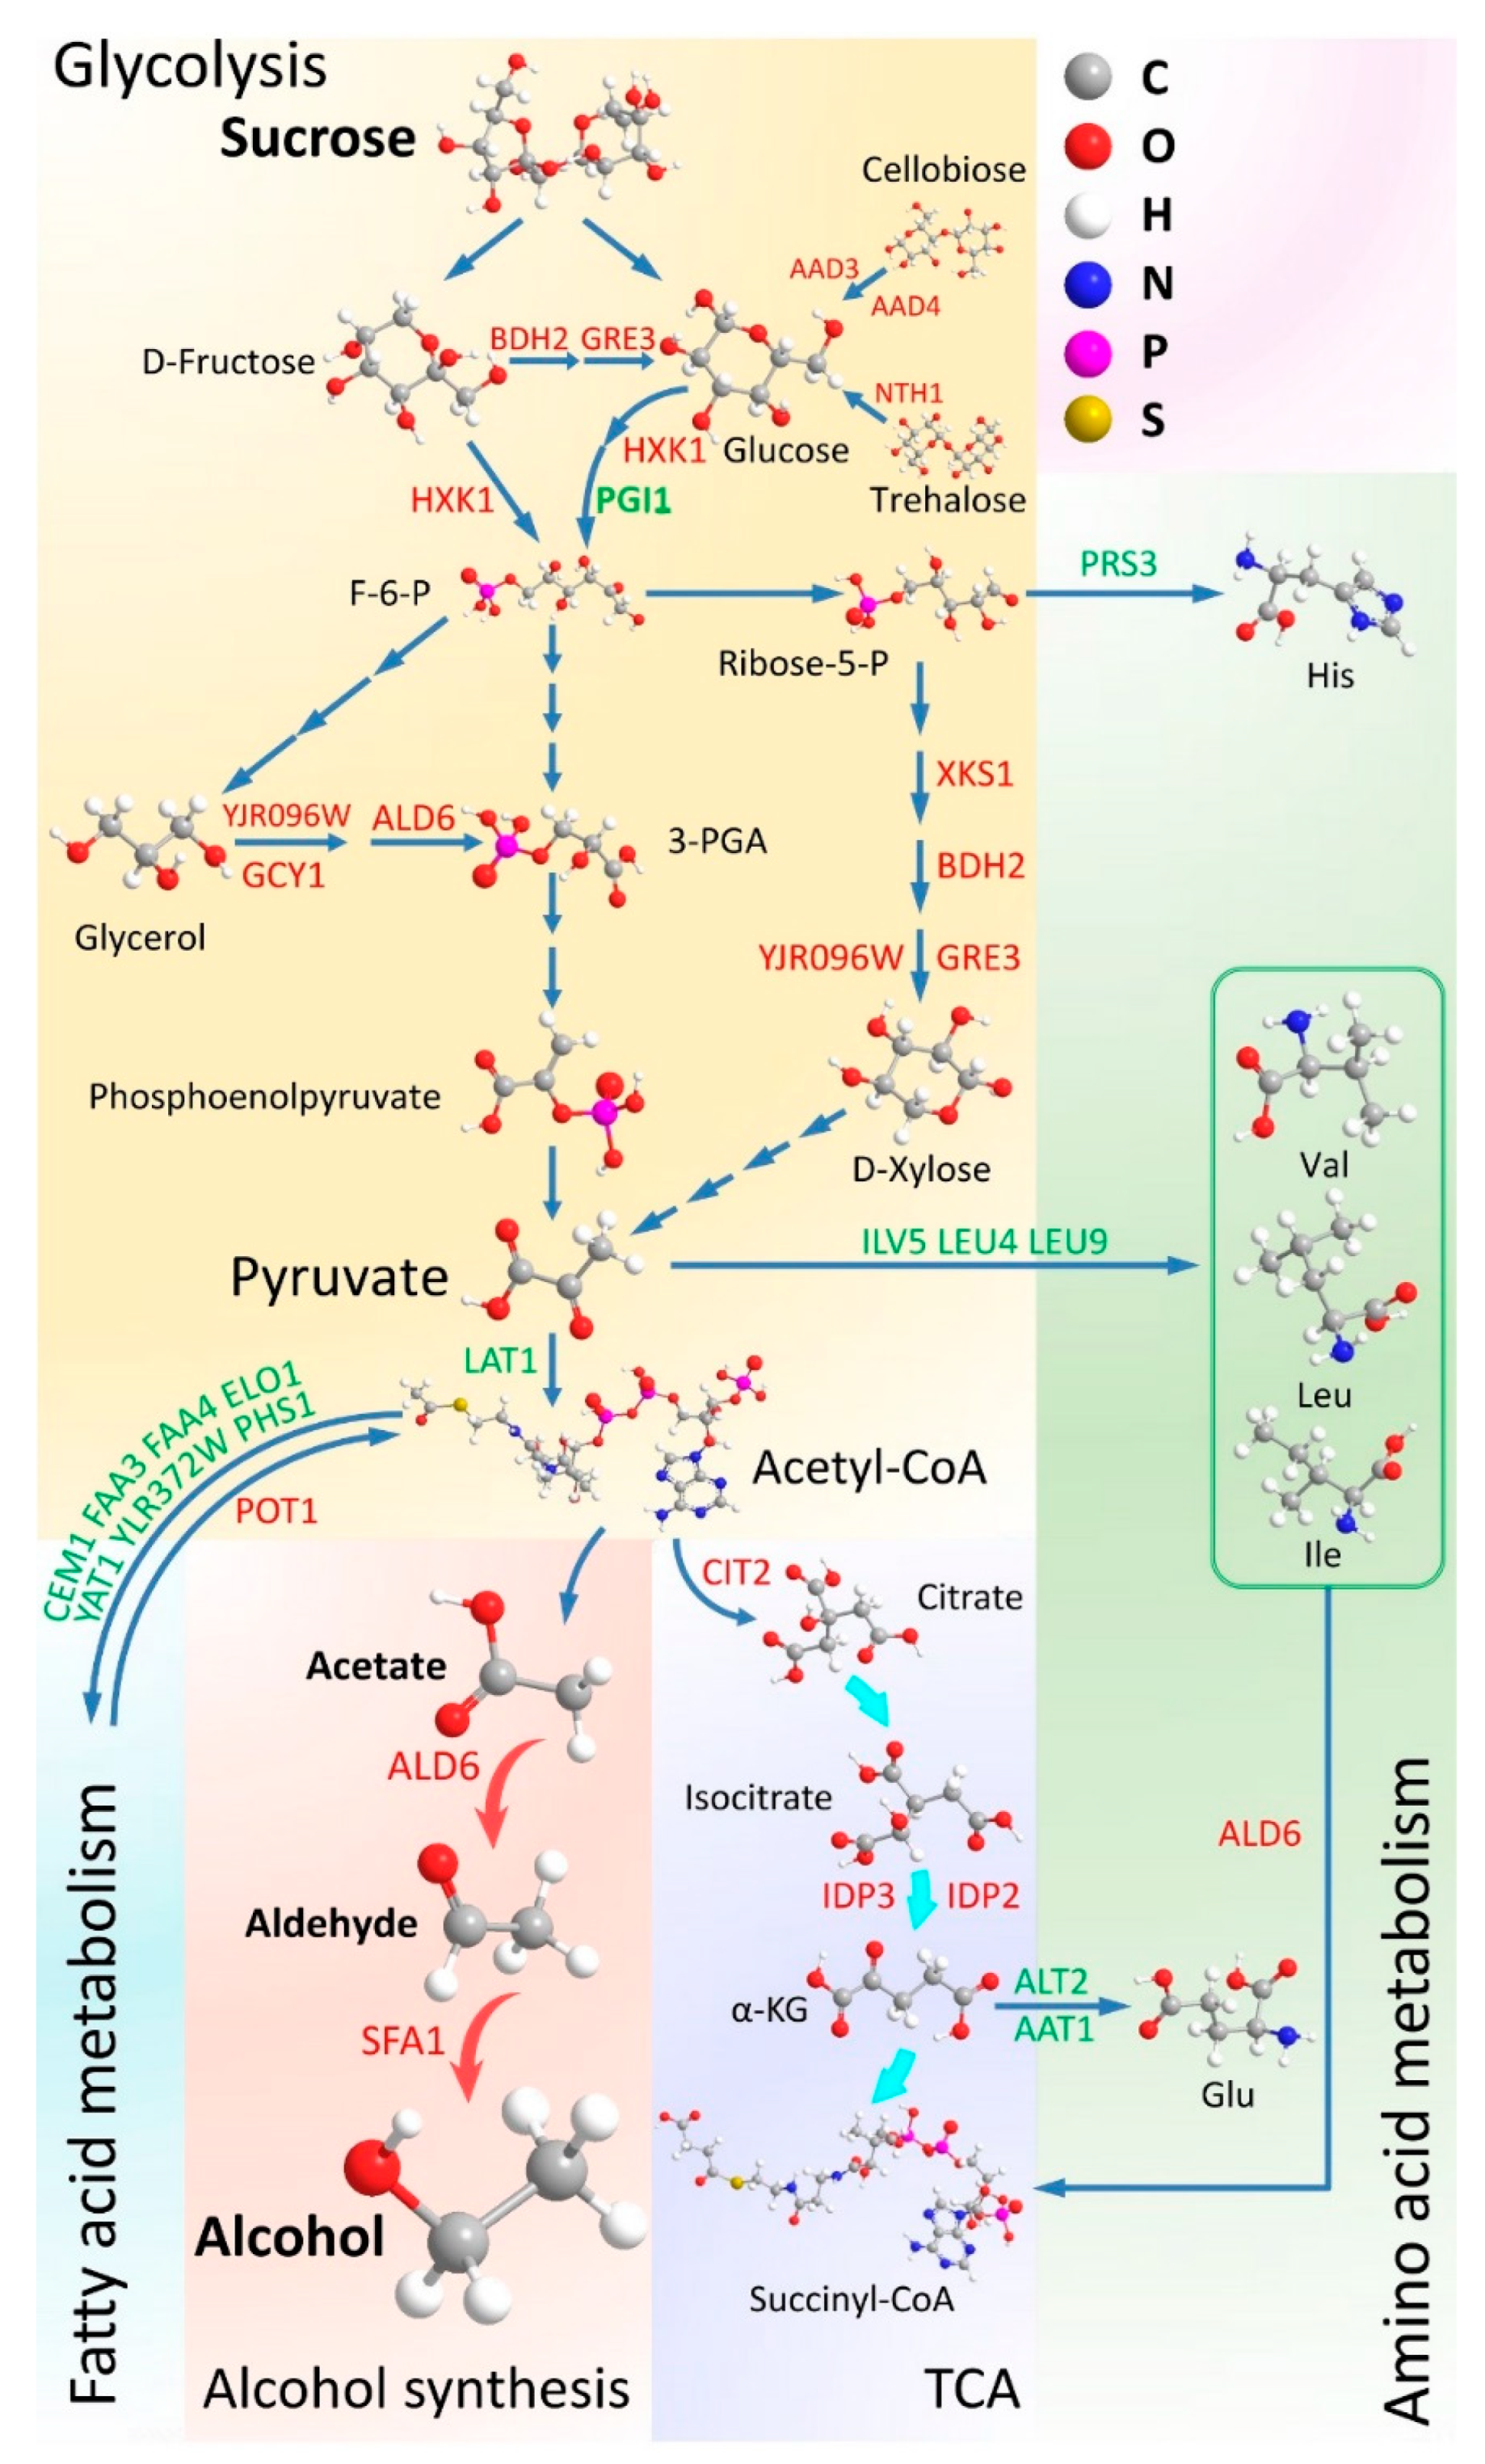
4.2. Carbon Metabolism in the MT Strain

The metabolic pathway enrichment results of exclusive genes in the MT strain were mainly reflected in amino acid, fatty acid, and sugar metabolism. The carbon skeleton of amino acids is broken down to form acetyl-CoA, α-ketoglutaric acid, succinyl-CoA, fumaric acid, and oxaloacetic acid, all of which enter the citric acid cycle. The amino acid synthesis also uses pyruvate, α-ketoglutaric acid, and oxaloacetic acid, which are intermediates in glycolysis, the citric acid cycle, and the pentose phosphate pathway, respectively. These intermediates link sugar metabolism to amino acid metabolism [44,45]. As a carbon skeleton, acetyl-CoA is the catabolic product of fatty acids and is the only source of carbon atoms in the fatty acid molecule. As shown in Figure 13, the expression of exclusive genes in the MT strain involved in amino acid, fatty acid, and sugar metabolism resulted in carbon metabolism flow to pyruvate and acetyl-CoA. Downregulation of ketol-acid reductoisomerase (ILV5), 2-isopropylmalate synthase (LEU4), 2-isopropylmalate synthase (LEU9), and dihydrolipoyllysine-residue acetyltransferase (LAT1) genes can reduce the synthesis of pyruvate to valine, leucine, isoleucine, and acetyl-CoA, respectively. Upregulation of xylulokinase (XKS1), 3-hydroxybutyrate dehydrogenase 2 (BDH2), aldo-keto reductase superfamily protein (YJR096W), and GRE3 genes contribute to the conversion of ribose-5-phosphate to D-xylose, and subsequently to pyruvate. Pyruvate accumulation is beneficial to increase ethanol production. Upregulation of POT1 and downregulation of fatty acid synthase (CEM1), long-chain fatty acid-CoA ligases (FAA3 and FAA4), fatty acid elongase (ELO1), carnitine O-acetyltransferase (YAT1), fatty acid elongase (YLR372W), and enoyl-CoA hydratase (PHS1) genes enhance the hydrolysis of fatty acids to acetyl-CoA and decrease fatty acid synthesis from acetyl-CoA. Upregulation of aldehyde dehydrogenase (ALD6) and bifunctional alcohol dehydrogenase (SFA1) genes promote the conversion of acetyl-CoA to ethanol. Upregulation of aryl-alcohol dehydrogenases (AAD3 and AAD4), alpha-trehalase (NTH1), hexokinase 1 (HXK1), YJR096W, glycerol 2-dehydrogenase (GCY1), and ALD6 genes direct the flow of carbon into the glycolytic pathway, then into pyruvate and ethanol. The expression of alanine transaminase (ALT2), aspartate transaminase (AAT1), and ALD6 genes promote the breakdown of amino acid carbon skeletons to form α-ketoglutaric acid and succinyl-CoA. Ethanol could be a major source of acetyl-CoA and NADPH indirectly during fermentation by S. cerevisiae, and ALD6 plays an important role in this process [46]. Understanding the different metabolic processes is relevant in regard to engineered S. cerevisiae deployed for ethanol production.

5. Conclusions

We obtained a mutant S. cerevisiae strain with improved capacity for ethanol fermentation and analyzed its genomic structure and gene expression changes. The SNPs had a high distribution density on all chromosomes except for the ends of chromosome I and II, while the InDels had the highest distribution density on the mitochondria genome. GO and KEGG enrichment for associated genes of SNPs and InDels were performed, and the significantly enriched metabolic pathway included carbohydrate metabolism, amino acid metabolism, metabolism of cofactors and vitamins, and lipid metabolism. There were significant differences in gene expression between the two strains during fermentation. The results of KEGG enrichment of DEGs between two strains were consistent with the result of KEGG enrichment for associated genes of SNPs and InDels. Gene expression trends of the two strains were recorded on a timeline during fermentation. Venn diagram analysis revealed exclusive genes in the MT strain. KEGG enrichment analysis of these genes showed that genes involved in sugar metabolism, the MAPK pathway, and fatty acid and amino acid degradation were mainly upregulated. In contrast, genes involved in oxidative phosphorylation and ribosome, fatty acid, and amino acid biogenesis were mainly downregulated. Protein interaction analysis of these genes showed that PGI1, SPC3, PFK2, and GRE3 were the major hub genes in the network, linking sugar, amino acid, and fatty acid metabolism; the MAPK pathway; oxidative phosphorylation; ribosome biogenesis; protein export; and cellular senescence. This work provides a reference for the future construction of engineered strains of S. cerevisiae with excellent ethanol fermentation capacity.

Supplementary Materials

The following supporting information can be downloaded at: https://www.mdpi.com/article/10.3390/fermentation9050483/s1, Figure S1: Distribution of gene expression abundance; Figure S2: Heat map of the Pearson correlation coefficient R between samples; Table S1: Primers for qPCR; Table S2: Base information of genome sequencing before filter; Table S3: Base information of genome sequencing after filter; Table S4: Alignment to the reference genome; Table S5: Statistics of genome coverage; Table S6: Locations of SNPs on the genome; Table S7: Coding information of SNPs; Table S8: Location of InDels on the genome; Table S9: Coding information of InDels; Table S10: Hybrid information of SNPs and InDels; Table S11: Base information of RNA-Seq; Table S12: Alignment to the reference genome; Table S13: Location of alignment to the reference genome; Table S14: Gene number detection; Table S15: Gene coverage of each sample.

Author Contributions

Data curation, Z.L.; formal analysis, X.C.; funding acquisition, Y.C.; investigation, Q.L.; methodology, Y.W. and R.W.; project administration, Y.C.; resources, D.C.; software, Z.L.; writing—original draft, Y.C.; writing—review and editing, L.G. All authors have read and agreed to the published version of the manuscript.

Funding

This work was funded by the Natural Science Foundation of Guangxi, China (2020GXNSFAA259021, 2022JJA130143, 2020GXNSFBA297070). The National Natural Science Foundation of China (32260018, 12264005). The Natural Science Foundation of Sichuan Province, China (2022NSFSC0723).

Institutional Review Board Statement

Not applicable.

Informed Consent Statement

Not applicable.

Data Availability Statement

The raw reads of WGS and RNA-Seq were uploaded to the NCBI (SRA) database with the accession number PRJNA885247. (https://www.ncbi.nlm.nih.gov/sra/?term=PRJNA885247, accessed on 28 February 2022).

Conflicts of Interest

The authors declare that the research was conducted in the absence of any commercial or financial relationships that could be construed as a potential conflict of interest.

References

  1. Wu, X.; Zhang, S.; Guo, X.; Yang, Z.; Liu, J.; He, L.; Zheng, X.; Han, L.; Liu, H.; Wu, Y. Assessment of ethanol blended fuels for gasoline vehicles in China: Fuel economy, regulated gaseous pollutants and particulate matter. Environ. Pollut. 2019, 253, 731–740. [Google Scholar] [CrossRef] [PubMed]
  2. Graeme, M.; Walker, T.O.B. Mitigating stress in industrial yeasts. Fungal Biol. 2020, 124, 387–397. [Google Scholar] [CrossRef]
  3. da Silva Fernandes, F.; de Souza, É.S.; Carneiro, L.M.; Alves Silva, J.P.; de Souza, J.V.B.; da Silva Batista, J. Current Ethanol Production Requirements for the Yeast Saccharomyces cerevisiae. Int. J. Microbiol. 2022, 2022, 7878830. [Google Scholar] [CrossRef]
  4. Gombert, A.K.; van Maris, A.J. Improving conversion yield of fermentable sugars into fuel ethanol in 1st generation yeast-based production processes. Curr. Opin. Biotechnol. 2015, 33, 81–86. [Google Scholar] [CrossRef] [PubMed]
  5. Marques, W.L.; Raghavendran, V.; Stambuk, B.U.; Gombert, A.K. Sucrose and Saccharomyces cerevisiae: A relationship most sweet. FEMS Yeast Res. 2016, 16, fov107. [Google Scholar] [CrossRef]
  6. Della-Bianca, B.E.; Basso, T.O.; Stambuk, B.U.; Basso, L.C.; Gombert, A.K. What do we know about the yeast strains from the Brazilian fuel ethanol industry? Appl. Microbiol. Biotechnol. 2013, 97, 979–991. [Google Scholar] [CrossRef]
  7. Lata, K.; Sharma, M.; Patel, S.N.; Sangwan, R.S.; Singh, S.P. An integrated bio-process for production of functional biomolecules utilizing raw and by-products from dairy and sugarcane industries. Bioprocess Biosyst. Eng. 2018, 41, 1121–1131. [Google Scholar] [CrossRef]
  8. Walker, G.M.; Walker, R.S. Enhancing Yeast Alcoholic Fermentations. Adv. Appl. Microbiol. 2018, 105, 87–129. [Google Scholar] [CrossRef] [PubMed]
  9. Parapouli, M.; Vasileiadis, A.; Afendra, A.S.; Hatziloukas, E. Saccharomyces cerevisiae and its industrial applications. AIMS Microbiol. 2020, 6, 1–32. [Google Scholar] [CrossRef]
  10. Jacobus, A.P.; Gross, J.; Evans, J.H.; Ceccato-Antonini, S.R.; Gombert, A.K. Saccharomyces cerevisiae strains used industrially for bioethanol production. Essays Biochem. 2021, 65, 147–161. [Google Scholar] [CrossRef]
  11. Doğan, A.; Demirci, S.; Aytekin, A.Ö.; Şahin, F. Improvements of Tolerance to Stress Conditions by Genetic Engineering in Saccharomyces Cerevisiae during Ethanol Production. Appl. Biochem. Biotechnol. 2014, 174, 28–42. [Google Scholar] [CrossRef]
  12. Patra, P.; Das, M.; Kundu, P.; Ghosh, A. Recent advances in systems and synthetic biology approaches for developing novel cell-factories in non-conventional yeasts. Biotechnol. Adv. 2021, 47, 107695. [Google Scholar] [CrossRef] [PubMed]
  13. Sharma, J.; Kumar, V.; Prasad, R.; Gaur, N.A. Engineering of Saccharomyces cerevisiae as a consolidated bioprocessing host to produce cellulosic ethanol: Recent advancements and current challenges. Biotechnol. Adv. 2022, 56, 107925. [Google Scholar] [CrossRef]
  14. de Jong, T.V.; Moshkin, Y.M.; Guryev, V. Gene expression variability: The other dimension in transcriptome analysis. Physiol. Genom. 2019, 51, 145–158. [Google Scholar] [CrossRef]
  15. Kim, S.J.; Lee, J.E.; Lee, D.Y.; Park, H.; Kim, K.H.; Park, Y.C. Multi-omic characterization of laboratory-evolved Saccharomyces cerevisiae HJ7-14 with high ability of algae-based ethanol production. Appl. Microbiol. Biotechnol. 2018, 102, 8989–9002. [Google Scholar] [CrossRef] [PubMed]
  16. Franzosa, E.A.; Hsu, T.; Sirota-Madi, A.; Shafquat, A.; Abu-Ali, G.; Morgan, X.C.; Huttenhower, C. Sequencing and beyond: Integrating molecular 'omics' for microbial community profiling. Nat. Rev. Microbiol. 2015, 13, 360–372. [Google Scholar] [CrossRef]
  17. Peng, D.; Ruan, C.; Fu, S.; He, C.; Song, J.; Li, H.; Tu, Y.; Tang, D.; Yao, L.; Lin, S.; et al. Atg9-centered multi-omics integration reveals new autophagy regulators in Saccharomyces cerevisiae. Autophagy 2021, 17, 4453–4476. [Google Scholar] [CrossRef]
  18. Yang, Y.; Ren, W.; Xu, H.; Cheng, L.; Dapaah, M.F.; He, R.; Ma, H. Incorporating Transcriptomic-Metabolomic analysis reveal the effect of ultrasound on ethanol production in Saccharomyces Cerevisiae. Ultrason. Sonochem. 2021, 79, 105791. [Google Scholar] [CrossRef] [PubMed]
  19. Lu, Z.; Wu, Y.; Chen, Y.; Chen, X.; Wu, R.; Lu, Q.; Chen, D.; Huang, R. Role of spt23 in Saccharomyces cerevisiae thermal tolerance. Appl. Microbiol. Biotechnol. 2022, 106, 3691–3705. [Google Scholar] [CrossRef] [PubMed]
  20. Li, H.; Durbin, R. Fast and accurate short read alignment with Burrows-Wheeler transform. Bioinformatics 2009, 25, 1754–1760. [Google Scholar] [CrossRef]
  21. DePristo, M.A.; Banks, E.; Poplin, R.; Garimella, K.V.; Maguire, J.R.; Hartl, C.; Philippakis, A.A.; del Angel, G.; Rivas, M.A.; Hanna, M.; et al. A framework for variation discovery and genotyping using next-generation DNA sequencing data. Nat. Genet. 2011, 43, 491–498. [Google Scholar] [CrossRef] [PubMed]
  22. Wang, K.; Li, M.; Hakonarson, H. ANNOVAR: Functional annotation of genetic variants from high-throughput sequencing data. Nucleic Acids Res. 2010, 38, e164. [Google Scholar] [CrossRef] [PubMed]
  23. Litvinchuk, A.V.; Sokolov, S.S.; Rogov, A.G.; Markova, O.V.; Knorre, D.A.; Severin, F.F. Mitochondrially-encoded protein Var1 promoter loss of respiratory function in Saccharomyces cerevisiae under stressful conditions. Eur. J. Cell Biol. 2013, 92, 169–174. [Google Scholar] [CrossRef] [PubMed]
  24. Chen, K.; Wallis, J.W.; McLellan, M.D.; Larson, D.E.; Kalicki, J.M.; Pohl, C.S.; McGrath, S.D.; Wendl, M.C.; Zhang, Q.; Locke, D.P.; et al. BreakDancer: An algorithm for high-resolution mapping of genomic structural variation. Nat. Methods 2009, 6, 677–681. [Google Scholar] [CrossRef]
  25. Chen, S.; Zhou, Y.; Chen, Y.; Gu, J. Fastp: An ultra-fast all-in-one FASTQ preprocessor. Bioinformatics 2018, 34, i884–i890. [Google Scholar] [CrossRef]
  26. Kim, D.; Langmead, B.; Salzberg, S.L. HISAT: A fast spliced aligner with memory requirements. Nat. Methods 2015, 12, 357–360. [Google Scholar] [CrossRef]
  27. Li, B.; Dewey, C.N. RSEM: Accurate transcript quantification from RNA-Seq data with or without a reference genome. BMC Bioinform. 2011, 12, 323. [Google Scholar] [CrossRef]
  28. Love, M.I.; Huber, W.; Anders, S. Moderated estimation of fold change and dispersion for RNA-seq data with DESeq2. Genome Biol. 2014, 15, 550. [Google Scholar] [CrossRef]
  29. Ernst, J.; Bar-Joseph, Z. STEM: A tool for the analysis of short time series gene expression data. BMC Bioinform. 2006, 7, 191. [Google Scholar] [CrossRef]
  30. Szklarczyk, D.; Franceschini, A.; Wyder, S.; Forslund, K.; Heller, D.; Huerta-Cepas, J.; Simonovic, M.; Roth, A.; Santos, A.; Tsafou, K.P.; et al. STRING v10: Protein–protein interaction networks, integrated over the tree of life. Nucleic Acids Res. 2015, 43, D447–D452. [Google Scholar] [CrossRef]
  31. Shannon, P.; Markiel, A.; Ozier, O.; Baliga, N.S.; Wang, J.T.; Ramage, D.; Amin, N.; Schwikowski, B.; Ideker, T. Cytoscape: A Software Environment for Integrated Models of Biomolecular Interaction Networks. Genome Res. 2003, 13, 2498–2504. [Google Scholar] [CrossRef] [PubMed]
  32. Jung, S.J.; Kim, J.E.H.; Junne, T.; Spiess, M.; Kim, H. Cotranslational Targeting and Posttranslational Translocation can Cooperate in Spc3 Topogenesis. J. Mol. Biol. 2021, 433, 167109. [Google Scholar] [CrossRef] [PubMed]
  33. Kumar, V.; Maity, S. ER Stress-Sensor Proteins and ER-Mitochondrial Crosstalk—Signaling Beyond (ER) Stress Response. Biomolecules 2021, 11, 173. [Google Scholar] [CrossRef] [PubMed]
  34. Brown, S.R.; Staff, M.; Lee, R.; Love, J.; Parker, D.A.; Aves, S.J.; Howard, T.P. Design of experiments methodology to build a multifactorial statistical model describing the metabolic interactions of alcohol. ACS Synth. Biol. 2018, 7, 1676–1684. [Google Scholar] [CrossRef] [PubMed]
  35. Mariani, D.; Mathias, C.J.; da Silva, C.G.; Herdeiro, R.D.S.; Pereira, R.; Panek, A.D.; Eleutherio, E.C.; Pereira, M.D. Involvement of glutathione transferases, Gtt1and Gtt2, with oxidative stress response generated by H2O2 during growth of Saccharomyces cerevisiae. Redox Rep. 2008, 13, 246–254. [Google Scholar] [CrossRef]
  36. Raghavendran, V.; Marx, C.; Olsson, L.; Bettiga, M. The protective role of intracellular glutathione in Saccharomyces cerevisiae during lignocellulosic ethanol production. AMB Express 2020, 10, 219. [Google Scholar] [CrossRef]
  37. Kim, S.R.; Kwee, N.R.; Kim, H.; Jin, Y.S. Feasibility of xylose fermentation by engineered Saccharomyces cerevisiae overexpressing endogenous aldose reductase (GRE3), xylitol dehydrogenase (XYL2), and xylulokinase (XYL3) from Scheffersomyces stipitis. FEMS Yeast Res. 2013, 13, 312–321. [Google Scholar] [CrossRef]
  38. Marques, W.L.; Mans, R.; Marella, E.R.; Cordeiro, R.L.; Broek, M.; Daran, J.M.G.; Pronk, J.T.; Gombert, A.K.; van Maris, A.J. Elimination of Elimination of sucrose transport and hydrolysis in Saccharomyces cerevisiae: A platform strain for engineering sucrose metabolism. FEMS Yeast Res. 2017, 17, fox006. [Google Scholar] [CrossRef]
  39. Carlson, M.; Botstein, D. Two differentially regulated mRNAs with different 5' ends encode secreted with intracellular forms of yeast invertase. Cell 1982, 28, 145–154. [Google Scholar] [CrossRef]
  40. Perlman, D.; Halvorson, H.O.; Cannon, L.E. Presecretory and cytoplasmic invertase polypeptides encoded by distinct mRNAs derived from the same structural gene differ by a signal sequence. Proc. Natl. Acad. Sci. USA 1982, 79, 781–785. [Google Scholar] [CrossRef]
  41. de Valk, S.C.; Bouwmeester, S.E.; de Hulster, E.; Mans, R. Engineering proton-coupled hexose uptake in Saccharomyces cerevisiae for improved ethanol yield. Biotechnol. Biofules Bioprod. 2022, 15, 47. [Google Scholar] [CrossRef] [PubMed]
  42. Kim, J.H.; Rodriguez, R. Glucose regulation of the paralogous glucose sensing receptors Rgt2 and Snf3 of the yeast Saccharomyces cerevisiae. Biochem. Biophys. Acta. Gen. Subj. 2021, 1865, 129881. [Google Scholar] [CrossRef]
  43. Scharff-Poulsen, P.; Moriya, H.; Johnston, M. Genetic Analysis of Signal Generation by the Rgt2 Glucose Sensor of Saccharomyces cerevisiae. Genes Genomes Genet. 2018, 8, 2685–2696. [Google Scholar] [CrossRef]
  44. Diniz, A.L.; da Silva, D.I.R.; Lembke, C.G.; Costa, M.D.B.L.; Ten-Caten, F.; Li, F.; Vilela, R.D.; Menossi, M.; Ware, D.; Endres, L.; et al. Amino Acid and Carbohydrate Metabolism Are Coordinated to Maintain Energetic Balance during Drought in Sugarcane. Int. J. Mol. Sci. 2020, 21, 9124. [Google Scholar] [CrossRef]
  45. Stincone, A.; Prigione, A.; Cramer, T.; Wamelink, M.M.; Campbell, K.; Cheung, E.; Olin-Sandoval, V.; Grüning, N.M.; Krüger, A.; Alam, M.T.; et al. The return of metabolism: Biochemistry and physiology of the pentose phosphate pathway. Biol. Rev. 2014, 90, 927–963. [Google Scholar] [CrossRef] [PubMed]
  46. Xiao, T.; Khan, A.; Shen, Y.; Chen, L.; Rabinowitz, J.D. Glucose feeds the tricarboxylic acid cycle via excreted ethanol in fermenting yeast. Nat. Chem. Biol. 2022, 18, 1380–1387. [Google Scholar] [CrossRef] [PubMed]
Figure 1. Cell growth and fermentation in YPS30 medium. Cell growth curves (A), ethanol yield curves (B), the total residual sugar content curves (C), and the reducing sugar content curves (D) of two strains. (Comparison of two strains * p < 0.05, ** p < 0.01, *** p < 0.001, and **** p < 0.0001).
Fermentation 09 00483 g001
Figure 2. Genome sequencing results. Location and coding information of SNPs (A), location and coding information of InDels (B), and SV of the two strains (C). SNPs: Single Nucleotide Polymorphisms; InDels: Insertion-Deletion Mutations.
Fermentation 09 00483 g002
Figure 3. The distribution density of SNPs and InDels on chromosomes in MT strain. The distribution density of SNPs (A), the distribution density of InDels (B). SNP: Single Nucleotide Polymorphism; InDel: Insertion–Deletion Mutation.
Fermentation 09 00483 g003
Figure 4. GO enrichment of the genes associated with SNPs and InDels in MT strain. GO enrichment of the genes associated with SNPs (A), GO enrichment of the genes associated with InDels (B). GO: Gene Ontology; SNP: Single Nucleotide Polymorphism; InDel: Insertion–Deletion Mutation.
Fermentation 09 00483 g004
Figure 5. KEGG enrichment of the genes associated with SNPs and InDels in MT strain. KEGG enrichment of the genes associated with SNPs (A), KEGG enrichment of the genes associated with InDels (B). KEGG: Kyoto Encyclopedia of Genes and Genomes; SNP: Single Nucleotide Polymorphism; InDel: Insertion–Deletion Mutation.
Fermentation 09 00483 g005
Figure 6. Statistics of the DEGs between different comparison groups. DEGs: different expression genes.
Fermentation 09 00483 g006
Figure 7. KEGG enrichment of the DEGs between WT and MT strains. WT-T1 vs. MT-T1 (A), WT-T2 vs. MT-T2 (B), and WT-T3 vs. MT-T3 (C). KEGG: Kyoto Encyclopedia of Genes and Genomes; DEGs: different expression genes.
Fermentation 09 00483 g007
Figure 8. Gene expression trends of DEGs between the two strains during fermentation. The black line is the trend line, and the gray lines are gene lines. Gene expression trends of DEGs in the WT strain (A), profiles of the WT strain ordered by p-value significance of the number of genes assigned versus expected (C), gene expression trends of DEGs in the MT strain (B), profiles of the MT strain ordered by p-value significance of the number of genes assigned versus expected (D). DEGs: different expression genes.
Fermentation 09 00483 g008
Figure 9. Exclusive genes by Venn diagrams and KEGG pathway enrichment of these exclusive genes in the MT strain. Venn diagram analysis of MTprofile0 and WT profile0, and the top 15 pathway enrichments of the exclusive genes in the MT strain (A), Venn diagram analysis of MTprofile1 and WT profile1, and the top 15 pathway enrichments of the exclusive genes in the MT strain (B), Venn diagram analysis of MTprofile6 and WT profile6, and the top 15 pathway enrichments of the exclusive genes in the MT strain (C), Venn diagram analysis of MTprofile7 and WT profile7, and the top 15 pathway enrichments of the exclusive genes in the MT strain (D). KEGG: Kyoto Encyclopedia of Genes and Genomes; DEGs: different expression genes.
Fermentation 09 00483 g009
Figure 10. Protein–protein interaction network of the exclusive genes in the profile 0, 1, 6, and 7 of the MT strain. The node circles represent genes, labeling with gene ID or gene symbol; the node size is graded according to the Cytoscape connectivity, with greater connectivity leading to larger nodes. The node color is gradually changed according to log2FC; red represents log2FC > 0; the darker the red, the larger the upregulation ratio; blue represents log2FC < 0; the bluer the color, the larger the downregulation ratio. Positive correlations are shown by solid gray lines, and negative correlations are shown by dashed gray lines. The thickness of the line gradually changes according to the absolute value of the correlation coefficient; the larger value, the thicker line.
Fermentation 09 00483 g010
Figure 11. Consistency analysis of RNA-Seq and qPCR. (log2QPCR compared to log2FC, ns: not significant, * p > 0.05).
Fermentation 09 00483 g011
Figure 12. Protein–protein interaction network of sucrose consumes related genes. Core genes are shown in a diamond shape, and others in a circle, labeled with gene ID or gene symbol. The color is gradually changed according to log2FC; red represents log2FC > 0; the darker the red, the larger the upregulation ratio; blue represents log2FC < 0; the bluer the color, the larger the downregulation ratio. Positive correlations are shown by solid gray lines, and negative correlations are shown by dashed gray lines; the thickness of the line gradually changes according to the absolute value of the correlation coefficient; the larger value, the thicker line.
Fermentation 09 00483 g012
Figure 13. Exclusive genes in the MT strain are involved in carbon metabolism. Yellow box: glycolysis; blue box: fatty acid metabolism; green box: amino acid metabolism; purple box: tricarboxylic acid cycle; red box: alcohol biosynthesis. Red represents upregulated gene; green represents downregulated gene. The 3D structures of compounds were downloaded from PubChem (https://pubchem.ncbi.nlm.nih.gov/, accessed on 28 September 2022).
Fermentation 09 00483 g013
Table 1. Genes involved in the top 15 enriched pathways of the exclusive genes in the MT strain.
PathwayGene IDGene Symbol
Profile 0 a
Linoleic acid metabolismYOL011WPLB3
Lipoic acid metabolismYLR239CLIP2
Protein exportYMR150C, YLR066W IMP1, SPC3
Cellular senescenceYPR119W, YBR085, WYKL168C, YBR195CCLB2, AAC3, KKQ8, MSI1
Ribosome biogenesis in eukaryotesYLR129W, YLR175W, YDL014W, YJL069CDIP2, CBF5, NOP1, UTP18
RNA polymeraseYNL248C, YGL070CRPA49, RPB9
Tryptophan metabolismYLR044C, YGR088WPDC1, CTT1
Purine metabolismYEL042W, YIR029W, YOR128CGDA1, DAL2, ADE2
Ubiquinone and other terpenoid-quinone biosynthesisYDR539WFDC1
Vitamin B6 metabolismYNL334CSNO2
Phenylalanine, tyrosine, and tryptophan biosynthesisYDR007WTRP1
Glycine, serine, and threonine metabolismYML082W, YMR189WYML082W, GCV2
Histidine metabolismYCL030CHIS4
Arginine and proline metabolismYLR142WPUT1
Glycerophospholipid metabolismYOL011WPLB3
Profile 1 b
RibosomeYGR085C, YDR418W, YIL133C, YNL069C, YDL082W, YHL001W, YJL177W, YMR242C, YOR312C, YNL301C, YBL027W, YBR191W, YFL034C-A, YOL127W, YBL087C, YER117W, YGL031C, YLR009W, YGR034W, YLR344W, YDR471W, YHR010W, YGL030W, YDL075W, YLR406C, YBL092W, YER056C-A, YIL052C, YOR234C, YPL143W, YDL191W, YDL136W, YMR194W, YPR043W, YLR185W, YDR500C, YLR325C, YKR094C, YIL148W, YNL162W, YHR141C, YML073C, YLR448C, YPL198W, YFR031C-A, YIL018W, YGL147C, YLR340W, YDL081C, YOL039W, YOR293W, YDR025W, YCR031C, YDR337W, YLR367W, YOL040C, YDL083C, YMR143W, YDR447C, YML024W, YML026C, YDR450W, YNL302C, YOL121C, YJL136C, YKR057W, YPR132W, YER074W, YLR333C, YGR027C, YHR021C, YLR264W, YOR167C, YDL061C, YOR182C, YNL178W, YHR203C, YPL090C, YBR181C, YNL096C, YBL072C, YBR189W, YGR214W, YLR048WRPL11B, RPL12B, RPL16A, RPL16B, RPL13A, RPL14B, RPL17B, RPL20A, RPL20B, RPL18B, RPL19B, RPL21A, RPL22B, RPL25, RPL23A, RPL23B, RPL24A, RLP24, RPL26B, RPL26A, RPL27B, RPL27A, RPL30, RPL31A, RPL31B, RPL32, RPL34A, RPL34B, RPL33B, RPL33A, RPL35A, RPL35B, RPL36A, RPL43A, RPL37A, RPL37B, RPL38, RPL40B, RPL40A, RPL42A, RPL42B, RPL6A, RPL6B, RPL7B, RPL2A, RPL2B, RPL9A, RPP0, RPP1A, RPP2A, RPS10A, RPS11A, RPS14A, MRPS28, RPS22B, RPS15, RPS16B, RPS16A, RPS17B, RPS17A, RPS18B, RPS18A, RPS19B, RPS19A, RPS21B, RPS21A, RPS23B, RPS24A, RPS25B, RPS25A, RPS27B, RPS28B, RPS28A, RPS29B, RPS30B, RPS3, RPS4B, RPS6A, RPS6B, RPS7B, RPS8A, RPS9B, RPS0A, RPS0B
Nucleocytoplasmic transportYER168C, YNL221C, YNL244C, YMR260C, YJR007W, YOR260W, YER025W, YMR146C, TDR429C, YMR309C, YOR361C, YBR079C, YJL138C, YOL139C, YGR162W, YPR041W, YGR083C, YLR208W, YKL205W, YGL092W, YKL068W, YFR002W, YMR235CCCA1, POP1, SUI1, TIF11,
SUI2, GCD1, GCD11, TIF34,
TIF35, NIP1, PRT1, RPG1, TIF2, CDC33, TIF4631, TIF5, GCD2, SEC13, LOS1, NUP145,
NUP100, NIC96, RNA1
RNA polymeraseYOR341W, YJR063W, YPR010C, YIL021W, YPR187W, YOR224C, YNL113W, YNR003C, YDL150W, YPR110CRPA190, RPA12, RPA135,
RPB3, RPO26, RPB8, RPC19, RPC34, RPC53, RPC40
Ribosome biogenesis in eukaryotesYNL221C, YIL035C, YHR089C,
YDL208W, YLR059C, YNL132W, YNL163C, YGR090W, YCL031C, YDR398W, YDR324C, YMR093W, YLR222C, YCR057C, YLR197W, YDR339C, YML093W, YLR186W, YLR022C, YLR397C
POP1, CKA1, GAR1, NHP2,
REX2, KRE33, RIA1, UTP22,
RRP7, UTP5, UTP4, UTP15,
UTP13, PWP2, NOP56, FCF1, UTP14, EMG1, SDO1, AFG2
Arginine biosynthesisYOR375C, YDR111C, YPR035W, YOL058W, YER069W, YKL106WARG5,6, ALT2, GDH1, GLN1, ARG1, AAT1
Fatty acid metabolismYIL009W, YMR246W, YAR035W, YER061C, YLR372W, YJL196C, YJL097WFAA3, FAA4, YAT1, CEM1, YLR372W, ELO1, PHS1
Steroid biosynthesisYLR056W, YLR020C, YML008C, YLL012W, YGR060WERG3, YEH2, ERG6, YEH1, ERG25
Fatty acid elongationYLR372W, YJL196C, YJL097WYLR372W, ELO1, PHS1
Purine metabolismYJR105W, YJR069C, YBL068W, YMR120C, YER070W, YMR300C, YJL070C, YML022W, YMR217W, YER005W, AR015W, YGL234W, YHL011C, YCR026C, YNL141WADO1, HAM1, PRS4, ADE17, RNR1, ADE4, YMR120C, APT1, GUA1, YND1, ADE1, ADE5,7, PRS3, NPP1, AAH1
Fatty acid biosynthesisYIL009W, YMR246W, YER061CFAA3, FAA4, CEM1
Biosynthesis of unsaturated fatty acidsYLR372W, YJL196C, YJL097WYLR372W, ELO1, PHS1
Oxidative phosphorylationYOR270C, YBR039W, YDL004W, YGL008C, YKL141W, YGR020C, YLR447C, YDL185W, YBL099W, YDR529CVPH1, ATP3, ATP16, PMA1, SDH3, VMA7, VMA1, ATP1, QCR7
Pentose phosphate pathwayYBL068W, YMR205C, YCR073W-A, YGR240C, YGL185C, YBR196C, YHL011CPRS4, PFK2, SOL2, PFK1, YGL185C, PGI1, PRS3
Valine, leucine, and isoleucine biosynthesisYNL104C, YOR108W, YLR355CLEU4, LEU9, ILV5
Glycine, serine, and threonine metabolismYDR232W, YDR158W, YOL056W, YCR053W, YOR184W, YGL185C, YGR155W, YAL044CHEM1, HOM2, GPM3, THR4, SER1, YGL185C, CYS4, GCV3
Profile 6 c
Pentose and glucuronate interconversionsYGR194C, YKL035W, YJR096W, YAL061W, YHL012W, YHR104WXKS1, UGP1, YJR096W, BDH2, YHL012W, GRE3
Starch and sucrose metabolismYDL243C, YCR107W, YKL035W, YEL011W, YDR001C, YFR053C, YHL012W, YLR258WAAD4, AAD3, UGP1, GLC3, NTH1, HXK1, YHL012W, GSY2
Glutathione metabolismYER163C, YGR180C, YLR174W, YIR038C, YKL026CGCG1, RNR4, IDP2, GTT1, GPX1
Glycerolipid metabolismYDR018C, YKL094W, YPL061W, YJR096W, YHR104WYDR018C, YJU3, ALD6, YJR096W, GRE3
Galactose metabolismYKL035W, YJR096W, YFR053C, YHL012W, YHR104WUGP1, YJR096W, HXK1, YHL012W, GRE3
Amino sugar and nucleotide sugar metabolismYKL035W, YMR084W, YFR053C, YHL012WUGP1, YMR084W, HXK1, YHL012W
Fructose and mannose metabolismYJR096W, YFR053C, YAL061W, YHR104WYJR096W, HXK1, BDH2, GRE3
Fatty acid degradationYPL061W, YDL168W, YIL160CALD6, SFA1, POT1
Glycolysis/GluconeogenesisYDL243C, YCR107W, YPL061W, YDL168W, YFR053CAAD4, AAD3, ALD6, SFA1, HXK1
Pentose phosphate pathwayYGR248W, YBR117C, YGR043CSOL4, TKL2, NQM1
Valine, leucine and isoleucine degradationYPL061W, YIL160CALD6, POT1
MAPK signaling pathwayYDL006W, YNL098C, YBL016W, YLL024CPTC1, RAS2, FUS3, SSA2
Citrate cycle (TCA cycle)YLR164W, YLR174W, YJL045WSHH4, IDP2, YJL045W
Histidine metabolismYPL061W, YNL092WALD6, YNL092W
Oxidative phosphorylationYLR164W, Q0130, YJL045WSHH4, OLI1, YJL045W
Profile 7 d
Pentose and glucuronate interconversionsYOR120W, YNR073CGCY1, MAN2
Biotin metabolismYNR058WBIO3
N-Glycan biosynthesisYBR110W, YBR070CALG1, ALG14
Glycerolipid metabolismYOR120W, YOR245CGCY1, DGA1
Galactose metabolismYOR120W, YNR071CGCY1, YNR071C
Citrate cycle (TCA cycle)YCR005C, YNL009WCIT2, IDP3
Ribosome biogenesis in eukaryotesYHR170W, YNL075W, YLR106CNMD3, IMP4, MDN1
PeroxisomeYNL009W, YJR104CIDP3, SOD1
EndocytosisYHL002W, YOR211C, YER125WHSE1, MGM1, RSP5
Histidine metabolismYMR209CYMR209C
Cellular senescenceYCR008W, YJR066WSAT4, TOR1
Cell cycleYJL187C, YCR008WSWE1, SAT4
Pyrimidine metabolismYDR020CDAS2
Amino sugar and nucleotide sugar metabolismYBR023CCHS3
Fructose and mannose metabolismYOR120WGCY1
a Significant expression trend of the MT strain, profile 0-downregulation. b Significant expression trend of the MT strain, profile 1-initial downregulation, and then no change. c Significant expression trend of the MT strain, profile 6-initial upregulation, and then no change. d Significant expression trend of the MT strain, profile 7-upregulation.
Table 2. Genes of DEGs between WT-T2 vs. MT-T2 are possibly related to sucrose consumption.
Gene NameDescriptionFDRLog2-Fold Change a
SUC2Invertase; sucrose hydrolyzing enzyme1.08 × 10−20−2.28
MAL11High-affinity maltose transporter (alpha-glucoside transporter)0.205−0.91
MAL31Maltose permease; high-affinity maltose transporter (alpha-glucoside transporter)6.65 × 10−50.72
MAL12Maltase (alpha-D-glucosidase)0.141−4.03
MAL32Maltase (alpha-D-glucosidase)0.466−1.29
MAL33MAL-activator protein5.67 × 10−282.87
MAL13MAL-activator protein6.15 × 10−40.55
PMA1Plasma membrane P2-type H+-ATPase1.98 × 10−4−1.26
PMA2Plasma membrane H+-ATPase0.925−0.53
PMP2Proteolipid associated with plasma membrane H(+)-ATPase (Pma1p)0.3791.39
SOP4ER-membrane protein0.935−0.46
AST1Lipid raft-associated protein; interacts with the plasma membrane ATPase Pma1p and has a role in its targeting of the plasma membrane by influencing its incorporation into lipid rafts2.32 × 10−27−5.37
AST2Lipid raft-associated protein; overexpression restores Pma1p localization to lipid rafts which are required for targeting Pma1p to the plasma membrane1.54 × 10−5−2.36
HRK1Protein kinase; implicated in activation of the plasma membrane H(+)-ATPase Pma1p in response to glucose metabolism1.4 × 10−81.00
IMA1Major isomaltase (alpha-1,6-glucosidase/alpha-methylglucosidase)0.186−1.25
IMA2Isomaltase (alpha-1,6-glucosidase/alpha-methylglucosidase)1.28 × 10−342.58
IMA3Alpha-glucosidase; weak but broad substrate specificity for alpha-1,4- and alpha-1,6-glucosides0.697−0.27
IMA4Alpha-glucosidase; weak but broad substrate specificity for alpha-1,4- and alpha-1,6-glucosides0.697−0.27
IMA5Alpha-glucosidase; specificity for isomaltose, maltose, and palatinose, but not alpha-methylglucoside0.813−0.21
MPH2Alpha-glucoside permease13.32
MPH3Alpha-glucoside permease0.3970.087
PFK2Beta subunit of heterooctameric phosphofructokinase6.89 × 10−22−2.41
GRE3Aldose reductase; involved in methylglyoxal, d-xylose, arabinose, and galactose metabolism1.45 × 10−90.62
PGM1Phosphoglucomutase, minor isoform; catalyzes the conversion from glucose-1-phosphate to glucose-6-phosphate3.2 × 10−81.16
GAL2Galactose permease0.017−2.12
RGT2Plasma membrane high glucose sensor that regulates glucose transport5.51 × 10−11−2.54
HXT1Low-affinity glucose transporter of the major facilitator superfamily1.08 × 10−5−1.53
HXT2High-affinity glucose transporter of the major facilitator superfamily2.19 × 10−7−2.84
HXT3Low-affinity glucose transporter of the major facilitator superfamily0.018−1.08
HXT4High-affinity glucose transporter; member of the major facilitator superfamily2.79 × 10−4−1.57
HXT5Hexose transporter with moderate affinity for glucose3.54 × 10−15−2.31
HXT6High-affinity glucose transporter; member of the major facilitator superfamily1.99 × 10−26−4.56
HXT7High-affinity glucose transporter; member of the major facilitator superfamily0.414−0.83
HXT11Hexose transporter2.96 × 10−111.29
HXK1Hexokinase isoenzyme 10.228−0.77
HXK2Hexokinase isoenzyme 21.30 × 10−20.85
a log 2-fold change of differential expression; a positive number means up expression, and a minus means down expression.
Disclaimer/Publisher’s Note: The statements, opinions and data contained in all publications are solely those of the individual author(s) and contributor(s) and not of MDPI and/or the editor(s). MDPI and/or the editor(s) disclaim responsibility for any injury to people or property resulting from any ideas, methods, instructions or products referred to in the content.

