Article

Dynamic Responses of Streptomyces albulus QLU58 and Its Acid-Tolerant Derivatives to the Autoacidification in ε-Poly-l-Lysine Production

1
State Key Laboratory of Biobased Material and Green Papermaking, Qilu University of Technology, Shandong Academy of Sciences, Jinan 250353, China
2
Shandong Provincial Key Laboratory of Microbial Engineering, Department of Bioengineering, Qilu University of Technology, Shandong Academy of Sciences, Jinan 250353, China
3
School of Food Science and Engineering, Qilu University of Technology, Shandong Academy of Sciences, Jinan 250353, China
*
Author to whom correspondence should be addressed.
These authors contributed equally to this work.
Fermentation 2023, 9(5), 459; https://doi.org/10.3390/fermentation9050459
Submission received: 31 March 2023 / Revised: 26 April 2023 / Accepted: 8 May 2023 / Published: 10 May 2023
(This article belongs to the Special Issue Application of Microbial Fermentation in Organic Matter Production)

Abstract

:
Streptomyces albulus is a kind of safety bacteria that is used to produce a natural food preservative named ε-poly-l-lysine (ε-PL). Environmental autoacidification (the pH declined from 6.8 to approximately 3.0) inevitably occurred in ε-PL biosynthesis by S. albulus. In this study, the dynamic responses of S. albulus QLU58 and its acid-tolerant mutants to autoacidification were investigated at the physiological and transcriptional levels. The results showed that cell growth, ε-PL production, cell respiratory activity, and intracellular pH (pHi) homeostasis were disturbed by autoacidification. In the initial autoacidification stage (before 24 h), the acid tolerance of S. albulus was effectively improved by increasing the intracellular ATP and related amino acids contents and the H+-ATPase activity, regulating the membrane fatty acids composition, and maintaining the pHi at about 7.7. However, as the autoacidification degree deepened (after 24 h), the metabolic activities decreased and negative cell growth appeared, which weakened the acid tolerance and caused the pHi to decline to about 6.5. Additionally, the acid-tolerant mutants exhibited better performances during autoacidification, which was also confirmed by the related genes’ improved transcription levels. These results provide references for the analysis of progressive environmental modification in ε-PL production.

1. Introduction

ε-poly-l-lysine (ε-PL) is a homopolymer formed by dehydration and condensation reactions between the ε-amino and α-carboxyl groups of 25–35 l-lysine monomers under synthetase catalysis [1]. Due to its good thermal stability, water solubility, safety, and broad-spectrum antibacterial activity, ε-PL is widely used as a preservative in Japan, South Korea, the United States, and China [2].
Streptomyces albulus is the main ε-PL producer, and the optimum pH value for its growth is neutral or alkalescent. However, the autoacidification of the environmental pH from neutral to about 3.0 occurred in ε-PL production and was caused by S. albulus, in which ε-PL was only produced when the environmental pH was below 5.0 and accumulated in large amounts when it was around pH 4.0. Consequently, the acidic environment encountered in the ε-PL production provided a significant survival challenge for S. albulus [2]. Generally, when surrounded by an acidic environment, the bacteria used combined and inducible mechanisms to alleviate the acid stress’s negative effects, including alkalizing the external environment, altering the cell envelope, maintaining pHi homeostasis, protecting or repairing macromolecules, expressing transcriptional regulators, and producing general shock proteins and chaperones [3]. Few researchers have paid attention to the acid stress encountered in ε-PL production, but we studied the physiological and transcriptional differences in S. albulus in different acidic environments [4]. To date, most of the mechanisms were obtained from studies that concerned bacterial responses to sudden acid stress, with relatively few studies investigating acid stress in the fermentation process. Much less studied is the dynamic responses of S. albulus to progressive environmental modification that is linked to autoacidification [5,6].
In the present study, the physiological and transcriptional changes in S. albulus QLU58 and its acid-tolerant mutants were considered in ε-PL production to explore the dynamic response mechanism of S. albulus to autoacidification. These results provide new insights into the acid-tolerance response of S. albulus.

2. Materials and Methods

2.1. Microorganisms and Inoculum Preparation

S. albulus QLU58 is a wild ε-PL-producing strain isolated from soil; its acid-tolerant mutants S. albulus AAE43 and S. albulus AAE89 were obtained by inducing acidic adaptive evolution at pH 3.1 and then maintained in our laboratory. M3G medium containing (g/L): Glucose 50, yeast 5, (NH4)2SO4 10, KH2PO4·2H2O 1.4, MgSO4·7H2O 0.5, K2HPO4·2H2O 0.8, FeSO4·7H2O 0.03, and ZnSO4·7H2O 0.03 was used as the seed and fermentation medium. The pH was adjusted to the set values with 1 M NaOH or H2SO4 solution and sterilized at 121 °C for 20 min. Among them, the glucose was sterilized alone. If equipped with M3G solid medium, 20 g/L of agar was added. The reagents used in this study are all from the China National Pharmaceutical Group Corporation, China. The mature spores of two rings were inoculated in a 300 mL conical flask (spore concentration was approximately 2 × 10⁵ per/mL) containing 50 mL of M3G medium (initial pH 6.8) and shaken (200 r/min) at 30 °C for 24 h as seed liquid.

2.2. Screening of the Acid-Tolerant Mutants

The acid-tolerant mutants of S. albulus were screened using acidic adaptive evolution as described by Wu et al., with slight modification [5]. The seed liquid of S. albulus QLU58 was inoculated into the M3G medium (pH 4.0) with an inoculation amount of 2% and then cultured at 30 °C and 200 r/min for 4 days (pH dropped to around 3.1 after 2 days of fermentation and then remained unchanged). After that, the culture was transferred to another fresh M3G medium (pH 4.0) with 2% inoculum. This process was continuously repeated for 70 days. In different periods of evolution, the cultures were spread on the M3G solid plate of pH 4.0 to screen the evolutional strains with improved acid tolerance, and the ε-PL production of these acid-resistant mutants was determined. Finally, the mutants of S. albulus AAE43 and S. albulus AAE89 with high ε-PL production were obtained.

2.3. Batch Fermentation

The batch fermentation was prepared as previously described [4]. In this study, a 5 L fermenter (FUG-5L, Guoqiang Biochemical Engineering Equipment Co., Ltd., Shanghai, China) with a working volume of 3.5 L was used. The initial temperature, pH, aeration, and agitation were set as 30 °C, 6.8, 4 L/min, and 200 r/min. For the inoculum, 300 mL of seed culture was used. During the fermentation process, the pH and dissolved oxygen (DO) were, respectively, monitored online using the pH and DO electrodes (K8S-225 and InPro6800, Mettler Toledo, Zurich, Switzerland); the DO was controlled above 30% saturation, and the pH was uncontrolled.

2.4. Measurement of ε-PL Production and Dry Cell Weights

Ten milliliters of fermentation broth was centrifuged (5000× g, 10 min). The supernatant was used to determine the ε-PL production according to the method described by Itzhaki [7], and the precipitate was filtered using pre-weighed filter paper, dried at 105 °C to a constant weight, and then used to measure the dry cell weights (DCW).

2.5. Measurement of Cellular Respiratory Activity

The respiratory activity of S. albulus was determined using redox dyes according to the method described by Winding [8]. Using the bacstain-CTC rapid staining kit (Dojindo, Kumamoto, Japan) to prepare the staining samples. The fluorescence value was determined using a multifunction enzyme labeling instrument H4 (Synergy NEO2, BioTek, Winooski, VT, USA) at an excitation wavelength of 488 nm and an emission wavelength of 630 nm. The measured value of S. albulus QLU58 at 12 h was set as 100%, and the respiratory activities of the others were relative values.

2.6. Measurement of Intracellular pH

The fermentation broths for different fermentation periods were centrifuged (5000× g, 10 min) and then washed with a 0.1 M phosphate buffer (pH 7.0). The mycelia were broken using ultrasonic in an ice water bath (power 650 w, break 2 s and stop 2 s, 5 min), and the suspension of broken mycelia was collected using centrifugation (600× g, 4 min). The intracellular pH of S. albulus QLU58 and its acid-tolerant mutants were then determined by adding a 2′,7′-bis-(2-carboxyethyl)-5-(and-6)-carboxyfluorescein acetoxymethyl ester (BCECF AM) reaction according to the method reported by Breeuwer et al. [9].

2.7. Measurement of Intracellular ATP and H+-ATPase

The method for determining the intracellular ATP was based on Cichna et al. [10] and slightly modified. The fermentation broth’s supernatant was discarded (5000× g, 10 min) and re-suspended in 0.5 M HClO4 (0 °C) to prevent cell metabolism. Subsequently, the bacteria were crushed using ultrasonic in an ice water bath (power 650 w, break 2 s and stop 2 s, 10 min) and centrifuged at 12,000× g for 20 min. The supernatant was then determined using HPLC (L-20AT, SHIMADZU, Kyoto, Japan) after passing through a 0.22 μm filter membrane. The H+-ATPase activity was measured using the method described in the H+-ATPase assay kit (GENMED, Shanghai, China).

2.8. Intracellular Amino Acid Analyses

Seven hundred and fifty microliters of fermentation broth was centrifuged in a 1.5 mL centrifuge tube at 10,000× g for 5 min, and the precipitate was centrifuged and washed 3 times with ultrapure water (8000× g, 60 s). The cells were re-suspended with 750 μL of 10% trichloroacetic acid, then the reaction system was bathed at 37 °C for 10 min and boiled for 15 min. The mixture was centrifuged at 12,000× g for 10 min, and the supernatant was analyzed using HPLC according to the method of Founoulakis et al. [11].

2.9. Analysis of Fatty Acids on Cell Membrane

According to the Sasser method [12], the fermentation broth supernatant was discarded from the centrifuge (10,000× g, 5 min), and the cells were washed twice with normal saline (NaCl, 0.9%). After saponification, methylation, extraction, and alkali washing in sequence, the upper organic phase was used to analyze the fatty acids’ components using GC-MS (TSQ 8000 Evo, Thermo Fisher Scientific, Waltham, MA, USA).

2.10. Quantitative Reverse Transcriptase-PCR (qRT-PCR) Analysis

The RiboPureTM-Yeast Kit (Life Technologies, Carlsbad, CA, USA) was used to extract the total RNA. The cDNA was synthesized using the AMV First Strand cDNA synthesis kit (Sangon Biotech, Shanghai, China). qRT-PCR was carried out on Real-Time PCR Instruments (StepOne plus, Applied Biosystems, Foster City, CA, USA) with a reaction system of 20 μL: 10 µL SybrGreen qPCR Master Mix (2X), 0.4 µL PCR forward primer (10 µM), 0.4 µL PCR reverse primer (10 µM), 7.2 µL ddH2O, and 2 µL cDNA template. The reaction conditions were pre-denaturation at 95 °C for 3 min and then entering 40 cycles of amplification steps (melt at 95 °C for 5 s, anneal at 60 °C for 10 s, and extend at 72 °C for 15 s). The 16S rDNA was used as an endogenous reference gene. The qRT-PCR primers were designed using Primer Premier 5.0 (Table S1). All the experiments were repeated for at least three biological replicates [4].

2.11. Statistical Analysis

To check the reproducibility, the experiments were carried out at least in triplicate. The data’s statistical significance was determined using SPSS Statistics 20 (IBM, Armonk, NY, USA) to perform a one-way analysis of variance (ANOVA) followed by Tukey’s honestly significant difference (HSD) post hoc test (p ≤ 0.05).

3. Results and Discussion

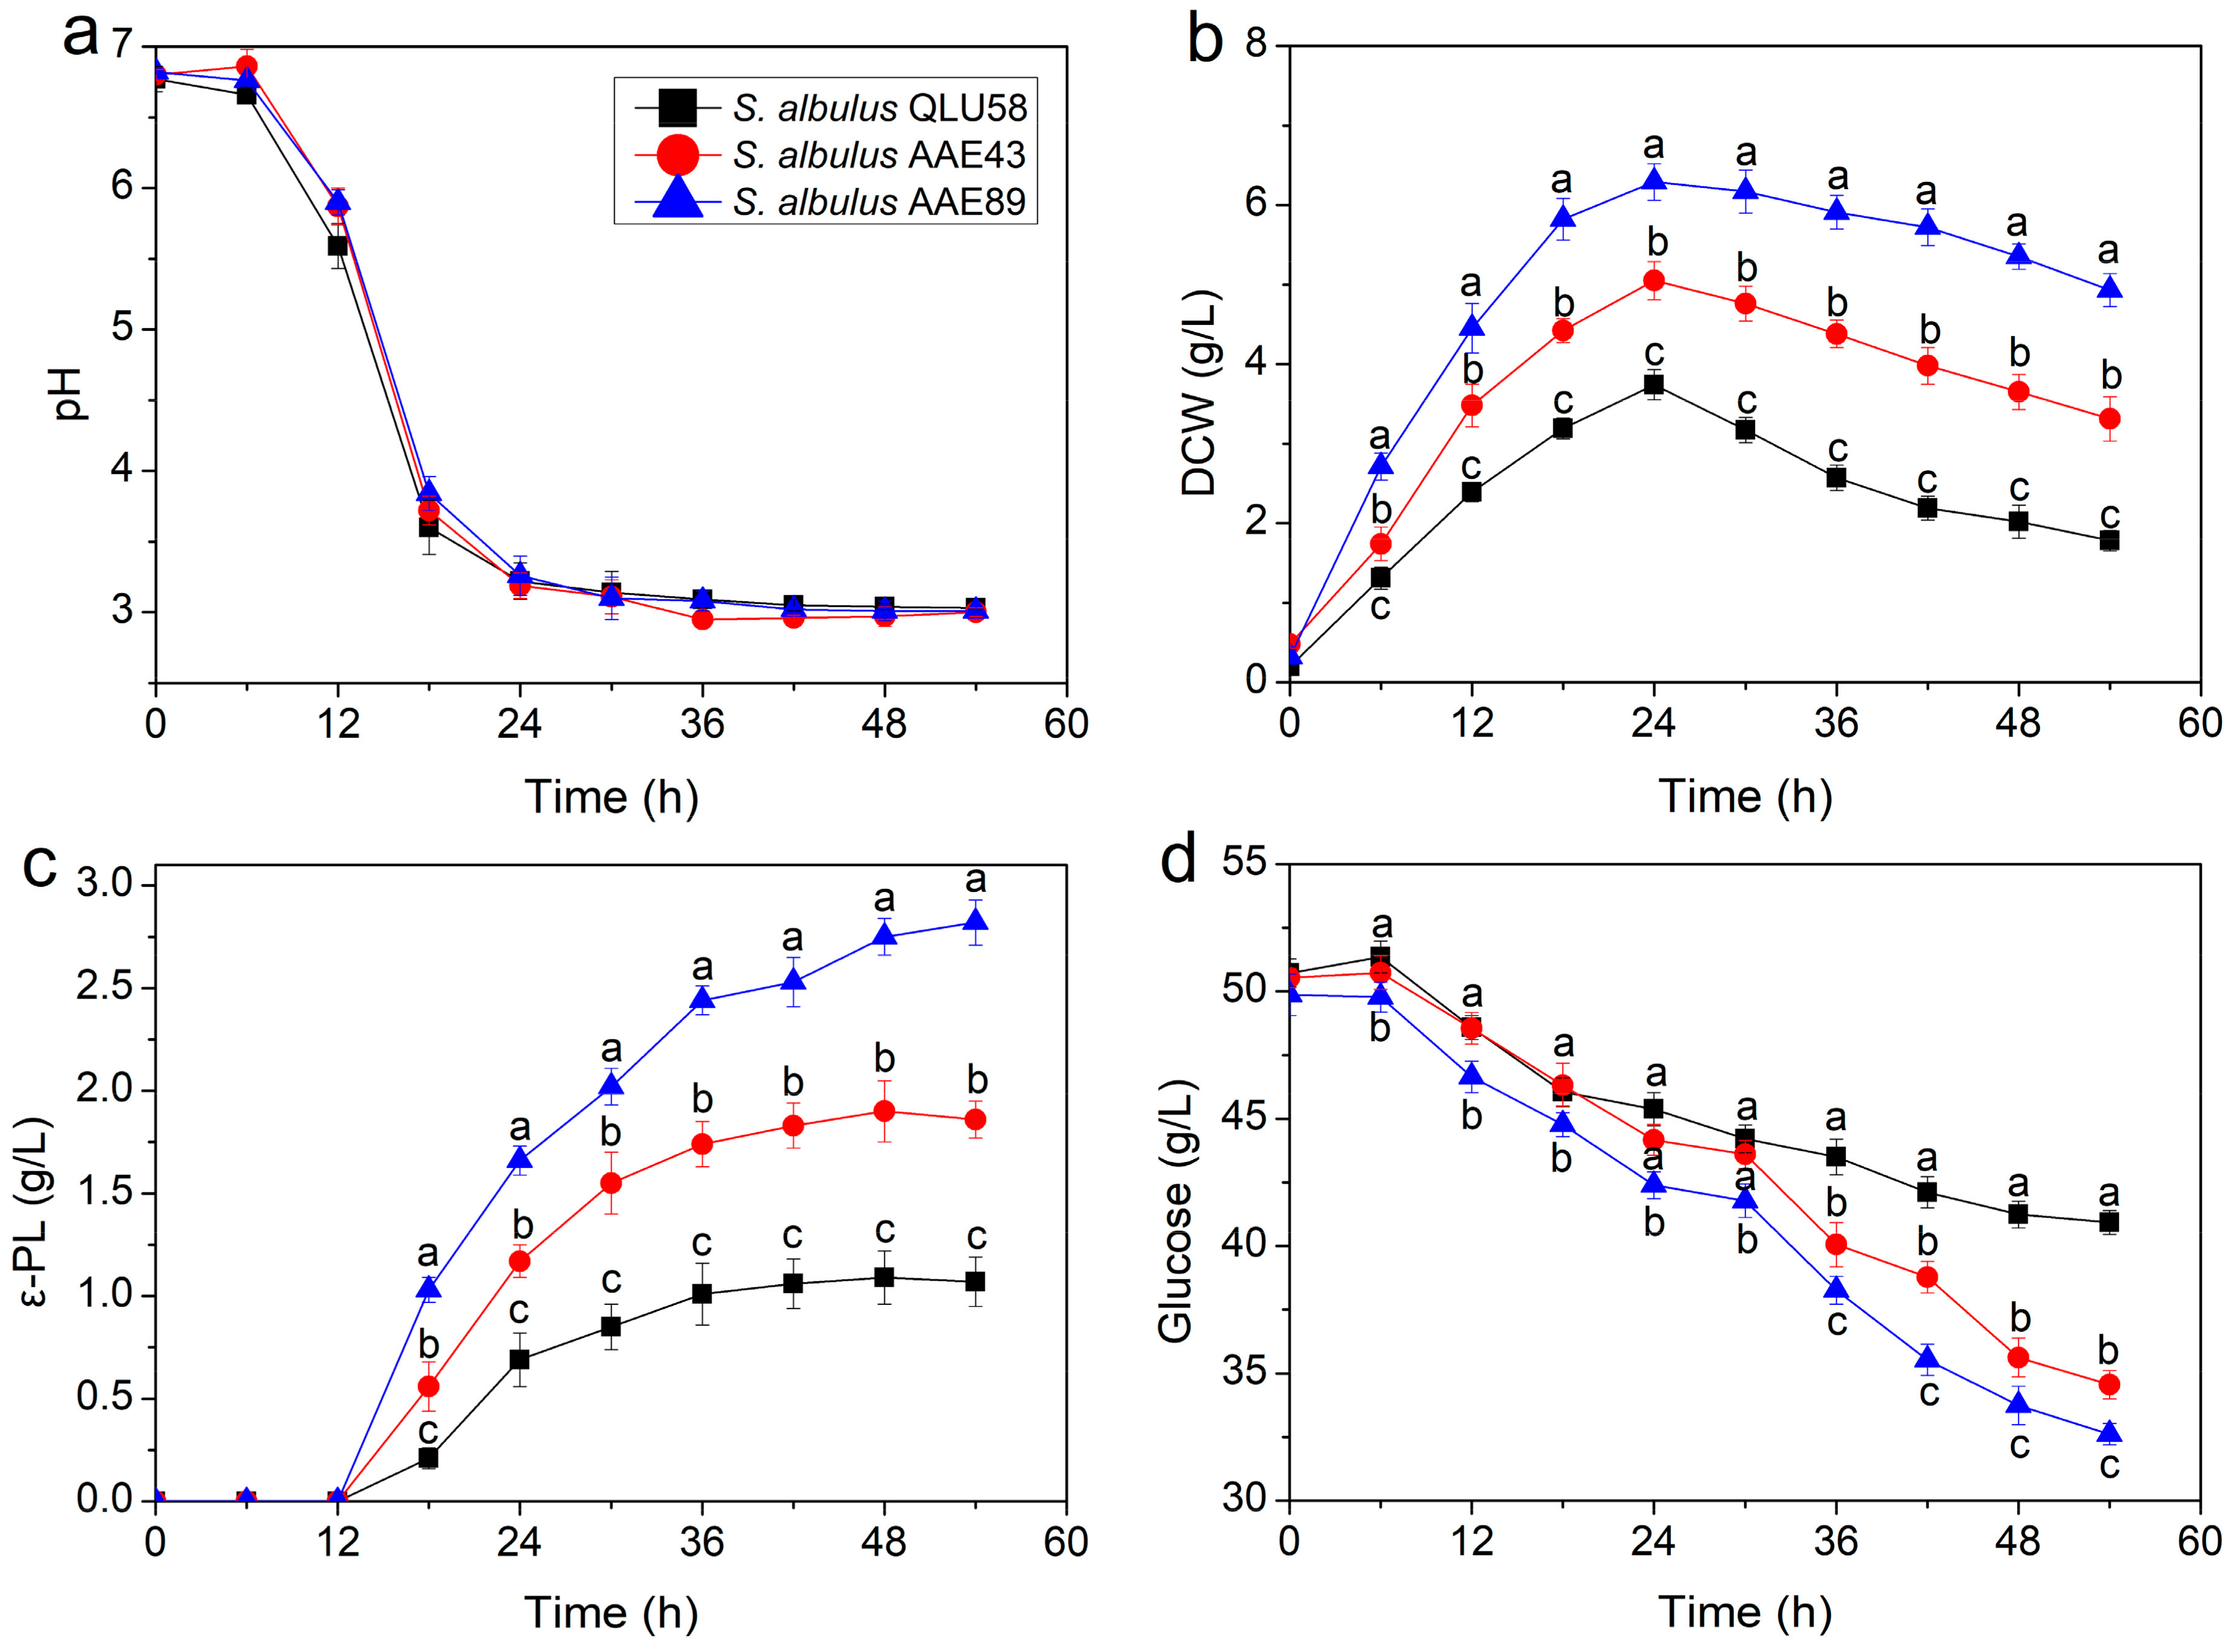
3.1. Changes in the Fermentation Parameters in Batch Fermentations for ε-PL Production by S. albulus

3.1.1. Kinetic Parameters

As shown in Figure 1, S. albulus QLU58 and its acid-tolerant mutants S. albulus AAE43 and S. albulus AAE89 were cultivated in a 5 L fermenter, and the changes in pH, DCW, ε-PL production, and residue glucose were studied, respectively. The optimum pH for growing S. albulus is neutral or alkalescent, but producing and accumulating ε-PL requires an acidic environment [13]. In the first 12 h of fermentation, the environmental pH slowly decreased and maintained at a high level, which was suitable for cell growth but not for ε-PL biosynthesis. Therefore, the DCW rapidly increased without ε-PL production. At this stage, the glucose was mainly used for growing and reproducing bacteria, so the consumption was less. From 12 to 24 h, the environmental pH rapidly decreased from more than 5.5 to about 3.0. Correspondingly, the S. albulus growth became slower, and the DCW reached the maximum at 24 h. Simultaneously, the ε-PL began to be produced and continued to accumulate. During this period, the glucose consumption was significantly increased, which was used for both cell growth and ε-PL production. After 24 h, the environmental pH remained at about 3.0. The cell death exceeded growth, so the DCW continuously decreased, while the ε-PL production continued increasing. After 36 h, the ε-PL production of S. albulus QLU58 and S. albulus AAE43 tended to be stable, while only S. albulus AAE89 continued to increase. In the late stage of fermentation, the glucose consumption was much slower, which was closely related to the diminished ε-PL production and cell growth.
Figure 1a shows that the environment autoacidification trends in ε-PL production were similar among the three strains, while the DCW, ε-PL production, and glucose consumption of the acid-tolerant mutants were higher than those of the original strain throughout fermentation (Figure 1b–d). Compared to the original strain QLU58, the maximum DCW of AAE43 and AAE89 increased by 35% and 68%, the final ε-PL production of AAE43 and AAE89 increased by 74% and 164%, and the glucose consumption of AAE43 and AAE89 increased by 63% and 76%, respectively. Taken together, the acid-tolerant mutants were more adapted to the autoacidification of environmental pH and had a stronger ability to grow and produce ε-PL.
The inhibitory effect of the pH could not be differentiated from that related to the ε-PL accumulation, as ε-PL biosynthesis is shown to increase at low pH [2]. However, autoacidification provoked the pHi decrease and inhibited the cell growth and glucose consumption rates [14]. Therefore, ε-PL production stagnation caused by acid damage in the later stage of ε-PL fermentation is unavoidable [15]. According to the kinetic parameter changes, an acid-tolerant response mechanism clearly existed in the cell for acidification conditions, which caused S. albulus to show positive cell proliferation, ε-PL synthesis, and glucose metabolism in the early stage of autoacidification. However, after 24 h of fermentation, the cells showed typical post-acidification phase characteristics, thus indicating that the cells could not maintain intracellular homeostasis and showed obvious acid response mechanism weakening. In addition, from the difference between S. albulus QLU58 and its mutants, the difference between the acid tolerance of cells can affect the degree of damage but not the nodes when the acid damage occurs.

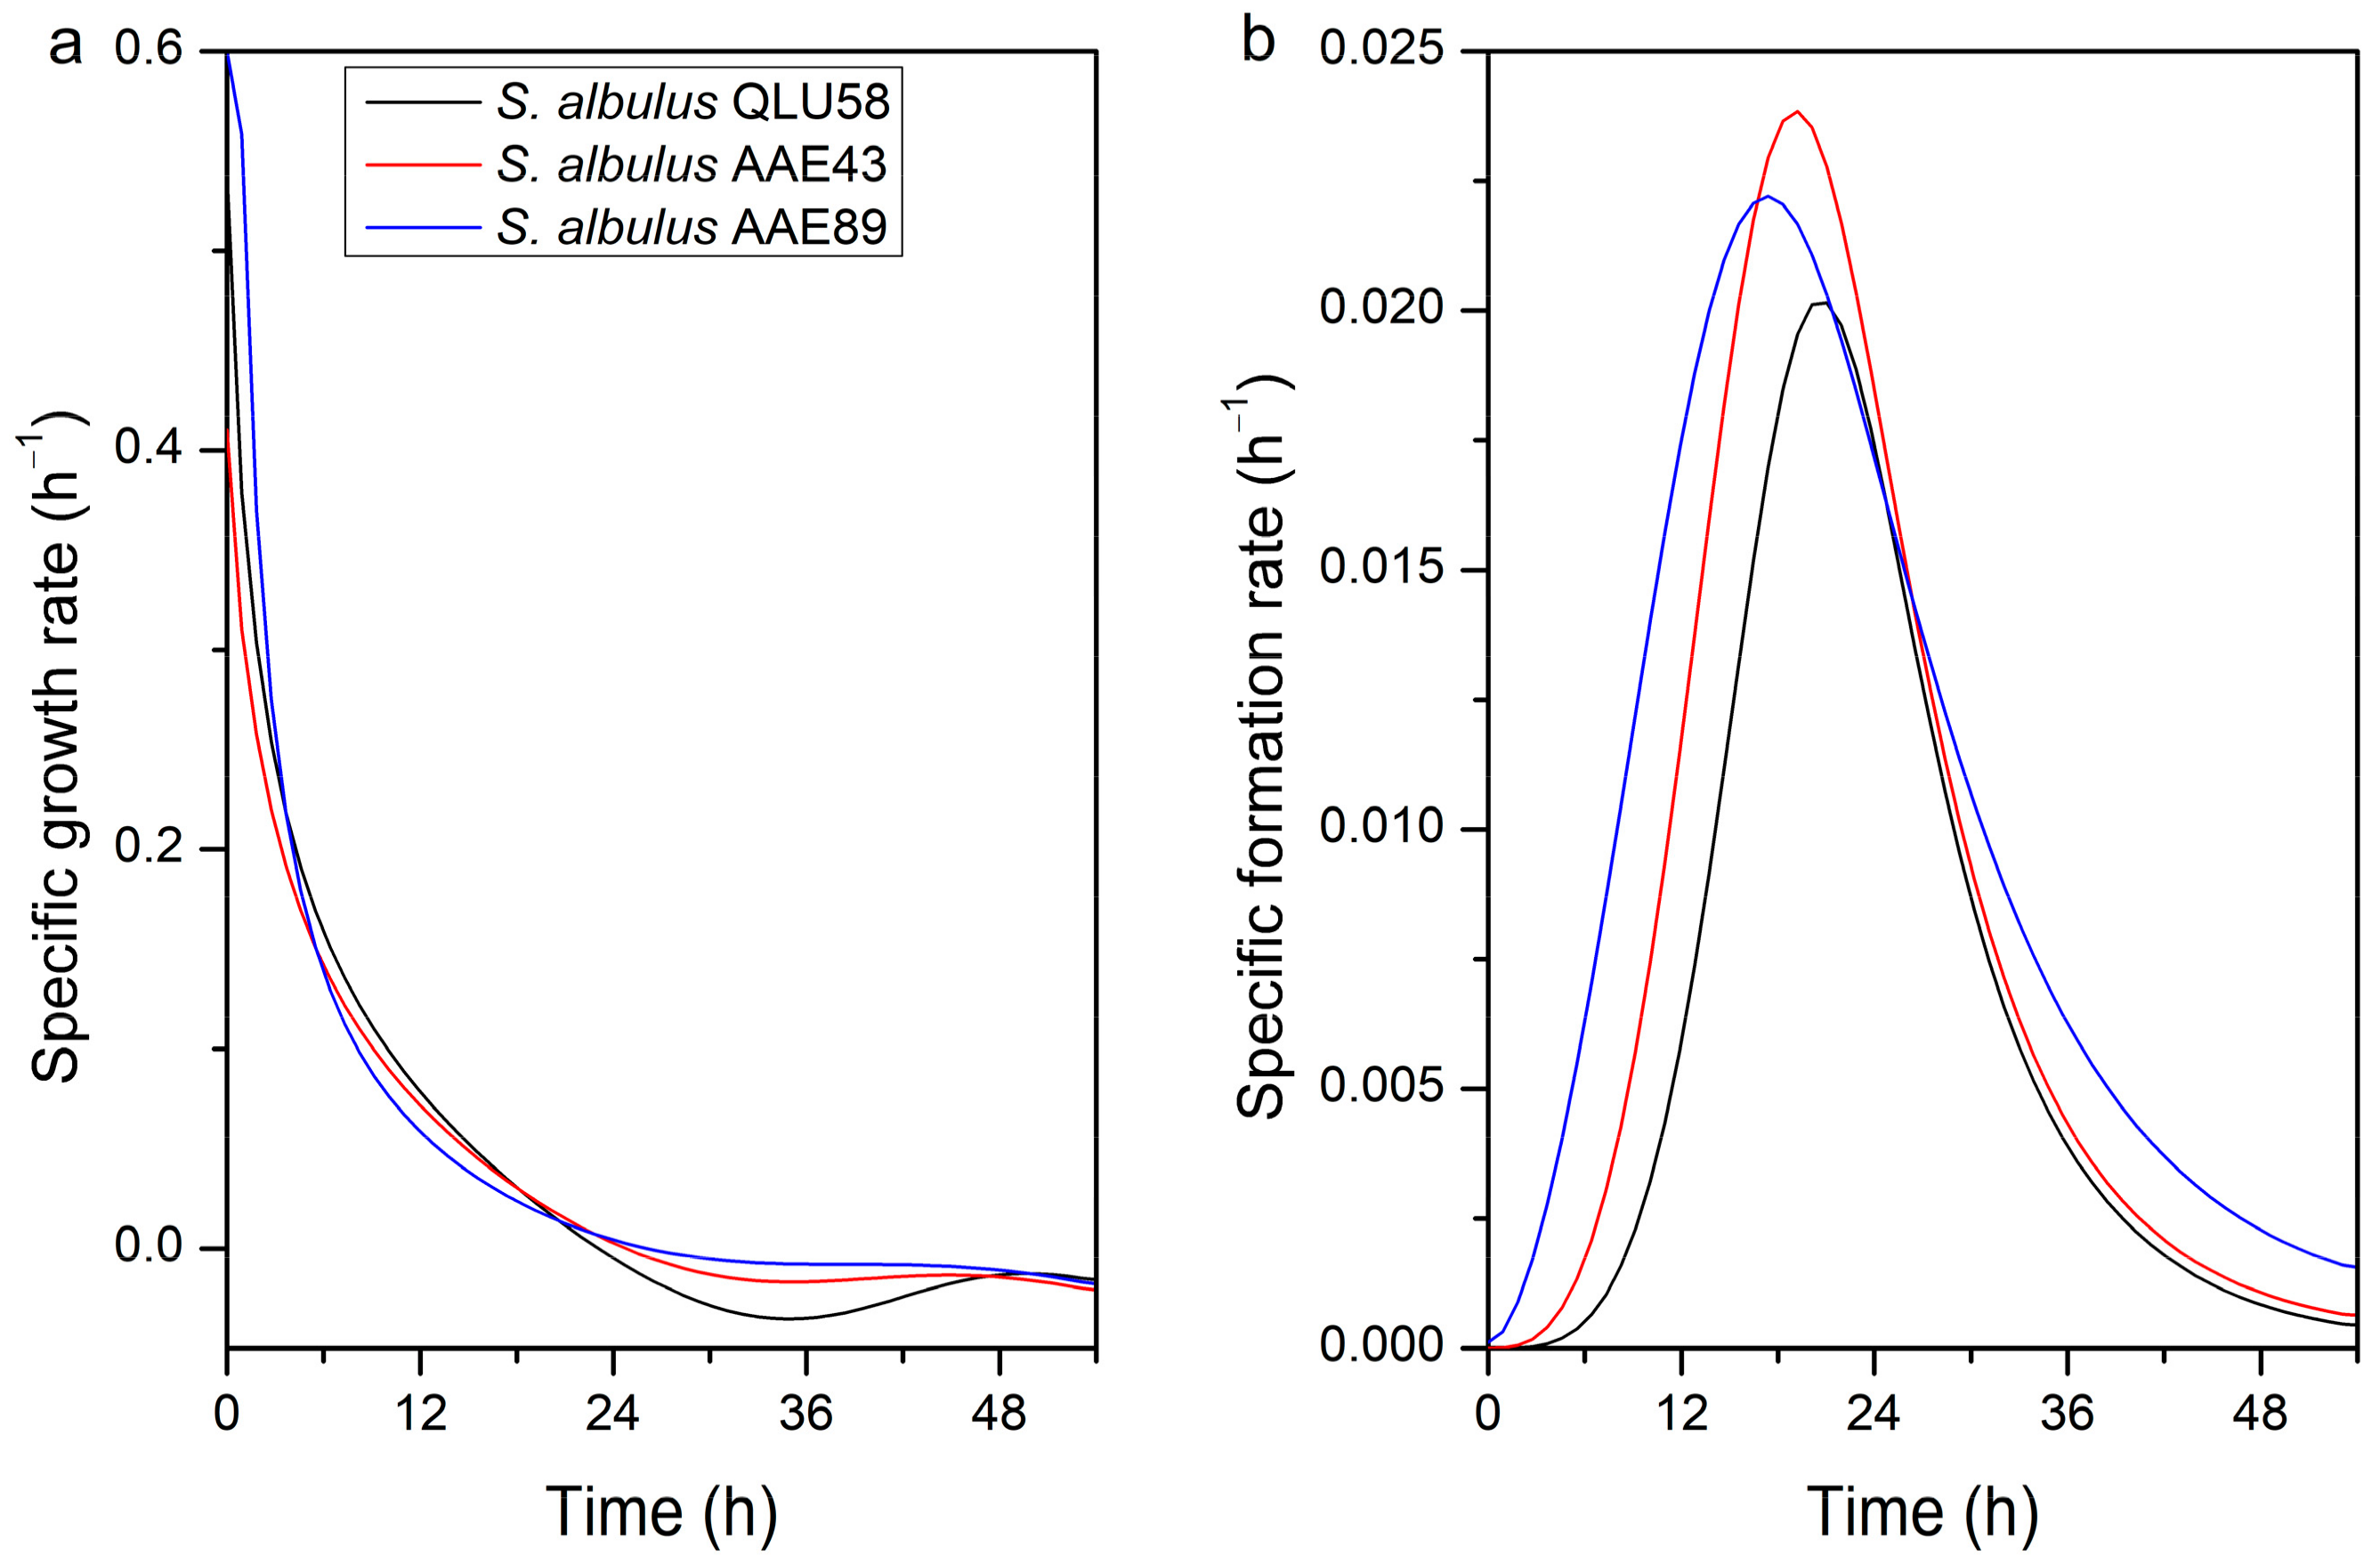
3.1.2. Specific Rates of Cell Growth and ε-PL Production

To further analyze autoacidification’s effects on cell growth and ε-PL production, the specific cell growth rate (μx) and the specific ε-PL formation rate (μp) of the three bacteria were calculated based on the data in Figure 1b,c. As shown in Figure 2a, the μx was affected by the continuous decrease in environmental pH and showed downward trends. Before 24 h, although the μx of the three strains was decreasing, it still showed positive growth trends, and the total number of bacteria still increased, which was consistent with the DCW change trends in Figure 1b. After 24 h, with the environmental pH remaining around 3.0, the μx of the three strains decreased to less than 0, in which the original strain was significantly lower than that of the mutants, thus indicating that the original strain was more sensitive to the extremely acidic environment.
The μp curves of the three strains were similar during fermentation; all reached the highest point around 18 h and then began to decrease (Figure 2b). According to the results from related research, the optimum pH for ε-PL biosynthesis is about 4.0 [14]. The environmental pH of the three strains was about 3.7 at 18 h (Figure 1a), which was consistent with previous studies. Notably, the μp of AAE43 and AAE89 was higher than that of the original strain QLU58 throughout fermentation, thus demonstrating that the mutants’ ε-PL production capacity was also stronger than that of the original strain.
The μx and the μp changes also demonstrated the regulation effect on cell growth and ε-PL production caused by acidification. Obviously, for S. albulus QLU58 and its mutants, their growth was inhibited by environmental autoacidification, and the deeper the acidification, the stronger the inhibition. This proves that acidification has only a negative effect on the cell proliferation of S. albulus. This contrasts with the behavior observed in cultures where the μx increased before 6 h [2]. The cells’ ε-PL production is also regulated by the pH. Under acidification conditions, the ability of S. albulus to produce ε-PL was the strongest when the pH was 4.0, and the μp increased to the highest. This is consistent with previous reports [14,15]. Since then, the decrease in μp is caused more by the substantial decrease in biomass, meaning autoacidification’s effect on ε-PL production cannot be ignored.

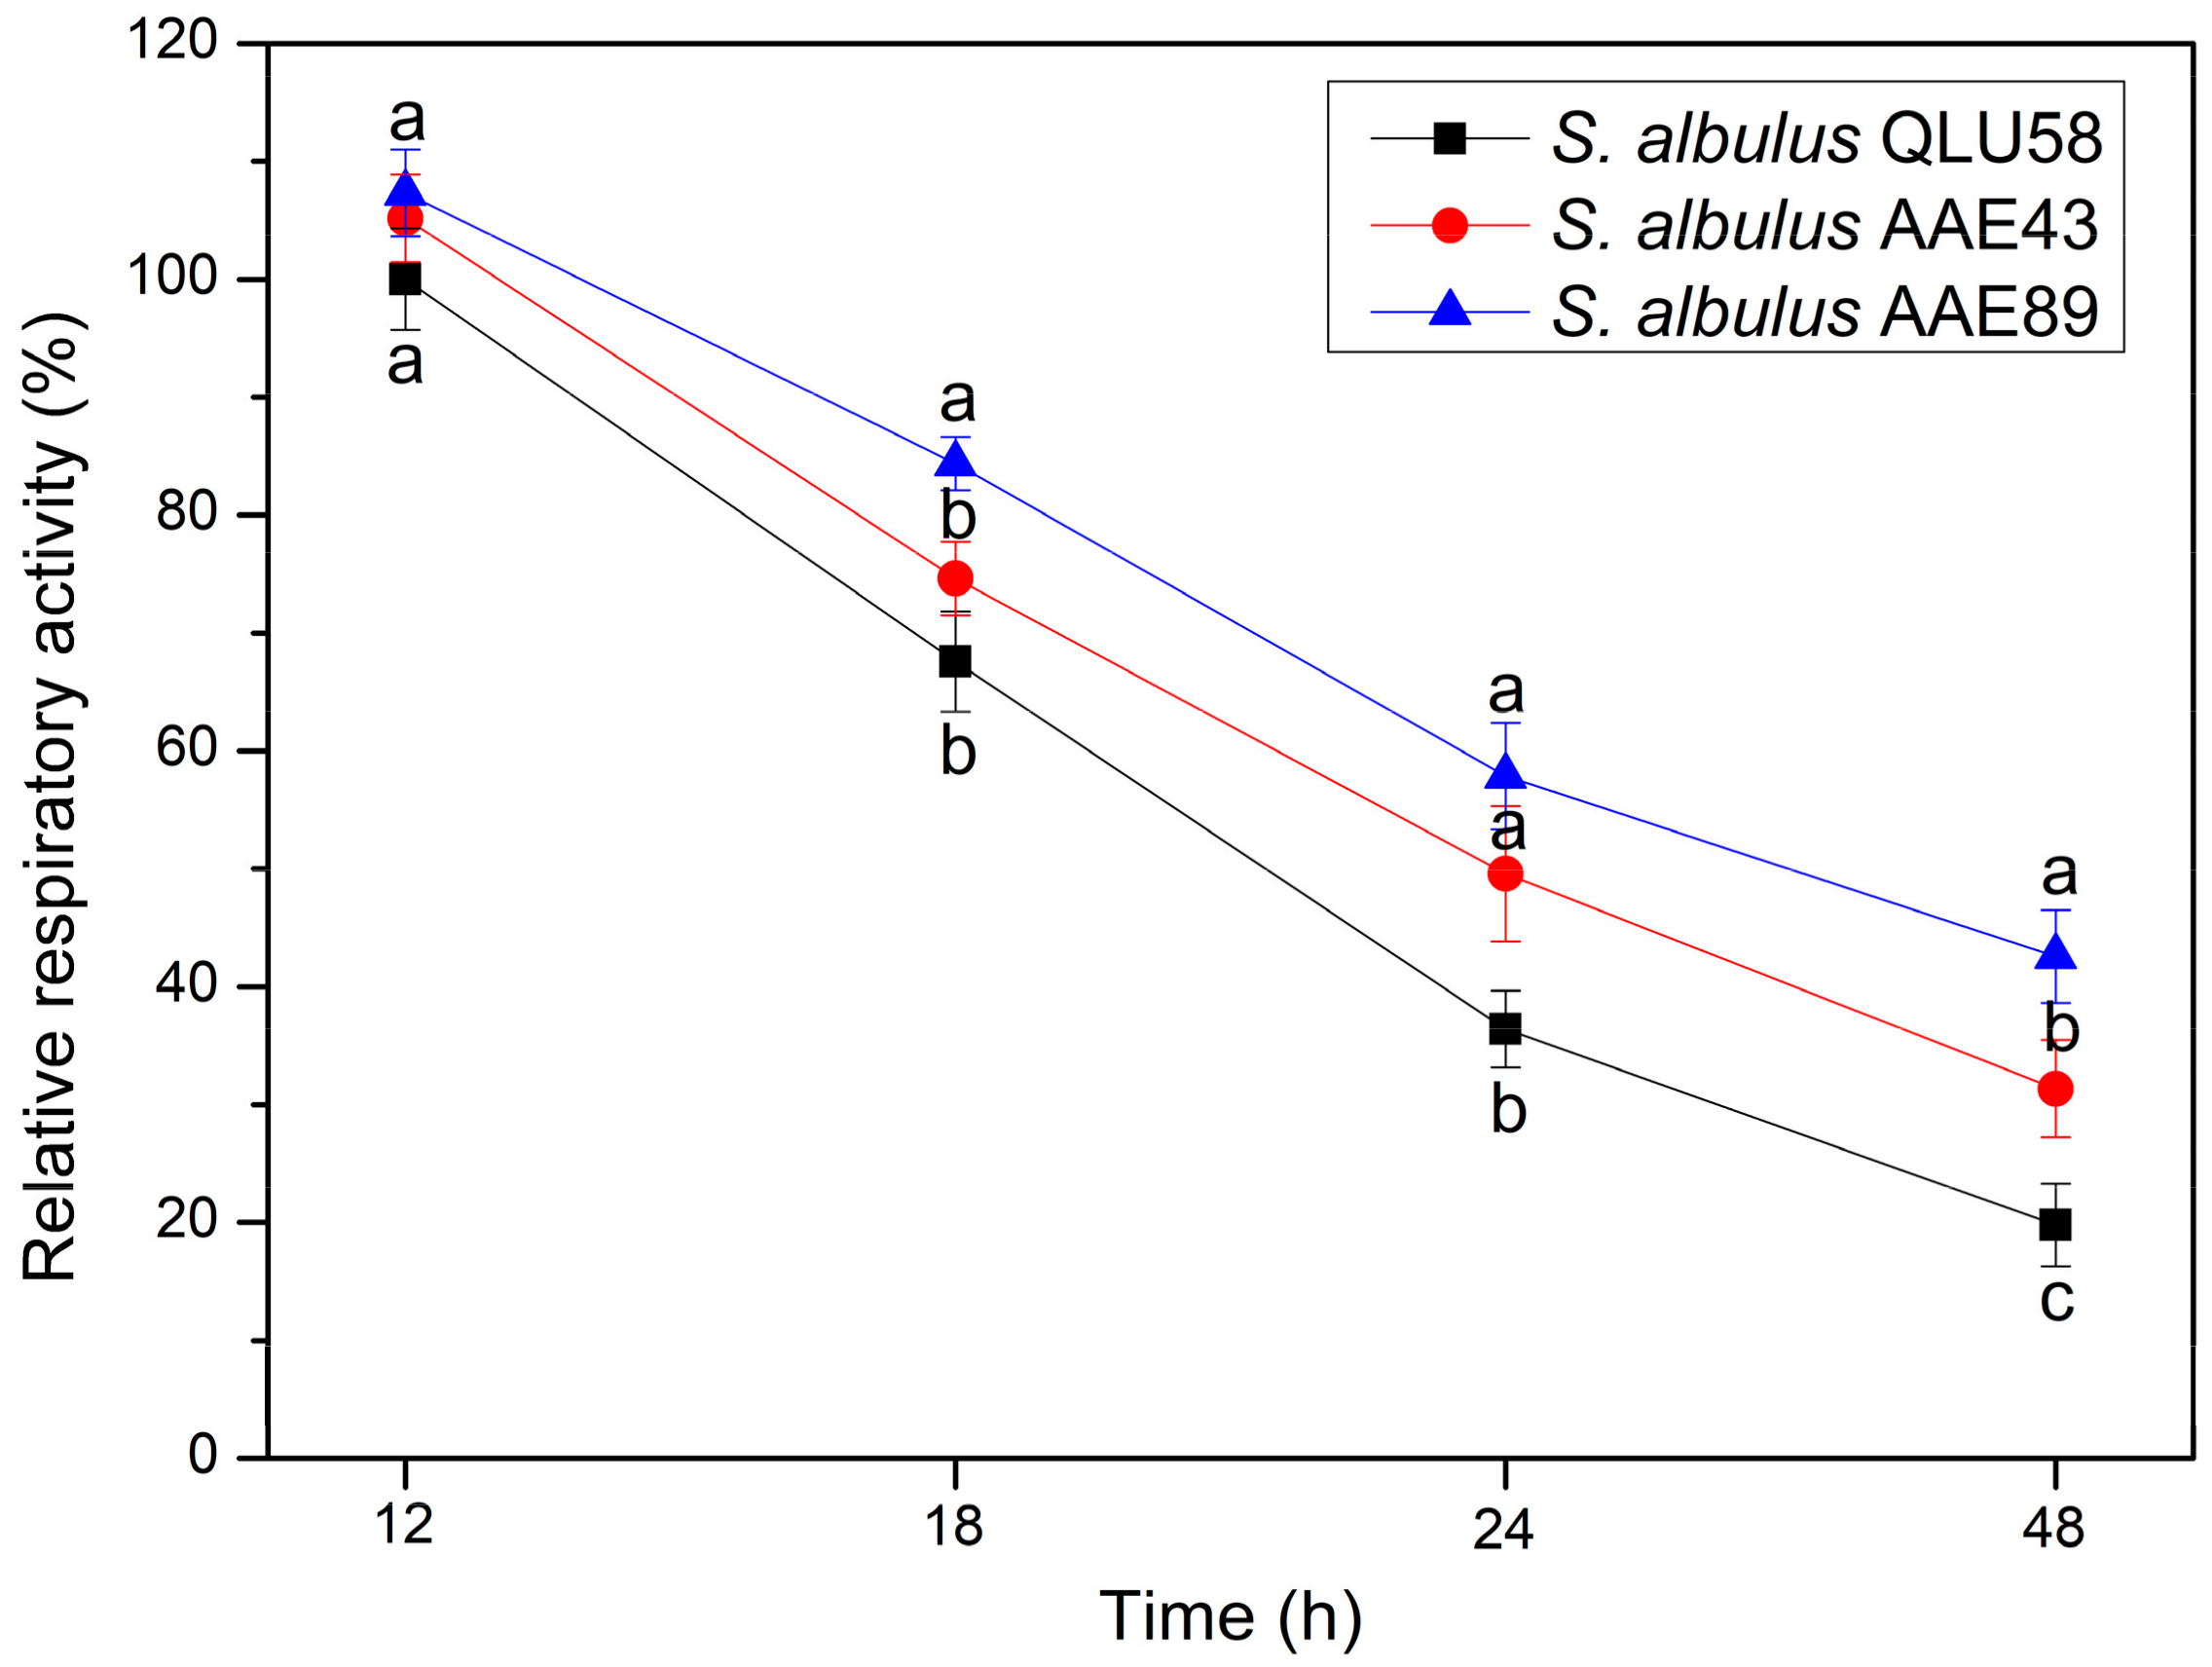
3.1.3. Respiratory Activity

Bacteria release energy through respiration to supply the consumption of life activities. Stronger cell respiration activity produces more ATP, resulting in vigorous cell growth and metabolite production [16]. Cells’ increased respiratory activity has been reported to finally increase validamycin A production in S. hygroscopicus fermentation [17]. Therefore, analyzing the changes in respiratory activity of cells over time could help to reflect the changes in physiological activities and production performances of wild and mutant strains during fermentation. The relative respiratory activity of the three strains continuously decreased during the entire fermentation process, which indicated that the cell vitality was progressively inhibited by autoacidification (Figure 3). Compared to the original strain, the mutants’ respiratory activities were stronger and decreased slower in the same fermentation time. At 48 h, the relative respiratory activities of AAE43 and AAE89 were 1.58 and 2.15 times higher than that of QLU58. Consequently, the vitalities of the acid-tolerant mutants were less inhibited during the autoacidification, which was beneficial to cell growth and ε-PL production.
The changes in the relative respiratory activity can reflect the intracellular energy metabolism’s strength, which is usually closely related to cell growth and secondary metabolite production [17]. Cell proliferation, intracellular proton excretion, and ε-PL synthesis all require energy to be functional [2]. The decline of cell relative respiratory activity will inevitably have a negative effect. Combined with the above results, we speculate that, in the case of a lack of energy, cells cause more energy to flow to ε-PL production and intracellular acid excretion, rather than cell growth. After the pH decreased to 3.0 (after 24 h), the respiration would provide more ATP for ε-PL synthase function, and the glucose catabolism energy for biomass synthesis was significantly reduced [16]. This rerouting of the energy together with the decrease in the energy production resulting from the catabolic flux dropping was responsible for the decrease in the growth rate until arrest. This change also exists in acid-tolerant mutants, which proves once again that the acid tolerance strength does not change the whole cell inhibition trend.

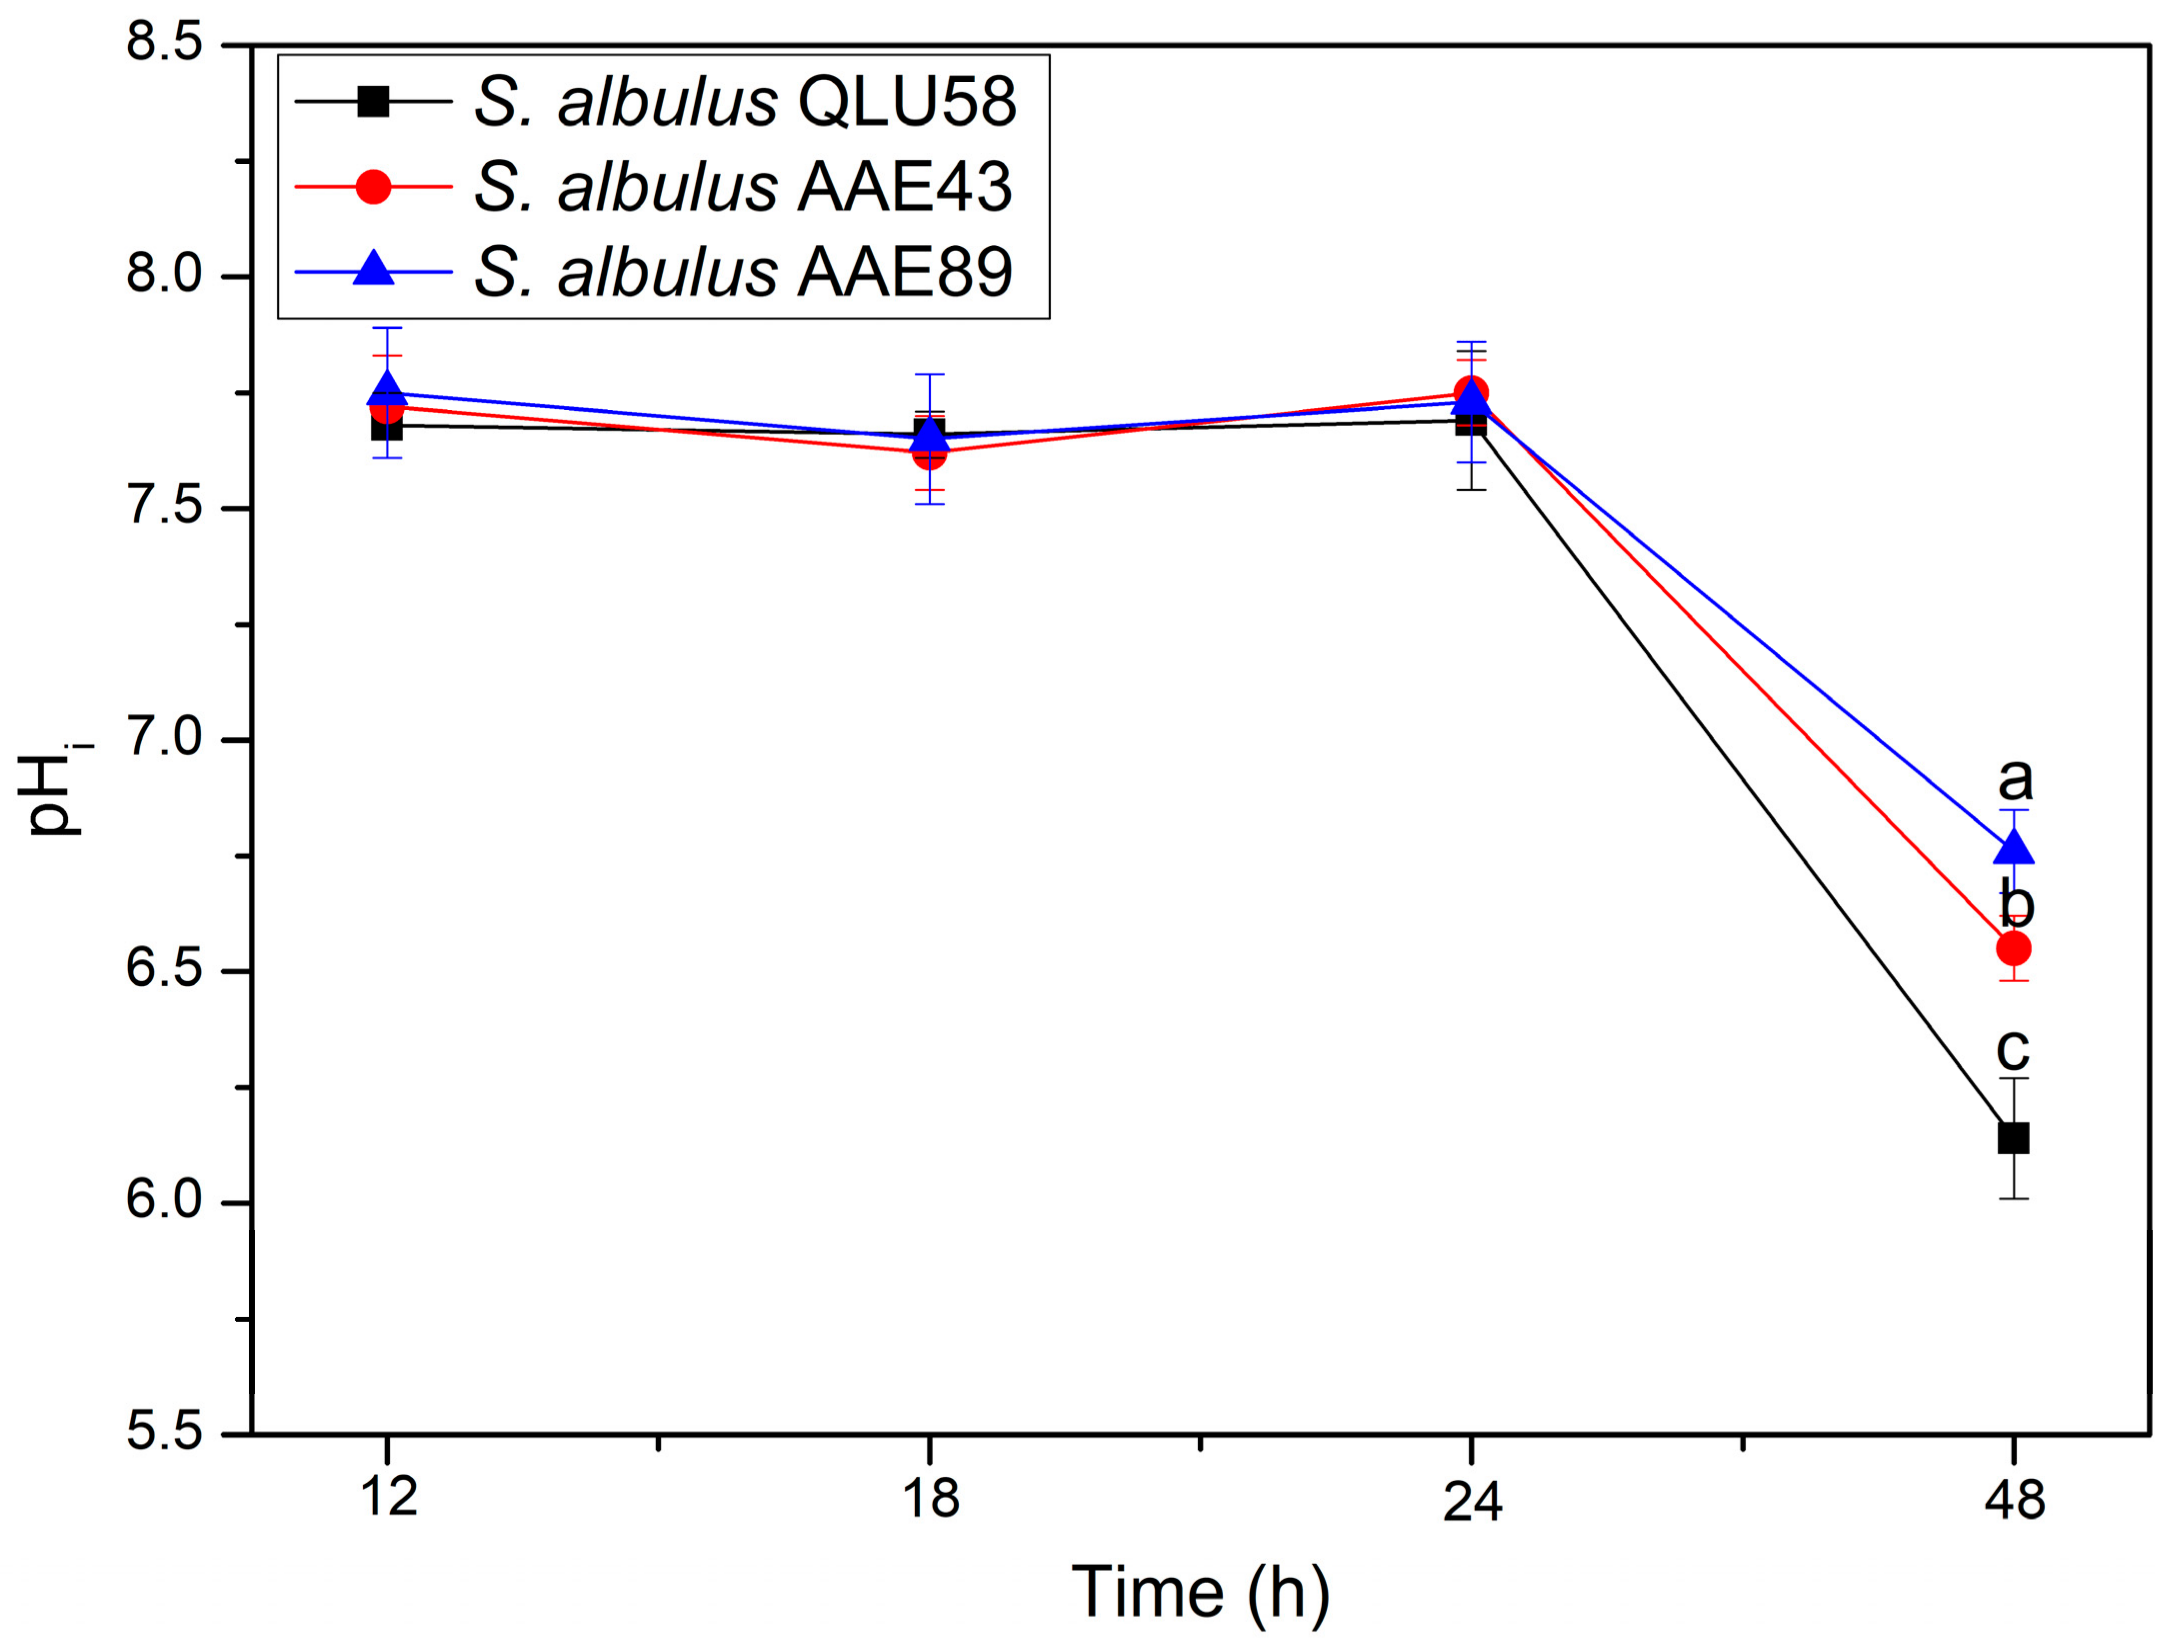
3.2. Maintenance of Intracellular pH

3.2.1. Intracellular pH

Intracellular pH (pHi) is critical for cells, which can affect nutrient uptake, protein synthesis, glycolysis, and nucleic acid synthesis [18]. When pHi homeostasis is destroyed, the cell viability declines, and cell death can occur [19]. Therefore, pHi homeostasis is considered an important index to measure whether cells maintain a normal physiological state in an acidic environment [20]. In this part, the pHi of the three strains was measured in the fermentation (Figure 4). Although the environmental pH decreased from 6.8 to about 3.0 in the first 24 h (Figure 1a), the pHi of the three strains was still maintained at about 7.7. After 24 h, the pHi of the three strains began to decline, and the pHi of QLU58, AAE43, and AAE89 finally reached 6.14 ± 0.13, 6.55 ± 0.07, and 6.76 ± 0.09 at 48 h, respectively. Moreover, the mutants’ decline degree was significantly lower than that of the original strain. The results showed that the acid-resistant mutants have a stronger ability to stabilize pHi, which is more conducive to survival in an acidic environment.
Numerous metabolic perturbations concomitant with environmental acidification and the resulting disturbance to the pHi homeostasis can occur [21]. S. albulus QLU58 and its mutants have a certain ability to stabilize pHi, which is essential for cell survival under acid stress [18,20]. The consequences of autoacidification include an acidified pHi followed by damage to various macromolecules [22]. The stability of pHi causes the intracellular physiological metabolic activities to be normal, and the decrease in the pHi also indicates that metabolic disorders have occurred in the cells [23,24]. Therefore, it can be inferred that, before 24 h, the cells can normally resist environmental autoacidification, but after that, the acid-resistant response system within the cells begins to gradually collapse. This is consistent with the previous results.

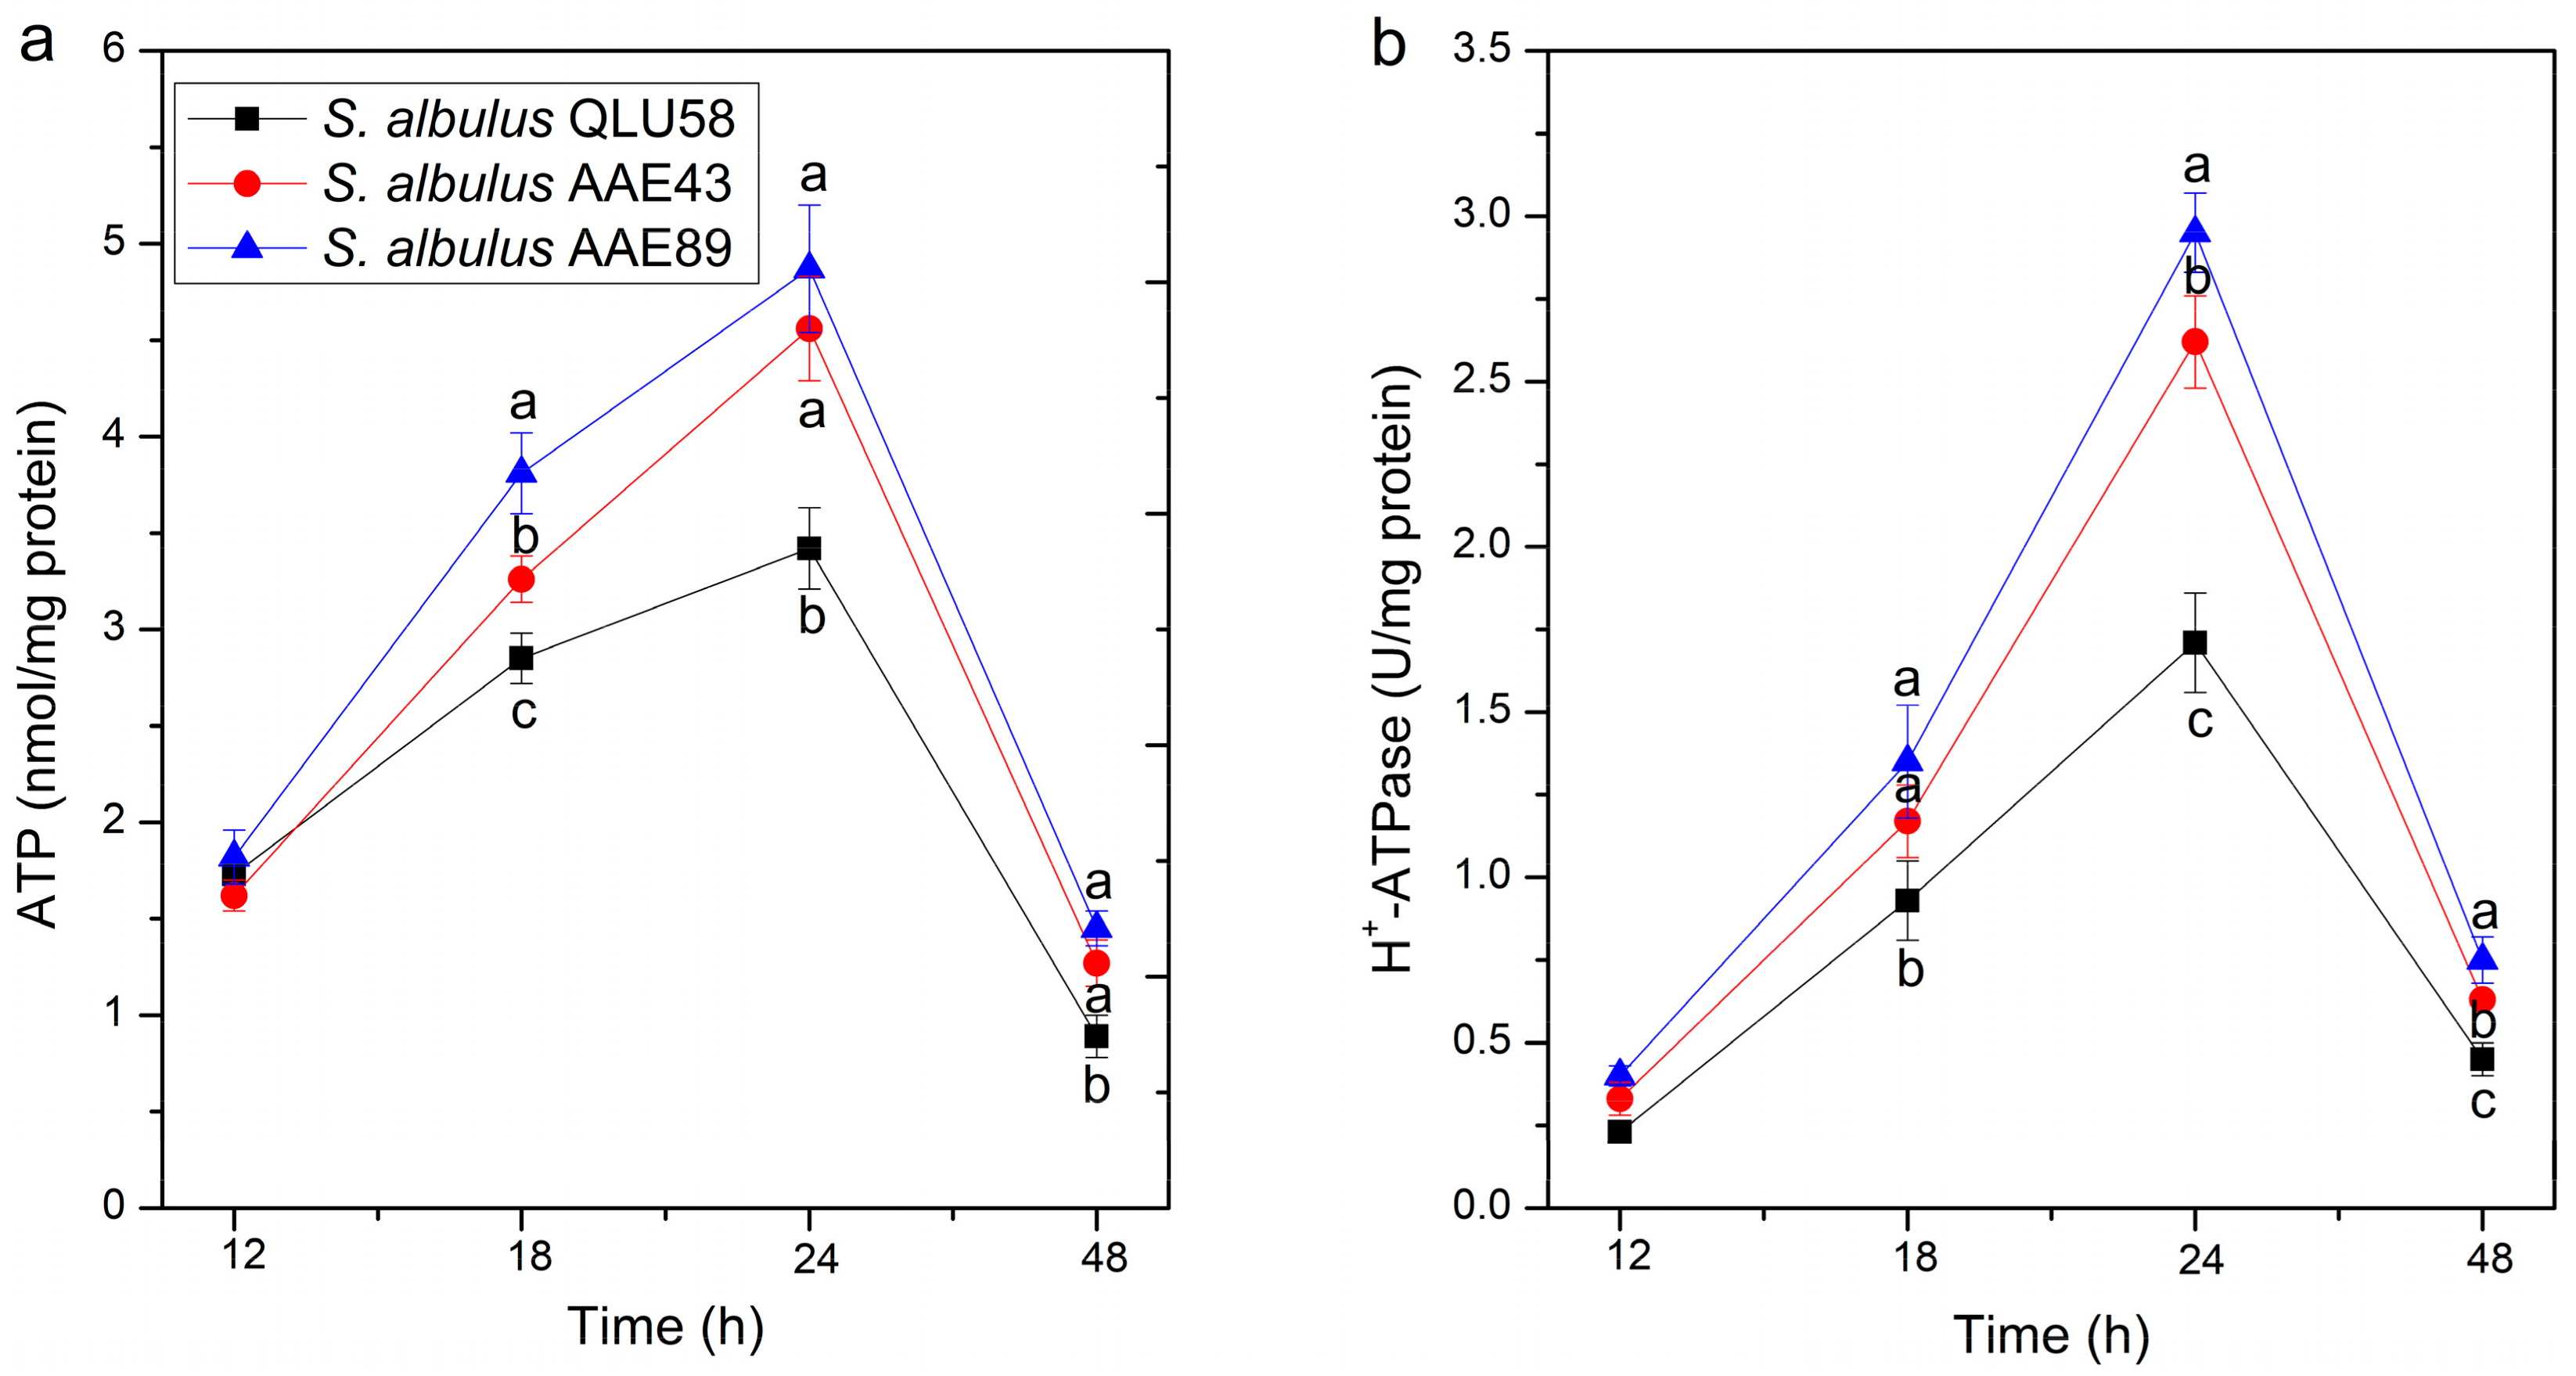
3.2.2. Intracellular ATP Concentration and H+-ATPase Activity

The intracellular ATP concentration and the H+-ATPase activity of S. albulus are very important for responding to autoacidification. The proton-translocation H+-ATPase can pump intracellular protons to extracellular by consuming ATP so that pHi can be regulated and maintain a steady state in the acidic environment [3]. As shown in Figure 5, the intracellular ATP contents and H+-ATPase activities of the three strains first increased and then decreased. During 12–24 h, the cell growth was decelerated by the rapid decline of the environmental pH (Figure 2a), which led to the reduced intracellular ATP consumption resulting in its accumulation in the cells [16]. Meanwhile, intracellular H+-ATPase’s activities were increased. Likewise, the H+-ATPase expression was up-regulated in response to acid stress caused by Lactococcus lactis MG1363 to maintain the dynamic balance of pHi [25]. Therefore, the cells maintained higher H+-ATPase activities and intracellular ATP concentrations so that the intracellular protons could be effectively pumped out of the cells to maintain the pHi stability. In addition, ATP can not only provide energy for H+-ATPase to pump H+ but can also participate in ε-PL biosynthesis. When the intracellular ATP accumulated to a certain threshold, the activity of ε-PL synthase (Pls) was activated [16]. Additionally, many ATP provided sufficient energy for ε-PL production, which was also consistent with the results of Figure 2b. After 24 h, the cell growth stopped due to the sustaining acid stress (about pH 3.0) (Figure 2a), and the ATP production was greatly diminished. Meanwhile, more ATP was used to combat the pHi crisis and ε-PL production proceeding, so the intracellular ATP pool was rapidly consumed. Similarly, the H+-ATPase activity of the three strains also began to decrease after 24 h, which was because of the energy supply lacking [26].
The ATP contents and H+-ATPase activities of the acid-tolerant mutants were observed to be higher than those of the original strain in the same fermentation period. Additionally, the change trends of the ATP contents and H+-ATPase activities of the three strains were also consistent with those of the pHi in Figure 4. In conclusion, the results showed that intracellular ATP concentrations and H+-ATPase activities are very important for maintaining the pHi.
In addition, the change processes of the intracellular ATP concentration and H+-ATPase activity of S. albulus QLU58 and its mutants are consistent, which indicates that the acid-tolerant mutant has the same acid-tolerant response in this respect, and that improving the acid tolerance will only reduce the damage caused by acid stress but not change the result of the damage.

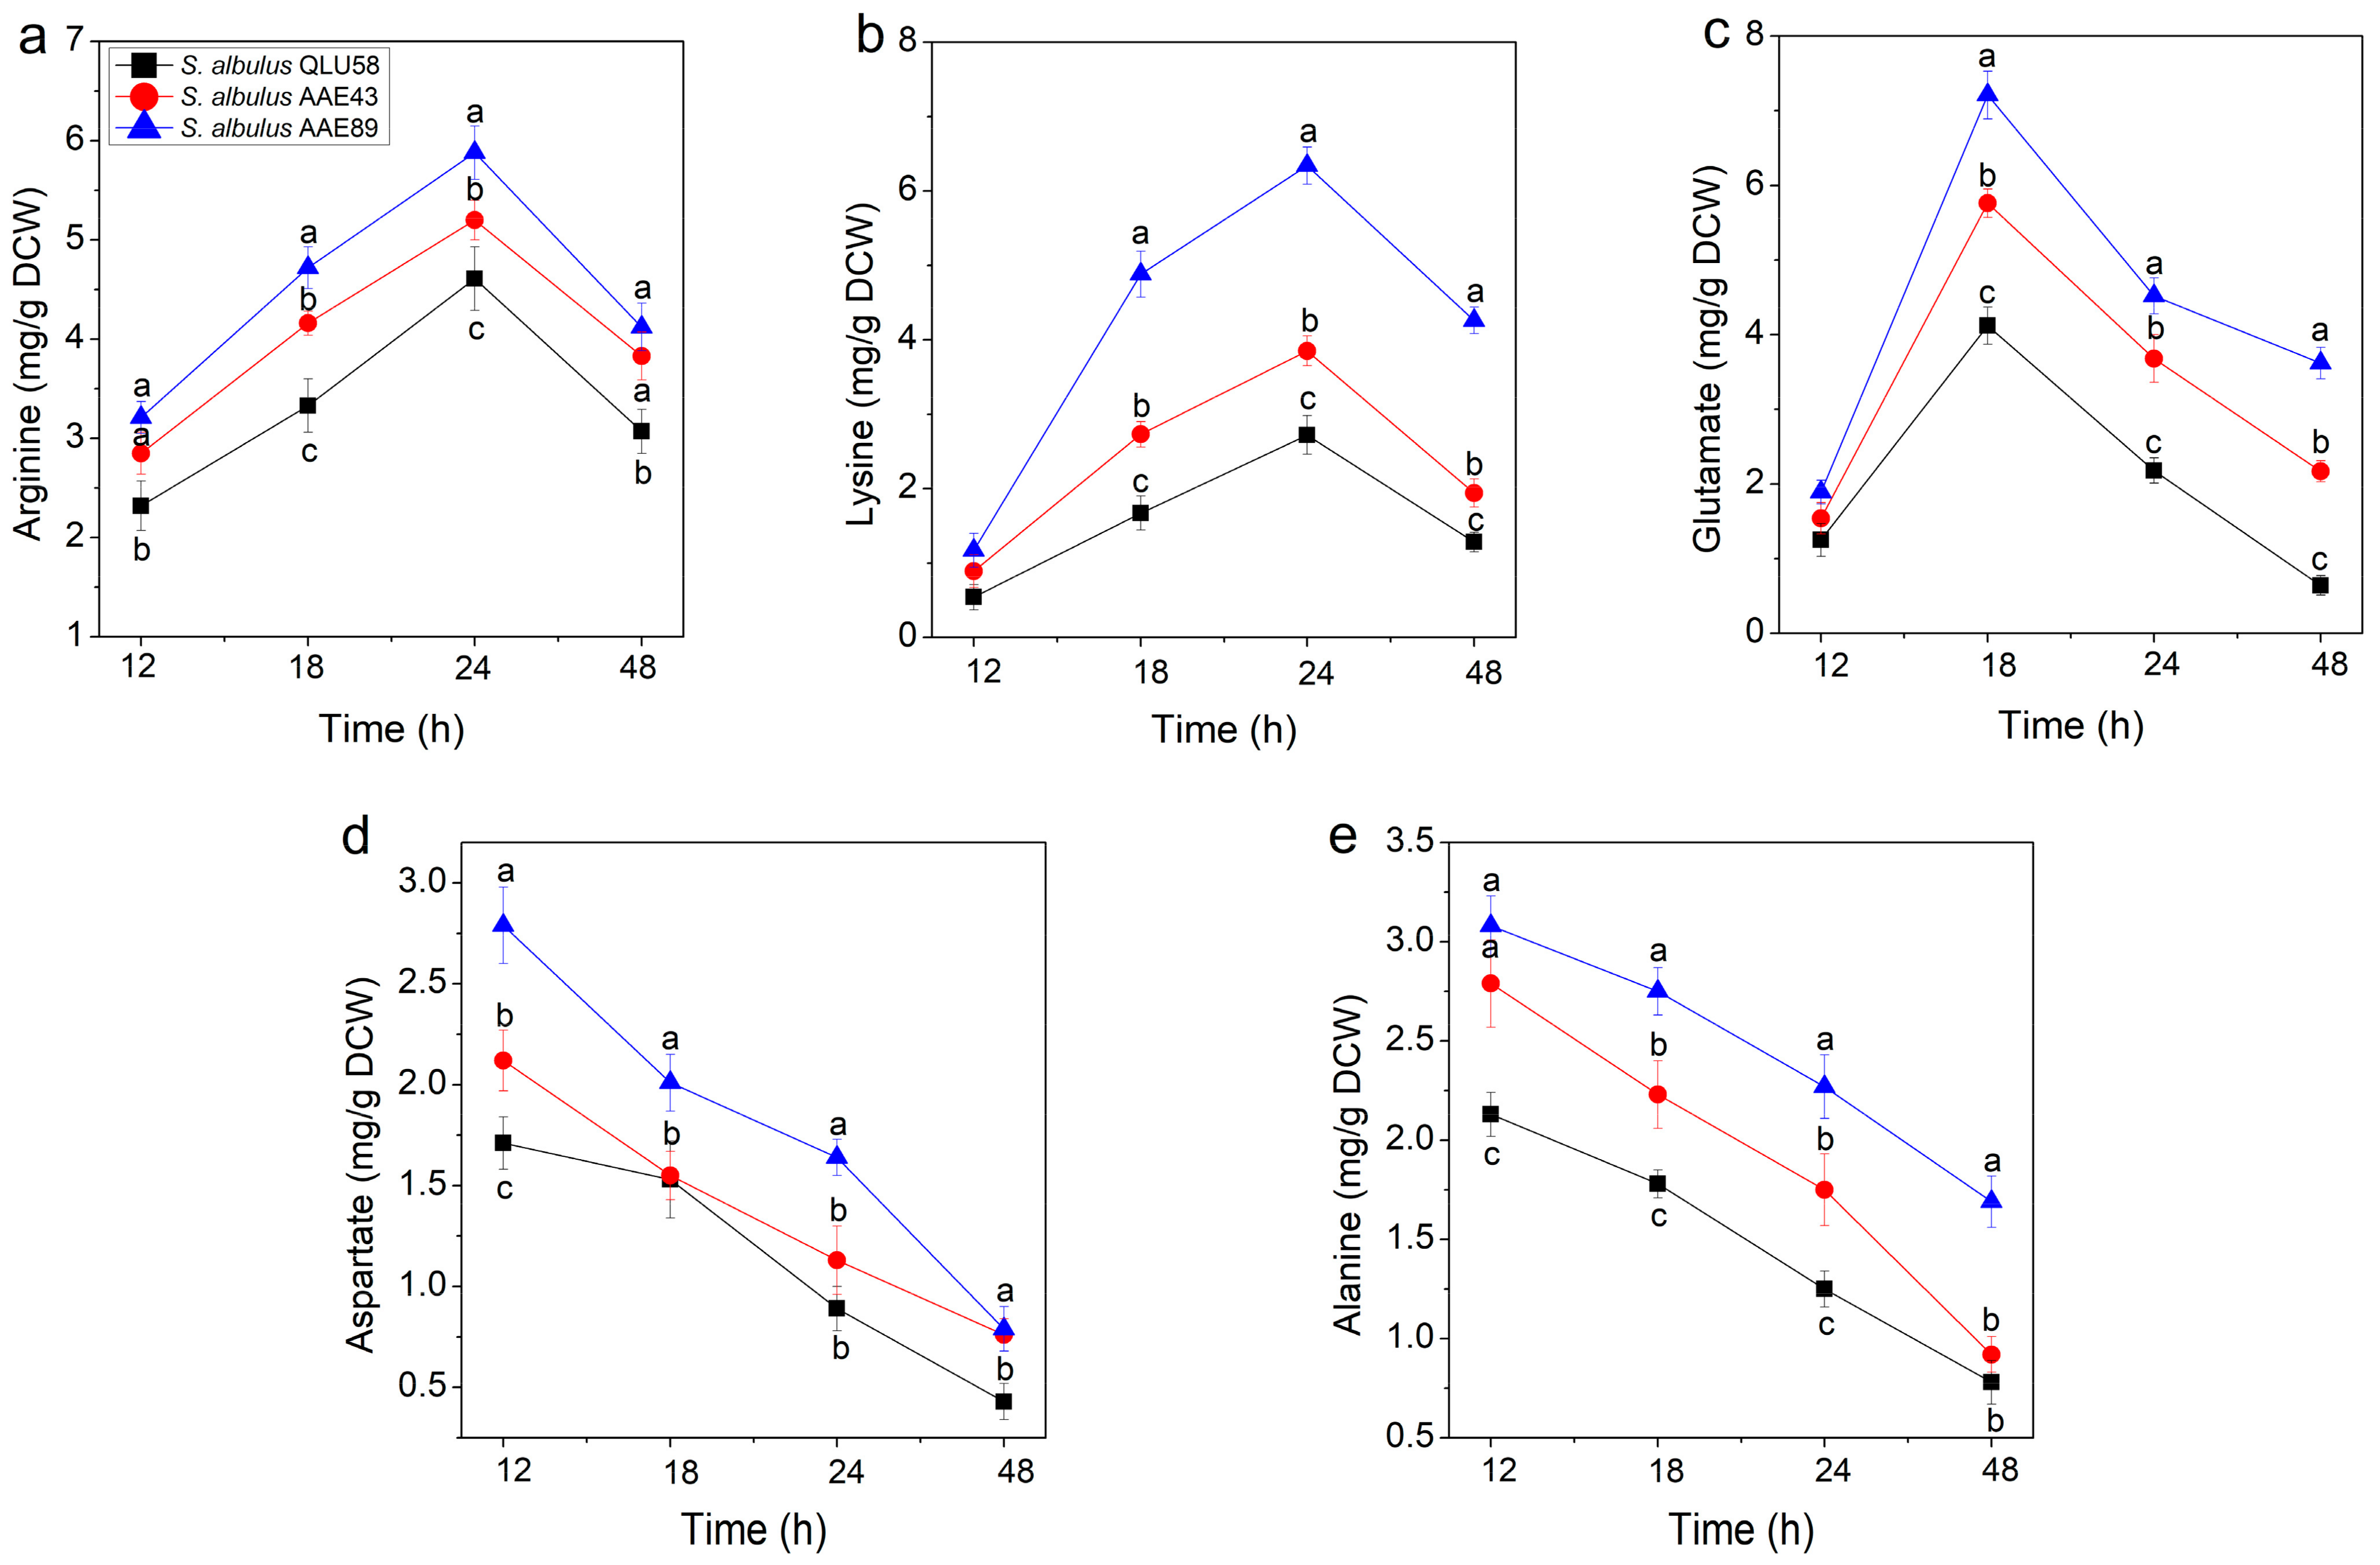
3.2.3. Intracellular Amino Acid Content

Intracellular amino acids are an important factor in protecting microbial cells against acid stress [27]. When microorganisms are surrounded by an acid environment, they can simultaneously consume intracellular H+ through amino acid metabolism and produce NH3 [15]. In previous studies, arginine, glutamate, lysine, aspartate, and alanine have been frequently mentioned to play positive roles in treating acidic environments [4,28], and variations in the contents of the five amino acids can partly reflect the response process of cells to the acidic environment.
Arginine is an alkaline amino acid that can be converted to ATP and NH3 by the arginine deaminase (ADI) system [23,29]. ATP could be used to pump out the intracellular proton, and NH3 could combine H+ to generate NH4+. In addition, some studies have shown that alkaline lysine can consume intracellular H+ by the action of lysine decarboxylase [30]. Therefore, the accumulation of intracellular arginine and lysine contents under acid stress was beneficial for stabilizing the pHi [30,31]. As shown in Figure 6a,b, the arginine and lysine contents of the three strains increased before 24 h and then began to decrease. This showed that the strains accumulate intracellular arginine and lysine to combat the decline in environmental pH at the initial stage of fermentation. After 24 h, cell growth ceased (Figure 2a), and the rate of intracellular arginine and lysine production was slower than that of the consumption, so the arginine and lysine contents began to decrease. The changes in pHi also proved that the intracellular arginine and lysine contents were closely related to autoacidification’s resistance in S. albulus (Figure 4).
Figure 6c shows that the intracellular glutamate contents of the three stains increased to the maximum at 18 h and then were rapidly consumed because of the aggravation caused by the acid stress. When faced with acid stress, extracellular glutamate is transported into the intracellular cytoplasm, and converted to γ-aminobutyrate (GABA) and CO2 by glutamate decarboxylase (GAD), which is accompanied by intracellular proton consumption. Consequently, the intracellular acidification slows down [24,32]. Moreover, less acidic GABA is released extracellularly by the antiporters, which can contribute to environmental alkalinization [33]. The GAD system has been found to play an important role in pHi homeostasis in many different bacteria [3,30].
As shown in Figure 6d,e, intracellular aspartate and alanine were gradually consumed during autoacidification. Aspartate can be converted to arginine accompanied by the formation of NH3 [22,23,34]. Moreover, aspartate can form alanine by consuming intracellular H+ [18]. Alanine has been reported to resist adverse environmental factors by participating in synthesizing peptidoglycan and phosphoteichoic acid on the bacterial cell wall [35]. Likewise, Boyd et al., found that the loss of alanine leads to an increase in the acid sensitivity of Streptococcus [36]. Therefore, the consumption of intracellular aspartate and alanine can help cells to cope with extracellular acid stress.
Compared with the original strain QLU58, the mutants AAE43 and AAE89 had higher contents of the five amino acids. In addition, lysine, glutamate, and aspartate were precursors for the biosynthesis of ε-PL [37,38]. The acid tolerance and ε-PL production of the acid-tolerant mutants are indicated to be better than those of the original strain.
Regulating intracellular amino acid synthesis and metabolism is a proven important means for bacteria to resist acid stress, as it can effectively aid their survival in acidic environments [25,30,32]. Previous studies on the resistance of S. albulus to acid stress through intracellular amino acid levels mainly focused on the analysis of amino acid production under a certain pH but did not explore amino acid content changes in the whole process [4]. From our analysis of the changes in the above five amino acids, the synthesis and metabolism level changes in intracellular acid-resistant amino acids were consistent with the changes in the pHi, which indicated that these amino acids were obviously regulated by the pHi. Furthermore, the content of amino acids in acid-tolerant mutants is higher, which also indicates that these amino acids play a certain role in resistance to autoacidification.

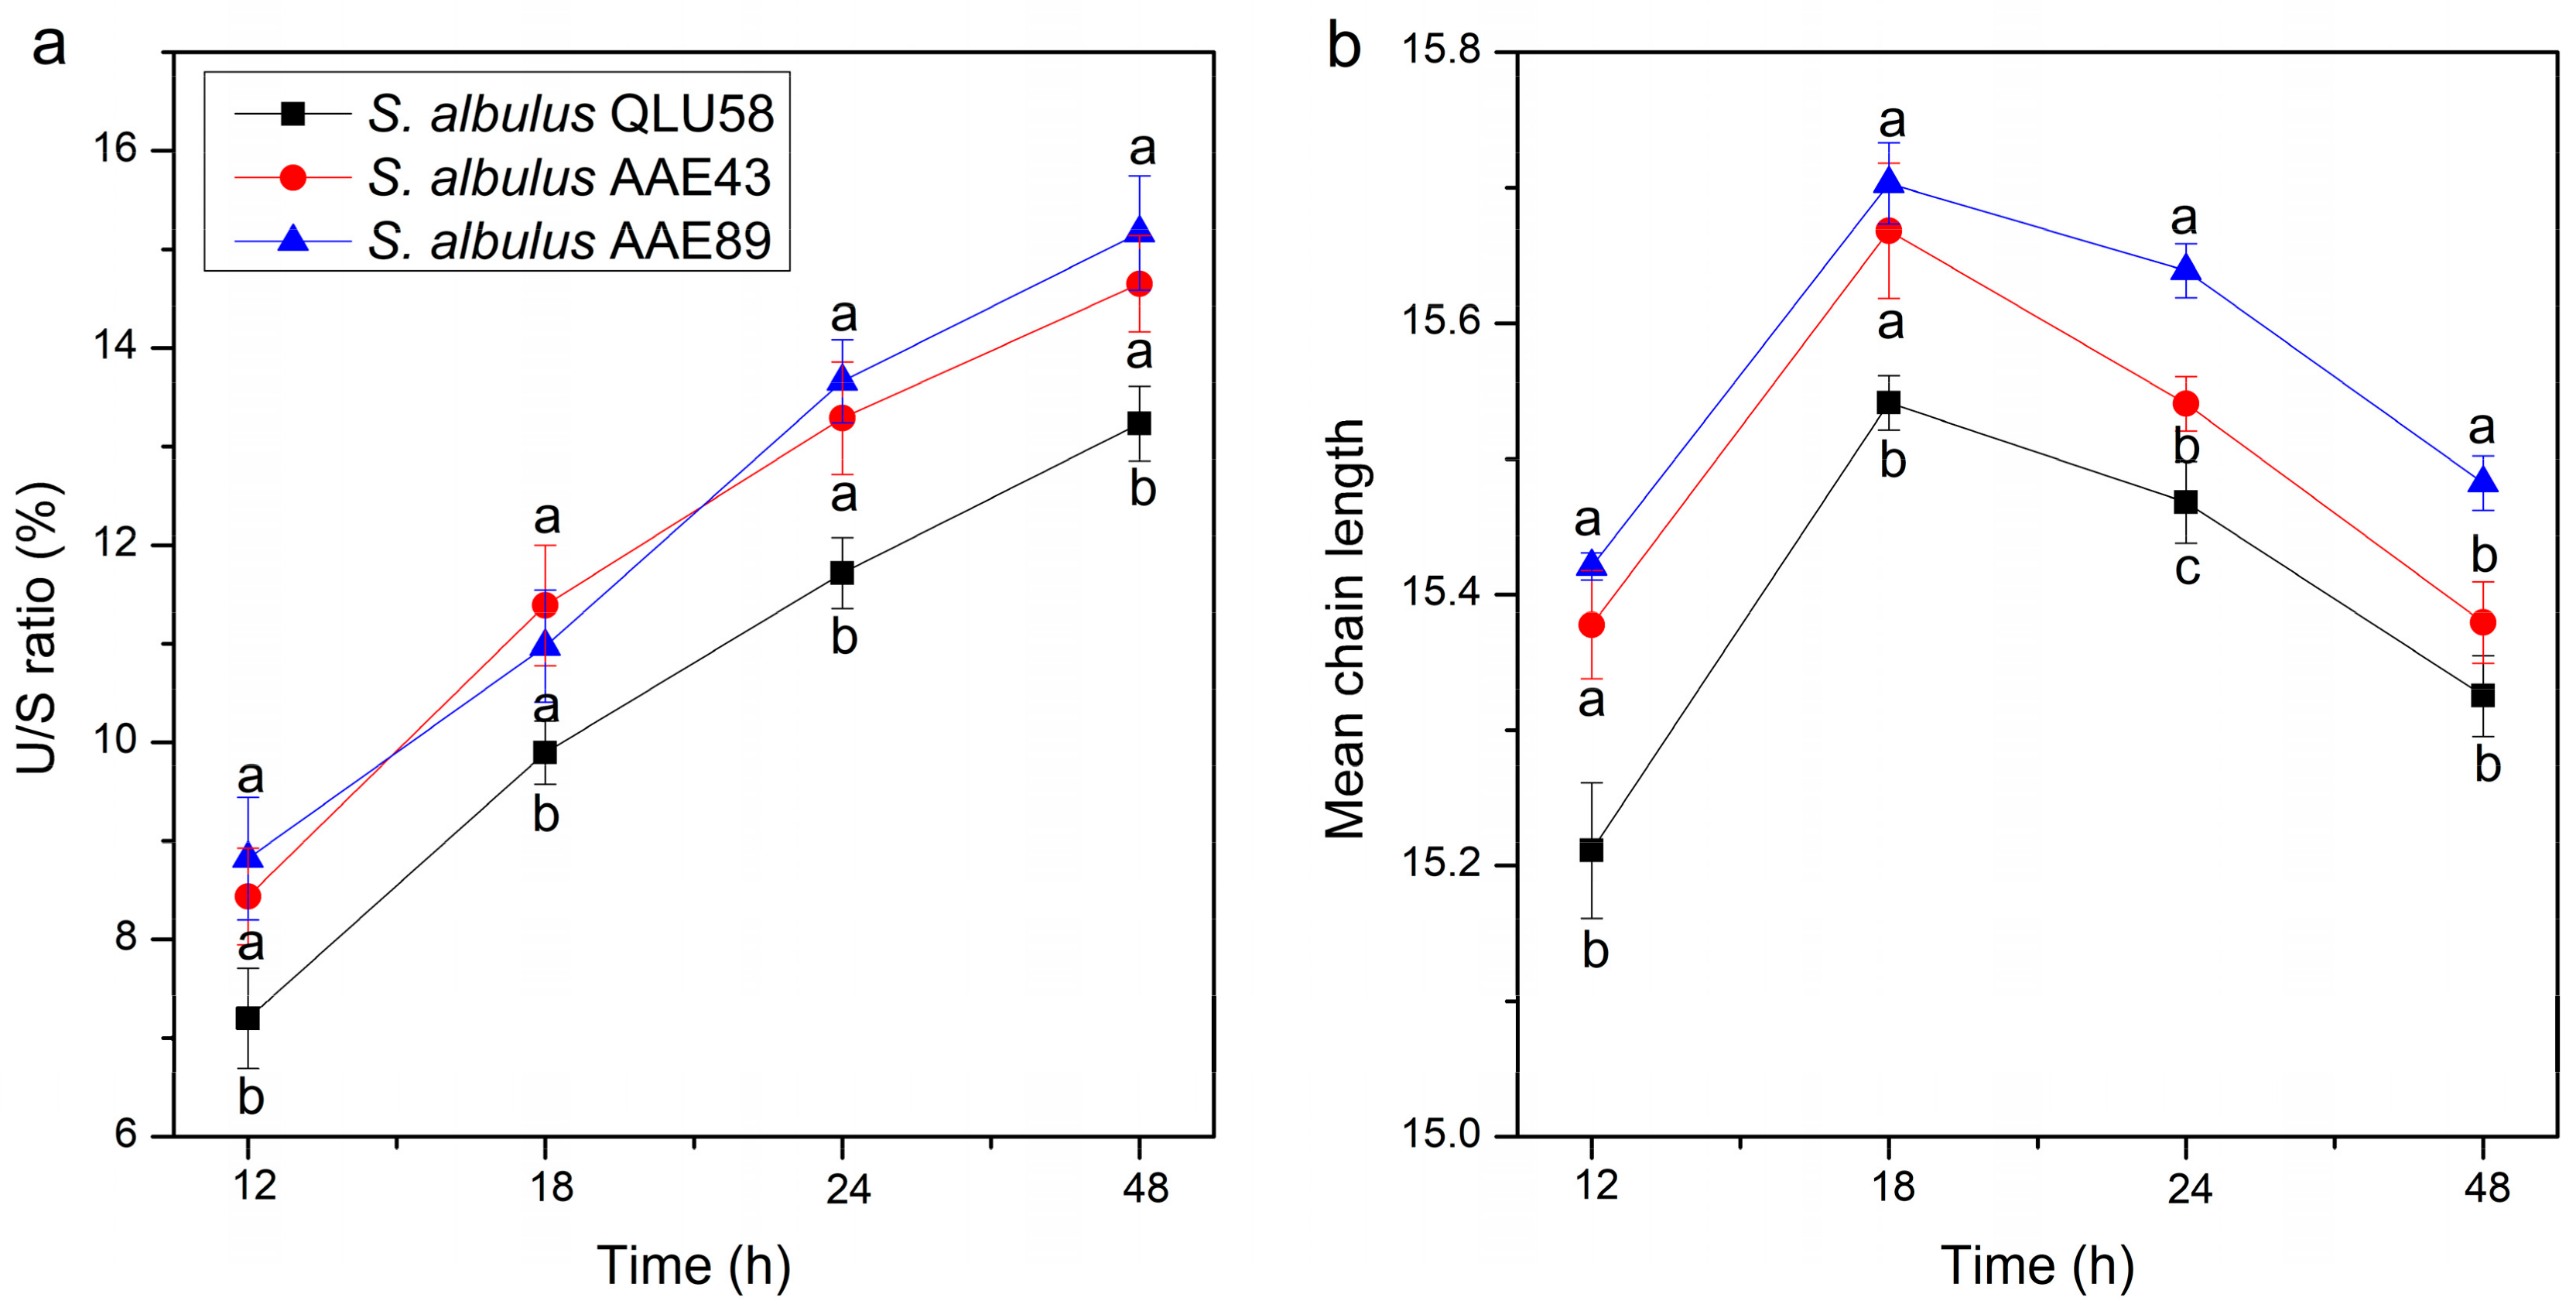
3.3. Changes in Cell Membrane Fatty Acids

The cell membrane is an essential defensive barrier against various environmental stresses [39]. The unsaturated and saturated fatty acid ratio (U/S ratio) and the chain length of membrane fatty acids, which affect the cell membrane’s fluidity and stability, were regulated to improve survival in acidic environments [40]. To explore the dynamic responses of the cell membrane during autoacidification, the alteration of the fatty acid composition was studied (Table S2).
The U/S ratio of the cell membrane gradually increased with the environment’s acidification (Figure 7a). An increased proportion of unsaturated fatty acids can improve the cell membrane’s fluidity, which is beneficial for combating acid stress [21,41,42,43,44]. A previous study showed that higher content of unsaturated fatty acids can enhance phospholipids’ elasticity and facilitate substances transport [45]. Long-chain fatty acids more easily span the membrane bilayer and form hydrophobic interactions with other lipids and proteins, thus resulting in the cell membrane having a more compact and stable structure [46]. Short-chain fatty acids can increase the cell membrane’s fluidity, which is beneficial for substance transport and energy metabolism [47]. However, the shorter chain length of fatty acids would reduce the cell membrane’s stability, meaning cell death would occur more easily in an extreme environment [4]. As shown in Figure 7b, the mean chain length of fatty acid increased from 12 to 18 h and then continuously decreased. It is indicated that the mean chain length of the fatty acids increased in the primary stage of autoacidification to enhance the cell membrane’s stability. As the degree of acid stress deepened in the late stage of autoacidification (after 18 h), the mean chain length of the fatty acids decreased to enhance the cell membrane’s fluidity and facilitate proton transport. However, the decrease in the fatty acid chain length would reduce the cell membrane’s stability, meaning cell death would occur more easily at this stage (Figure 2a).
Regulating the membrane fatty acid composition and chain length is an important adaptation mechanism for bacterial pathogens to survive under environmental stresses such as acid adaptation, ethanol shock, and osmotic stress [6,40,44]. From the above results, the acid-resistant response mechanism of cell membranes is shown to be up-regulated, and the decrease in the pHi to not significantly inhibit this mechanism. In addition, previous studies on cell membrane fatty acids’ chain lengths are limited to the fatty acid chain length’s final change [4,46]. However, we found that the cell membrane function is different under different pHi states, so the fatty acid chain length varies with the pHi. Furthermore, in the same fermentation period, the U/S ratio and mean chain length of the mutants were always higher than those of the original strain. This indicated that the mutants’ cell membranes were better able to withstand acid stress.

3.4. Comparisons of the Transcriptional Level of Key Genes between Original and Mutational Strains during Autoacidification

To further disclose the transcription differences in genes related to acid resistance and ε-PL production, the qRT-PCR analysis of four genes (atpB, gadA, arcA, and pls) were compared between the original strain QLU58 and the acid-tolerant mutant AAE89 at 48 h.
The atpB, gadA, arcA, and pls encode the subunit B of F1F0 ATP synthase, glutamate decarboxylase, arginine deaminase, and Pls, respectively. As shown in Figure 8, as compared with QLU58, the transcription levels of atpB, gadA, arcA, and pls in AAE89 were up-regulated by 4.64 ± 1.01, 2.65 ± 0.79, 5.29 ± 1.24, and 7.86 ± 0.37 folds, respectively. The up-regulation of the gene transcription levels indicated that the ATP generation, GAD, ADI, and ε-PL synthesis pathways in the mutants were remarkably strengthened, which was in accordance with the physiological performance.

4. Conclusions

Based on the above results, the dynamic responses of S. albulus QLU58 and its acid-tolerant mutants to autoacidification were preliminarily proposed. In the process of autoacidification, the metabolic activities of the strains were inhibited step by step. In the initial stage of autoacidification (before 24 h), the strains employed a series of stress responses to resist this negative effect. The cell membrane’s stability was enhanced, thus maintaining its normal physiological function. The pHi maintained homeostasis and maintained the normal physiological activities of S. albulus. In the post-autoacidification stage (after 24 h), the acid stress was severe (environmental pH ~3.0). The cell membrane’s fluidity was further enhanced to retain its function. Instead, the cell membrane’s stability was reduced. Concomitantly, the intracellular ATP and amino acids were rapidly consumed to alleviate the pHi crisis. Nevertheless, it was becoming increasingly difficult for cells to resist acid stress, the pHi began to decrease, and the cell death surpassed the growth. In addition, the acid-tolerant mutants exhibited better performances during autoacidification, which also confirmed that pHi maintenance and changes in the membrane fatty acid composition were effective approaches for S. albulus to combat acid stress. Analyzing the dynamic responses of S. albulus to acid stress in relation to original and acid-tolerant strains is novel and may provide new strategies to enhance ε-PL production.

Supplementary Materials

The following supporting information can be downloaded at: https://www.mdpi.com/article/10.3390/fermentation9050459/s1, Table S1: Sequences of primer used in qRT-PCR assay, Table S2: Changes in intracellular fatty acid composition in the batch fermentation for ε-PL production by S. albulus.

Author Contributions

Conceptualization, X.R. and C.W.; Methodology, X.R. and Y.C.; Software, X.R.; Validation, Y.G. and K.L.; Formal Analysis, X.R. and Y.C.; Investigation, X.R., Y.C., Y.G. and K.L.; Resources, X.L.; Data Curation, X.L. and C.W.; Writing—Original Draft Preparation, Y.C.; Writing—Review and Editing, X.R. and C.W.; Visualization, X.R. and Y.C.; Supervision, X.L. and C.W.; Project Administration, X.L. and C.W.; Funding Acquisition, X.R. and C.W. X.R. and Y.C. contributed equally to this work. All authors have read and agreed to the published version of the manuscript.

Funding

This research was funded by the National Natural Science Foundation of China (32201970); Shandong Provincial Natural Science Foundation, China (ZR2020QC221); Shandong Provincial Key Research and Development Program (Major Scientific and Technological Innovation Project), China (2020CXGC010604); Innovation Fund for Industry-University-Research Collaboration of Qilu University of Technology, Shandong Academy of Sciences-Weihai City (2021CXY-03); and the State Key Laboratory of Biobased Material and Green Papermaking, Qilu University of Technology, Shandong Academy of Sciences (ZZ20210106).

Institutional Review Board Statement

Not applicable.

Informed Consent Statement

Not applicable.

Data Availability Statement

Not applicable.

Conflicts of Interest

The authors declare no conflict of interest.

References

  1. Xu, Z.; Xu, Z.; Feng, X.; Xu, D.; Liang, J.; Xu, H. Recent advances in the biotechnological production of microbial poly (ɛ-L-lysine) and understanding of its biosynthetic mechanism. Appl. Microbiol. Biotechnol. 2016, 100, 6619–6630. [Google Scholar] [CrossRef] [PubMed]
  2. Ren, X.D.; Chen, X.S.; Zeng, X.; Wang, L.; Tang, L.; Mao, Z.G. Acidic pH shock induced overproduction of ε-poly-l-lysine in fed-batch fermentation by Streptomyces sp. M-Z18 from agro-industrial by-products. Bioprocess Biosyst. Eng. 2015, 38, 1113–1125. [Google Scholar] [CrossRef] [PubMed]
  3. Lund, P.; Tramonti, A.; De Biase, D. Coping with low pH: Molecular strategies in neutralophilic bacteria. FEMS Microbiol. Rev. 2014, 38, 1091–1125. [Google Scholar] [CrossRef] [PubMed]
  4. Wang, C.; Ren, X.; Yu, C.; Wang, J.; Wang, L.; Zhuge, X.; Liu, X. Physiological and Transcriptional Responses of Streptomyces albulus to Acid Stress in the Biosynthesis of ε-Poly-l-lysine. Front. Microbiol. 2020, 11, 1379. [Google Scholar] [CrossRef]
  5. Wu, C.; Zhang, J.; Chen, W.; Wang, M.; Du, G.; Chen, J. A combined physiological and proteomic approach to reveal lactic-acid-induced alterations in Lactobacillus casei Zhang and its mutant with enhanced lactic acid tolerance. Appl. Microbiol. Biotechnol. 2012, 93, 707–722. [Google Scholar] [CrossRef]
  6. He, S.K.; Ye, B.N.; Zhang, Z.F.; Cui, Y.; Wang, S.Y.; Shi, X.M. Cross-protective effect of acid adaptation on ethanol tolerance in Salmonella enteritidis. Food Sci. Hum. Wellness 2023, 12, 1402–1407. [Google Scholar] [CrossRef]
  7. Itzhaki, R.F. Colorimetric method for estimating polylysine and polyarginine. Anal. Biochem. 1972, 50, 569–574. [Google Scholar] [CrossRef]
  8. Winding, A.; Binnerup, S.J.; Sørensen, J. Viability of indigenous soil bacteria assayed by respiratory activity and growth. Appl. Environ. Microbiol. 1994, 60, 2869–2875. [Google Scholar] [CrossRef]
  9. Breeuwer, P.; Drocourt, J.l.; Rombouts, F.M.; Abee, T. A novel method for continuous determination of the intracellular pH in bacteria with the internally conjugated fluorescent probe 5 (and 6-)-carboxyfluorescein succinimidyl ester. Appl. Environ. Microbiol. 1996, 62, 178–183. [Google Scholar] [CrossRef]
  10. Cichna, M.; Raab, M.; Daxecker, H.; Griesmacher, A.; Müller, M.; Markl, P. Determination of fifteen nucleotides in cultured human mononuclear blood and umbilical vein endothelial cells by solvent generated ion-pair chromatography. J. Chromatogr. B 2003, 787, 381–391. [Google Scholar] [CrossRef]
  11. Fountoulakis, M.; Lahm, H.W. Hydrolysis and amino acid composition analysis of proteins. J. Chromatogr. A 1998, 826, 109–134. [Google Scholar] [CrossRef] [PubMed]
  12. Sasser, M. Identification of bacteria by gas chromatography of cellular fatty acids. In MIDI Technical Note 101; MIDI, Inc.: Newark, NJ, USA, 1990; pp. 1–7. [Google Scholar]
  13. Chen, X.S.; Wang, K.F.; Zheng, G.C.; Gao, Y.; Mao, Z.G. Preparation, characterization and antimicrobial activity of ε-poly-l-lysine with short chain length produced from glycerol by Streptomyces albulus. Process Biochem. 2018, 68, 22–29. [Google Scholar] [CrossRef]
  14. Kahar, P.; Iwata, T.; Hiraki, J.; Park, E.Y.; Okabe, M. Enhancement of ε-polylysine production by Streptomyces albulus strain 410 using pH control. J. Biosci. Bioeng. 2001, 91, 190–194. [Google Scholar] [CrossRef]
  15. Chen, X.S.; Li, S.; Liao, L.J.; Ren, X.D.; Li, F.; Tang, L.; Zhang, J.H.; Mao, Z.G. Production of ε-poly-l-lysine using a novel two-stage pH control strategy by Streptomyces sp. M-Z18 from glycerol. Bioprocess Biosyst. Eng. 2011, 34, 561–567. [Google Scholar] [CrossRef]
  16. Yamanaka, K.; Kito, N.; Imokawa, Y.; Maruyama, C.; Utagawa, T.; Hamano, Y. Mechanism of ε-poly-l-lysine production and accumulation revealed by identification and analysis of an ε-poly-l-lysine-degrading enzyme. Appl. Environ. Microbiol. 2010, 76, 5669–5675. [Google Scholar] [CrossRef] [PubMed]
  17. Jiang, J.; Sun, Y.F.; Tang, X.; He, C.N.; Shao, Y.L.; Tang, Y.J.; Zhou, W.W. Alkaline pH shock enhanced production of validamycin A in fermentation of Streptomyces hygroscopicus. Bioresour. Technol. 2018, 249, 234–240. [Google Scholar] [CrossRef]
  18. Guan, N.; Liu, L.; Shin, H.-d.; Chen, R.R.; Zhang, J.; Li, J.; Du, G.; Shi, Z.; Chen, J. Systems-level understanding of how Propionibacterium acidipropionici respond to propionic acid stress at the microenvironment levels: Mechanism and application. J. Biotechnol. 2013, 167, 56–63. [Google Scholar] [CrossRef] [PubMed]
  19. Cagnac, O.; Leterrier, M.; Yeager, M.; Blumwald, E. Identification and characterization of Vnx1p, a novel type of vacuolar monovalent cation/H+ antiporter of Saccharomyces cerevisiae. J. Biol. Chem. 2007, 282, 24284–24293. [Google Scholar] [CrossRef]
  20. Baker Austin, C.; Dopson, M. Life in acid: pH homeostasis in acidophiles. Trends Microbiol. 2007, 15, 165–171. [Google Scholar] [CrossRef]
  21. Xu, Y.; Zhao, Z.; Tong, W.; Ding, Y.; Liu, B.; Shi, Y.; Wang, J.; Sun, S.; Liu, M.; Wang, Y. An acid-tolerance response system protecting exponentially growing Escherichia coli. Nat. Commun. 2020, 11, 1496. [Google Scholar] [CrossRef]
  22. Wu, C.; Zhang, J.; Du, G.; Chen, J. Aspartate protects Lactobacillus casei against acid stress. Appl. Microbiol. Biotechnol. 2013, 97, 4083–4093. [Google Scholar] [CrossRef] [PubMed]
  23. Zhang, J.; Wu, C.; Du, G.; Chen, J. Enhanced acid tolerance in Lactobacillus casei by adaptive evolution and compared stress response during acid stress. Biotechnol. Bioprocess Eng. 2012, 17, 283–289. [Google Scholar] [CrossRef]
  24. Eun Rhee, J.; Haeng Rhee, J.; Youl Ryu, P.; Ho Choi, S. Identification of the cadBA operon from Vibrio vulnificus and its influence on survival to acid stress. FEMS Microbiol. Lett. 2002, 208, 245–251. [Google Scholar] [CrossRef] [PubMed]
  25. Budin Verneuil, A.; Pichereau, V.; Auffray, Y.; Ehrlich, D.S.; Maguin, E. Proteomic characterization of the acid tolerance response in Lactococcus lactis MG1363. Proteomics 2005, 5, 4794–4807. [Google Scholar] [CrossRef] [PubMed]
  26. Yin, Z.; Feng, S.; Tong, Y.; Yang, H. Adaptive mechanism of Acidithiobacillus thiooxidans CCTCC M 2012104 under stress during bioleaching of low-grade chalcopyrite based on physiological and comparative transcriptomic analysis. J. Ind. Microbiol. Biot. 2019, 46, 1643–1656. [Google Scholar] [CrossRef]
  27. Fernández, M.; Zúñiga, M. Amino acid catabolic pathways of lactic acid bacteria. Crit. Rev. Microbiol. 2006, 32, 155–183. [Google Scholar] [CrossRef] [PubMed]
  28. Diez Gonzalez, F.; Karaibrahimoglu, Y. Comparison of the glutamate-, arginine- and lysine- dependent acid resistance systems in Escherichia coli O157: H7. J. Appl. Microbiol. 2004, 96, 1237–1244. [Google Scholar] [CrossRef] [PubMed]
  29. Iyer, R.; Williams, C.; Miller, C. Arginine-agmatine antiporter in extreme acid resistance in Escherichia coli. J. Bacteriol. 2003, 185, 6556–6561. [Google Scholar] [CrossRef]
  30. Senouci Rezkallah, K.; Schmitt, P.; Jobin, M.P. Amino acids improve acid tolerance and internal pH maintenance in Bacillus cereus ATCC14579 strain. Food Microbiol. 2011, 28, 364–372. [Google Scholar] [CrossRef]
  31. Wu, H.; Zhao, Y.; Du, Y.; Miao, S.; Liu, J.; Li, Y.; Caiyin, Q.; Qiao, J. Quantitative proteomics of Lactococcus lactis F44 under cross-stress of low pH and lactate. J. Dairy Sci. 2018, 101, 6872–6884. [Google Scholar] [CrossRef]
  32. Higuchi, T.; Hayashi, H.; Abe, K. Exchange of glutamate and gamma-aminobutyrate in a Lactobacillus strain. J. Bacteriol. 1997, 179, 3362–3364. [Google Scholar] [CrossRef] [PubMed]
  33. De Biase, D.; Pennacchietti, E. Glutamate decarboxylase-dependent acid resistance in orally acquired bacteria: Function, distribution and biomedical implications of the gadBC operon. Mol. Microbiol. 2012, 86, 770–786. [Google Scholar] [CrossRef] [PubMed]
  34. Hu, Y.; Lu, P.; Zhang, Y.; Li, L.; Chen, S. Characterization of an aspartate-dependent acid survival system in Yersinia pseudotuberculosis. FEBS Lett. 2010, 584, 2311–2314. [Google Scholar] [CrossRef] [PubMed]
  35. Typas, A.; Banzhaf, M.; Gross, C.A.; Vollmer, W. From the regulation of peptidoglycan synthesis to bacterial growth and morphology. Nat. Rev. Microbiol. 2012, 10, 123–136. [Google Scholar] [CrossRef] [PubMed]
  36. Boyd, D.A.; Cvitkovitch, D.G.; Bleiweis, A.S.; Kiriukhin, M.Y.; Debabov, D.V.; Neuhaus, F.C.; Hamilton, I.R. Defects in D-alanyl-lipoteichoic acid synthesis in Streptococcus mutans results in acid sensitivity. J. Bacteriol. 2000, 182, 6055–6065. [Google Scholar] [CrossRef] [PubMed]
  37. Takehara, M.; Hibino, A.; Saimura, M.; Hirohara, H. High-yield production of short chain length poly (ε-L-lysine) consisting of 5-20 residues by Streptomyces aureofaciens, and its antimicrobial activity. Biotechnol. Lett. 2010, 32, 1299–1303. [Google Scholar] [CrossRef]
  38. Yamanaka, K.; Maruyama, C.; Takagi, H.; Hamano, Y. ε-Poly-l-lysine dispersity is controlled by a highly unusual nonribosomal peptide synthetase. Nat. Chem. Biol. 2008, 4, 766–772. [Google Scholar] [CrossRef]
  39. Tran, N.T.; Huang, X.; Hong, H.J.; Bush, M.J.; Chandra, G.; Pinto, D.; Bibb, M.J.; Hutchings, M.I.; Mascher, T.; Buttner, M.J. Defining the regulon of genes controlled by σE, a key regulator of the cell envelope stress response in Streptomyces coelicolor. Mol. Microbiol. 2019, 112, 461–481. [Google Scholar] [CrossRef]
  40. Giotis, E.S.; McDowell, D.A.; Blair, I.S.; Wilkinson, B.J. Role of branched-chain fatty acids in pH stress tolerance in Listeria monocytogenes. Appl. Environ. Microbiol. 2007, 73, 997–1001. [Google Scholar] [CrossRef]
  41. Denich, T.; Beaudette, L.; Lee, H.; Trevors, J. Effect of selected environmental and physico-chemical factors on bacterial cytoplasmic membranes. J. Microbiol. Methods 2003, 52, 149–182. [Google Scholar] [CrossRef]
  42. Fozo, E.M.; Quivey, R.G., Jr. The fabM gene product of Streptococcus mutans is responsible for the synthesis of monounsaturated fatty acids and is necessary for survival at low pH. J. Bacteriol. 2004, 186, 4152–4158. [Google Scholar] [CrossRef] [PubMed]
  43. Liao, G.; Liu, Q.; Xie, J. Transcriptional analysis of the effect of exogenous decanoic acid stress on Streptomyces roseosporus. Microb. Cell Fact. 2013, 12, 19. [Google Scholar] [CrossRef] [PubMed]
  44. Wu, C.; Zhang, J.; Wang, M.; Du, G.; Chen, J. Lactobacillus casei combats acid stress by maintaining cell membrane functionality. J. Ind. Microbiol. Biot. 2012, 39, 1031–1039. [Google Scholar] [CrossRef] [PubMed]
  45. Kolbeck, S.; Behr, J.; Vogel, R.F.; Ludwig, C.; Ehrmann, M.A. Acid stress response of Staphylococcus xylosus elicits changes in the proteome and cellular membrane. J. Appl. Microbiol. 2019, 126, 1480–1495. [Google Scholar] [CrossRef]
  46. Mykytczuk, N.; Trevors, J.; Leduc, L.; Ferroni, G. Fluorescence polarization in studies of bacterial cytoplasmic membrane fluidity under environmental stress. Prog. Biophys. Mol. Bio. 2007, 95, 60–82. [Google Scholar] [CrossRef]
  47. Cao Hoang, L.; Marechal, P.A.; Lê Thanh, M.; Gervais, P.; Waché, Y. Fluorescent probes to evaluate the physiological state and activity of microbial biocatalysts: A guide for prokaryotic and eukaryotic investigation. Biotechnol. J. 2008, 3, 890–903. [Google Scholar] [CrossRef]
Figure 1. Time profiles of pH (a), DCW (b), ε-PL production (c), and residual glucose (d) in batch fermentations for ε-PL production by the original and evolutional strains. Error bars indicate standard deviations (n = 3). Statistical significance is denoted by different letters above or below bars at each time point (p ≤ 0.05).
Fermentation 09 00459 g001
Figure 2. Changes in the specific cell growth rate (a) and the specific ε-PL formation rate (b) in batch fermentations by the original and evolutional strains.
Fermentation 09 00459 g002
Figure 3. Changes in relative respiratory activities in batch fermentations by original and evolutional strains. Error bars indicate standard deviations (n = 3). Statistical significance is denoted by different letters above or below bars at each time point (p ≤ 0.05).
Fermentation 09 00459 g003
Figure 4. Changes in the pHi in batch fermentations by the original and evolutional strains. Error bars indicate standard deviations (n = 3). Statistical significance is denoted by different letters above or below bars at each time point (p ≤ 0.05).
Fermentation 09 00459 g004
Figure 5. Changes in intracellular ATP concentration (a) and H+-ATPase activity (b) in batch fermentations by the original and evolutional strains. Error bars indicate standard deviations (n = 3). Statistical significance is denoted by different letters above or below bars at each time point (p ≤ 0.05).
Fermentation 09 00459 g005
Figure 6. Changes in arginine (a), lysine (b), glutamate (c), aspartate (d), and alanine (e) in batch fermentations by the original and evolutional strains. Error bars indicate standard deviations (n = 3). Statistical significance is denoted by different letters above or below bars at each time point (p ≤ 0.05).
Fermentation 09 00459 g006
Figure 7. Changes in the cell membrane unsaturated and saturated fatty acid ratio (a) and mean chain length (b) in batch fermentations by the original and evolutional strains. Error bars indicate standard deviations (n = 3). Statistical significance is denoted by different letters above or below bars at each time point (p ≤ 0.05).
Fermentation 09 00459 g007
Figure 8. Comparisons of quantitative RT-PCR of four genes (atpB, gadA, arcA, and pls) in batch fermentations by S. albulus AAE89 and S. albulus QLU58 at 48 h. Error bars indicate standard deviations (n = 3). Statistical significance is denoted by * (p ≤ 0.05).
Fermentation 09 00459 g008
Disclaimer/Publisher’s Note: The statements, opinions and data contained in all publications are solely those of the individual author(s) and contributor(s) and not of MDPI and/or the editor(s). MDPI and/or the editor(s) disclaim responsibility for any injury to people or property resulting from any ideas, methods, instructions or products referred to in the content.

