Article

Mutagenesis of Novel Clostridial fusants for Enhanced Green Biobutanol Production from Agriculture Waste

Department of Chemical Engineering, Toronto Metropolitan University, 350 Victoria St, Toronto, ON M5B 2K3, Canada
*
Author to whom correspondence should be addressed.
Fermentation 2023, 9(2), 92; https://doi.org/10.3390/fermentation9020092
Submission received: 26 December 2022 / Revised: 17 January 2023 / Accepted: 18 January 2023 / Published: 20 January 2023
(This article belongs to the Special Issue Advanced Research in Biomass and Waste Valorization)

Abstract

:
In an earlier investigation, novel Clostridial fusants were introduced and demonstrated an ability to produce biobutanol at the relatively high temperature of 45 °C. The objective of the present study is to further improve the fused strains through examining the impact of mutation agents on their stability, tolerance to biobutanol toxicity and biofuel production capability. The results for the mutated strains showed enhanced resistance to biobutanol by the fused strains and better biobutanol generation by cells. Furthermore, the results showed high biobutanol production (14.7–15 g/L), with a total Acetone, Biobutanol and Ethanol (ABE) yield of 0.6 g/g. Moreover, mutated strains showed tolerance to biobutanol toxicity up to 15 g/L, which is equivalent to a ~15% increase over literature values. The oxygen tolerance study showed improved performance by the mutated anaerobic fusant. In general, the mutation of fused clostridium strains using UV and EMS leads to the identification of stronger robust strains that show higher tolerance to oxygen and biobutanol toxicity and achieved higher yield.

Graphical Abstract

1. Introduction

As countries around the world ratify the Paris agreement and with the rising worldwide concern about climate change, the search for alternatives to fossil fuel has intensified. Biofuels such as ethanol, biodiesel and biogas have been in use in many jurisdictions around the world. Increasingly, biofuels are a transition fuel, providing a short-term alternative to fossil fuels and, hence, an effective method of lowering greenhouse gas (GHG) emissions, especially in the transport sector [1,2]. The first generation of biofuels are produced from sugars, grains or seeds and require a simple process to convert them into biofuel. Advancements in bioethanol production using different sustainable and renewable feedstocks have also been widely investigated [3,4]. Ethanol is the most common type of liquid biofuel, mostly produced from corn (in the USA) or sugarcane (in Brazil). Criticism of first-generation biofuels primarily includes debates about the ethics of diverting food crops for fuels and associated implications for food price volatility [1,2]. The utilization of agricultural waste to produce biofuels has garnered growing interest over first-generation biofuels. The Ukraine–Russia war caused a major shortage of grains in the food market worldwide. This raised a concern about whether these resources could be utilized for the production of first-generation biofuels [5]. The issues with first-generation biofuels have led to the development of second-generation biofuels. Second-generation biofuels are produced from the processing of lignocellulotic biomass. Their main advantage over the previous generation is that they utilize the non-edible residues of food crops (wheat straw, corn stover). However, the production of second-generation biofuels requires not only sophisticated processing technologies but also more investment per unit of production resources accompanied by large-scale facilities [6].
Biobutanol can also be produced from agricultural residue and is considered a better alternative to ethanol. This can be explained by its longer hydrocarbon chain, which has a 30% higher energy content than ethanol and is closer to gasoline in its properties [7,8]. Biobutanol, in its pure form, can be blended in any concentration with gasoline. This is unlike ethanol, which can only be used in blended forms of up to 85% [7]. Furthermore, biobutanol can be used in current vehicle engines without significant modifications [8]. Biobutanol is also not hygroscopic (water-absorbent), which allows blending with gasoline at a refinery before storage and distribution. Ethanol requires mixing to occur shortly before delivery due to its hygroscopic nature [7,8].
Several studies have shown that biobutanol can be produced using different microorganisms mostly belonging to the Clostridium family [9,10]. ABE fermentation is a two-phase process that has been widely used to produce biobutanol [11,12]. This fermentation involves acidogenesis (production of acids) followed by solventogenesis (production of solvents) [11]. However, the ABE process is time- and resource-consuming. Thus, research is looking intently at the integration of the different steps into one single stage to make ABE fermentation economically feasible. These steps currently include pre-treatment, simultaneous saccharification and fermentation (SSF) and products recovery [12].
The main objective of this study is to determine whether UV irradiation and treatment with an appropriate chemical mutagen (ethyl methane sulphonate) is the best means of producing desirable mutants of a novel fused clostridial strain that was developed and utilized earlier at the Nanocomposites and Biomaterials Lab at Toronto Metropolitan University [13,14,15]. These strains were developed by protoplast fusion techniques. This method was initially used in plant genetic modifications to change the genetic makeup of cells and impart desired characteristics to a plant species, e.g., introducing resistance to potato leafroll disease in potato plants [16]. Protoplasts can be readily isolated from bacterial cells by digestion of cell walls with the help of lysozyme in the presence of osmotic stabilizers [17,18]. One of the major challenges of SSF is the different temperatures required for the enzymes to break down the cellulose and the microbes fermenting the sugars released. These new fusants (Clostridium thermocellum fused with Clsotridium bejirincii strain to create the CbCt fused strain) showed thermal stability that facilitated the production of biobutanol at higher temperatures [13,14,15]. This enabled the pursing of ABE in SSF at 45 °C, which is required for breaking down lignocellulotic compounds [13,14,15]. Under these conditions, the fused strains showed better yield than the wild Clostridial strains; however, another major hurdle limiting biobutanol fermentation was the toxicity of the biobutanol produced [19,20]. A concentration of around 13 g/L of n-biobutanol is relatively toxic and will inhibit the bacterial cells from producing more solvents [21,22].
Mutation and selection of strains has been widely used to achieve strain improvement and improve yields [23]. Studies have shown that mutated clostridial strains show higher yield of biobutanol [24]. Furthermore, research has shown that strains which are more resistant to biobutanol toxicity achieve increased production [22,24]. Similarly, solvent-tolerant mutated C. beijerinckii strains also showed higher biobutanol yields [25]. Mutagenesis is an established way to identify stronger strains [26]. Mutagenesis of Clostridia can be conducted using different mutagens, e.g., UV or chemical mutagenesis (using mutagens such as ethyl methane sulphonate). UV and EMS have been used with success in numerous mutagenesis studies and thus were chosen for the present study [21,27,28].

2. Materials and Methods

2.1. Materials and Chemicals

The bacterial strain used in this study was a fusant of two clostridia species, namely Clostridium beijerinckii (ATCC BA101) (Cb) and Clostridum thermocellum (ATCC 27405) (Ct), that were both purchased initially from American Type Culture Collections (Canada). The fused strain CbCt was prepared according to the procedure published elsewhere [13,14,15]. The CbCt strain showing the highest ABE production was used for further mutagenesis and biobutanol production study. All the chemicals were purchased from Sigma–Aldrich and were used as received without any further purification.

2.2. Experimental Procedure and Method

2.2.1. Culture Conditions and Medium Preparation

The fused strain prepared earlier from the fusion of protoplasts derived from Cb and Ct (i.e., CbCt) was selected for mutation study [13,21]. The protoplast-fused strain used throughout the current study is referred to as the fused parent strain.
All the mutagenesis and other microbiological practices were carried out in an anaerobic glove box (Terra Universal, Canada) under sterile conditions at a mean temperature of 25 ± 2 °C. To create an anaerobic environment inside the glove box, a vacuum pump was used for 10 min to extract the air from the chamber. Then, N2 gas was purged through the box for 10 min to create a sterile anaerobic environment. The N2 gas was switched off after all the microbiology techniques had been performed in the anaerobic glove box, and all the serum bottles were properly sealed using a crimper. The glove box was cleaned routinely by wiping of the work surface with 70% ethanol before and after the work. Additionally, the work surface was exposed to the ultraviolet light to be sterilized for 20 min before the inoculation of the bacteria.
The parent fused clostridium strains CbCt were inoculated in Clostridial Basal Medium (CBM) overnight to bring them out of their sporulation state [29]. Before the strains were inoculated, their spores were heat shocked at 80 °C for 5 min, and the heat-shocked spore suspensions were then grown overnight in Clostridial Basal Medium (CBM) under severe anaerobic conditions [29]. CBM was created by mixing Glucose 10 g/L, MgSO4 7H2O 0.2 g/L, MnSO4 5H2O 0.01 g/L, FeSO4 7H2O, 4′-Para amino benzoic acid (PABA) 0.001 g/L, Biotin 0.2 g/L, Thiamine hydrochloride 0.001 g/L and Casein hydrolysate 4 g/L into distilled water. After autoclaving for 20 min at 121 °C, sterile potassium phosphate buffer pH 7.0 was added aseptically to a final molar concentration of 0.05 [27]. The agar plates were prepared by mixing nutrient agar with 23 g/L of distilled water. A pour plate technique was used to create Petri dishes containing nutrient agar. These plates are used to grow bacterial colonies and determine the colony count. 2% ethyl methane sulphonate (EMS), a chemical mutagen, was created to induce chemical mutagenesis in the bacterial strains [27]. The culture media was autoclaved at 120 °C for 60 min in the autoclave [30]. A bacterial culture of 3 mL was inoculated into 50 mL of CBM media and left overnight in 45 °C in a CO2 environment. After 18 h of incubation, the bacterial culture was subjected to mutation by exposure to UV radiation and EMS.

2.2.2. Mutagenesis Study

UV-Mutagenesis

The culture media with 18 h of bacterial growth was placed in a flat Petri dish of size 100 cm2 × 15 mm (surface area × depth) inside the anaerobic glove box. The surface of the media was placed at a distance of 6 cm from the UV-light source [27]. A control sample of 100 microliters was plated on 2% agar plates of size 100 cm2 × 15 mm. Then, the sample was placed below the UV-light tubes and exposed for time intervals of 5 min for a total time of 30 min. In order to analyze the mutated strain’s tolerance to biobutanol toxicity, a sample of 100 microliters was taken after each interval of 5 min and was plated on nutrient agar plates in addition to agar plates containing 15 g/L and 16 g/L of biobutanol. These plates were incubated overnight, and the following day the cell count was determined.

Chemical Mutagenesis

A control sample was taken initially and plated in an agar plate. 2% EMS was added to the media and samples were taken at time limits of 20, 40, 50 and 60 min. Each time a sample was taken, it was washed with buffer (25 mM potassium phosphate with 1 mM magnesium sulphate at pH 7.0) twice by centrifuging it at 2000× g for 5 min; this was done to remove the EMS. Then, the remaining cells were re-suspended in the buffer, and 100 microliters of the solution was plated on agar plates including ones infused with 15 g/L and 16 g/L of biobutanol. These were incubated and the cell count determined the next day [27].
The cell count method was used to calculate the surviving fraction, which is the fraction of cells that survived exposure to the mutagen. The relative induced mutation frequency (RF) was calculated as the proportion of a mutant strain present in a cell population that had survived a recorded period of exposure to a potential mutagen, divided by the proportion of the same mutant strain that was present in the cell population not exposed to the mutagen [27]. Several strains mutated by UV and EMS at different exposure times and showing reasonable to high relative frequencies and tolerance to biobutanol were further utilized for biobutanol production in SSF with feedstock of WS. Table 1 summarizes the different mutation parameters that were chosen for this study.

2.2.3. Hydrolysis of WS

Before being used as a substrate for fermentation, WS was ground into fine particles using a 1 mm Sieve screen in a hammer mill (Retsch GmbH Inc., Haan, Germany). Acidic pre-treated WS was obtained by suspending 4.5 g (dry) in 50 mL of 1% dilute sulphuric acid (H2SO4) in 250 mL Wheaton serum bottles [31]. The dilute sulphuric acid (1%) solution was prepared by adding 1 mL of 99.99% sulphuric acid to 99 mL water. The WS–acid solution was autoclaved at 121 °C for 60 min. The pH of the culture medium was adjusted to 7.0 using NaOH and the volume was increased to 50 mL using autoclaved water to make up for the water lost during the autoclaving process. The serum bottles were removed from the autoclave and allowed to cool down to room temperature prior to inoculation [32]. A blank sample was taken before inoculation and analyzed for initial individual and total sugars present.

2.2.4. Biobutanol Production in Batch SSF

Biobutanol production was examined using the mutated strains showing the highest growth and relative frequency of mutation. Cells were taken from each chosen strain and incubated for 18 h in CBM for inoculation in pre-treated WS medium. The pre-treated WS was inoculated with the mutated strains, and the SSF was continued for 120 h. Previous studies conducted beyond 120 h had showed no change in solvent concentration after 120 h [20]; thus, in the present study the SSF was carried out to 120 h. Samples were taken initially to serve as a control and then every 24 h until 120 h.

2.2.5. Statistical Analysis

All experiments were conducted in triplicate, and reported data are the mean value among these outcomes. SSF experiments were also repeated three times for each strain and samples were collected and stored for final analyses. The standard deviations (SD) and Percent Relative Standard Deviations (%RSD) were calculated for all experiments (cell counts, sugars concentrations and biobutanol production). For bacterial cell counts, SD was always in the range of 0.004 and 0.33, while %RSD was 0.02–1.12. As for sugars concentrations, SD was 0.014–0.48 and %RSD was 0.077–2.137. Results from biobutanol production showed SD in the range of 0.016–0.20 and %RSD in the range of 0.22–1.02.

3. Results and Analysis

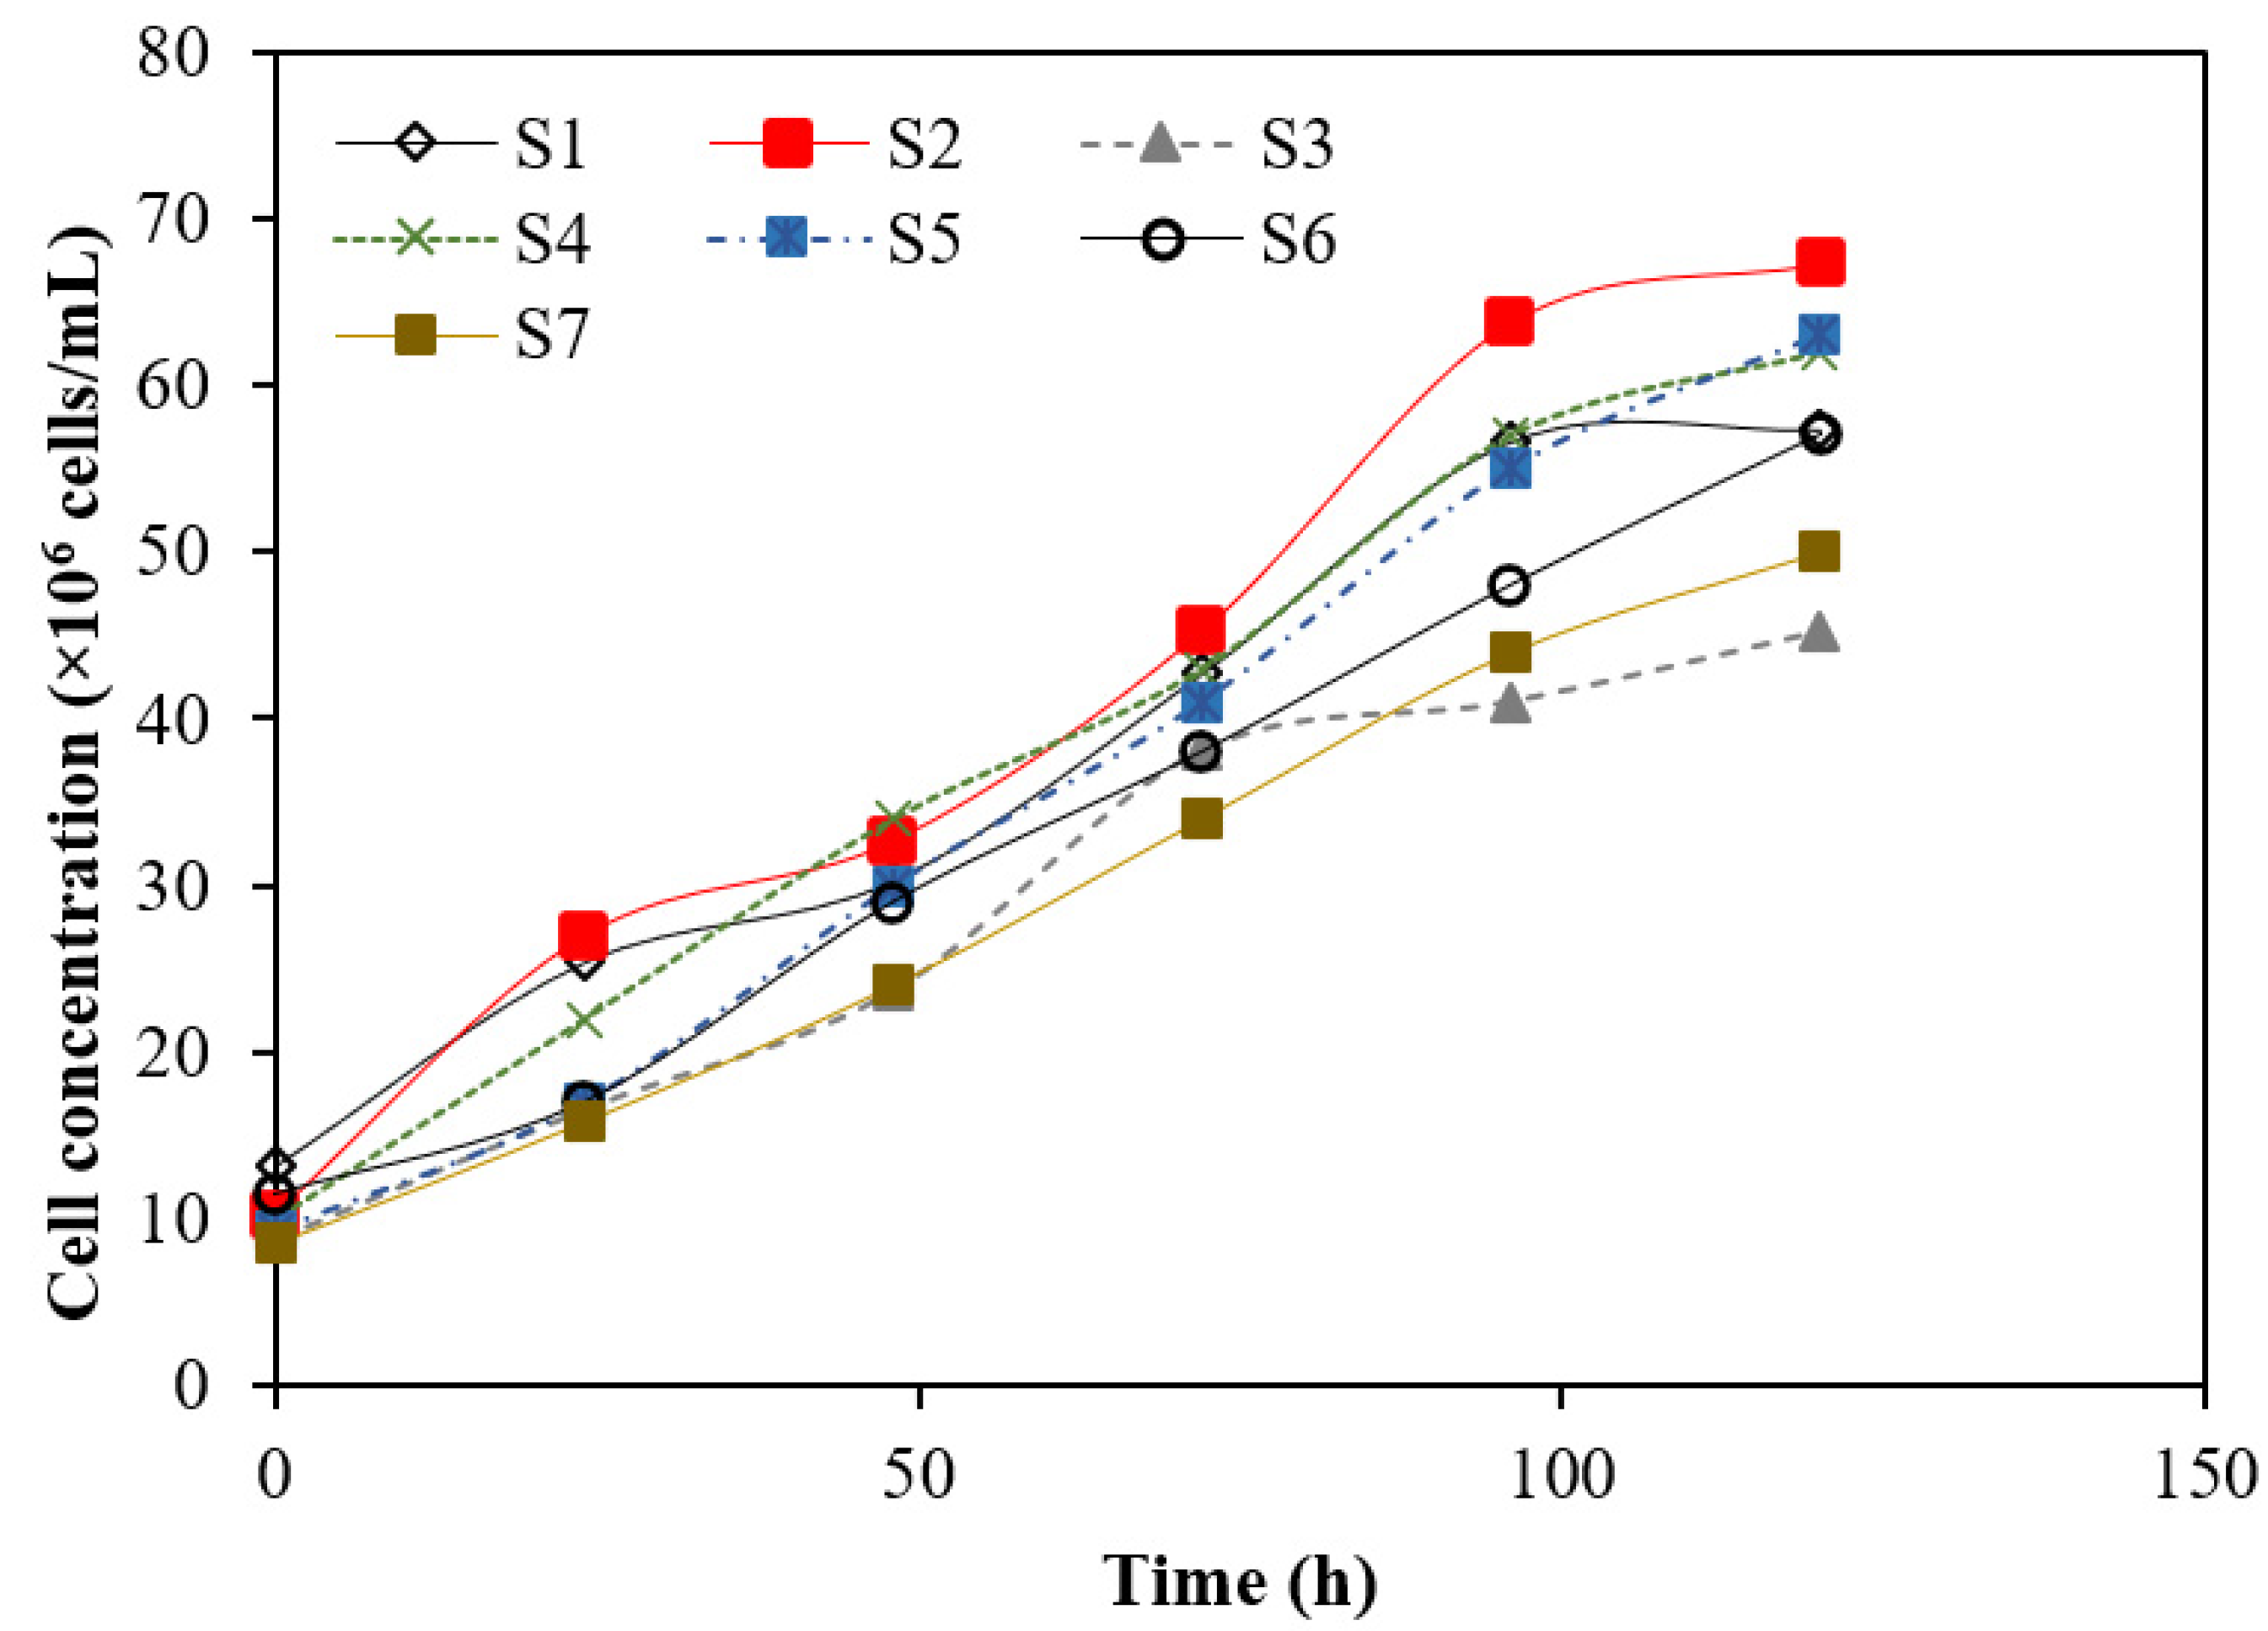
3.1. Mutagenesis of Bacterial Strains and Production of Biobutanol

The fused bacterial strain CbCt was mutated using UV radiation and EMS. The cell count after mutagenesis study was used to calculate surviving fractions and relative induced mutation frequency (RF). Figure 1 shows the cell count after chemical mutagenesis of the fused clostridia strain CbCt after different mutation periods, while Figure 2 gives the cell count of the mutated strain upon exposure to 15 g/L of biobutanol. As shown in Figure 1, the cell count from the agar plates shows a gradual decrease (from 27 × 106 cells/mL to 7 × 10⁶ cells/mL), indicating cell death due to contact with EMS [33]. However, the cell count stabilizes at 50 min, indicating a decline in cell death rates caused by DNA repair [25]. Furthermore, Figure 2 shows that bacterial cell concentrations were generally lower in the presence of biobutanol (2 × 10⁵ cells/mL to 5 × 10⁴ cells/mL), indicating the toxicity effect of biobutanol on the bacterial strains. However, some cells showing growth in the presence of biobutanol exhibited tolerance. These strains were then selected for further study. The cells at 40 min of EMS mutation show the highest cell count at 15 g/L concentration of biobutanol (i.e., 2.4 × 10⁴ cells/mL).
Figure 3 shows the results for the surviving factor and relative frequencies calculated and plotted for the strains mutated with EMS. For the strains exposed to EMS, an initial decrease in cell count was observed, after which the surviving fraction value stabilized; there was no further decrease observed between the values obtained at 40 min and 50 min, indicating adaptation to the mutagen. This was followed by a drastic decrease in EMS contact at 60 min indicating higher cell death and loss of viability. The relative induced mutation frequency (RF) value increases up to 40 min and then decreases at 50 min and 60 min. This indicates initial increase in desirable mutants, representing tolerance to biobutanol, followed by a decrease in biobutanol tolerance. This is in agreement with a previous study conducted by Bowring and Morris (1986) [25].
Similarly, Figure 4 and Figure 5 illustrate the cell count after UV mutagenesis. After exposure to UV radiation, the mutated sample was plated on nutrient agar plates and on 15 g/L biobutanol-infused agar plates. The resulting colonies were used to determine the cell count. The strain exposed to 10 min of UV radiation showed the most resistance to 15 g/L of biobutanol as evident from the highest cell count (i.e., 1.4 × 10⁵ cells/mL). The cell count decreased continuously with an increase in UV exposure due to cell death because of prolonged UV radiation. Additionally, cells irradiated with a higher amount of UV exposure failed to show any biobutanol tolerance, indicating a lack of vigor due to excessive DNA damage [34].
Figure 6 elucidates the surviving fraction and RF for cells mutated by exposure to UV radiation. The surviving factor decreases significantly with exposure to UV radiation above 15 min, and a high relative induced mutation frequency is evident from the Figure. There is a sudden increase in RF, from the fused parent strain to the strain exposed to UV, for 10 min followed by a lag as exposure time to UV increases, indicating a reduction in the rate of relative frequency of mutations induced.
The cell count trend obtained after mutation with UV and EMS indicates that loss of cell viability was lower for prolonged (60 min) EMS mutation (70% cell death) than for UV exposure (30 min), where it was significant (93% cell death). The RF, however, was much higher for UV than for EMS. A similar trend has been noticed in previous studies [27]. This was explained by the different mechanism of mutations caused by UV and EMS, where UV mutation is an indirect mutation caused by the misrepair of DNA thus causing heavy DNA damage, whereas EMS causes direct point mutation without as heavy collateral DNA damage [34]. The mutated strains showing the highest relative frequencies and tolerance to biobutanol for both UV and EMS mutagenesis were selected and the production from SSF of WS was investigated. SSF was conducted for 120 h.

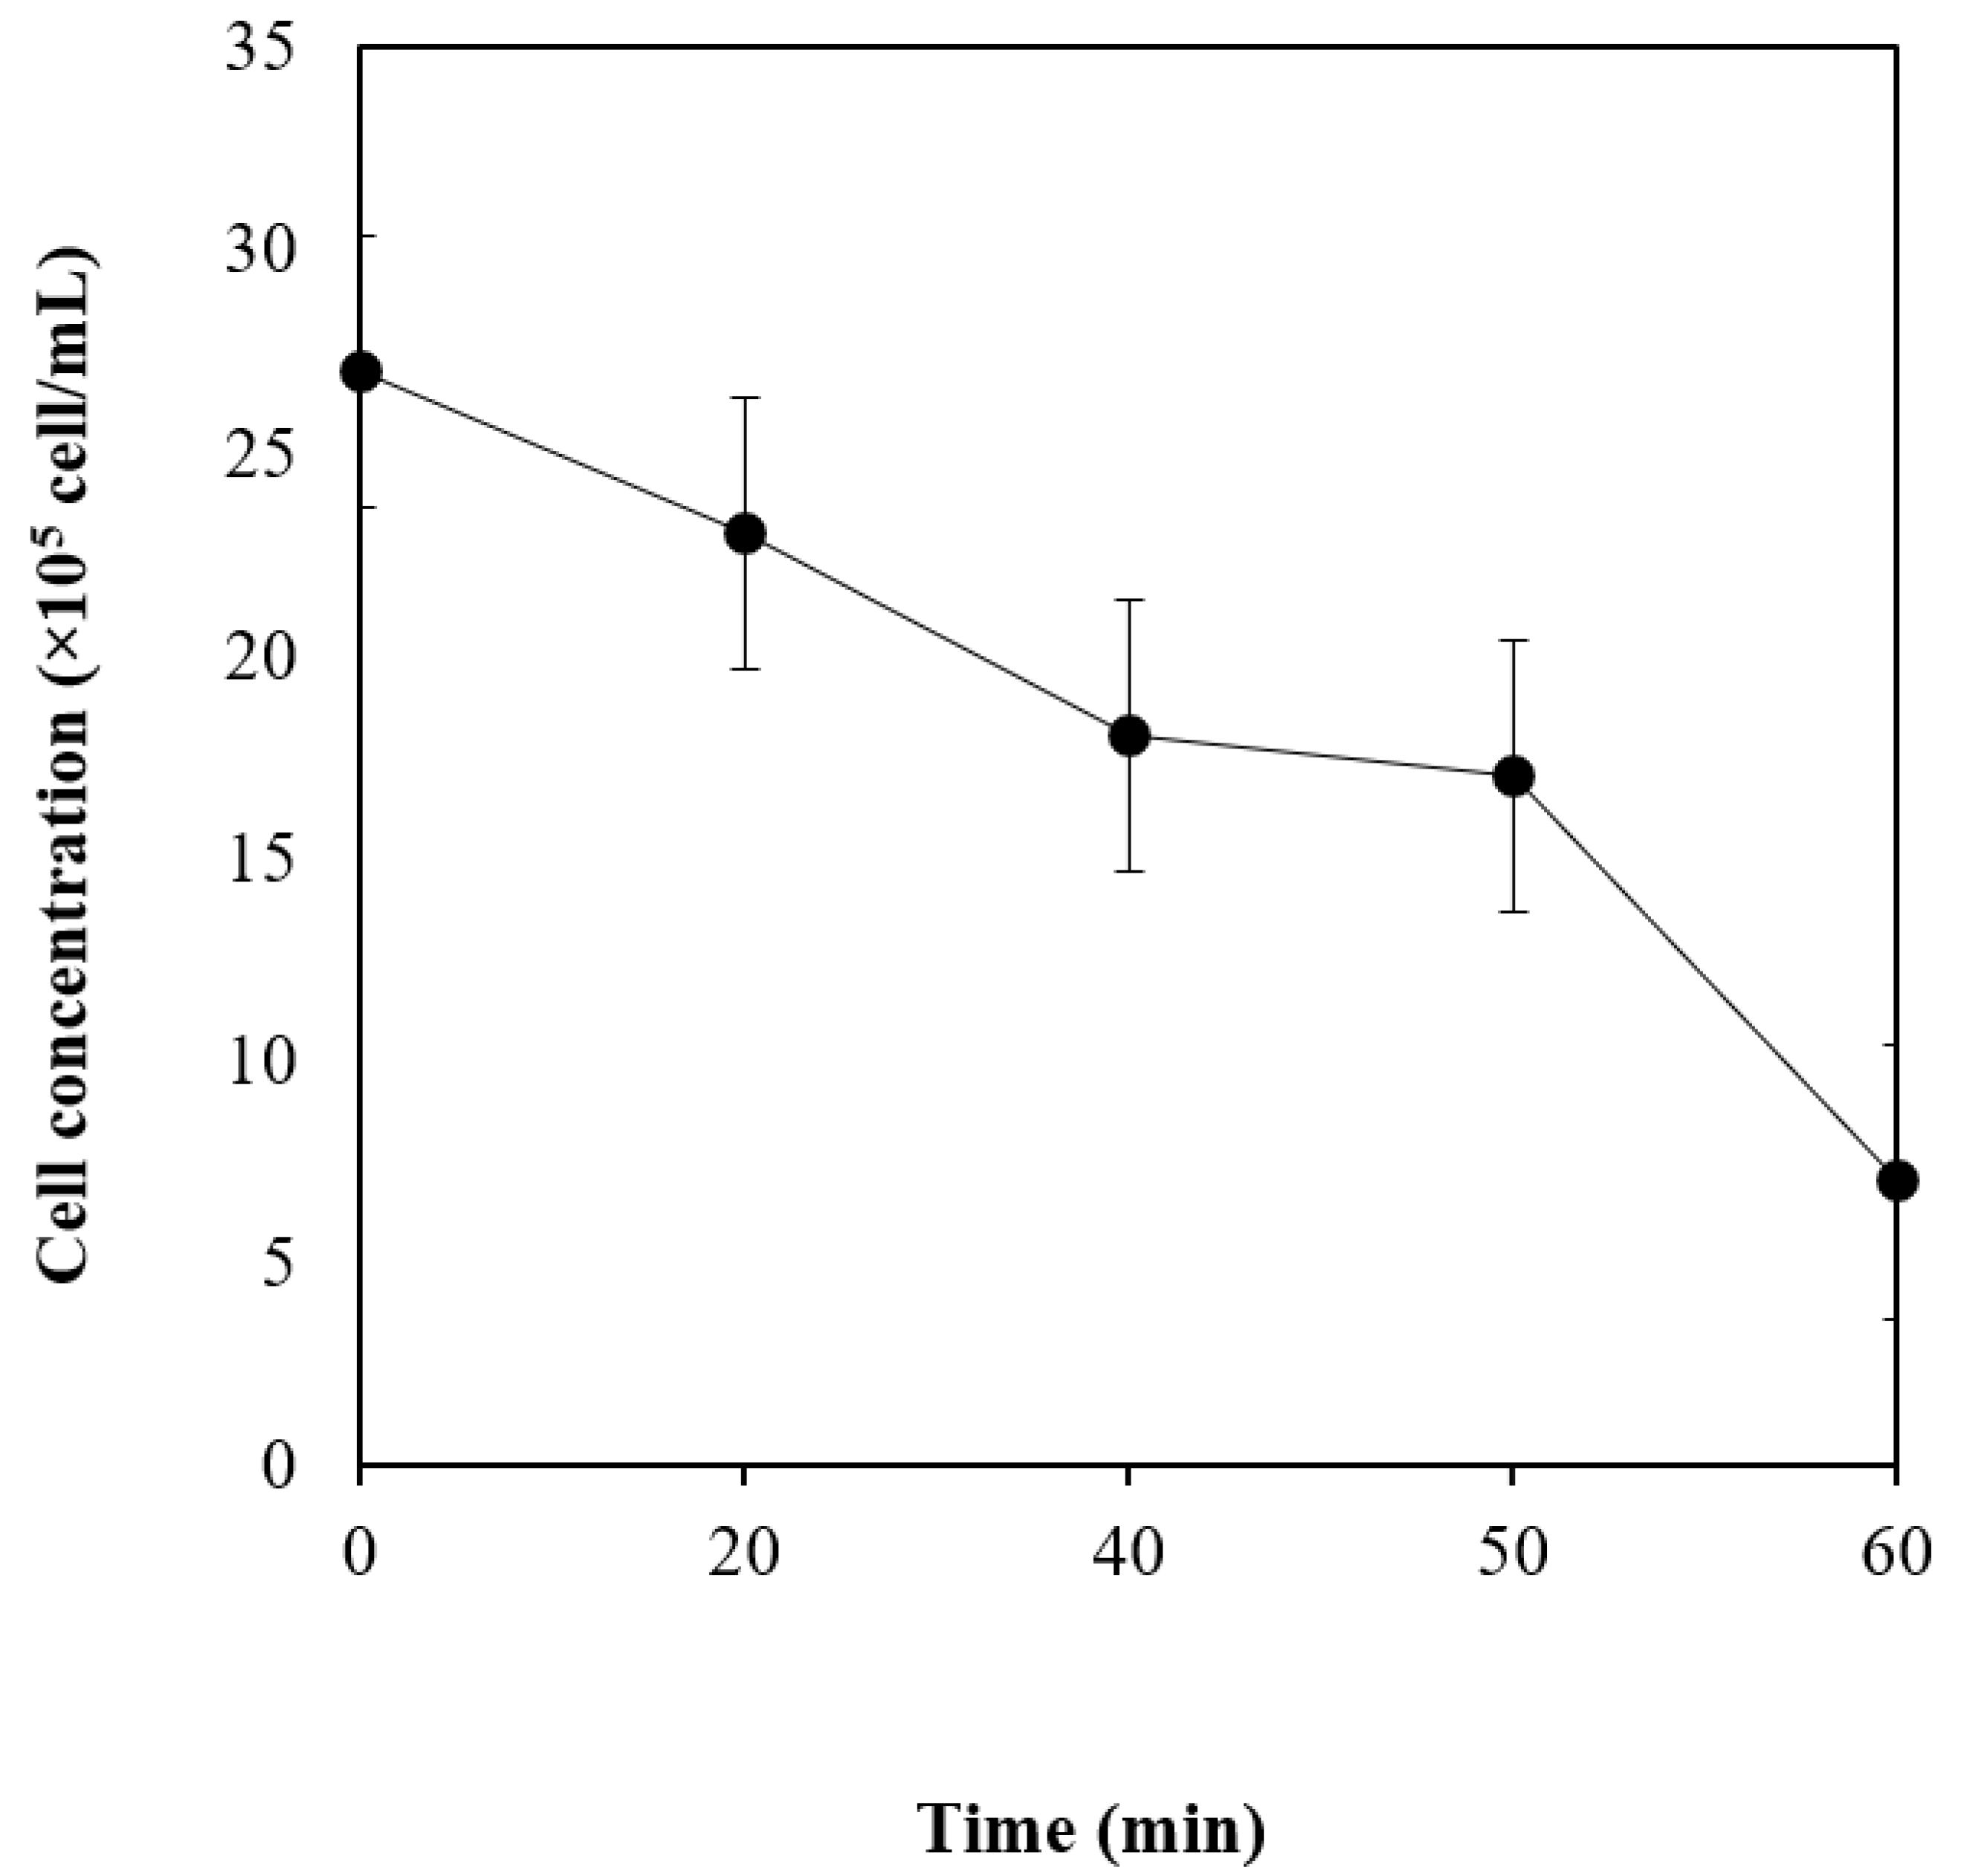
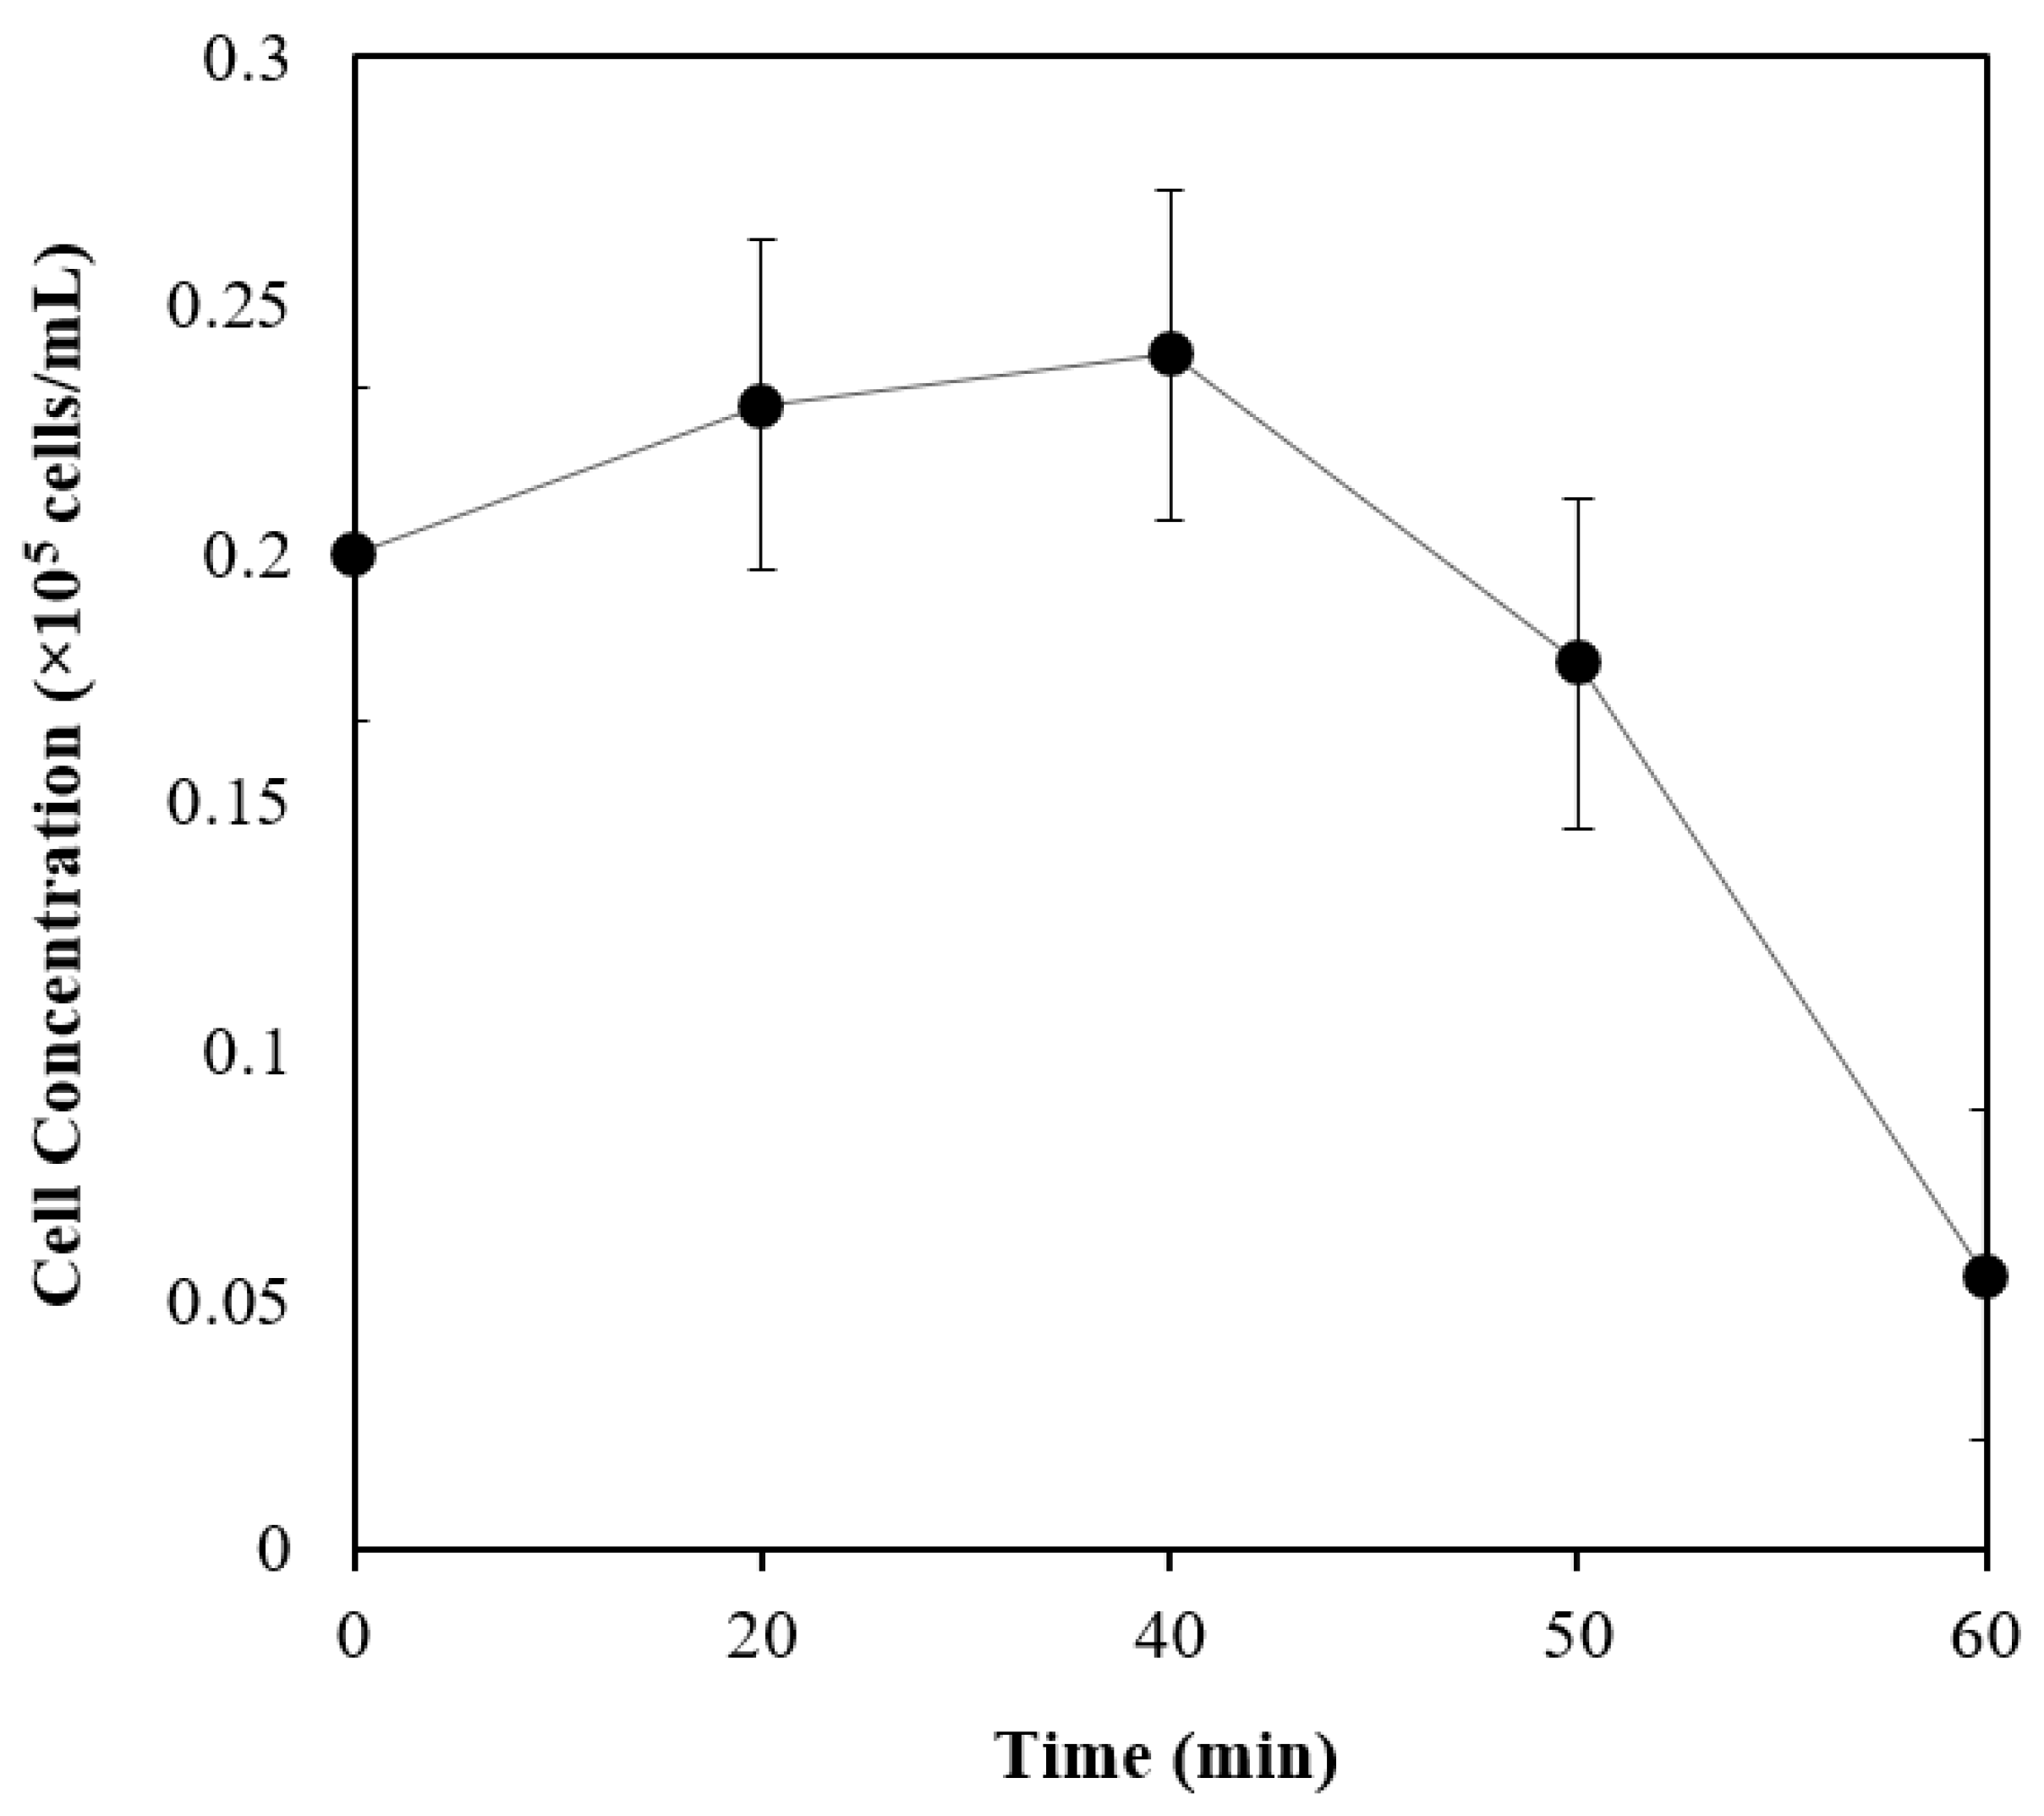
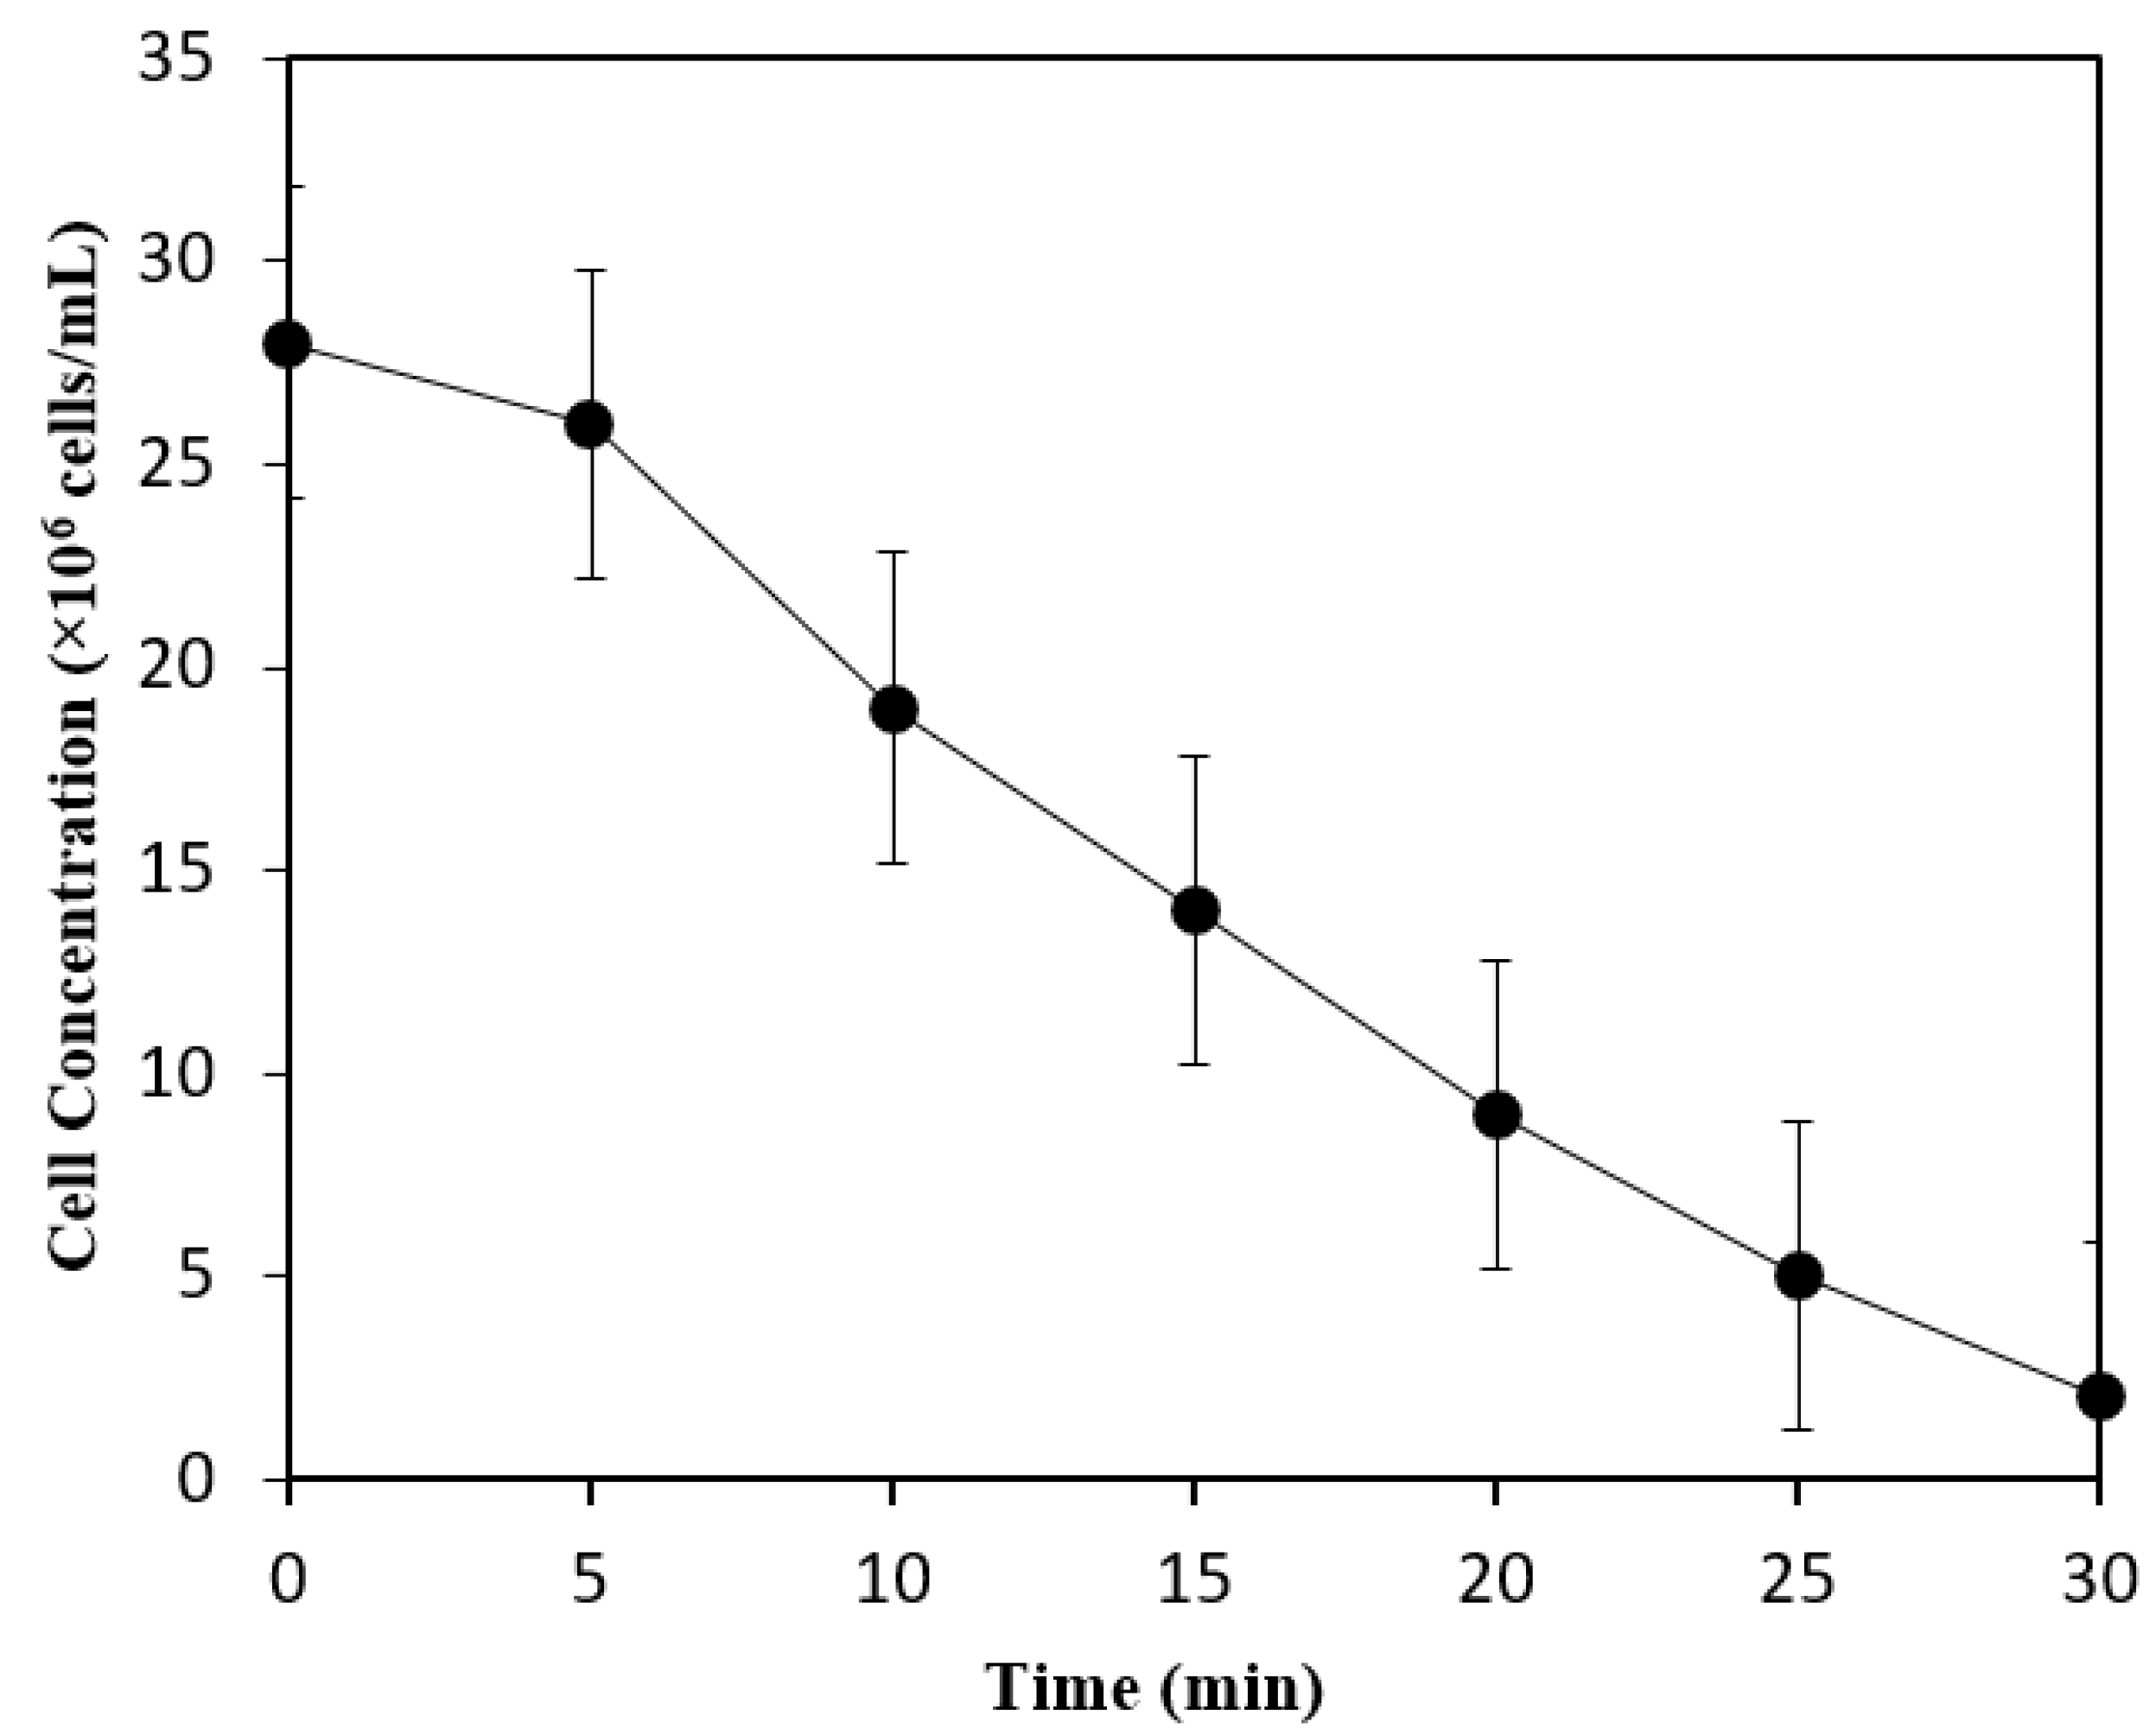
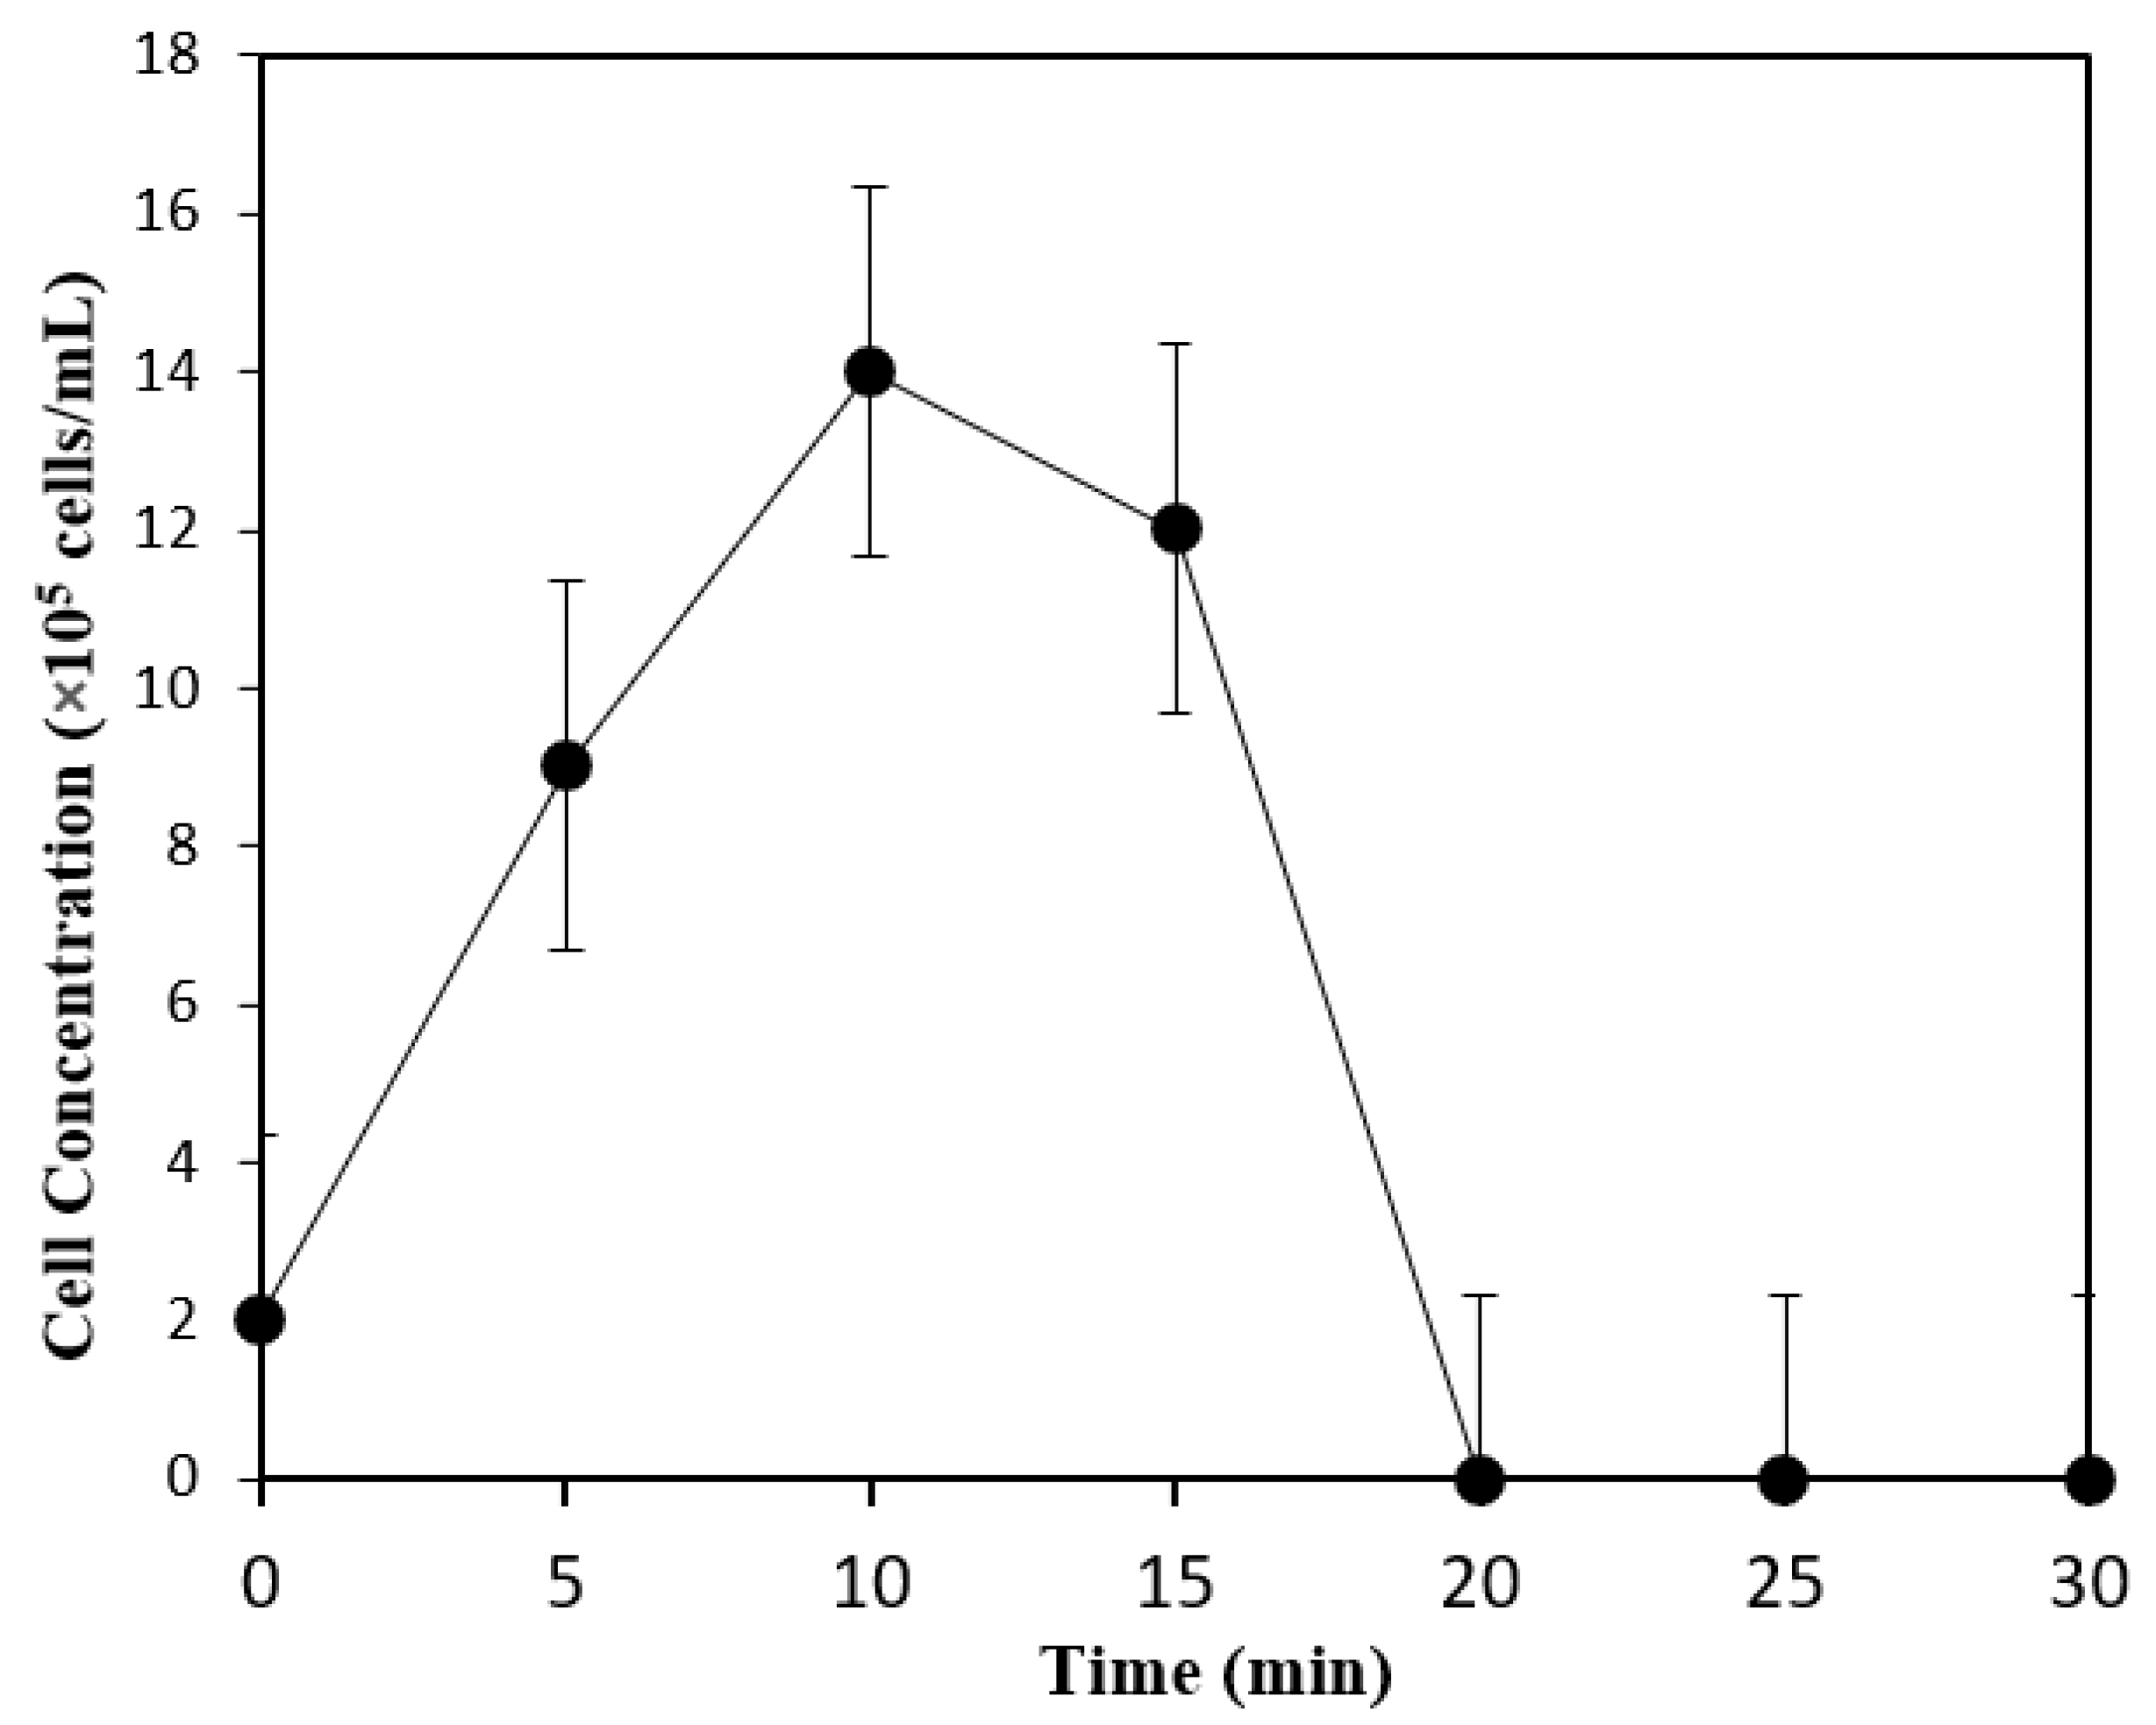
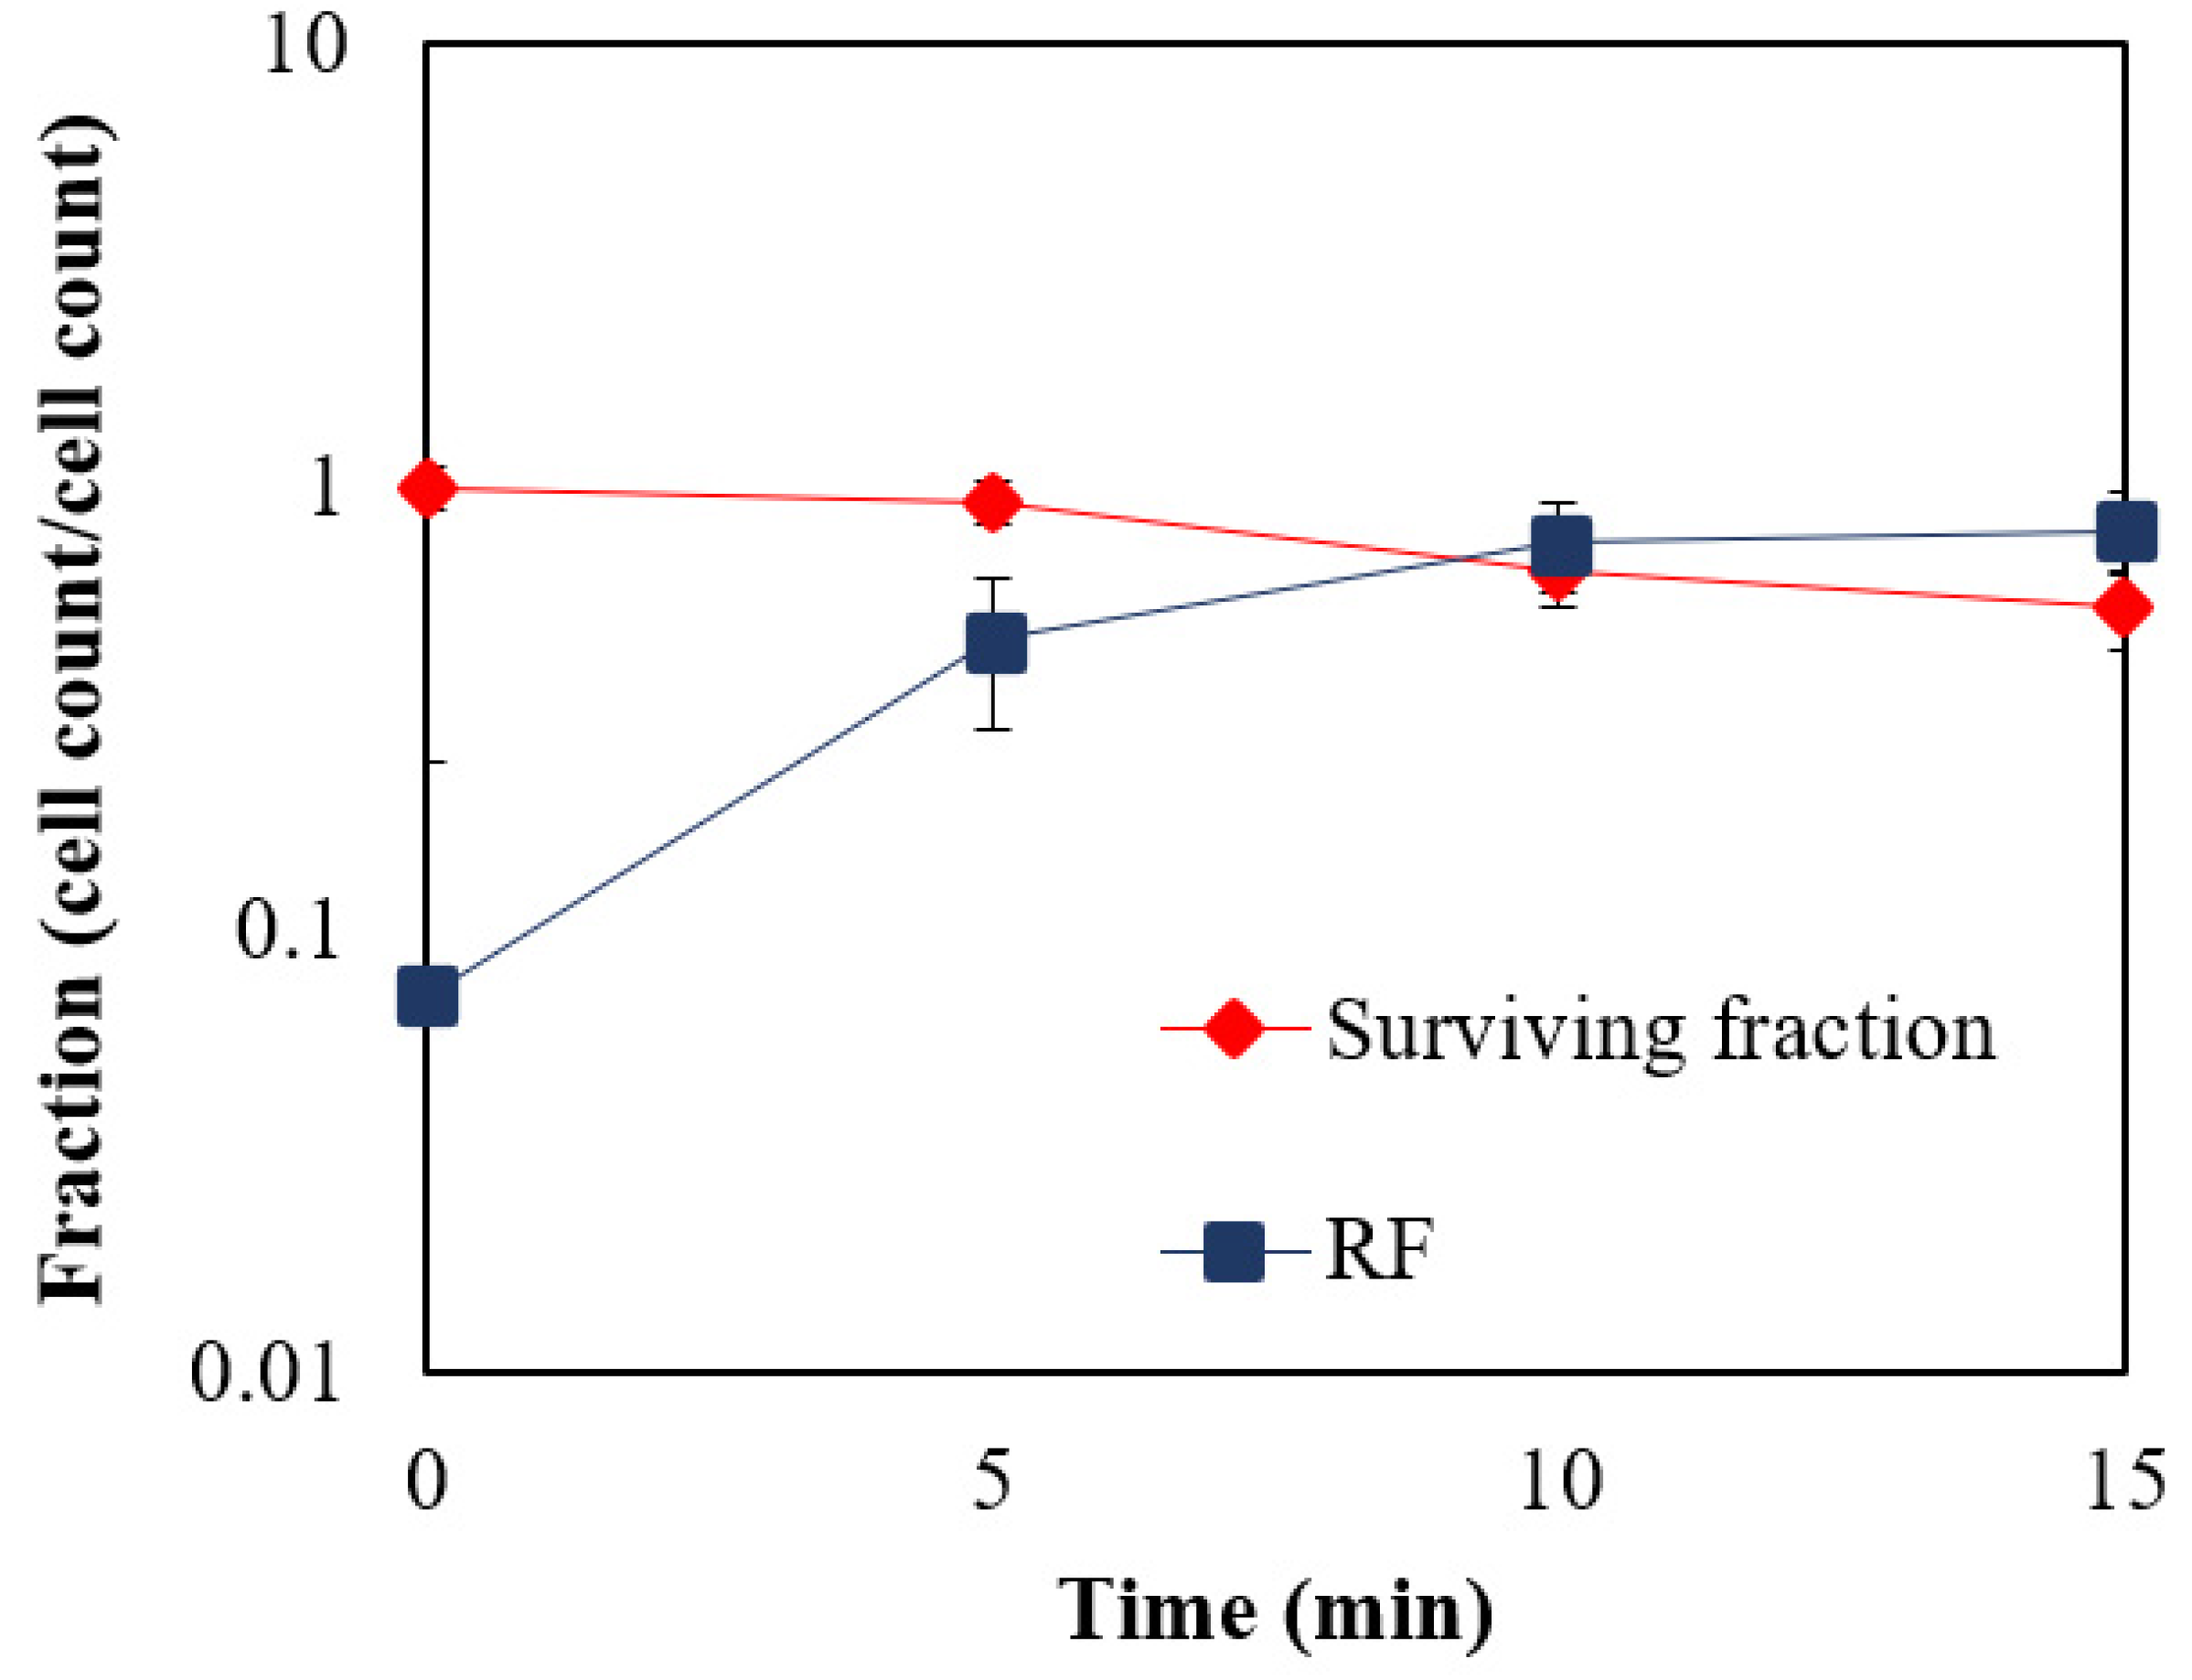
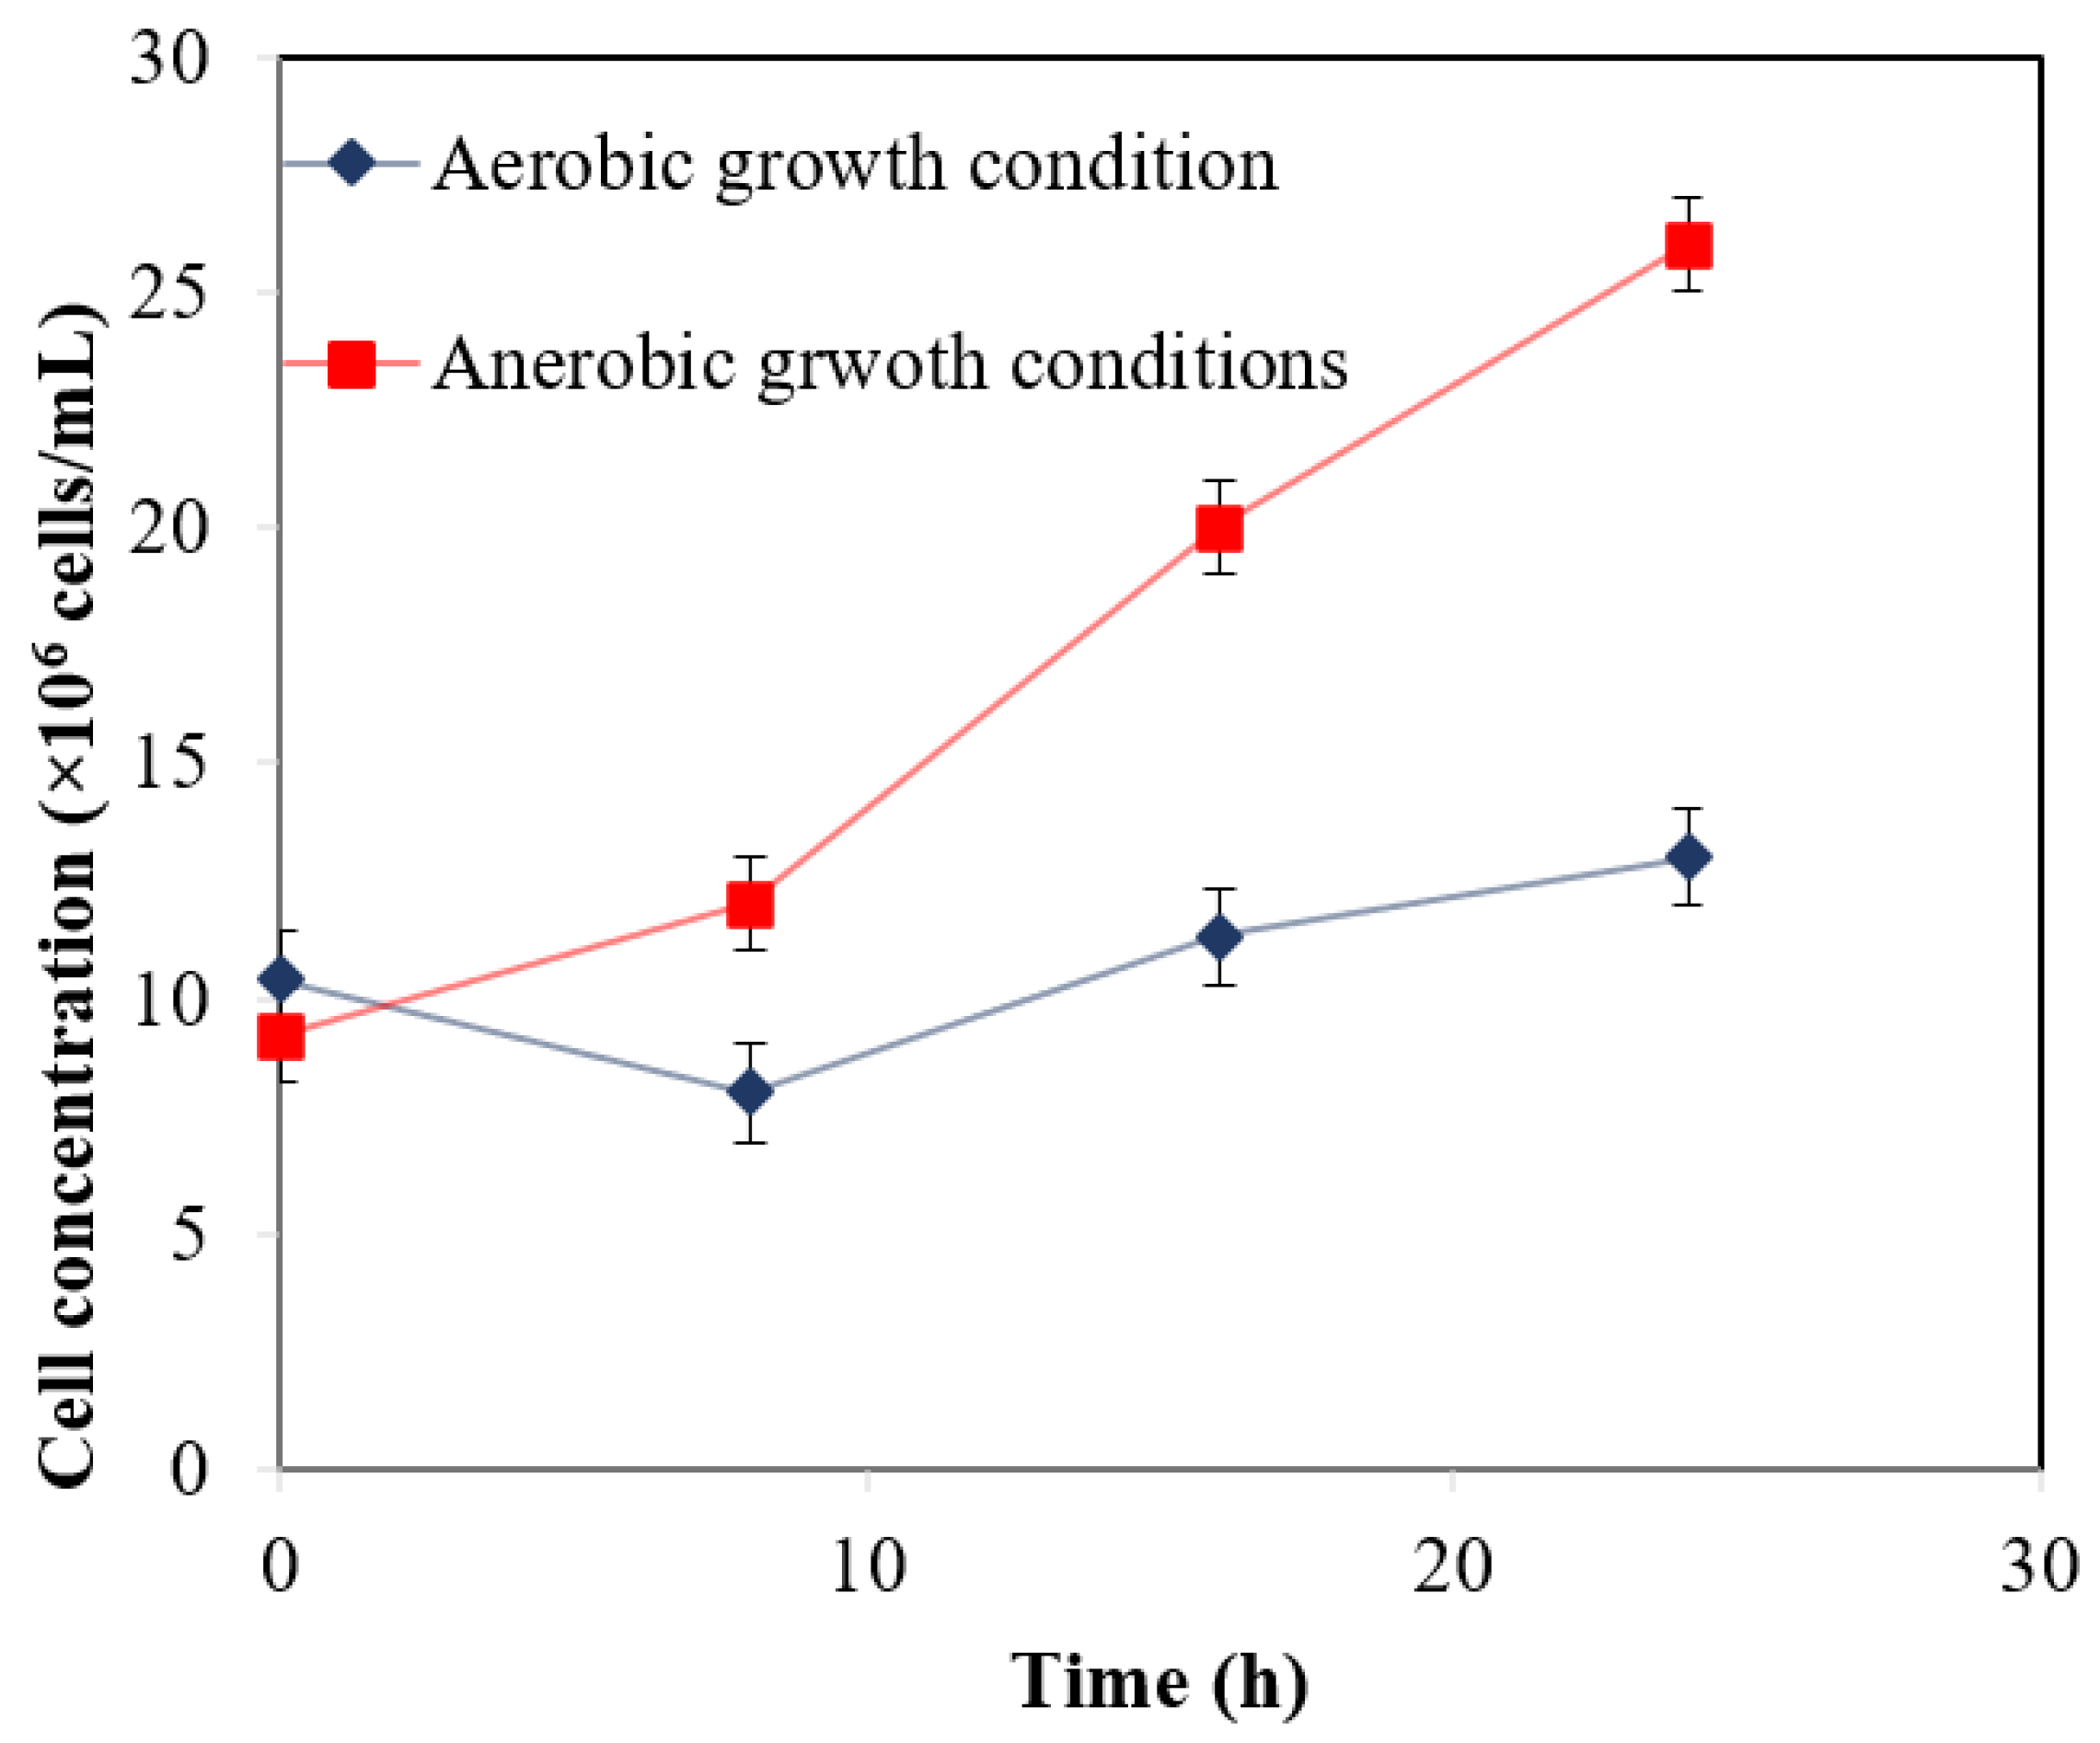
3.2. Oxygen Tolerance Studies

Figure 7 represents the cell count of the mutated species grown aerobically and anaerobically. It is evident that the aerobic conditions inhibited growth due to the presence of oxygen. The slow growth observed indicates some tolerance to oxygen. The bacterial cell count went down (23% of initial) in the first 8 h as cells died due to exposure to oxygen, but then revived, showing adaptation and aerotolerance [35]. The final cell concentration after 24 h in cells grown aerobically was 1.3 × 10⁵ cells/mL. This was lower than the cells grown anaerobically (2.4 × 10⁶ cells/mL). The cell colony morphology was compared with other mutated CbCt strains to ascertain the identity of the species and was found to be in accordance with clostridium fused strains.

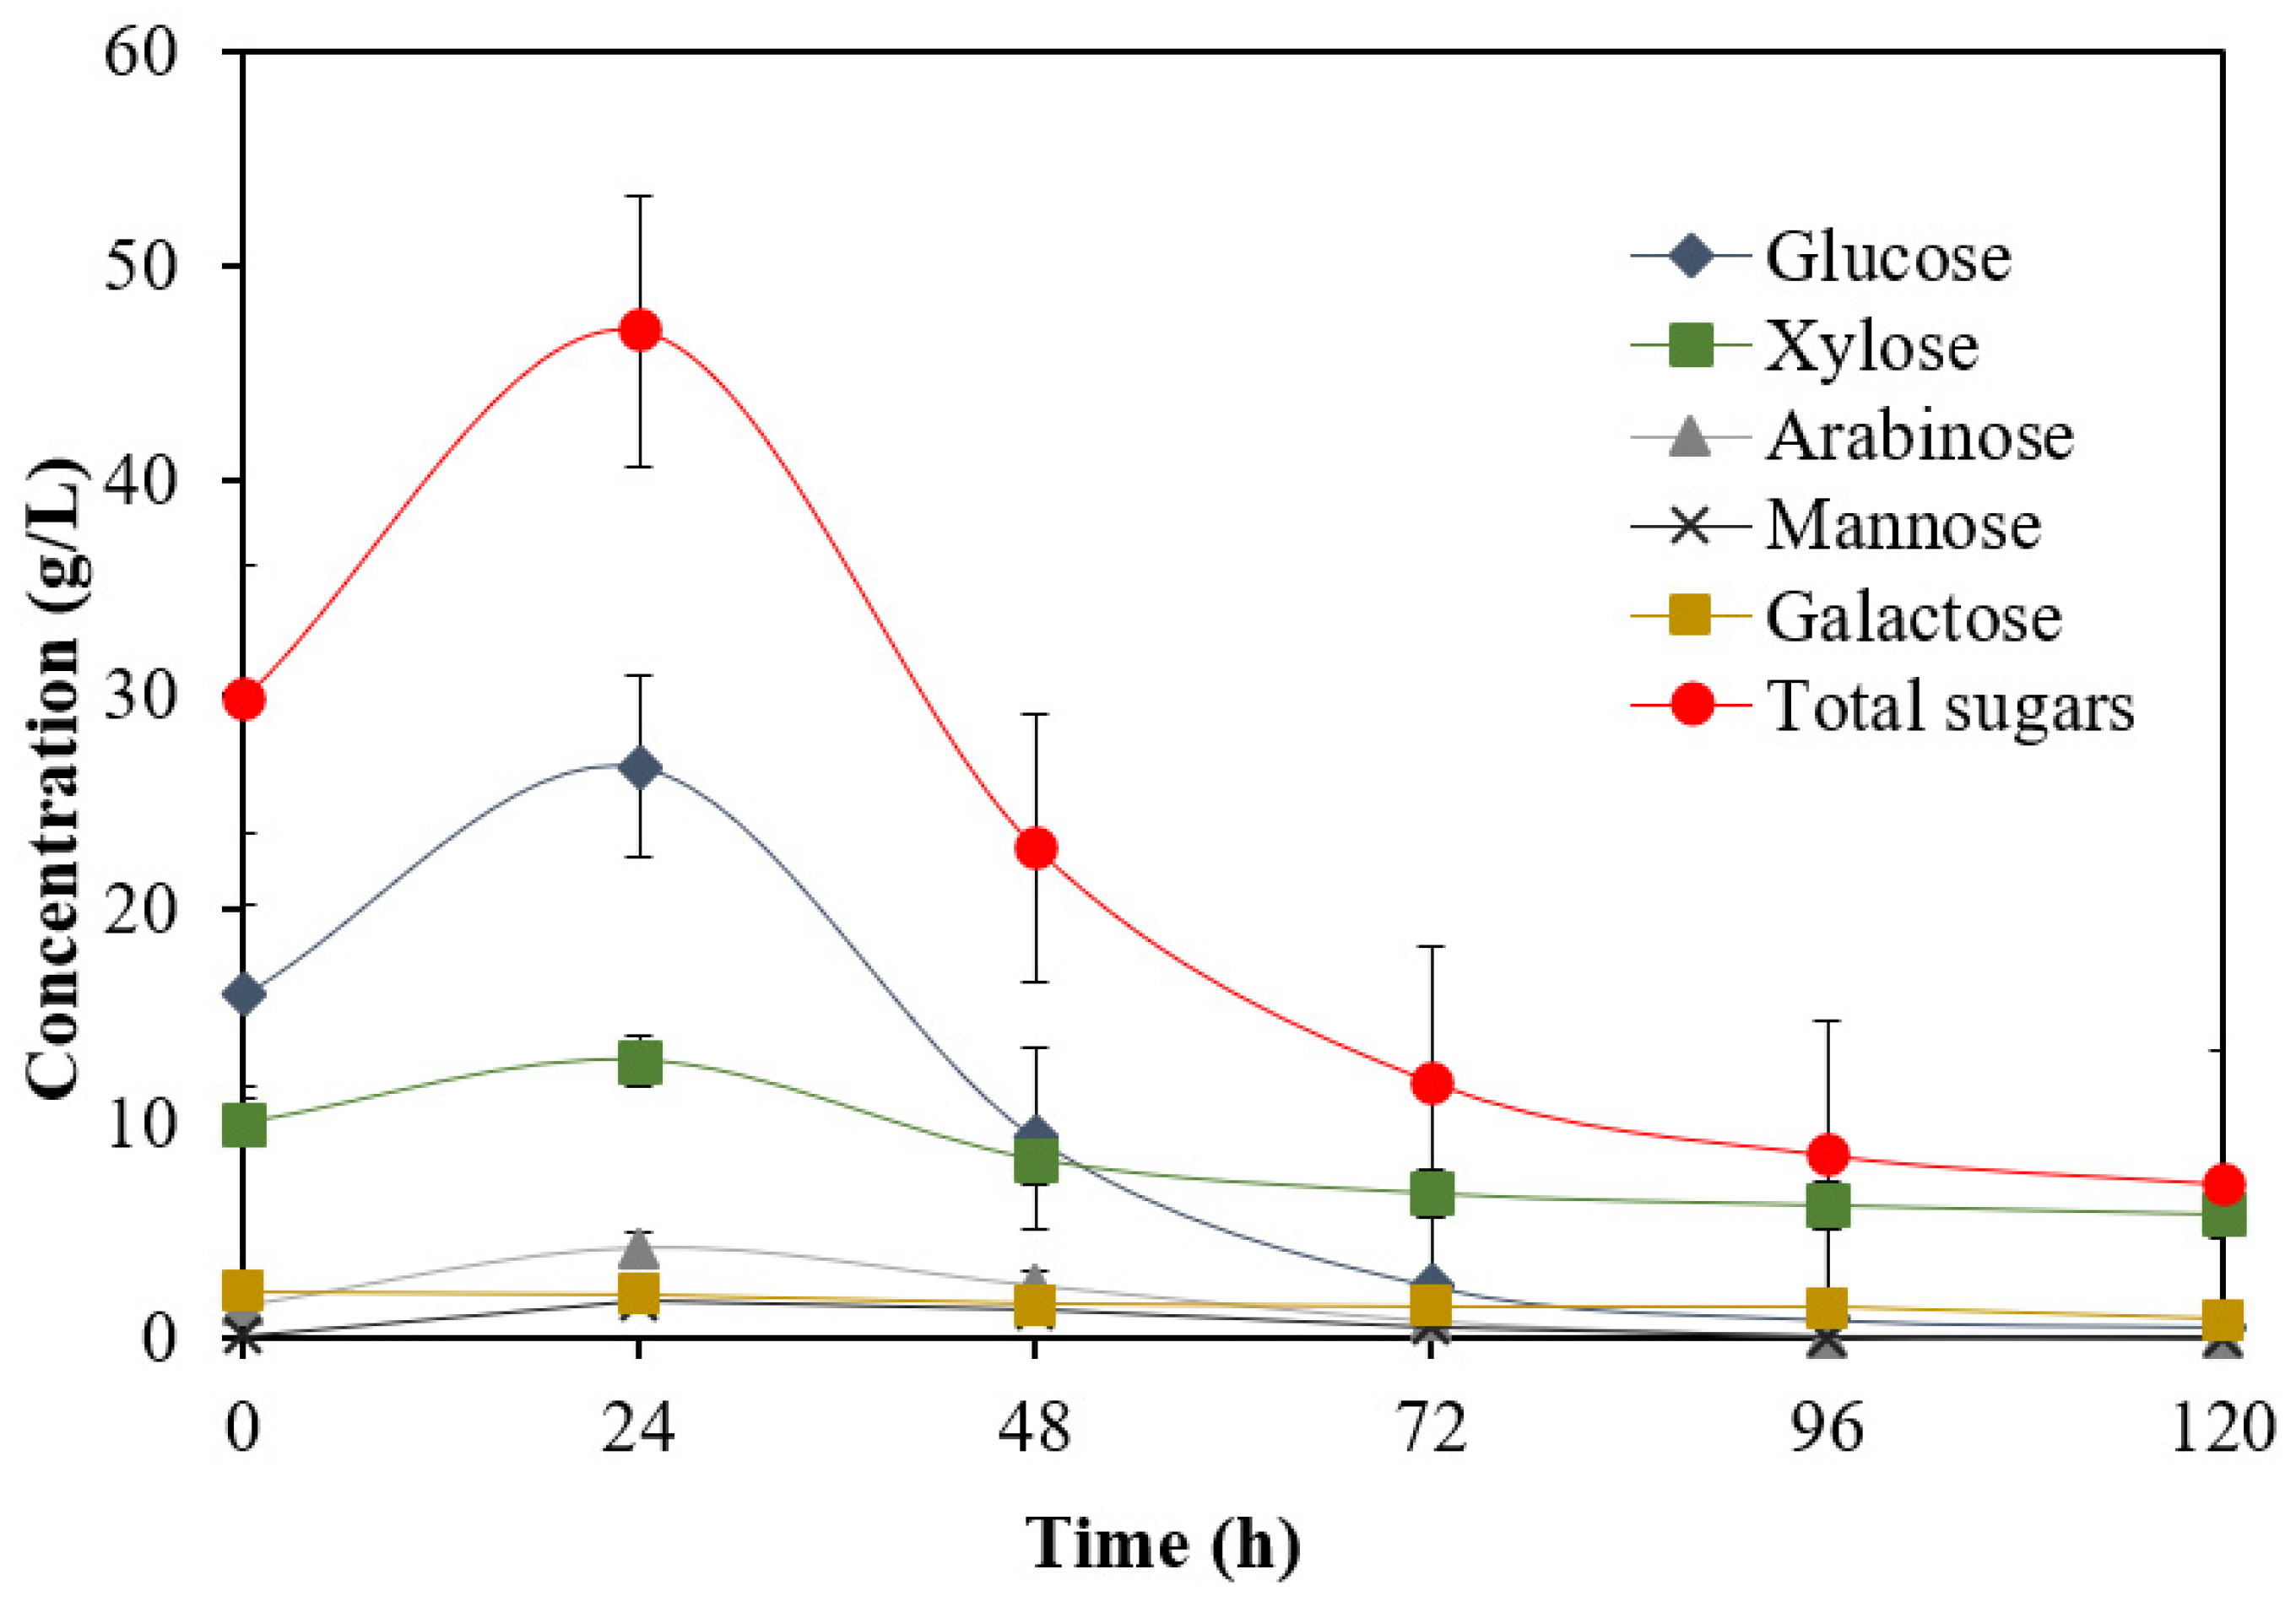
3.3. Biobutanol Production in Batch SSF

Figure 8 displays individual sugars’ concentration profiles obtained during biobutanol SSF experiments using the non-mutated CbCt parent strain of fused clostridia. According to Figure 8, the results demonstrate that the sugar concentrations increased in the first day of fermentation. This can obviously be observed for glucose, xylose and arabinose, while the increase in the concentration of mannose was relatively minor and there was no increase in galactose concentration. The increase in the total sugar is a result of the continuous saccharification of non-hydrolyzed polysaccharides that release monomers such as glucose, xylose, mannose, galactose and arabinose by action of the enzymes released from the fused strains [32]. It is important to note that no external enzymes were added during the SSF, and all enzymes were generated within the fused strains after inoculation. Figure 8 shows a rise in sugar concentrations in the first 24 h followed by a decrease until the end of the 120 h, by which point most of the glucose (98%), arabinose (100%) and mannose (100%) had been consumed. While individual sugar concentrations rose during the first 24 h due to the cellulolytic action of the cells, they started to drop significantly thereafter due to their consumption and metabolism into solvents and acids through the ABE process [36]. Figure 8 also indicates that hemicellulotic pentose sugars such as xylose (56%) were not completely consumed at the end of the fermentation. At 120 h, the concentration of xylose stood at 5.76 g/L. However, a small trace of glucose (0.56 g/L) was found, suggesting the nearly complete consumption of glucose. High levels of galactose (62%) were left after the 120 h. This has been explained in the literature by the different uptake mechanisms associated with the different sugars. The transport of sugars into the cell through the cell membrane uses the phosphoenolpyruvate dependent phosphotransferase system (PTS), which is involved in the transfer of a phosphate group from phosphoenolpyruvate (PEP) to the sugar. While glucose uptake is associated with PTS, galactose transport was supported by a non-PTS mechanism, as the phospohorylation of this sugar is supported by adenosine triphosphate and not PEP [37].
Other strains show similar individual sugar consumption patterns during SSF of WS. It is clear that all profiles follow similar patterns for all mutated strains. Strains S2, S4 and S5 showed higher sugar production and consumption compared to all the others and were the best-performing of all mutated strains in terms of sugar produced and consumed. It is also interesting to note that the hemicellulotic pentose sugars such as xylose are not completely consumed at the end of the fermentation, whereas Mannose and Arabinose were completely consumed.
Table 1 lists initial and final individual and total sugar concentrations during SSF of WS. In the current study, it was found that the total sugar concentration produced during the hydrolysis of WS was around 45 g/L. This value is almost equivalent to the total sugars concentration reported in previous studies (i.e., range of 40–45 g/L by Qureshi et al. (2007) [36]). Examining Table 1 reveals that the highest total sugar consumption was observed with strain S2 (i.e., consumption of 41.26 g/L). S2 was closely followed by strain S5 (i.e., 40.11 g/L). A total of 85.4% of sugar conversion was noticed with strain S2, which was the highest value amongst all the strains mutated by either UV or EMS. The highest glucose consumption was exhibited by strain S2 (i.e., 26.6 g/L). Glucose, arabinose and mannose were consumed near to completion; however, larger amounts of xylose and some galactose were left at the end of 120 h. In previous studies, it was found that in either batch or fed-batch cultures xylose utilization was inhibited at higher glucose concentrations. This was attributed to glucose mediated catabolic repression [38,39,40,41].
Figure 9 displays the changes in cell concentration for the mutated strains over 120 h of SSF. During the first few hours, all bacteria experienced a lag phase. In this phase, the cell concentration remained approximately constant because strains were adjusting themselves to the medium, temperature and pH levels. After this phase, a sharp increase in cell concentration was observed. After most of the sugars in the culture medium had been utilized, there was another decrease in the cell growth rate, which can be seen in Figure 9. In this phase, cells started breaking down the cellulotic biomass available to form sugar monomers, which were then utilized to produce solvents and acids. Once the strains had adjusted to the new levels of pH caused by acid production, an increase in growth was observed. This effect has been documented in previous studies and attributed to an injury–recovery process exhibited by clostridium strains [42,43]. The growth rate increased following this period and stayed stationary until 96 h. During the whole log phase (24–96 h), strains showed an average increase in cell concentration that was 500% of the initial value. This phase ended after 96 h when the cell concentration decreased slowly by entering the decay phase. This phase corresponds to the solventogenic phase in the SSF process, where sugar levels are minimal and biobutanol toxicity is increasing, thus slightly inhibiting cell growth. However, biobutanol tolerance could be observed until 96 h when there was no decline in cell concentration. Moreover, the strains exhibited a wider stationary phase until 96 h, in which the biobutanol concentration continued to increase. This was followed by a decay phase at 96 h, when the sugars were mostly consumed, and the cell concentration decreased slowly due to rising biobutanol toxicity.
Table 2 shows the final ABE produce concentration, for both the non-mutated parent strain and the mutated strains (Strain S1 to S7), from SSF of WS. As presented in Table 2, the highest ABE solvent and acid production was achieved by strain S2, which was exposed to UV radiation for a duration of 10 min. The strain was able to produce 24.8 g/L of total ABE and 14.8 g/L of biobutanol at 45 °C.
Acetone and ethanol toxicity are not so much of a concern when compared to biobutanol toxicity due to the higher concentrations required. Cell growth inhibition has previously been observed by other researchers for acetone at 70 g/L and for ethanol at 50 g/L to 60 g/L [44,45]. In the current study, ethanol and acetone concentrations did not reach above 10 g/L and therefore did not contribute to solvent toxicity and cell inhibition. However, in the case of biobutanol it can be concluded that the mutation of the fused strains was able to create robust strains exhibiting higher tolerance to biobutanol toxicity and higher biobutanol production capability.
The biobutanol concentration achieved by strain S2 is higher than in previous research studies [36]; biobutanol production was examined from wheat straw using clostridium strains with an initial sugar concentration of 62 g/L. Several processes were examined in Qureshi’s study, including two that utilize SSF at 35 °C. However, one process that employed SSF coupled with gas stripping to remove biobutanol from the batch system recorded the highest biobutanol production, 12.7 g/L. Although this value is lower than the one obtained with S2, gas stripping is essential to reduce the effect of toxicity by accumulated biobutanol and is thus expected to improve the productivity of the bacterial strains. The higher values achieved in the present study are without gas stripping and show higher tolerance in the mutated novel fused strains to biobutanol toxicity. This demonstrates a high potential to enhance the production of biofuel by utilizing the enhanced mutated strains at an industrial scale.
Table 2 shows the analysis of the ABE yield developed through the mutagenesis study and compares it to the CbCt strain data collected during previous studies. Total ABE yield was calculated for total production with respect to total sugar consumption; it was determined by dividing final ABE as well as acetone, biobutanol and ethanol concentrations by total sugars consumed in 120 h of fermentation. Strain S2 shows the highest sugar consumption and ABE yields during the SSF experiment with WS as feedstock. According to Table 2, the total solvent yield for strain S2 (UV-mutated) was 0.6 g/g, with an acetone yield of 0.17 g/g, a biobutanol yield of 0.36 g/g, and an ethanol yield of about 0.06 g/g. Strains S5 and S6 (chemically mutated using EMS) showed comparable biobutanol yield values at 0.36 and 0.35, respectively, and total solvent yields of 0.59 g/g each. Strain S7 shows a general lack of vigor that can be attributed to mutation damage due to long contact with the mutagen [46]. Table 2 demonstrates that the mutated bacterial strains show improvement over the parent fused strains. According to the results in Table 2, there is a clear increase in total ABE production due to the biobutanol tolerance of the strains. Table 3 shows biobutanol production obtained in previous published work in comparison with the present work. According to this table, production was improved significantly when fused strains of CbCt were used in previous work (i.e., 13.82 g/L) [13,15]. The mutation of the fused strain in the present work further improved production of biobutanol by approximately 7.5–8.5 % (i.e., 14.7–15 g/L) when compared to the fused strain of CbCt.
Advanced sustainability assessment tools should be utilized in future studies to investigate the results of the present study. These tools include life cycle assessments, exergy and its combinations with environmental (exergoenvironmental) and economic (exergoeconomic) analysis [47,48].

4. Conclusions and Prospects

The present study focused on the mutation of the fused bacterial strains using UV radiation and EMS to increase the resistance to biobutanol toxicity of the fused bacterial strains. The biobutanol toxicity resistance of the strains was raised to 15 g/L, a 15% increase from the literature value of 13 g/L. ABE studies on WS were conducted with these enhanced bacterial strains. Moreover, the mutated strains in general showed superiority in terms of biobutanol production compared to the parent strains of fused CbCt. The fused strains showed biobutanol production of 14.7–15 g/L after mutation, which is an increase over the fused strain of CbCt’s production of 13.8 g/L before mutation. A 5.8% increase in biobutanol production yield was observed in the mutated fused strains, indicating that the mutated strains were better able to handle biobutanol toxicity and thus showed higher yield of biobutanol. Improvement in oxygen tolerance was observed for the mutated anaerobic Clostridial fusant. This also demonstrated that fused strains were amenable to mutation and that the techniques were useful in identifying robust and stable fused strains.

Author Contributions

Y.D. proposed the research and test idea; P.R.: conducted experimental work, collected observations and data, analyzed, and interpreted results, investigation, validation, wrote first manuscript draft; Y.D. and P.R. reviewed methodology, conceptualization, formal analysis of results, investigation; validation; editing and final draft preparation. All authors have read and agreed to the published version of the manuscript.

Funding

We received no specific fund for this study.

Institutional Review Board Statement

Not applicable.

Informed Consent Statement

Not applicable.

Data Availability Statement

The data in this paper are shown in the graphs in the paper.

Acknowledgments

Authors would like to acknowledge financial support from Agriculture and Agri-Food Canada, the Natural Sciences and Engineering Research Council of Canada (NSERC), and the Faculty of Engineering and Architectural Science at Toronto Metropolitan University in Toronto, Canada.

Conflicts of Interest

The authors declare that they have no known competing financial interest or personal relationships that could have appeared to influence the work reported in this paper.

Abbreviations

%RSDPercent relative standard deviation
ABEAcetone-biobutanol-ethanol
CbClostridium beijerinckii
CbCtFused clostrial strain: Cb and Ct
CBMClostridium basal medium
CBPConsolidated bioprocessing
CtClostridium thermocellum
EMSEthyl methane sulphonate
GHGGreen house emissions
HPLCHigh performance liquid chromatography
PEGPolyethylene glycol
SDStandard deviation
SSFSimultaneous saccharification and fermentation
UVUltraviolet
WSWheat straw

References

  1. Walsh, M.E.; Daniel, G.; Shapouri, H.; Slinsky, S.P. Bioenergy crop production in the United States: Potential quantities, land use changes and economic impacts on the agricultural sector. Environ. Resour. Econ. 2003, 24, 313–333. [Google Scholar] [CrossRef]
  2. Sorda, G.; Banse, M.; Kemfert, C. An overview of biofuel policies across the world. Energy Policy 2010, 38, 6977–6988. [Google Scholar] [CrossRef]
  3. Trejo, M.; Bhuyar, P.; Unpaprom, Y.; Dussadee, N.; Ramaraj, R. Advancement of fermentable sugars from fresh elephant ear plant weed for efficient bioethanol production. Environ. Dev. Sustain. 2022, 24, 7377–7387. [Google Scholar] [CrossRef] [PubMed]
  4. Ramaraj, R.; Bhuyar, P.; Intarod, K.; Sameechaem, N.; Unpaprom, Y. Stimulation of natural enzymes for germination of mimosa weed seeds to enhanced bioethanol production. Biotech 2021, 11, 307–313. [Google Scholar] [CrossRef] [PubMed]
  5. Esfandabadi, Z.S.; Ranjbari, M.; Scagnelli, S. The imbalance of food and biofuel markets amid ukraine-russia crisis: A system thinking perspective. Biofuel Res. J. 2022, 9, 1640–1647. [Google Scholar] [CrossRef]
  6. Nigam, P.S.; Singh, A. Production of liquid biofuels from renewable resources. Prog. Energy Combust. Sci. 2011, 37, 52–68. [Google Scholar] [CrossRef]
  7. Dürre, P. Biobutanol: An attractive biofuel. Biotechnol. J. 2007, 2, 1525–1534. [Google Scholar] [CrossRef]
  8. Savage, N. Fuel options: The ideal biofuel. Nature 2011, 474, S9–S11. [Google Scholar] [CrossRef] [Green Version]
  9. Schoutens, G.H.; Nieuwenhuizen, M.C.H.; Kossen, N.W.F. Continuous biobutanol production from whey permeate with immobilized Clostridium beyerinckii LMD 27.6. Appl. Microbiol. Biotechnol. 1985, 21, 282–286. [Google Scholar] [CrossRef]
  10. Formanek, J.; Mackie, R.; Blaschek, H.P. Enhanced Biobutanol Production by Clostridium beijerinckii BA101 Grown in Semidefined P2 Medium Containing 6 Percent Maltodextrin or Glucose. Appl. Environ. Microbiol. 1997, 63, 2306–2310. [Google Scholar] [CrossRef]
  11. Dürre, P. New insights and novel developments in clostridial acetone/ biobutanol/ isopropanol fermentation. Appl. Microbiol. Biotechnol. 1998, 49, 639–648. [Google Scholar] [CrossRef]
  12. Hahn-Hägerdal, B.; Galbe, M.; Gorwa-Grauslund, M.F.; Liden, G.; Zacchi, G. Bio-ethanol–the fuel of tomorrow from the residues of today. Trends Biotechnol. 2006, 24, 549–556. [Google Scholar] [CrossRef] [PubMed]
  13. Syed, K.; Dahman, Y. Novel CLOSTRIDIAL FUSANTS in Comparison with Co-Cultured Counterparts Species for Enhanced Production of Biobutanol using Green Renewable and Sustainable Feedstock. Bioprocess Biosyst. Eng. 2015, 38, 2249–2262. [Google Scholar] [CrossRef] [PubMed]
  14. Begum, S.; Dahman, Y. Enhanced Biobutanol production using novel Clostridial Fusants in simultaneous saccharification and fermentation of green renewable agriculture residues. Biofuels Bioprod. Biorefining 2015, 9, 529–544. [Google Scholar] [CrossRef]
  15. Mohtasebi, B.; Maki, M.; Qin, W.; Dahman, Y. Novel fusants of two and three Clostridia for enhanced green production of biobutanol. Biofuels 2019, 12, 1017–1027. [Google Scholar] [CrossRef]
  16. Helgeson, J.P.; Hunt, G.J.; Haberlach, G.T.; Austin, S. Somatic hybrids between Solanum brevidens and Solanum tuberosum: Expression of a late blight resistance gene and potato leaf roll resistance. Plant Cell Rep. 1986, 5, 212–214. [Google Scholar] [CrossRef]
  17. Gokhale, D.V.; Puntambekar, U.S.; Deobagkar, D.N. Protoplast fusion: A tool for intergeneric gene transfer in bacteria. Biotechnol. Adv. 1993, 11, 199–217. [Google Scholar] [CrossRef]
  18. Sarkar, D.; Schilde-Rentschler, L.; Löffelhardt-Ruoss, B.; Ninnemann, H. An electrofusion-mediated improved method for donor-recipient somatic hybridization in potato (Solanum tuberosum L.). In Recent Trends in Horticultural Biotechnology; New India Publishing Agency: New Delhi, India, 2007; pp. 129–147. [Google Scholar]
  19. Jurgens, G.; Survase, S.; Berezina, O.; Sklavounos, E.; Linnekoski, J.; Kurkijärvi, A.; Väkevä, M.; van Heiningen, A.; Granström, T. Butanol production from lignocellulosics. Biotechnol. Lett. 2012, 34, 1415–1434. [Google Scholar] [CrossRef]
  20. Liu, S.; Qureshi, N. How microbes tolerate ethanol and biobutanol. New Biotechnol. 2009, 26, 117–121. [Google Scholar] [CrossRef]
  21. Qurat-ul-Ain Syed Nadeem, M.; Nelofer, R. Enhanced biobutanol production by mutant strains of Clostridium acetobutylicum in molasses medium. Turk. J. Biochem. 2008, 33, 25–30. [Google Scholar]
  22. Lütke-Eversloh, T.; Bahl, H. Metabolic engineering of Clostridium acetobutylicum: Recent advances to improve biobutanol production. Curr. Opin. Biotechnol. 2011, 22, 634–647. [Google Scholar] [CrossRef] [PubMed]
  23. Zhang, C.; Shen, H.; Zhang, X.; Yu, X.; Wang, H.; Xiao, S.; Wang, J.; Zhao, Z.K. Combined mutagenesis of Rhodosporidium toruloides for improved production of carotenoids and lipids. Biotechnol. Lett. 2016, 38, 1733–1738. [Google Scholar] [CrossRef] [PubMed]
  24. Nochur, S.V.; Roberts, M.F.; Demain, A.L. Mutation of Clostridium thermocellum in the presence of certain carbon sources. FEMS Microbiol. Lett. 1990, 71, 199–204. [Google Scholar] [CrossRef]
  25. Thompson, W.; Meyer, S.; Westhoff, P. How does petroleum price and corn yield volatility affect ethanol markets with and without an ethanol use mandate? Energy Policy 2009, 37, 745–749. [Google Scholar] [CrossRef]
  26. Kenyon, C.J. The bacterial response to DNA damage. Trends Biochem. Sci. 1983, 8, 84–87. [Google Scholar] [CrossRef]
  27. Bowring, S.N.; Morris, J.G. Mutagenesis of Clostridium acetobutylicum. J. Appl. Microbiol. 1985, 58, 577–584. [Google Scholar] [CrossRef]
  28. Lemmel, S.A. Mutagenesis in Clostridium acetobutylicum. Biotechnol. Lett. 1985, 7, 711–716. [Google Scholar] [CrossRef]
  29. Qureshi, N.; Blaschek, H. Evaluation of recent advances in biobutanol fermentation, upstream, and downstream processing. Bioprocess Biosyst. Eng. 2001, 24, 219–226. [Google Scholar] [CrossRef]
  30. Qureshi, N.; Ezeji, T.C. Biobutanol: A superior biofuel production from agricultural residues (renewable biomass): Recent progress in technology. Biofuels Bioprod. Biorefining 2008, 2, 319–330. [Google Scholar] [CrossRef]
  31. Talebnia, F.; Karakashev, D.; Angelidaki, I. Production of bioethanol from wheat straw: An overview on pretreatment, hydrolysis and fermentation. Bioresour. Technol. 2010, 101, 4744–4753. [Google Scholar] [CrossRef]
  32. Qureshi, N.; Saha, B.C.; Hector, R.E.; Hughes, S.R.; Cotta, M.A. Biobutanol production from wheat straw by simultaneous saccharification and fermentation using Clostridium beijerinckii: Part I—Batch fermentation. Biomass Bioenergy 2008, 32, 168–175. [Google Scholar] [CrossRef]
  33. Rogers, P.; Palosaari, N. Clostridium acetobutylicum mutants that produce butyraldehyde and altered quantities of solvents. Appl. Environ. Microbiol. 1987, 53, 2761–2766. [Google Scholar] [CrossRef] [PubMed] [Green Version]
  34. Ikehata, H.; Ono, T. The mechanisms of UV mutagenesis. J. Radiat. Res. 2011, 52, 115–125. [Google Scholar] [CrossRef] [PubMed] [Green Version]
  35. Hillmann, F.; Fischer, R.J.; Saint-Prix, F.; Girbal, L.; Bahl, H. PerR acts as a switch for oxygen tolerance in the strict anaerobe Clostridium acetobutylicum. Mol. Microbiol. 2008, 68, 848–860. [Google Scholar] [CrossRef] [PubMed]
  36. Qureshi, N.; Saha, B.; Cotta, M.A. Biobutanol production from wheat straw hydrolysate using Clostridium beijerinckii. Bioprocess Biosyst. Eng. 2007, 30, 419–427. [Google Scholar] [CrossRef]
  37. Ezeji, T.; Qureshi, N.; Blaschek, H.P. Production of acetone–biobutanol–ethanol (ABE) in a continuous flow bioreactor using degermed corn and Clostridium beijerinckii. Process Biochem. 2007, 42, 34–39. [Google Scholar] [CrossRef]
  38. Fond, O.; Engasser, J.M.; Matta-El-Amouri, G.; Petitdemange, H. The acetone biobutanol fermentation on glucose and xylose. I. Regulation and kinetics in batch cultures. Biotechnol. Bioeng. 1986, 28, 160–166. [Google Scholar] [CrossRef]
  39. El Kanouni, A.; Zerdani, I.; Zaafa, S.; Znassni, M.; Loutfi, M.; Boudouma, M. The improvement of glucose/xylose fermentation by Clostridium acetobutylicum using calcium carbonate. World J. Microbiol. Biotechnol. 1998, 14, 431–435. [Google Scholar] [CrossRef]
  40. Ounine, K.; Petitdemange, H.; Raval, G.; Gay, R. Regulation and biobutanol inhibition of D-xylose and D-glucose uptake in Clostridium acetobutylicum. Appl. Environ. Microbiol. 1985, 49, 874–878. [Google Scholar] [CrossRef] [Green Version]
  41. Fu, C.; Mielenz, J.R.; Xiao, X.; Ge, Y.; Hamilton, C.Y.; Rodriguez, M.; Wang, Z.Y. Genetic manipulation of lignin reduces recalcitrance and improves ethanol production from switchgrass. Proc. Natl. Acad. Sci. USA 2011, 108, 3803–3808. [Google Scholar] [CrossRef] [Green Version]
  42. Baronofsky, J.J.; Schreurs, W.J.; Kashket, E.R. Uncoupling by acetic acid limits growth of and acetogenesis by Clostridium thermoaceticum. Appl. Environ. Microbiol. 1984, 48, 1134–1139. [Google Scholar] [CrossRef] [PubMed]
  43. Shoemaker, S.P.; Pierson, M.D. “Phoenix phenomenon” in the growth of Clostridium perfringens. Appl. Environ. Microbiol. 1976, 32, 803–807. [Google Scholar] [CrossRef] [PubMed] [Green Version]
  44. Costa, J.M.; Moreira, A.R. Growth inhibition kinetics for the acetone-biobutanol fermentation. In ACS Symposium Series; ACS Publication: Washinton, DC, USA, 1983. [Google Scholar]
  45. Leung, J.C.Y.; Wang, D.I.C. Production of acetone and biobutanol by Clostridium acetobutylicum in continuous culture using free cells and immobilized cells. Appl. Microbiol. Biotechnol. 1981, 1, 348–352. [Google Scholar] [CrossRef]
  46. Friedberg, E.C.; Walker, G.C.; Siede, W. DNA Repair and Mutagenesis; American Society for Microbiology: Washington, DC, USA, 1995; ISBN 1-55581-319-4. [Google Scholar]
  47. Aghbashlo, M.; Khounani, Z.; Hosseinzadeh-Bandbafha, H.; Gupta, V.K.; Amiri, H.; Lam, S.S.; Morosuk, T.; Tabatabaei, M. Exergoenvironmental analysis of bioenergy systems: A comprehensive review. Renew. Sustain. Energy Rev. 2021, 149, 111399. [Google Scholar] [CrossRef]
  48. Soltanian, S.; Aghbashlo, M.; Almasi, F.; Hosseinzadeh-Bandbafha, H.; Nizami, A.S.; Ok, Y.S.; Lam, S.S.; Tabatabaei, M. A critical review of the effects of pretreatment methods on the exergetic aspects of lignocellulosic biofuels. Energy Convers. Manag. 2020, 212, 112792. [Google Scholar] [CrossRef]
Figure 1. Cell count of CbCt after mutagenesis with EMS.
Fermentation 09 00092 g001
Figure 2. Cell count of EMS-mutated CbCt cells in contact with 15 g/L of Butanol.
Fermentation 09 00092 g002
Figure 3. CbCt surviving fraction and relative frequency of induced mutation from EMS contact.
Fermentation 09 00092 g003
Figure 4. CbCt Cell count after mutagenesis with UV radiation.
Fermentation 09 00092 g004
Figure 5. CbCt Cell count of EMS-mutated cells in contact with 15 g/L of Butanol.
Fermentation 09 00092 g005
Figure 6. CbCt surviving fraction and relative frequency of induced mutation from UV exposure.
Fermentation 09 00092 g006
Figure 7. CbCt Cell count for samples grown in aerobic conditions compared with sample grown in anaerobic conditions.
Fermentation 09 00092 g007
Figure 8. Individual sugar consumption profiles of strain S1 during SSF of WS.
Fermentation 09 00092 g008
Figure 9. Cell concentrations of different strains over 120 h of SSF.
Fermentation 09 00092 g009
Table 1. Maximum individual sugar concentrations consumed by mutated strains during SSF of WS.
StrainMutation ParametersGlucoseXyloseArabinoseMannoseGalactoseTotal Sugar (g/L)
Maximum * (g/L)Final (g/L)Maximum (g/L)Final (g/L)Maximum (g/L)Final (g/L)Maximum (g/L)Final (g/L)Maximum (g/L)Final (g/L)
S1Control25.60.5212.95.764.201.6502.20.8739.77
S210 min UV27.10.50135.714.201.6702.20.8841.26
S315 min UV25.90.612.65.744.50.011.502.20.8939.88
S420 min EMS26.40.5614.25.744.390.021.2602.21.0239.53
S540 min EMS26.90.5214.35.734.30.031.350.012.21.0540.11
S650 min EMS26.70.51135.774.210.011.640.012.20.939.77
S760 min EMS25.90.5312.95.914.190.021.40.012.21.0438.47
* Concentration value of sugar used for calculating total and percentage sugar consumption.
Table 2. Comparison of sugar consumption and ABE yield for all strains during SSF of WS.
StrainTotal Sugar Consumed (g/L)ABE Yield (g/gsugars) *Total ABE Yield
Acetone YieldButanol YieldEthanol Yield
S139.770.150.3420.0570.55
S241.260.1740.3580.0670.60
S339.880.170.3560.0650.59
S439.530.1720.3460.0600.57
S540.110.1720.3610.0620.59
S639.770.1730.3570.0600.59
S738.470.1710.3560.0620.59
* Calculated based on total sugars consumed during fermentation using the different strains.
Table 3. Biobutanol production comparative analysis table with previously published literature.
Reference/NotesFeedstockMicrobialBiobutanol (g/L)
Qureshi and Ezeji, 2008 (Ref. [30])GlucoseCb13
Qureshi et al., 2007 (Ref. [36])WSCb7.4
Dahman et al., 2019 (Ref. [15])WSCbCt13.82
Dahman et al., 2015 (Ref. [13])WSCbCt13.81
Current Study (Sample S2-UV)WSCbCt mutated15.0
Current Study (Sample S4-EMS)WSCbCt mutated14.7
Disclaimer/Publisher’s Note: The statements, opinions and data contained in all publications are solely those of the individual author(s) and contributor(s) and not of MDPI and/or the editor(s). MDPI and/or the editor(s) disclaim responsibility for any injury to people or property resulting from any ideas, methods, instructions or products referred to in the content.

