Article

Improving the Functionality of Lentil–Casein Protein Complexes through Structural Interactions and Water Kefir-Assisted Fermentation

1
Food Technology Division, School of Industrial Technology, Universiti Sains Malaysia, USM 11800, Penang, Malaysia
2
Applied Science Research Center, Applied Science Private University, Amman 11937, Jordan
3
Renewable Biomass Transformation Cluster, School of Industrial Technology, Universiti Sains Malaysia, USM 11800, Penang, Malaysia
4
Department of Nutrition and Food Technology, Faculty of Agriculture, Jordan University of Science and Technology, Irbid 22110, Jordan
5
School of Food Science, Nutrition and Family Studies, Faculty of Health Sciences and Community Services, Université de Moncton, Moncton, NB E1A 3E9, Canada
6
Department of Community Health Sciences, College of Applied Medical Sciences, King Saud University, P.O. Box 10219, Riyadh 11433, Saudi Arabia
7
Department of Human Nutrition and Dietetics, College of Health Sciences, Abu Dhabi University, Zayed City, Abu Dhabi P.O. Box 59911, United Arab Emirates
8
School of Physics, Universiti Sains Malaysia, USM 11800, Penang, Malaysia
9
Department of Agricultural Biotechnology, Faculty of Agricultural Sciences and Technology, Palestine Technical University-Kadoorie (PTUK), Jaffa Street, Tulkarm P.O. Box 7, Palestine
*
Authors to whom correspondence should be addressed.
Fermentation 2023, 9(2), 194; https://doi.org/10.3390/fermentation9020194
Submission received: 29 January 2023 / Revised: 14 February 2023 / Accepted: 15 February 2023 / Published: 20 February 2023
(This article belongs to the Special Issue Fermentation Processes: Modeling, Optimization and Control)

Abstract

:
Highly nutritious lentil proteins (LP) have recently attracted interest in the food industry. However, due to their low solubility, extensive application of LP is severely limited. This study describes a new and successful method for overcoming this challenge by improving the nutritional–functional properties of LP, particularly their solubility and protein quality. By combining protein complexation with water kefir-assisted fermentation, the water solubility of native LP (~58%) increases to over 86% upon the formation of lentil–casein protein complexes (LCPC). Meanwhile, the surface charge increases to over −40 mV, accompanied by alterations in secondary and tertiary structures, as shown by Fourier-transform infrared and UV-vis spectra, respectively. In addition, subjecting the novel LCPC to fermentation increases the protein digestibility from 76% to over 86%, due to the reduction in micronutrients that have some degree of restriction with respect to protein digestibility. This approach could be an effective and practical way of altering plant-based proteins.

1. Introduction

Population expansion has recently boosted the focus on highly nutritious plant-based proteins. Plant-based proteins, particularly those from legumes, have been utilized to replace protein from animal sources. The main components of lentil proteins (LP) are globulins, albumins, glutelins, and prolamins, representing about 70, 16, 11, and 3%, respectively [1]. The limited use of LP in food industries is due to their low water solubility, i.e., ~58% [2], and their poor protein digestibility, i.e., ~76% [3]. Many features make proteins useful, but one of the most significant is their water solubility. Comprehensive investigations into the production of soluble biopolymers based on protein–protein interactions (PPIs) have emphasized the increase in water solubility [4,5,6].
The pH of an aqueous solution is also a major factor in the solubility of the protein. Molecular forces govern interactions between proteins, which are electrostatic interactions, hydrogen bonds, and hydrophobic interactions; as a result, these interactions can modify water solubility [4,6] and the emulsion of the proteins [7].
The water solubility of protein increases during the protein–protein interaction process, based on the higher activity of electrostatic repulsion more than hydrophobic interactions between the polymers of proteins. Hydrophobic interactions in an aqueous solution can also enhance PPI. Different types of protein, such as casein proteins (CP), are remarkably affected by the exposed hydrophobic amino acids between the non-polar groups of the protein [8]. PPI in solution is classified as one of the most effective methods for improving the functionality of plant-based proteins. Food manufacturers are increasingly turning to plant-based proteins for their low impact on the environment and low cost [4]. As a result, several researchers are interested in enhancing the water solubility of lentils [2] and rice protein [5].
Protein digestibility is widely regarded as the most important means of evaluating protein quality, because it influences amino acid absorption, availability, and hydrolysis. Therefore, proteins with a higher digestibility have higher nutritional value than proteins with a lower digestibility because they provide more dietary value, including the ability to have more amino acids available for absorption. According to Azi et al. [9] and Alrosan et al. [10], water kefir-assisted fermentation plays a major role in modifying the bioavailability and bioaccessibility of proteins and micronutrients. These modifications depend on the type of fermenting microorganisms (e.g., Streptococcus, Lactococcus, Leuconostoc, and Lactobacillus spp.) and their enzymes, which can alter the level of nutritive and non-nutritive compounds during the fermentation [11].
Water kefir grains are the most popular source of bacteria used in fermented compounds, including protein, carbohydrates, and food matrices, because of the presence of many lactic acid bacteria, acetic acid bacteria, as well as yeasts. Thus, this study aimed to investigate the combination of two main techniques. In the first stage, PPI was investigated to prepare soluble protein complexes based on LP and CP complexation. Secondly, water kefir-assisted fermentation was carried out on the lentil–casein protein complexes (LCPC) generated to enhance their nutritional characteristics. Analyses were studied in detail to investigate the mechanism of the formation of novel LCPC and the structure-function relationship of the fermented LCPC.

2. Materials and Methods

Lentil seeds, CP, and kefir seeds were obtained from iHerb (Moreno Valley, CA, USA). These materials were transported to the laboratories appropriately, as suggested by the seller, and kept at 4 °C until needed.

2.1. Extraction of LP

LP were extracted according to Jarpa-Parra et al. [1]. The fine lentil flour was produced by grinding the lentil seeds in an ultra-centrifugal mill (RETSCH, ZM 200, Visalia, CA, USA). The fine lentil flour was then mixed with distilled water at a ratio of 1:10 (w/v). The pH of the slurry was then adjusted to pH 9.5 using 0.1 M NaOH on a stirring apparatus (Joan Lab, SH-4, Huzhou City, China) for 2 h. The slurry was centrifuged (CN Meditech, CNME060222, Nanjing, China) for 15 min at 8500× g. The pH of the supernatant was adjusted to pH 4.2 using 0.1 M HCL and left to precipitate for 24 h before centrifuging at 1590× g for 30 min to separate the insoluble particles. The precipitate was then lyophilized (Hawach Scientific, ILFD55EH-20A, Shanxi, China). The lyophilized LP were kept at 4 °C. The protein content of the LP (62.91 ± 1.82%) was then determined using the Kjeldahl method [12].

2.2. Protein Complexation

Protein complex (1%, w/v) was prepared from LP and CP with distilled water (Figure 1). The percentage of CP in the protein suspension was 10, 33, and 50%. The pH of the protein suspension was adjusted to 12.0 using 0.5 M NaOH and left on an SH-4 stirrer for 60 min, and then the pH was readjusted to 7.0 using 0.05 M HCL. After that, the protein suspension was centrifuged at 7000× g for 10 min. The collected supernatant was then lyophilized. The control was prepared using LP and was subjected to the same protein complexation process as described above, but without the addition of CP, to evaluate the impact of pH recycling on LP.

2.3. Water Solubility

The water solubility of protein was investigated using the methods described by Morr et al. [13]. The protein sample (200 mg) was mixed with distilled water (18 g), and then the pH was adjusted to pH 7.0 (using 0.1 M HCL or NaOH), followed by stirring at 1000 rpm for 60 min using the SH-4 stirrer. Ten minutes before the end of stirring, the weight of the protein solution was adjusted to 1% using distilled water. The Kjeldahl method [12] was used to determine the nitrogen content. The water solubility was calculated using Equation (1).
Water solubility (%) = (NS/NT) × 100
where NS is the amount of nitrogen in the supernatant and NT is the amount of nitrogen in the sample before centrifugation.

2.4. Spectral Acquisition

2.4.1. Fourier-Transform Infrared Spectroscopy (FTIR)

The amide I group of LP, CP, and LCPC was determined using FTIR spectra, as described by Alrosan et al. [3]. The FTIR spectra (amide group I) were analyzed for β-sheets (at 1600–1639 cm−1), random coils (RC) (at 1640–1649 cm−1), α-helices (at 1650–1660 cm−1), and β-turns (at 1661–1699 cm−1).

2.4.2. Spectrofluorometry

The protein samples were prepared with distilled water at a ratio of 0.001% (w/v) and scanned using a fluorescence spectrophotometer (Agilent, Cary Eclipse, Santa Clara, CA, USA). The wavelengths of intrinsic fluorescence and excitation of spectra were set at a range of 300 to 450 nm and 280 nm, respectively. In addition, the bandwidths of emission and excitation were set at 10 nm.

2.4.3. Non-Covalent Forces

The contributions of hydrogen bonds, hydrophobic interactions, and electrostatic interactions were obtained according to Alrosan et al. [2]. First, 10 mM sodium dodecyl sulfate (SDS), thiourea, and NaCl were added separately to the protein suspension (1%, w/v) with the distilled water to determine the hydrophobic interactions, hydrogen bonding, and electrostatic interactions, respectively. Then, the pH was adjusted to 12.0 for 60 min, readjusted to 7.0, and the protein solution was scanned using the Cary Eclipse fluorescence spectrophotometer. The wavelengths of emission and excitation of spectra were set at a range of 300 to 450 nm and 280 nm, respectively. In addition, the bandwidths of emission and excitation were set at 10 nm.

2.4.4. Surface Hydrophobicity (H0)

The surface hydrophobicity of protein samples (at different pH and ratios of LP:CP) was obtained according to the methods of Johnston et al. [14] with slight modifications. The procedure involved the addition of 100 mg of each protein sample to sodium phosphate (10 mm) in a beaker, followed by stirring on the SH-4 magnetic stirrer for 120 min at room temperature. Then, the calibration curve was prepared by diluting each protein solution from 0.1 to 0.01% (w/v). In a centrifuge tube, each serially diluted protein sample (4 mL), sodium phosphate (10 mM), and 8-anilino-1-naphthalene sulfonic acid (ANS; 20 μL, 8 mM) was added and then vortexed for 10 s. Finally, samples were transferred to a dark place for 15 min before injecting them. The emission and excitation wavelengths of the fluorescence spectra are 470 and 390 nm, respectively; the slit wavelength of emission and excitation was set at 1 nm. In addition, protein solutions of each concentration were prepared without ANS and blank ANS to calculate the fluorescence intensity (FI) of each calibration curve value concentration by subtracting it from the FI of each sample that contained ANS for all calibration curve values. The linear regression of FI for a sample against protein concentration was measured, which has been utilized as an indicator of the average H0 of each protein sample.

2.4.5. Ultraviolet-Visible Spectroscopy

In this study, a UV-vis spectrophotometer (Shimadzu, UV-3600, Kyoto, Japan) was used to measure the unfolding and folding of proteins in control samples and protein complexes (different ratios of the protein complex and different pH values) between the wavelengths of 190 and 350 nm.

2.5. Zeta Potential

Zeta potential analyzer (Malvern Panalytical, Mastersizer 2000, Malvern, UK) was used to determine the surface charge of protein samples (0.05%, w/v) based on the procedure described by Johnston et al. [14]. The dispersant was distilled water with a refractive index of 1.330, while the protein sample had a refractive index of 1.450.

2.6. Scanning Electron Microscopy (SEM)

The surface morphology of protein samples was obtained based on the SEM (Leo Supra 50, Carl Zeiss, Oberkochen, Germany) under vacuum conditions (5–10 kV). Platinum layers (10 nm) were used to cover the metal substrates on which the protein powders were cast.

2.7. Preparation of Water Kefir

In brief, brown sugars (100 g) and kefir seeds (50 g) were combined with distilled water (1000 mL). The mixture was then fermented in a refrigerated incubator (Faithful, SPX-70 BIV, Shanghai, China) at 25 °C for 72 h. The mixture was shaken three times a day (every 8 h) during the incubation to keep the kefir seeds viable. Using a sterile sieve, the water kefir was isolated from the kefir seeds.

2.8. Preparation of Fermented Lentil–Casein Protein Complex

Lentil–casein protein complex at a ratio of 1.0:0.1 (LCPC 1.0:0.1) was selected to study the effects of water kefir-assisted fermentation on its pH, composition (sugars and phenolic compounds), protein quality (protein digestibility and secondary protein components), and microbiological qualities. The fermented protein mixture, consisting of LCPC 1.0:0.1 (1%, w/v), distilled water (95%), and water kefir (5%), was placed in a 250 mL flask and incubated for 5 days at 25 °C in the SPX-70 BIV refrigerated incubator. The mixture was shaken three times a day (every 8 h) during the incubation.

2.9. pH and Total Soluble Solids (TSS)

A pH meter (Apera Instruments, PH820, Columbus, OH, USA) and a digital refractometer (Hanna Instruments, HI96841, RI, USA) were used to determine the pH and TSS (expressed as °Brix) of the unfermented and fermented LCPC, respectively.

2.10. Protein Digestibility

The protein digestibility of unfermented and fermented LPCP was measured using the procedure used by Almeida et al. [15]. Fermented samples were collected every 24 ± 1 h. Samples (250 mg) and pepsin (1.5 mg/mL) were dispersed in HCl (15 mL, 0.1 M) before being heated at 37 °C for 3 h using a water bath (Memmert, WB22, Schwabach, Germany). To suppress microorganisms’ growth in the protein, the mixtures were added with 1 mL of sodium azide (0.005 M) and 7.5 mL of NaOH (0.5 M). Pancreatin (10 mg) and 10 mL of phosphate buffer (0.2 M, pH 8.0) were added to the mixtures. Finally, the mixtures were incubated at 37 °C for 24 h. After the incubation, the mixtures were centrifuged at 10,000× g for 20 min using the CNME060222 centrifuge. The protein digestibility (expressed in %) of fermented and unfermented LPCP was determined based on the Kjeldahl method [12] and calculated according to Equation (2).
Protein digestibility = [(NSNB)/NT] × 100%
where NT represents the nitrogen of the sample before centrifugation, NB represents the nitrogen in the blank sample, and NS represents the nitrogen in the supernatant of the sample after centrifugation.

2.11. Determination of the Nutrients of Fermented Protein Complexes

2.11.1. Phenolic Compounds

Phenolic compounds, such as catechin, sinapic acid, chlorogenic acid, quercetin, rutin, caffeic acid, gallic acid, epicatechin, ferulic acid, and ferulic acid, in the unfermented and fermented LCPC were measured based on the procedure by Alrosan et al. [3]. In brief, protein dispersions (1 mL) blended with methanol (8 mL) were prepared. The mixtures were then sonicated (Elma Electronic, EP10H, Hamburg, Germany) for 3 min at 35 °C. After sonication, the mixtures were kept at 4 °C until the residues turned white. Then, the mixtures were centrifuged at 10,000× g for 15 min using the CNME060222 centrifuge. The supernatants collected were filtered using a syringe filter (0.22 µm) before HPLC analysis. Sample preparation was carried out in a dark environment.
The phenolic components were analyzed using HPLC (Agilent, 1200 series, East Brunswick, NJ, USA) based on a Plus C18 column (4.6 mm × 250 mm) to separate the phenolic compounds with flow rate (0.7 mL/min) and injection volution (40 µL). Acetonitrile was used as mobile phase A, and acetic acid (1%) in distilled water was used as mobile phase B. The profile setting of HPLC was 95% mobile phase A (0 to 24 min), 85% mobile phase A (25 to 41 min), 78% mobile phase A (42 to 60 min), and 95% mobile phase A (65 min). Phenolic compounds were measured at two different wavelengths, 254 and 272 nm.

2.11.2. Total Phenolic Content (TPC) and Total Saponin Content (TSC)

A UV-3600 UV-vis spectrophotometer was used to read the TPC of unfermented and fermented LCPC based on the procedure of Alrosan et al. [3]. every 24 h for 5 days. Protein samples (100 µL) were combined with Folin–Ciocalteu reagent (500 µL) and distilled water (8.4 mL) in test tubes, followed by a 4 min vortex. Then, 1 mL of sodium carbonate (5%) was added, followed by the mixtures and vortex for another 4 min. The mixtures were kept in the dark for 1 h. The absorbance of the samples was read at 725 nm. The TPC was expressed as mg of gallic acid equivalent per 100 g (mg GAE/100 g).
The TSC content was measured using the UV-3600 UV-vis spectrophotometer based on the procedure by Alrosan et al. [3]. In brief, protein samples were mixed with (400 µL), perchloric acid (800 µL), and vanillin–glacial acetic acid (5%, 200 µL) in glass tubes and then heated in a water bath at 70 °C for 15 min. The heated mixtures were then cooled in an ice bath. After cooling, 500 µL of glacial acetic acid was added. The absorbance of the samples was read at wavelength 546 nm. The calibration curve range was between 6.25 to 600 µg/mL, using oleanolic acid as a reference. TSC was expressed as mg of oleanolic acid per 100 g (mg OAE/100 g).

2.11.3. Determination of Sugars

The glucose, sucrose, and fructose contents in the unfermented and fermented LCPC were measured using the Agilent 1200 series HPLC based on Alrosan et al. [3]. Samples (1 mL) were mixed with distilled water (1 mL) and vortexed for 10 min before centrifugation (Kubota, S700TR, Tokyo, Japan) at 15,000× g for 10 min. The supernatants were filtered using syringe filters (0.45 m). These simple sugars were separated using a Cosmosil Sugar-D column (4.6 mm × 250 mm) at 40 °C. A mixture of acetonitrile and distilled water (3:1, v/v) was used as the mobile phase. The injection volume and flow rate were set at 20 µL and 1.2 mL/min, respectively.

2.12. Microbiological Quality

Enumeration of yeasts, lactic acid bacteria (LAB), and acetic acid bacteria (AAB) in the unfermented and fermented protein complexes was performed using the spread plate method. Each sample was diluted step by step, and 1 mL of each dilution was used to infect a solid medium by spreading it twice. Potato dextrose agar (PDA) under aerobic conditions at 25 °C for 48 h was used to determine the yeasts content, while MRS agar at 37 °C for 24 h under anaerobic conditions was used to determine the LAB and AAB contents, respectively.

2.13. Statistical Analysis

The data analysis was conducted using SPSS program version 23.0 (Chicago, IL, USA). Duncan’s multiple range test and one-way ANOVA were used; differences were considered significant at p < 0.05.

3. Results and Discussion

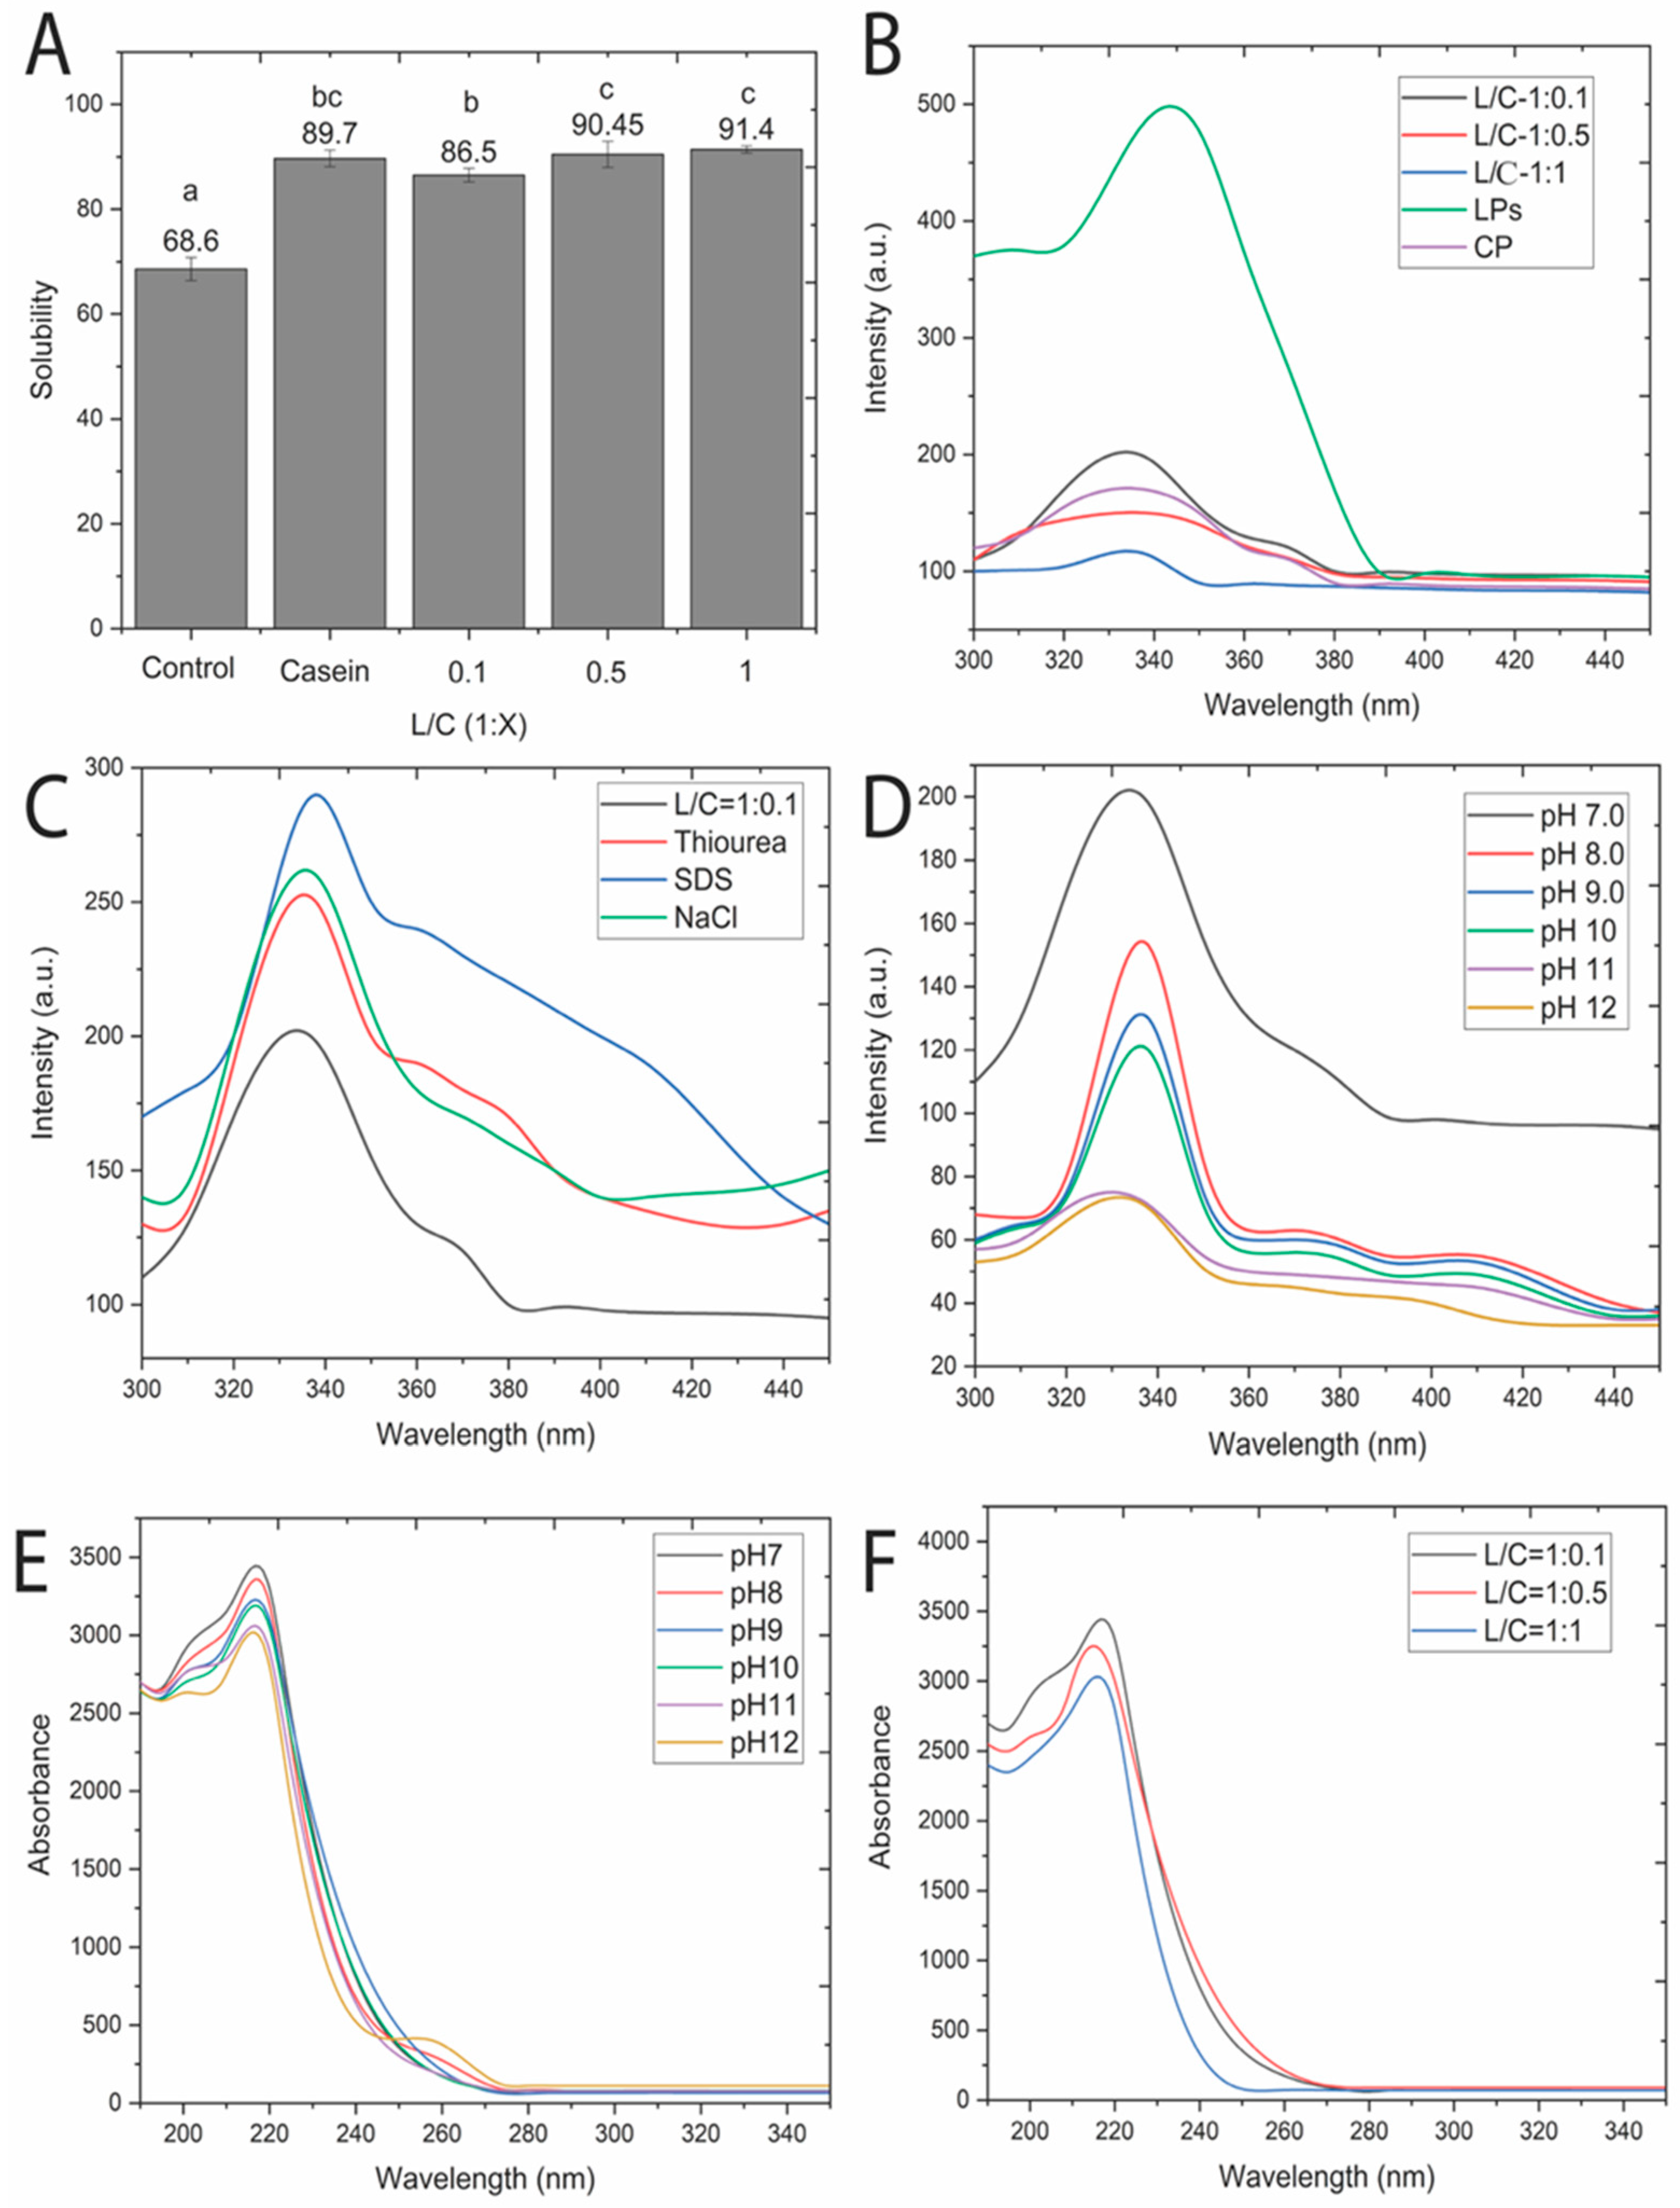
3.1. Solubility of Lentil–Casein Protein Complexes (LCPC)

The fundamental limitation of applying LP in the food sector is its low solubility in water. The first purpose of this research was to generate soluble protein complexes based on LP through protein complexation with CP. After the complexation of LP (90%) with CP (10%), the solubility of the LCPC jumped to over 86.5%. The water solubility of the control sample was ~68.6% and continued to increase to over 91.4% when the proportion of CP in the protein complexes was increased to 50%. Upon exceeding 50%, the addition of more CP resulted in an insignificant increase (p > 0.05) in the water solubility of the LCPC (Figure 2A). Meanwhile, when the proportion of CP in the LCPC was less than 10%, the complexes formed were mostly precipitated. They could be seen visually even before centrifugation. Consequently, LCPC comprising <10% and >50% CP was omitted from this study.

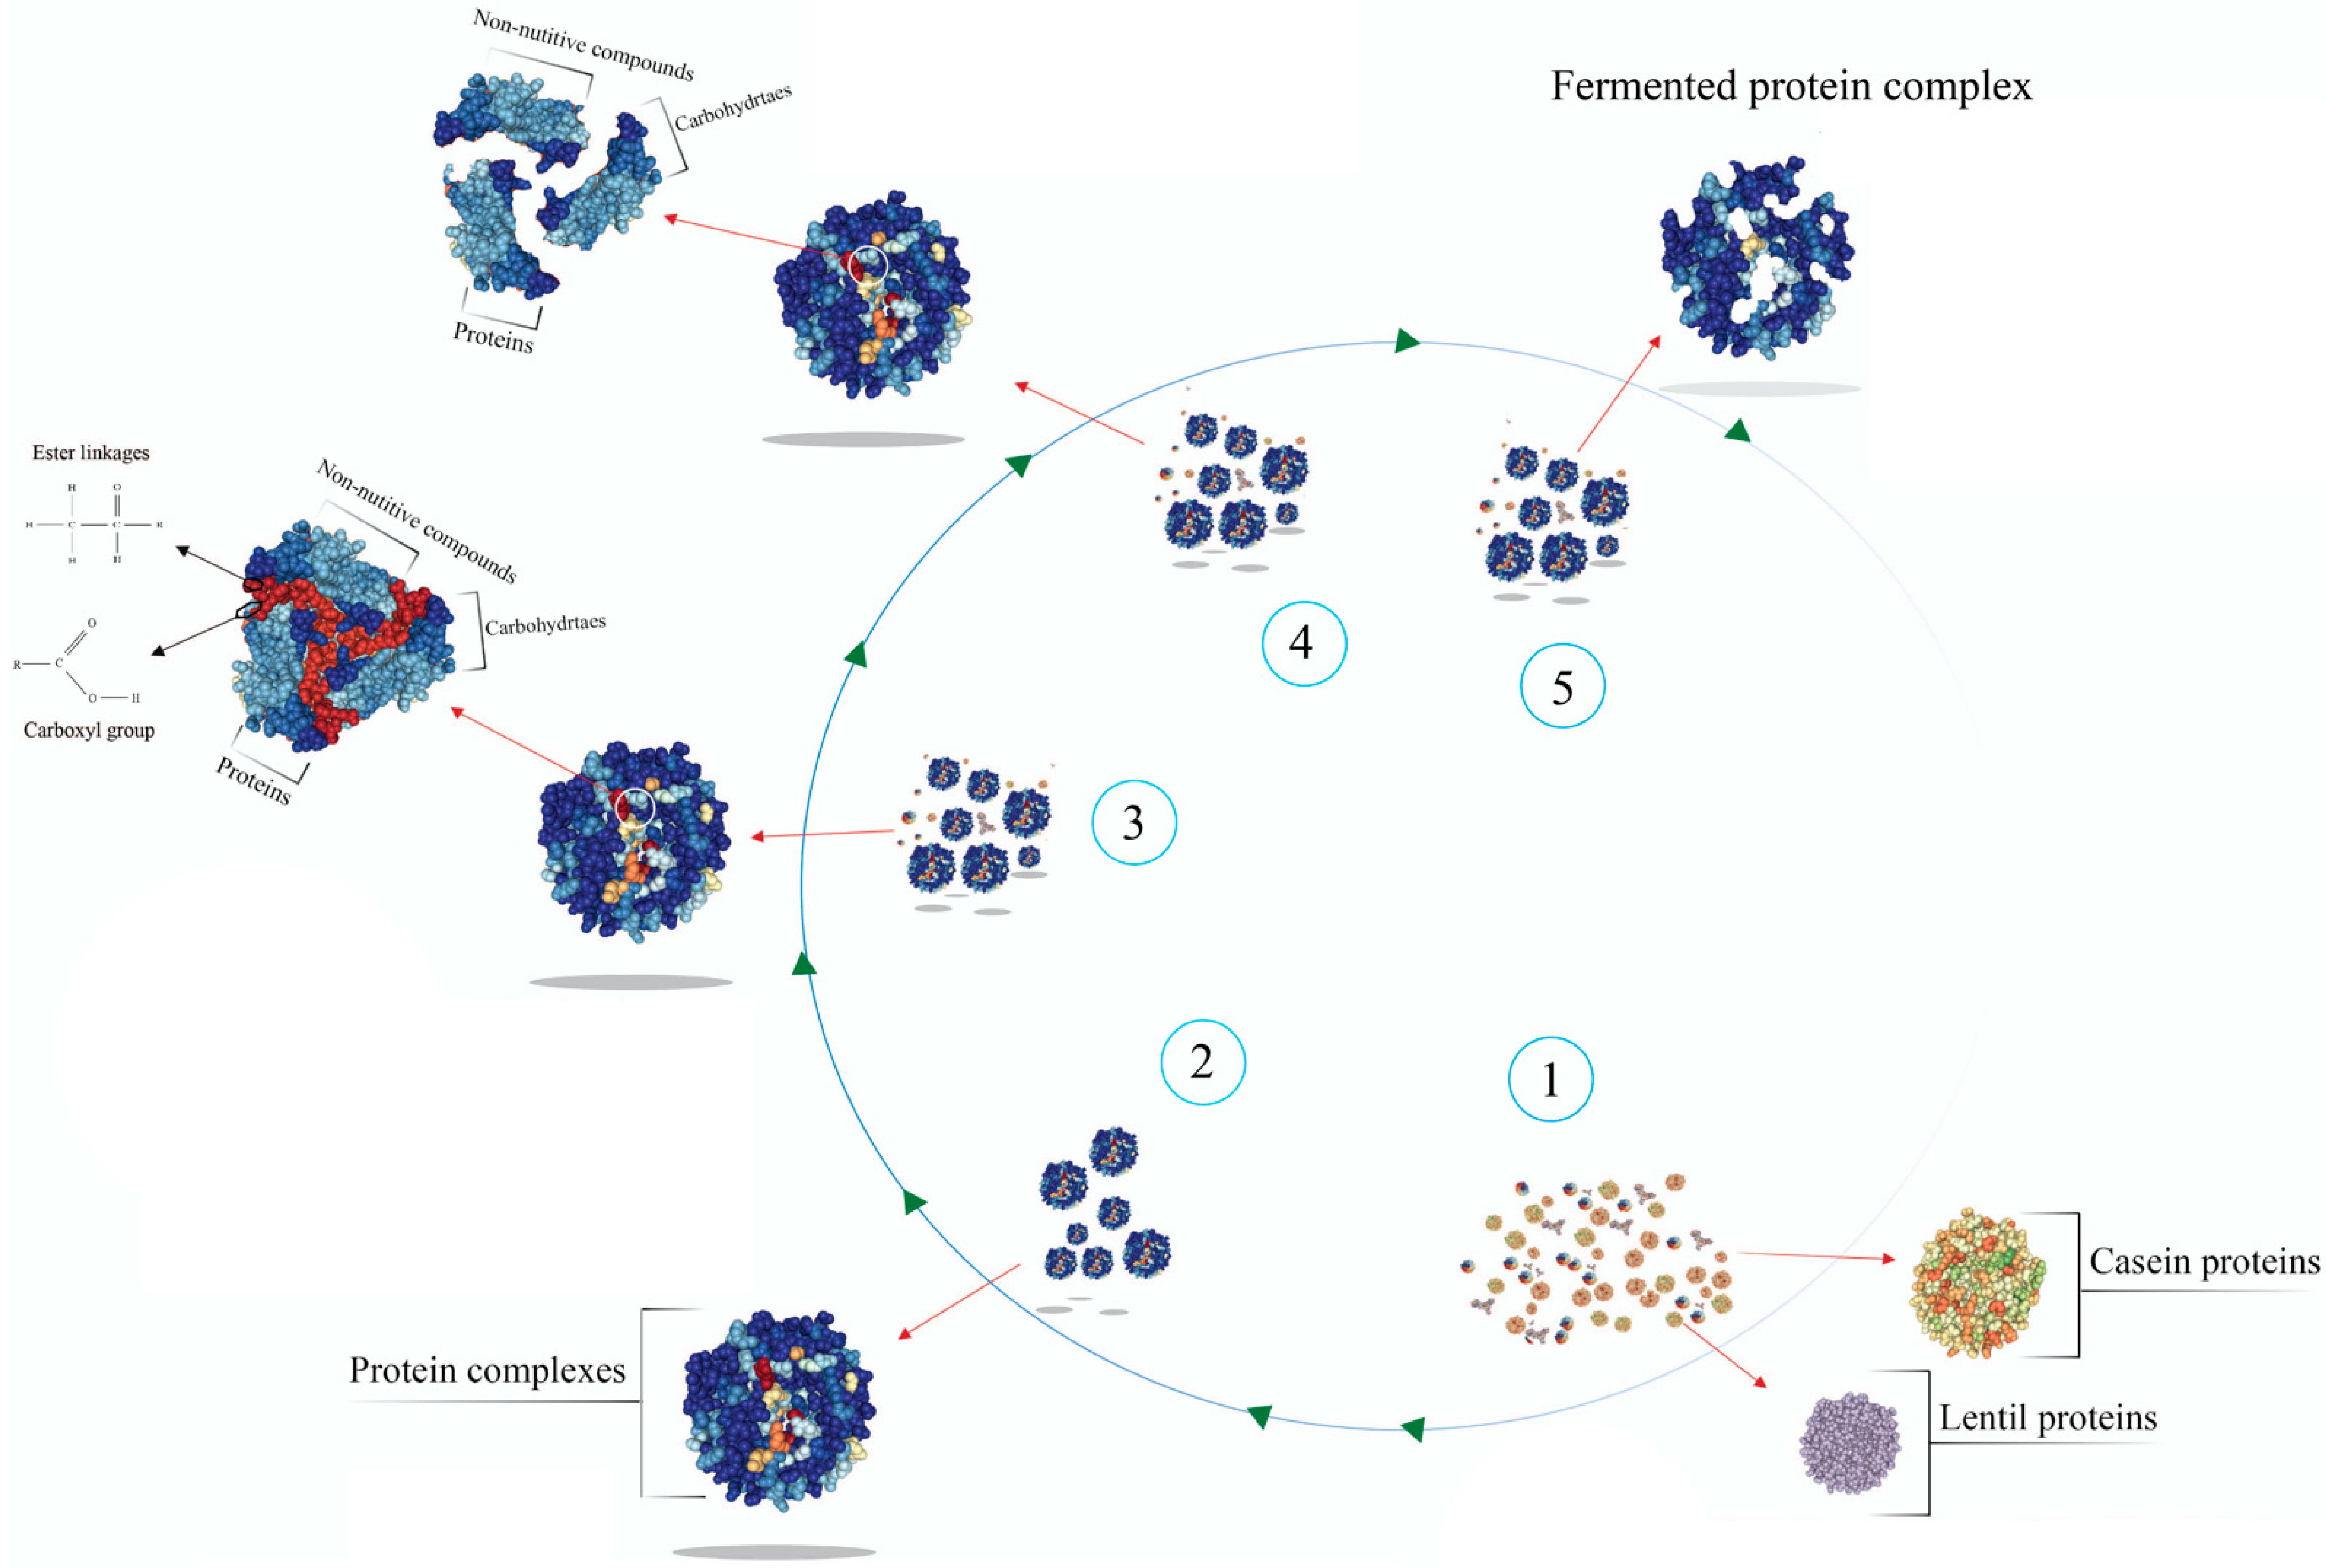
3.2. LP and CP Interaction

CPs have been utilized as co-proteins to increase the solubility of plant-based proteins, such as rice proteins, soya proteins, and LPs, through PPI [4]. The generation of a new protein structure was demonstrated by analyzing the protein structure of protein complexes. The emission and excitation of tryptophan residues in protein complexes at 340 and 280 nm, respectively, was used to acquire spectra to quantify the interactions between the proteins. The fluorescence spectra of the LP show that the maximum peak intensity (Fmax) was at emission and excitation wavelengths of 340 and 280 nm, respectively. After LP interacted with CP, the spectrophotometric intensity was reduced (Figure 2B). The spectrophotometric intensity of LCPC decreased following protein complexation with increasing proportions of CP. PPI has been proven to decrease the fluorescence intensity of protein structure formation [6]. Therefore, the emission shift after the LP with CP interaction shows the existence of protein interactions in the development of protein complexes. The fluorescence intensity of protein complexes dropping to less than that of the control sample could be due to electrons being transmitted to electron-deficient groups from electron-rich aromatic amino groups [4,6].
Furthermore, observations using FTIR spectroscopy revealed a change in the components of the secondary protein structure of the LCPC (Table 1). Protein complexation between LP and CP was demonstrated in this study. Molecular forces are vital in binding proteins, and understanding the molecular forces involved in forming protein complexes is of much interest in this study. The protein solution contained foreign components, such as NaCl, SDS, and thiourea, to measure the contributions of the electrostatic forces, hydrophobic forces, and hydrogen bonds, respectively. As a result, of the interplay, the stabilization of the structure improved the fluorescence (Figure 2C). These results suggest that these foreign compounds facilitated interconnections between LP and CP and, at the same time, controlled hydrogen bonds and electrostatic and hydrophobic interactions. The Fmax of the enriched protein complex suspension decreased in the order of SDS > NaCl > thiourea. The Fmax was at a maximum for LCPC containing SDS. Thus, hydrophobic bonds, electrostatic forces and hydrogen bonds significantly impact the interaction between the complexation of LP with CP. Hence, it can be hypothesized that protein complexes are affected by hydrogen bonds, as well as electrostatic and hydrophobic bonds, to a lesser extent.

3.3. Structural Folding of Protein Complexes

The fluorescence spectrum of protein complexes can reveal information about their structural microenvironment. An alteration in the novel protein complex structure (especially tertiary structure) between LP and CP might be represented using fluorescence emission with excitation of tryptophan residues at 280 nm [16]. Usually, the tryptophan residues present in non-polar environments of proteins have a maximum emission (Fmax) of <330 nm. LCPC 1.0:0.1 remained neutral in an alkaline environment (above pH 11) (Figure 2D). The results showed that tryptophan could be exposed to solvents disregarding the pH variations. These outcomes are determined by the level of binding between both proteins [4,8]. The fluorescence intensity gradually increased as the protein solution readjusted the pH to 7.0 (Figure 2D). The proteins, however, were reconstituted into relatively high structures of novel LCPC [2,4,8]. The increased co-compounds in the protein complexes formed resulted in a decrease in the Fmax [4,5,6]. In addition, PPI reduced fluorescence intensity as the ratio of CP in protein complexes increased (Figure 2B).
Protein complexes made of LP and CP exhibited significant (p < 0.05) modification, especially for α-helices and RC (Table 1). Protein interfaces and multilayer interfaces depend on their α-helix components, which are dependent on molecular forces between the component of secondary protein structures [4,17]. Tomczyńska-Mleko et al. [18] explained that in the association between solution pH and the α-helix component of whey protein isolate, pH plays a major role in the increased unfolding and surface activity of proteins and decreases their α-helix components. The amount of α-helix components decreased after complexation between LP and CP, decreasing with increasing ratio of CP in the protein complexes. The percentage of β-sheets and β-turns made up of amino acid residues for each component is approximately two-thirds. The β-turns and β-sheets presented no significant differences (p > 0.05) after complexation with CP (Table 1), suggesting that the β-structure could be amphipathic, changing hydrophobic and hydrophilic residues that produce hydrophobic and hydrophilic subunits, respectively.
UV spectra can detect protein conformations of protein complexes. The high degree of folding in protein structures has a reciprocal association with an increase in the absorbance at 230 nm (A230) [2,4,5,6], whereby the A230 increased with decreasing pH value of the protein suspension, indicating that the protein structure had been successfully refolded (Figure 2E). The reconstruction of LCPC might be enabled by decreasing the A230 for pH recycling (from pH 12 to 7), whereas A230 of all LCPC increased on neutralization of the protein solution (decreasing in the pH of the protein solution), as observed in Figure 2E. The most significant development happened whenever the pH was reduced from pH 8 to 7, since the structure around these pH values was responsible for the most refolding. Consequently, incorporating CP rendered the LP robust to refolding (Figure 2F).
With an increase in the proportion of CP, the extent of the tertiary structure of protein complexes decreases when the pH reaches 7.0. Due to the contribution of various synergistic effects, e.g., structural interaction between LP and CP occurring during the protein complexation, which varies depending on secondary protein structural components and tertiary structure, the protein complexation was not even begun by layering CP on the surface of LP. Synergistic interactions or PPIs result in the generation of a more consistent structure with each protein separately [2,6].
The mechanisms of PPI between LP and CP by structural interactions are illustrated in Figure 3. Negatively charged sites in proteins react electrostatically, removing all protons from the surface of proteins, resulting in restriction of some of the molecular forces, such as hydrophobic and ionic interactions in an alkaline environment [2,4]. Under the neutral pH of the protein solution, molecular forces, such as hydrophobic and electrostatic interactions and hydrogen bonds, were active during neutralization. Based on our findings, these molecular forces significantly affect the formation of protein complexes made of LP and CP.

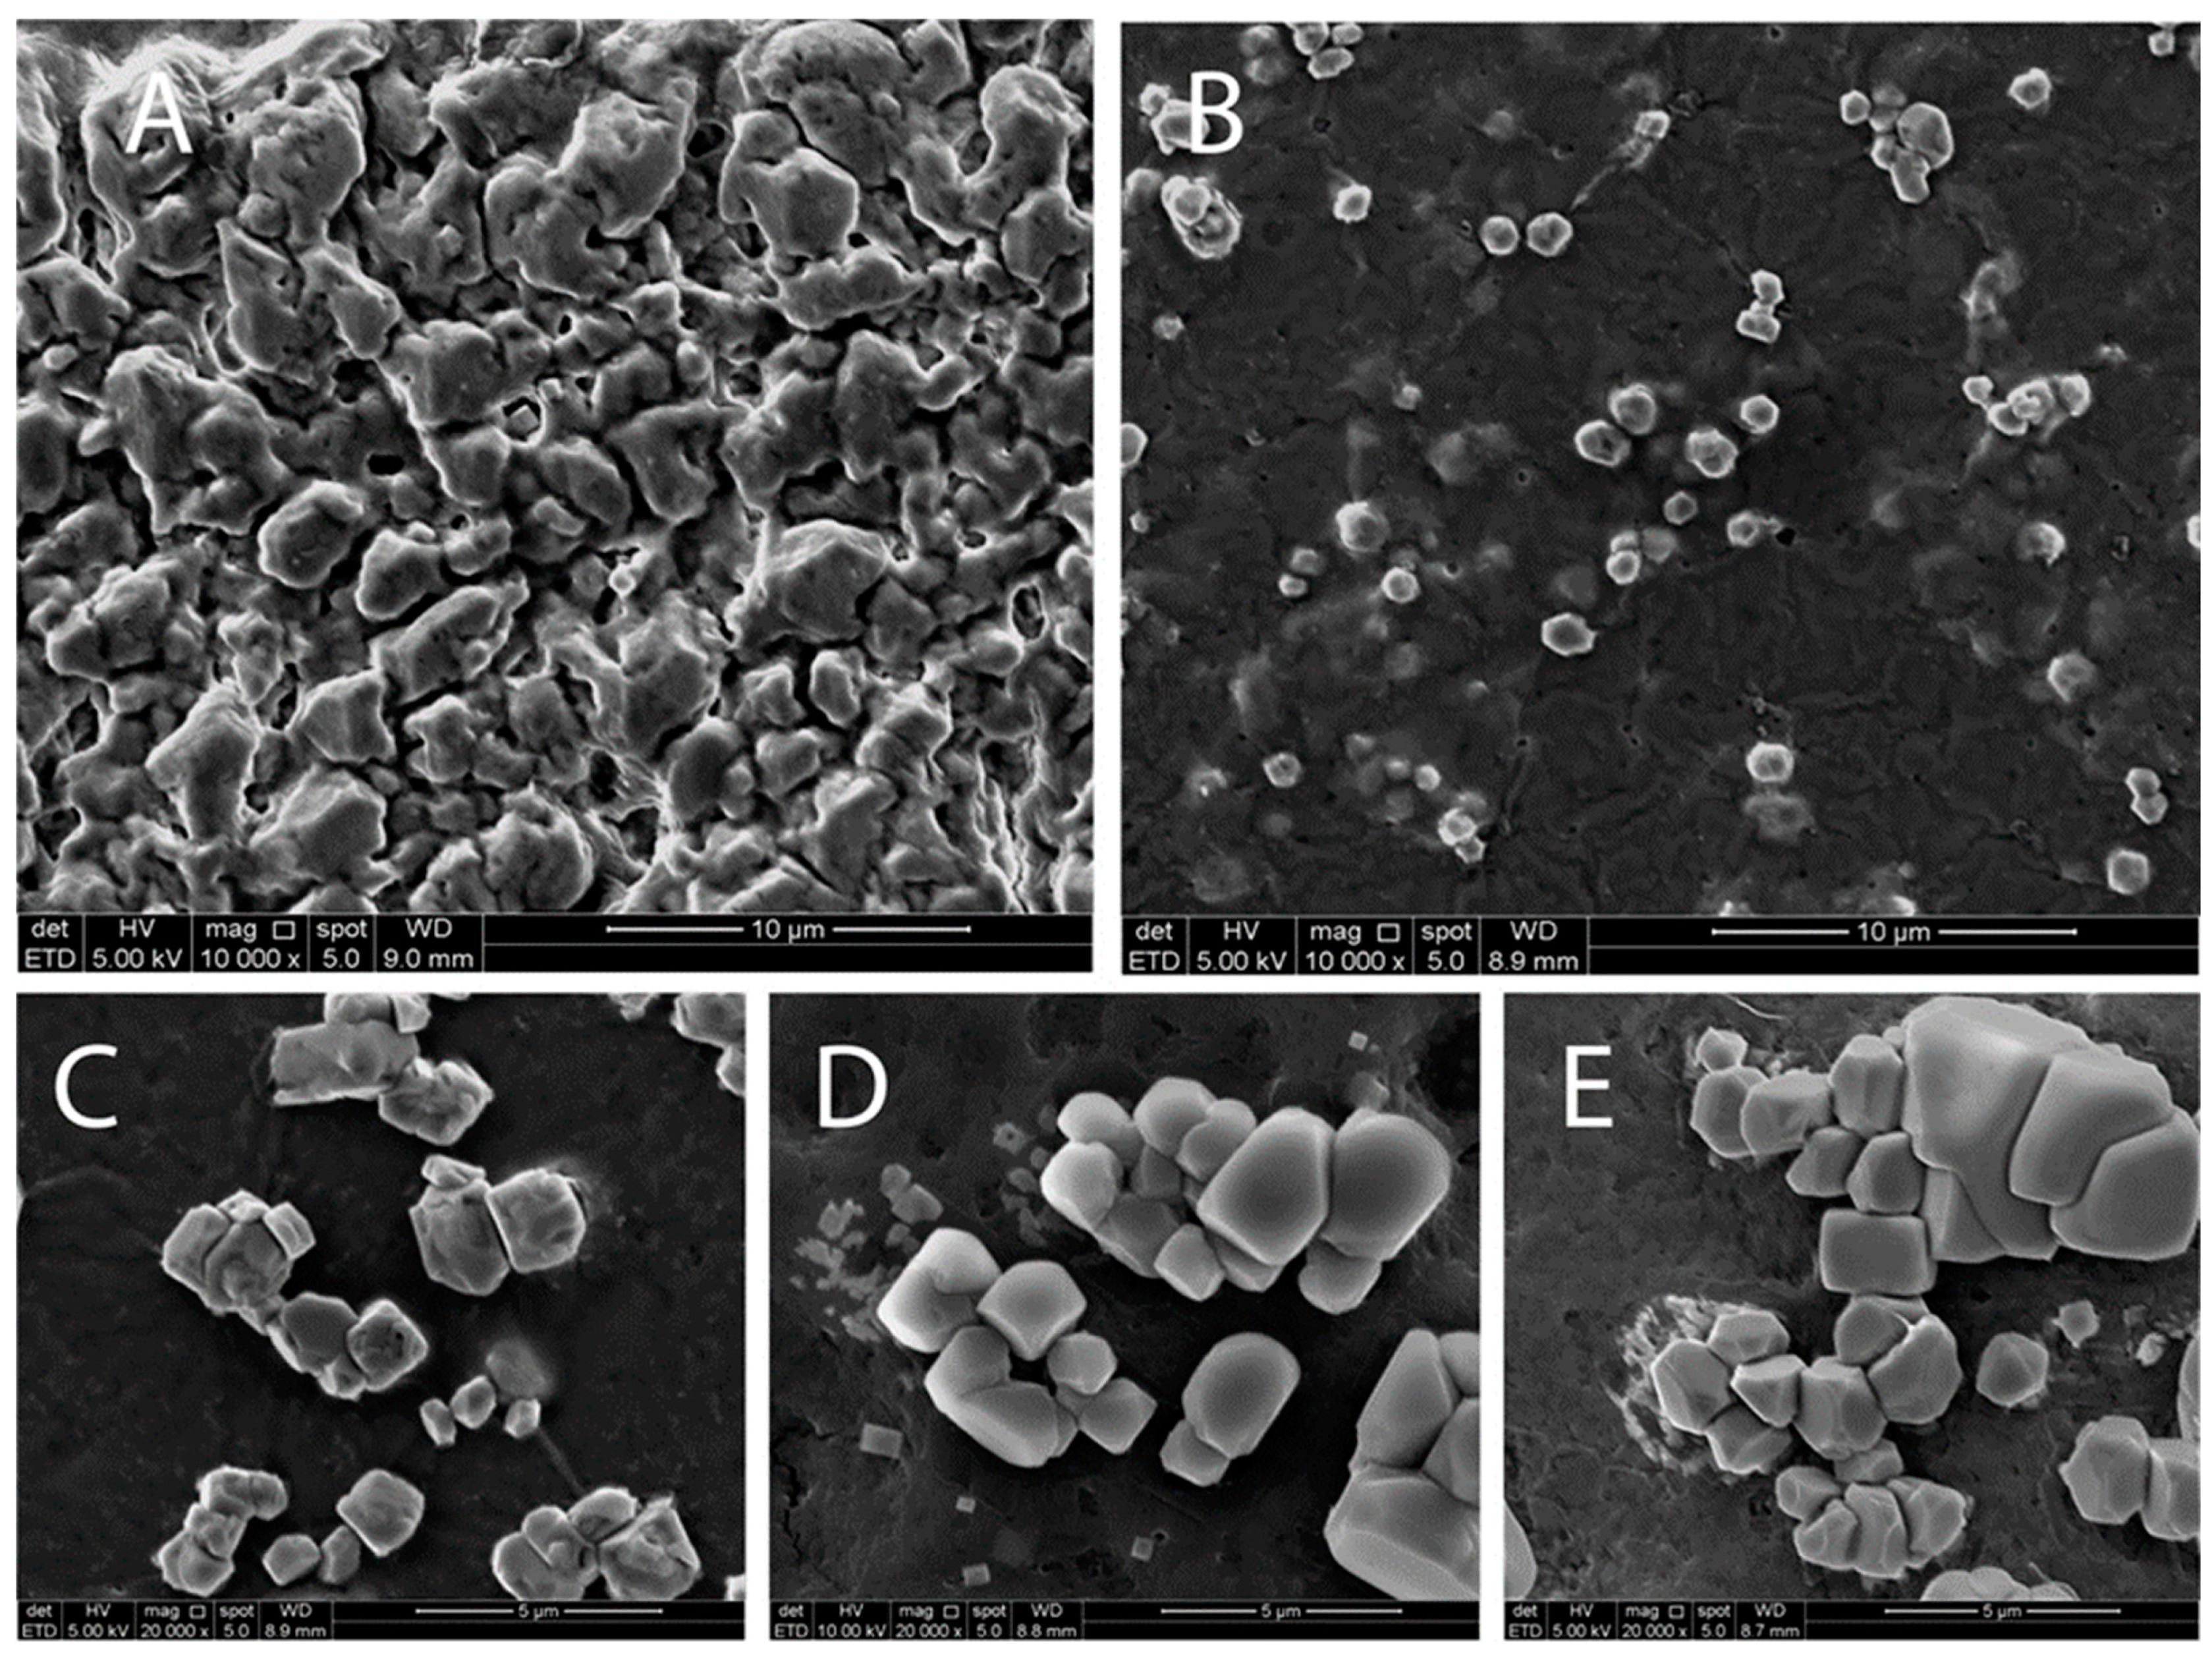
3.4. Surface Morphology of LCPC

The surface morphology of the LP was significantly aggregated, resulting in extensive particle morphologies (Figure 4A), while the microstructures of the CP were notably smaller and more distinct, comparable to silt, with no definite angular edges (Figure 4B). Surprisingly, after protein complexation between LP and CP, the formed LCPC had their self-aggregation diminished, and they exhibited a smooth surface morphology. The addition of 10% CP to LP resulted in the formation of LCPC, which were compounds with many cube-shaped molecules and sharp edges. Meanwhile, when the proportion of CP reached 33%, it formed polygons with somewhat varying particle diameters between the protein complexes.
The surface morphology of LP, CP, and LCPC differed, indicating the protein interaction of the individual proteins, i.e., LP and CP. Consequently, surface morphological alterations were caused by adding CP to create LCPC, thus affecting their water solubility. These modifications include the reduction in aggregation between independent components and effects on the surface morphology of LCPC. Consequently, the complexation between LP and CP occurred in the formation of LCPC, which was further studied better understand the protein complexation mechanism.

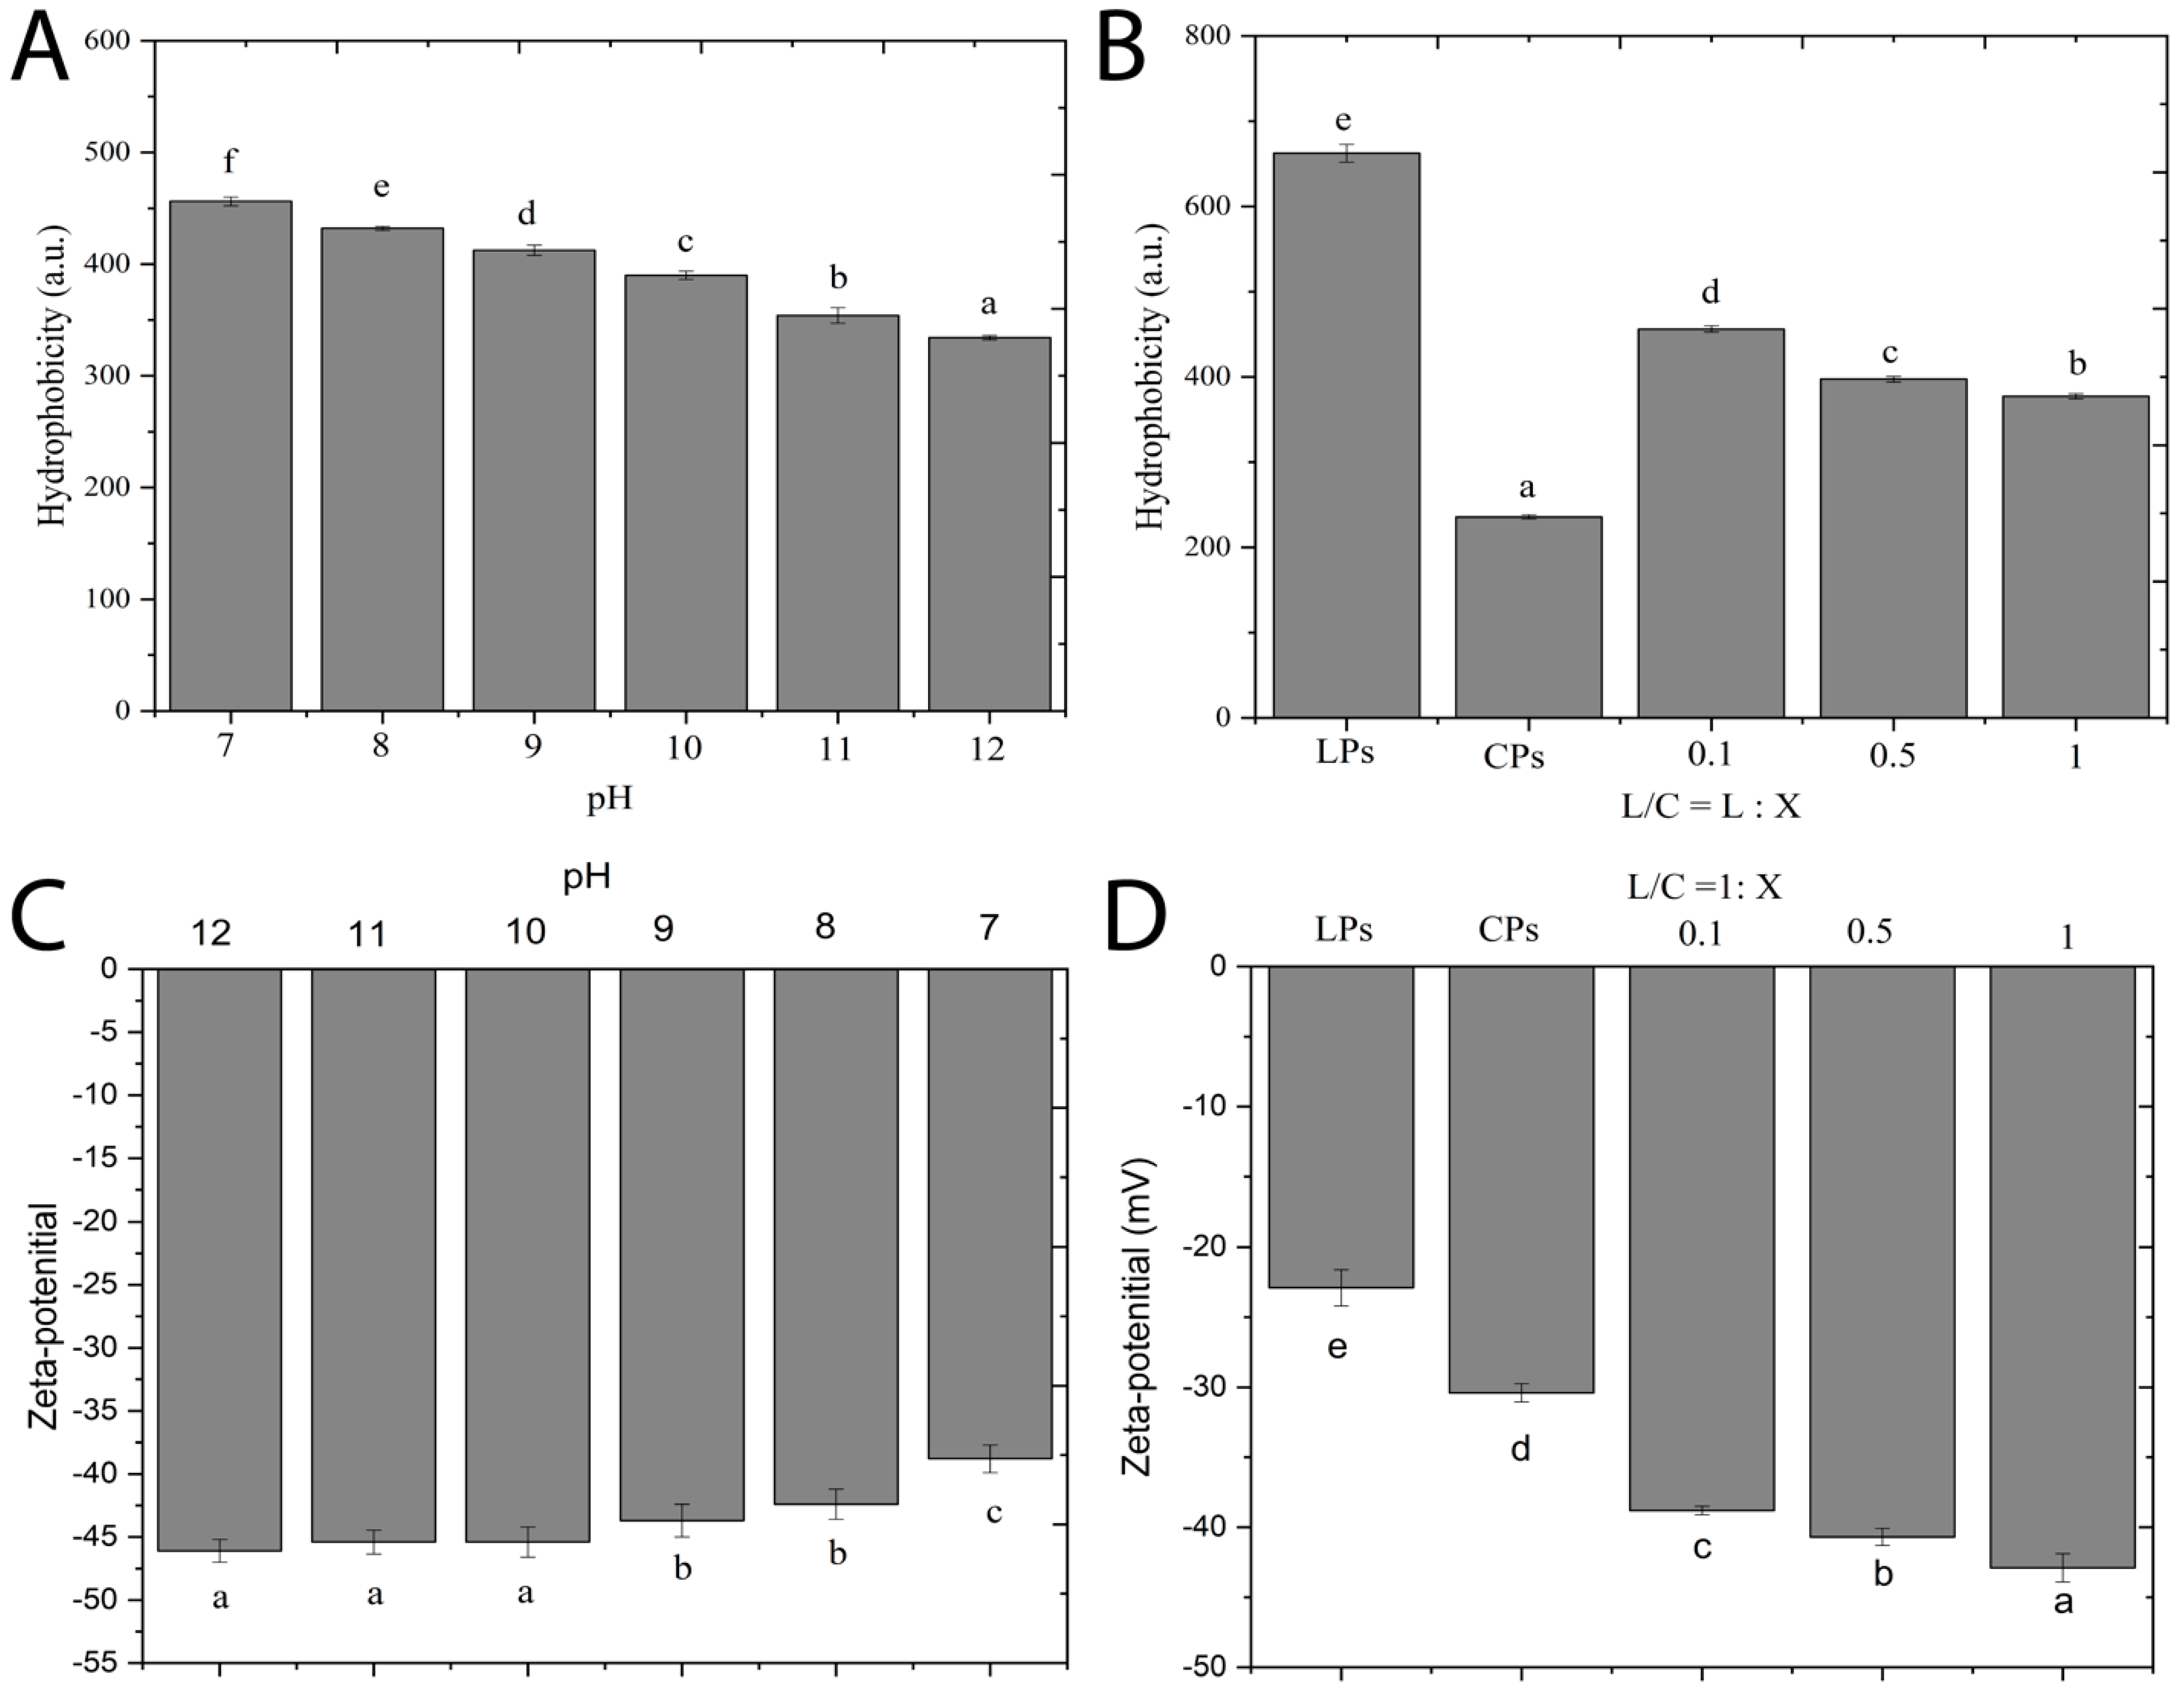
3.5. Protein Interfacial Characteristics Resulting from Protein Complexation

Because of the polymeric nature of proteins, surface hydrophobicity has a greater impact on their functional characteristics than their hydrophobicity. Protein aggregation, adsorption behavior, physical stability, and solubility are all influenced by the surface hydrophobicity of the protein [2,8]. Fluorescent dyes are useful in determining the degree of protein denaturation and surface hydrophobicity. Acidification improved the surface hydrophobicity of novel LCPC (Figure 5A). The main reason for the rise in hydrophobic groups was that the co-folded protein molecules enabled non-polar groups to create hydrophobic caverns accessible to the ANS probes. The zeta potential increased with pH (Figure 5C), indicating that most loaded units remained at the interfaces of the newly synthesized LCPC.
In general, an increased ratio of CP in LCPC resulted in a decrease in surface hydrophobicity (Figure 5B). We discovered that the zeta potential decreased in the same way, although to a considerably lower percentage than hydrophobicity (Figure 5C). The increased surface charge of LCPC was attributed to the increased complexation between LP and CP due to an increase in the proportion of CP. The aggregation and dispersion of proteins are strongly influenced by their surface charge [19].
The surface charge of the control sample was around ~22.1 mV. The increased charges on the surface of proteins resulted in appropriate electrostatic repulsions, resulting in increased stabilization and resistance to aggregation of protein complexes after PPI. Consequently, the LCPC formed is more stable, indicating the presence of enough self-repulsive externals in the protein complexation.

3.6. Effects of Water Kefir-Assisted Fermentation on the pH and TSS of Fermented Lentil–Casein Protein Complex at a Ratio of 1.0:0.1 (LCPC 1.0:0.1)

Throughout the water kefir-assisted fermentation, the pH and TSS of the fermented samples declined significantly (p < 0.05) (Table 2). The pH of the fermented LCPC 1.0:0.1 decreased significantly (p < 0.05) from 7.09 ± 0.03 to 34.04 ± 0.05 on Day 2. Finally, the pH value reached 3.83 ± 0.01 on Day 5. These findings suggest that the release of ammonium (NH4+) and amino acids is resulted from the protein hydrolysis by LAB, AAB, and yeast during the kefir fermentation [20].
Furthermore, the drop in pH throughout the fermentation period and the production of lactic acid could be due to the accumulation of lactic acid caused by microbial activity [3,10,21,22]. These results are in agreement with the findings reported by Tu et al. [23], Azi et al. [9], and Jia et al. [22], whereby Lactobacillus spp. are responsible for the reduction in the pH solution during the fermentation. During the water kefir-assisted fermentation, there were significant variations (p < 0.05) in the pH during the last 3 days.
The TTS of the fermented LCPC 1.0:0.1 decreased significantly (p < 0.05) during the water kefir-assisted fermentation, reducing from 2.13 ± 0.05 to 1.10 ± 0.00 °Brix. These results refer to the microbial activity of LAB, AAB, and yeasts during fermentation. Comparably, Tu et al. [23] showed that the TSS of whey-soy reduced significantly during the first 2 days of kefir fermentation, from 9.20 to 4.43 °Brix after 5 days. Furthermore, dos Santos et al. [24] also reported that the TSS of soymilk dropped from 1.88 to 1.45 °Brix during 5 days of kefir fermentation at 25 °C.

3.7. Effects of Water Kefir-Assisted Fermentation on the Protein Quality of Fermented LCPC 1.0:0.1

3.7.1. Protein Digestibility

The nutritional value of protein depends on the digestibility and bioavailability of the protein. In this research, the protein digestibility of the unfermented LCPC 1.0:0.1 was ~79.53% (Table 2). Throughout the water kefir-assisted fermentation, the protein digestibility of fermented protein complexes significantly increased (p < 0.05) to ~86.79% on Day 5 of the fermentation. The protein digestibility of fermented LCPC 1.0:0.1 increased due to the presence of yeasts (Kluyveromyces, Candida, and Saccharomyces), LAB (Lactobacillus, Streptococcus, Leuconostoc, and Lactococcus), and AAB [3,9,10,23] in the water kefir. Pranoto et al. [25] reported that the protein digestibility of sorghum flour increased from 40 to 80% after fermentation with Lactobacillus plantarum. In another study, by Chandra-Hioe et al. [11], the protein digestibility of lyophilized yogurt fermented with cultures (Streptococcus bulgaricus and Lactobacillus) increased from 70.5 to over 77.2%.
There were no significant differences (p > 0.05) in protein digestibility of the fermented LCPC 1.0:0.1 during the first 2 days of water kefir-assisted fermentation (Table 2). This insignificance could be due to the decrease in the protein cross-linking and amount of micronutrient compounds, such as phenolic acids, saponins, and tannins [11,21]. On the other hand, Pranoto et al. [25] reported that L. plantarum could hydrolyze proteins into smaller fragments (e.g., peptides) and amino acids during the kefir fermentation, thus resulting in partially digestible proteins. In addition, Lactobacillus has also been attributed to the hydrolysis of proteins due to cell-envelope proteinase activity during kefir fermentation [7,26]. Jia et al. [22] reported that fermentation could release small protein fragments into ovomucoid and ovalbumin because of peptide bond breakdown. Furthermore, these results are in agreement with Çabuk et al. [21] and Ayala-Nino et al. [27], whereby the protein digestibility increased after Lactobacillus fermentation.

3.7.2. Secondary Protein Structure

It was reported by Carbonaro et al. [28] that increasing the proportion of amid group II (1600 and 1039 cm−1) reduced the protein digestibility. The components of the secondary protein structure of unfermented LCPC 1.0:0.1; β-turns (43.87%), β-sheets (30.90%), random coil (RC, 15.32%), and α-helices (9.90%), were determined in this study (Table 3). The proportions of β-turns and β-sheets were not significantly different (p > 0.05) throughout the water kefir-assisted fermentation. In contrast, significant changes (p < 0.05) were observed for the ratio of α-helices and RC components. In this study, the percentage of α-helices in the fermented LCPC 1.0:0.1 decreased significantly (p < 0.05) from 9.90 to 6.58%, with a greater reduction in the first 24 h of the 5 days of water kefir-assisted fermentation. A drop in the proportion of α-helices in protein indicates the improvement of protein digestibility [29].
Another change in one of the secondary protein structure components, i.e., RC, was observed during the water kefir-assisted fermentation on LCPC 1.0:0.1, whereby a significant increase (p < 0.05) in the RC was recorded, from 15.32 to 21.67%. This upward trend suggests that the fermented LCPC 1.0:0.1 had accumulated. These outcomes are consistent with the current findings, whereby a rise in the RC proportion is paired with a decrease in the α-helix proportion. The degree of protein restructuring in this study was larger than in a past investigation by Wang et al. [29]. As a result, it is hypothesized that the effects of LAB, AAB, and yeast on the structure of fermented LCPC are much more beneficial than those of thermal or pressure treatments, such as extrusion, frying and pelleting.
Various previous investigations have revealed that microbes fermenting has a major impact on the α-helix proportion and the RC proportion of fermented protein [3,10,30]. These modifications are remarkable and advantageous for enhancing fermented protein functionality [30]. Consequently, our results showed that fermented proteins have improved protein quality. A previous study by Salazar-Villanea et al. [30] showed that increased protein digestibility is associated with a decrease in the α-helix-to-β-sheet ratio. The α-helix-to-β-sheet ratio declined from 32.04 to 23.87% on Day 2 of the water kefir-assisted fermentation and remained at this value (Table 3).

3.8. Effects of Water Kefir-Assisted Fermentation on the Nutrients of Fermented LCPC 1.0:0.1

3.8.1. Phenolic Compounds

Saponins and phenolic compounds have been reported to have an adverse effect on protein digestibility [10]. Some of these phenolic compounds can link with macronutrients, such as carbohydrate and protein molecules, which could hinder enzymatic hydrolysis on these macromolecules. The TPC of fermented LCPC 1.0:0.1 increased significantly (p < 0.05) after the fermentation, to 458.33 ± 11.51 mg GAE/100 g on Day 3, and then decreased significantly (p < 0.05) during the last 3 days (Table 4). This increase might be attributed to the dissociation of bound phenols [31]; by microbial fermentation [10]. These results are consistent with the conditions reported by Azi et al. [9] and Tu et al. [23], whereby some phenolic compounds were reduced during the kefir fermentation. In another study, by Adebo et al. [32], Lactobacillus strains significantly reduced phenolic compounds.
Rutin, caffeic acid, quercetin, catechin, chlorogenic, epicatechin, sinapic acid, gallic acid, ferulic acid, and syringic acid were among the phenolic compounds determined in the fermented proteins during the water kefir-assisted fermentation (Table 4). All phenolic compounds increased during the fermentation period. The level of catechin, gallic acid, and quercetin rise with increasing the fermentation period. Adebo and Gabriela Medina-Meza [32] observed a rise in phenolic compounds during fermentation. Caffeic acid was detected on Day 3 of the fermentation, producing a high level of phenolic compounds on Day 3. Furthermore, rutin levels dropped from 2.43 ± 0.05 to 1.90 ± 0.08 mg/100 g on Day 1 and then increased to 4.50 ± 0.23 mg/100 g on Day 3. The reduction in phenolic compounds could be attributed to the Lactobacillus strains, which can degrade and hydrolyze phenolic compounds [32]. Phenolic compounds can form linkages with carbohydrates and proteins in nature, leading to the formation of more complex compounds and phenolics that are less soluble. These phenolics are connected with ester linkages through the hydroxyl groups of proteins and the carboxylic groups of carbohydrates [3]. In this study, the findings show that phenolic compounds significantly increased (p < 0.05) in the fermented LCPC 1.0:0.1 compared to in the unfermented sample (Day 0).

3.8.2. Total Saponin Content (TSC)

The saponins found in the outer layers of cereals and legumes give them a bitter taste that may have anti-nutritional implications, resulting in lower acceptability [10]. Saponins are a complicated group of compounds with constructions with a carbohydrate molecule connected to a steroid or triterpenoid aglycone [33]. Because of their toxicity and hemolytic behavior, these phytochemicals have traditionally been recognized as unacceptable. Saponins are responsible for the bitterness and astringency of grains [34]. Del Hierro et al. [35] discovered that lentils contain 110–1269 mg/kg saponins. In this study, the TSC in LCPC 1.0:0.1 was around 74.52 ± 0.35 mg OAE/100 g. Chan et al. [36] reported that the TSC in samples depends on the extraction solvent, which could be due to the different polarities of the extraction solvent.
In this study, TSC was present in LCPC 1.0:0.1 during water kefir-assisted fermentation (Table 2). After fermentation, the TSC of protein complexes dropped significantly (p < 0.05), from 46.20 ± 0.05 to 41.23 ± 0.60 mg OAE/100 g on Day 2, and reached 37.13 ± 0.92 mg OAE/100 g on Day 5. The decrease in TSC might be attributed to the degradation of saponins connected with protein or carbohydrate molecules through fermentation. These discoveries are consistent with several investigations showing that these micronutrients decrease during fermentation [9,23].
Similarly, Lai et al. [37] showed that fermentation with LAB could decrease the TSC by around 46% in fermented soy. Past studies have reported that fermentation with Bacillus spp. or fungal cultures, such as Rhizopus stolonifer or Aspergillus oryzae, could result in the cleavage of saponins that are cross-linked with macronutrients, such as carbohydrates and proteins [3]. Such cleavage has been reported to enhance protein digestibility.

3.8.3. Sugars

Brown sugar has typically been widely utilized to enhance kefir seeds’ functional activity [3,9,10,23]. Fructose, glucose, and sucrose are the main components of brown sugar, accounting for ~85% of the brown sugar composition [24]. The concentrations of fructose, glucose, and sucrose in the fermented LCPC 1.0:0.1 were determined during the 5 days of water kefir-assisted fermentation (Table 2). The level of sucrose reduction from 5.41 ± 0.14 to 0.14 ± 0.01 g/L from the unfermented sample to Day 2 of the fermentation, respectively, while the glucose and fructose contents rose to 2.72 ± 0.04 and 1.11 ± 0.04 g/L, respectively. Starting from Day 3 of the fermentation, the glucose and fructose contents began to decrease. Sucrose was no longer detected after Day 4 of the fermentation. Previous results support our findings that glucose, fructose, and sucrose levels are reduced during the kefir fermentation since they are considered the primary energy source for fermenting microorganisms [25].

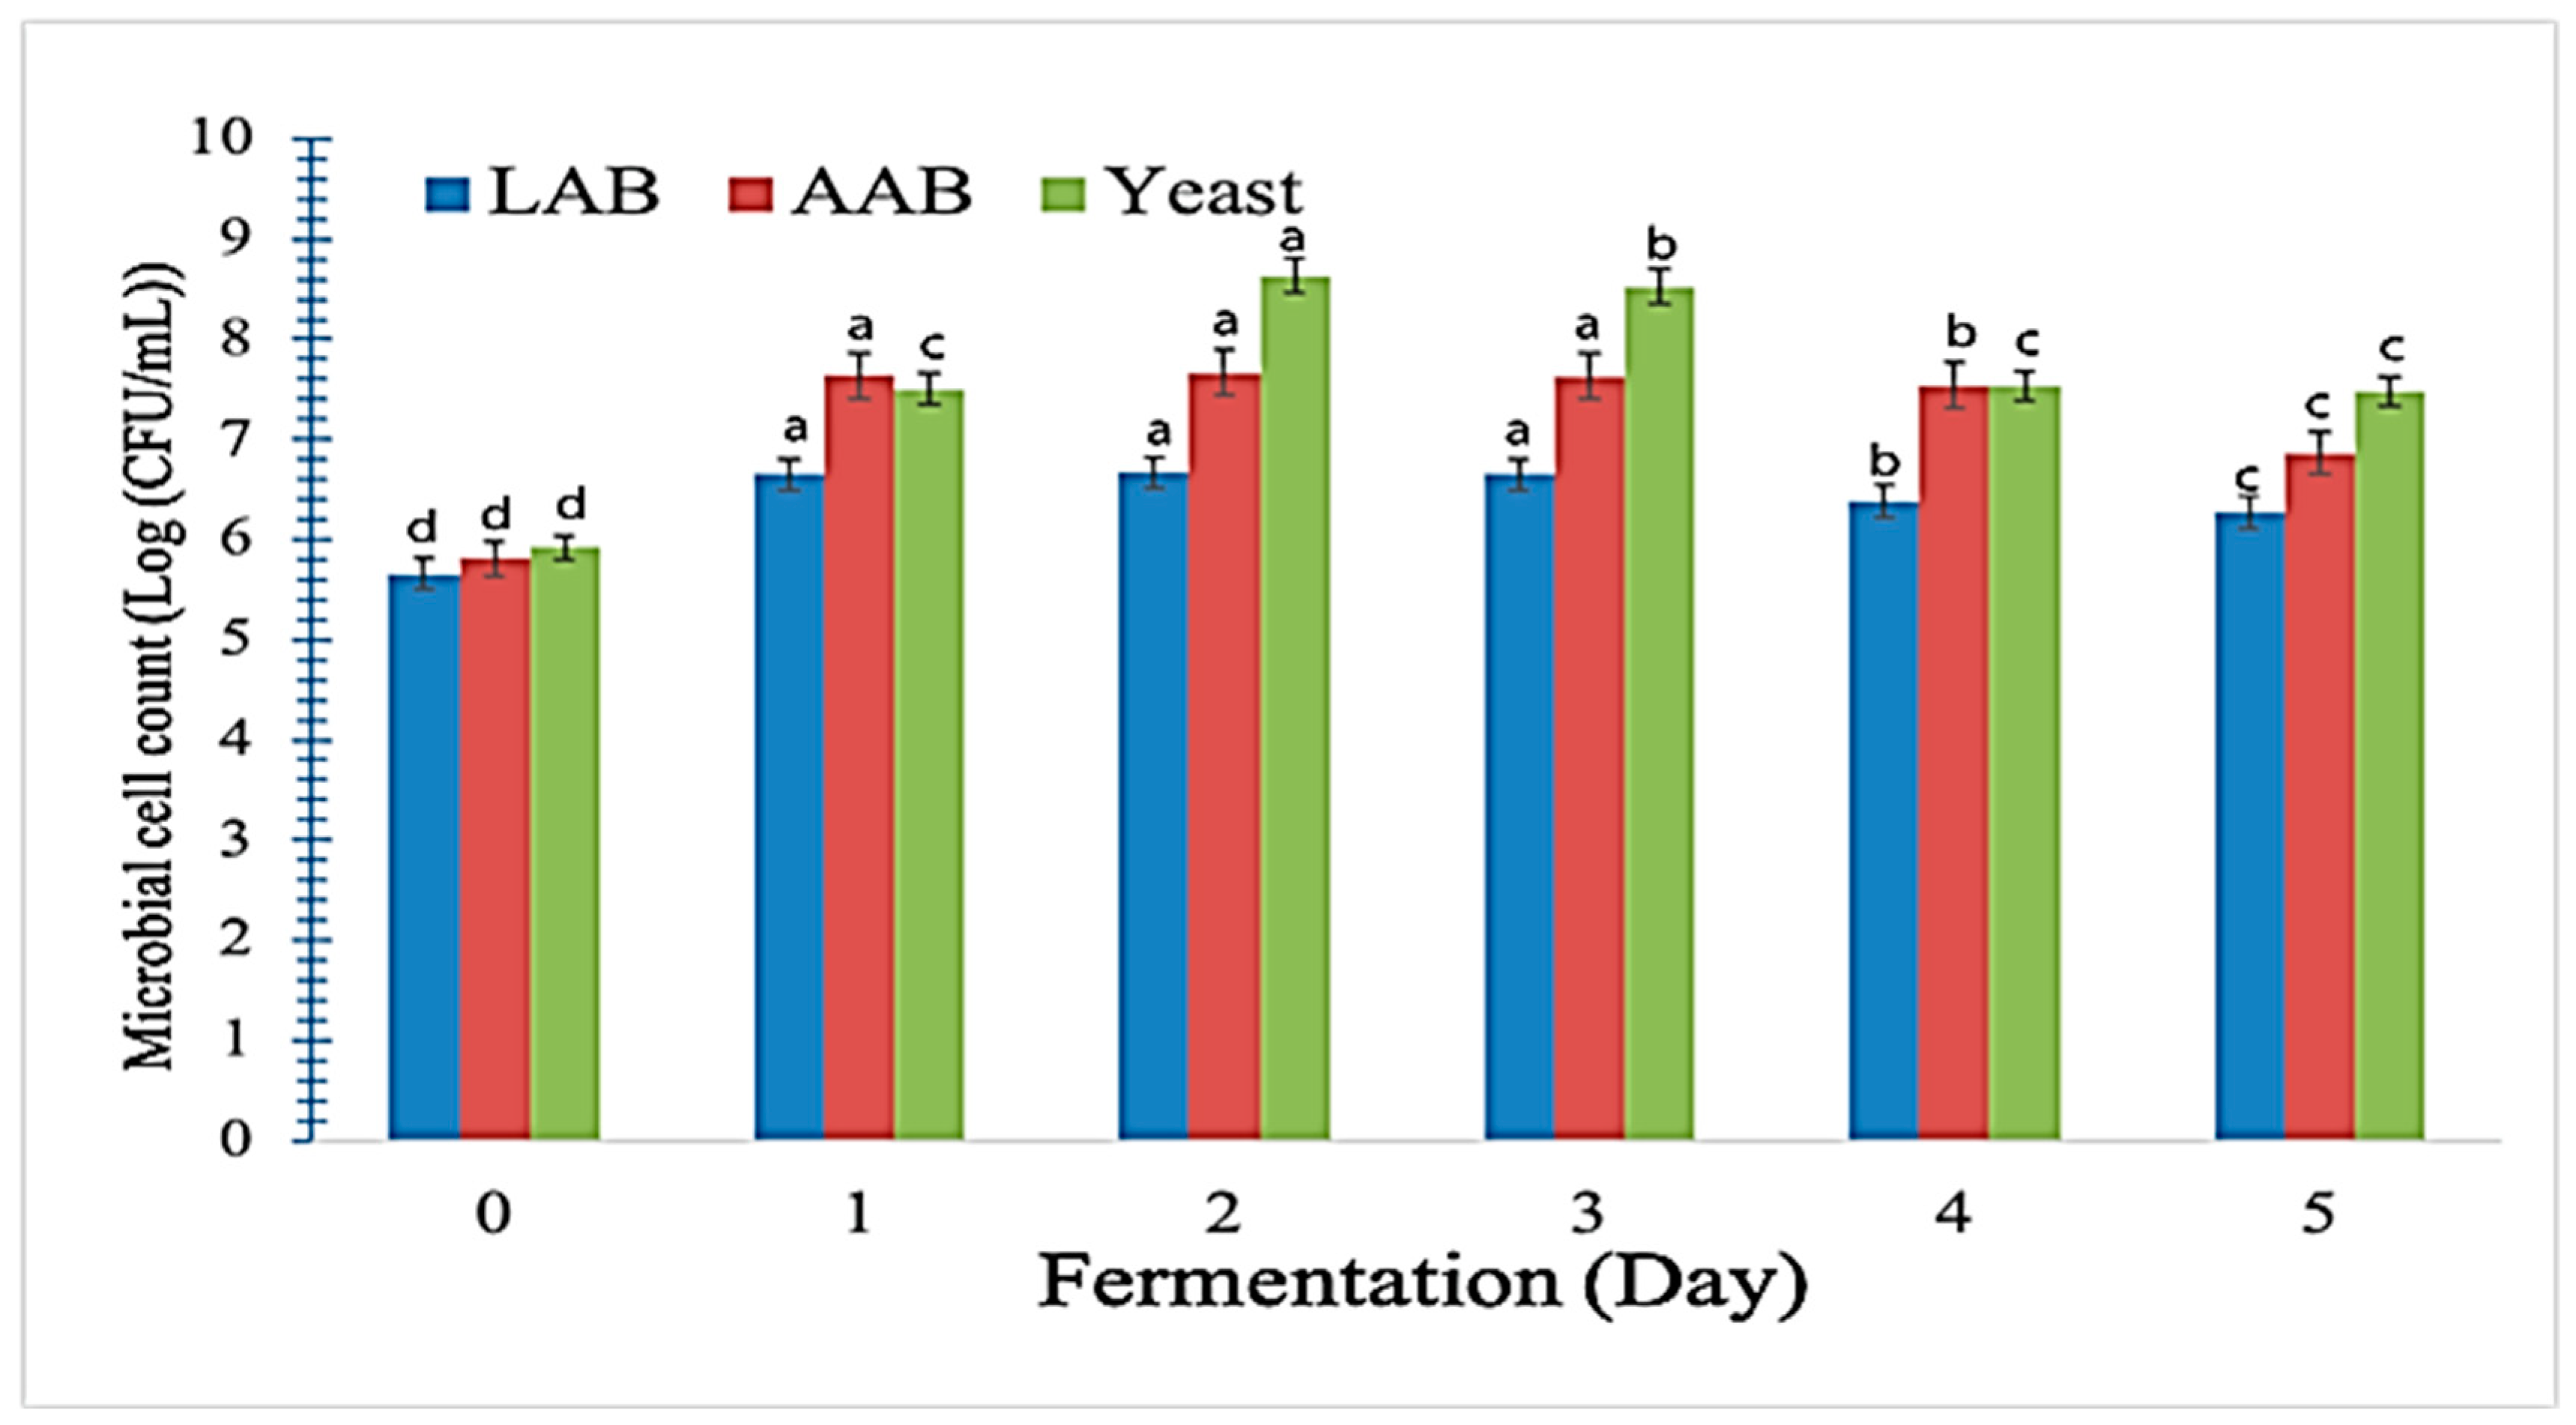
3.9. Effects of Water Kefir-Assisted Fermentation on the Microbiological Qualities of Fermented LCPC 1.0:0.1

Figure 6 illustrates the dynamics of LAB, AAB, and yeasts during the water kefir-assisted fermentation of LCPC 1.0:0.1. The number of LAB colonies increased to over 6.7 log CFU/mL after 2 days of the fermentation. In contrast, the number of AAB and yeast colonies increased to over 7 log CFU/mL. Kefir seeds have an excellent composition of various beneficial microorganisms, such as LAB (Streptococcus, Leuconostoc, Lactococcus, and Lactobacillus) and AAB, as well as yeasts (Saccharomyces, Candida, and Kluyveromyces) [9,23]. However, the nutritional composition of complex proteins provides sufficient support for microbial growth and metabolism. Yeasts play a major role in kefir fermentation by producing the enzymes responsible for the degradation of sucrose into fructose and glucose, as well as the production of ethanol as primary metabolites [10]. AAB utilized glucose and fructose to produce ethanol, whereas LAB used these as carbon sources. This unique symbiotic communication allows the yeasts, AAB, and LAB to collaborate and develop together in the water kefir consortium [38].

4. Conclusions

The demand for the highly functional properties of legume-based proteins is increasing. Because of this, modifications to LP to improve their functional and nutritional properties are of utmost importance in delivering more innovative combined methods to increase the solubility and digestibility of LP and other plant-based proteins. The soluble protein composites formed through PPI with a new protein structure and protein quality, microstructure, solubility in water, and secondary and tertiary protein structure, as well as the interfacial properties of the novel LCPC, were thoroughly investigated. This study describes the impact of secondary and tertiary protein structures on the water solubility of LCPC. The protein complexation managed to alter the secondary protein structures. Interactions of LP with CP are governed by non-covalent interactions, i.e., hydrophobic interactions, hydrogen bonding, and electrostatic interactions. These interactions increased the water solubility from 55 to over 86.5% after complexation between LP and CP. This study proves that PPI and water kefir-assisted fermentation can favorably alter the protein structure, protein digestibility, and micronutrients of LCPC. These alterations indicate the rearrangement of the degraded protein complexes that occurred during the water kefir-assisted fermentation.

Author Contributions

Conceptualization, C.C.T., M.H.A. and S.G.; methodology, A.M.A.; validation, S.M. and M.A.D.; formal analysis, M.A. and M.S.J.; writing—original draft preparation, M.A.; writing—review and editing, A.M.E.; supervision, T.-C.T. and A.M.E.; project administration, M.A.; funding acquisition and software, T.-C.T. and A.A.-Q. All authors have read and agreed to the published version of the manuscript.

Funding

This research was funded by Malaysia’s Fundamental Research Grant Scheme (FRGS/1/2019/STG01/USM/02/8). The research was partially funded by the Researchers Supporting Project number (RSP2023R502), King Saud University, Riyadh, Saudi Arabia.

Institutional Review Board Statement

Not applicable.

Informed Consent Statement

Not applicable.

Data Availability Statement

The data presented in this study are available on request from the corresponding author.

Acknowledgments

We would additionally like to thank the reviewers for their helpful comments and suggestions that improved the quality of the manuscript.

Conflicts of Interest

The authors declare no conflict of interest.

References

  1. Jarpa-Parra, M.; Bamdad, F.; Wang, Y.; Tian, Z.; Temelli, F.; Han, J.; Chen, L. Optimization of lentil protein extraction and the influence of process pH on protein structure and functionality. LWT 2014, 57, 461–469. [Google Scholar] [CrossRef]
  2. Alrosan, M.; Tan, T.-C.; Easa, A.M.; Gammoh, S.; Alu’datt, M.H. Mechanism of the structural interaction between whey and lentil proteins in the unique creation of a protein structure. J. Food Sci. 2021, 86, 5282–5294. [Google Scholar] [CrossRef] [PubMed]
  3. Alrosan, M.; Tan, T.-C.; Easa, A.M.; Gammoh, S.; Alu’datt, M.H. Effects of fermentation on the quality, structure, and nonnutritive contents of lentil (Lens culinaris) proteins. J. Food Qual. 2021, 2021, 5556450. [Google Scholar] [CrossRef]
  4. Alrosan, M.; Tan, T.-C.; Easa, A.M.; Gammoh, S.; Alu’datt, M.H. Molecular forces governing protein-protein interaction: Structure-function relationship of complexes protein in the food industry. Crit. Rev. Food Sci. Nutr. 2022, 62, 4036–4052. [Google Scholar] [CrossRef]
  5. Wang, R.; Xu, P.; Chen, Z.; Zhou, X.; Wang, T. Complexation of rice proteins and whey protein isolates by structural interactions to prepare soluble protein composites. LWT 2019, 101, 207–213. [Google Scholar] [CrossRef]
  6. Wang, T.; Chen, X.; Zhong, Q.; Chen, Z.; Wang, R.; Patel, A.R. Facile and efficient construction of water-soluble biomaterials with tunable mesoscopic structures using all-natural edible proteins. Adv. Funct. Mater. 2019, 29, 1901830. [Google Scholar] [CrossRef]
  7. Wang, Y.H.; Wang, J.M.; Wan, Z.L.; Yang, X.Q.; Chen, X.W. Corn protein hydrolysate as a new structural modifier for soybean protein isolate based O/W emulsions. LWT 2020, 118, 108763. [Google Scholar] [CrossRef]
  8. He, J.; Wang, R.; Feng, W.; Chen, Z.; Wang, T. Design of novel edible hydrocolloids by structural interplays between wheat gluten proteins and soy protein isolates. Food Hydrocoll. 2020, 100, 105395. [Google Scholar] [CrossRef]
  9. Azi, F.; Tu, C.; Rasheed, H.A.; Dong, M. Comparative study of the phenolics, antioxidant and metagenomic composition of novel soy whey-based beverages produced using three different water kefir microbiota. Int. J. Food Sci. Technol. 2020, 55, 1689–1697. [Google Scholar] [CrossRef]
  10. Alrosan, M.; Tan, T.-C.; Koh, W.Y.; Easa, A.M.; Gammoh, S.; Alu’datt, M.H. Overview of fermentation process: Structure-function relationship on protein quality and non-nutritive compounds of plant-based proteins and carbohydrates. Crit. Rev. Food Sci. Nutr. 2022, 1–15. [Google Scholar] [CrossRef]
  11. Chandra-Hioe, M.V.; Wong, C.H.M.; Arcot, J. The potential use of fermented chickpea and faba bean flour as food ingredients. Plant Foods Hum. Nutr. 2016, 71, 90–95. [Google Scholar] [CrossRef] [PubMed]
  12. Official Methods of Analysis of AOAC. Method 930.29, 19th ed.; AOAC International: Rockville, USA, 2012. [Google Scholar]
  13. Morr, C.V.; German, B.; Kinsella, J.E.; Regenstein, J.M.; Van Buren, J.P.; Kilara, A.; Lewis, B.A.; Mangino, M.E. A collaborative study to develop a standardized food protein solubility procedure. J. Food Sci. 1985, 50, 1715–1718. [Google Scholar] [CrossRef]
  14. Johnston, S.P.; Nickerson, M.T.; Low, N.H. The physicochemical properties of legume protein isolates and their ability to stabilize oil-in-water emulsions with and without genipin. J. Food Sci. Technol. 2015, 52, 4135–4145. [Google Scholar] [CrossRef] [PubMed] [Green Version]
  15. Almeida, C.C.; Monteiro, M.L.G.; da Costa-Lima, B.R.C.; Alvares, T.S.; Conte-Junior, C.A. In vitro digestibility of commercial whey protein supplements. LWT 2015, 61, 7–11. [Google Scholar] [CrossRef] [Green Version]
  16. Liu, W.; Zhang, Z.-Q.; Liu, C.-M.; Xie, M.-Y.; Tu, Z.-C.; Liu, J.-H.; Liang, R.-H. The effect of dynamic high-pressure microfluidization on the activity, stability and conformation of trypsin. Food Chem. 2010, 123, 616–621. [Google Scholar] [CrossRef]
  17. Jarpa-Parra, M.; Bamdad, F.; Tian, Z.; Zeng, H.; Temelli, F.; Chen, L. Impact of pH on molecular structure and surface properties of lentil legumin-like protein and its application as foam stabilizer. Colloids Surf. B 2015, 132, 45–53. [Google Scholar] [CrossRef] [PubMed]
  18. Tomczyńska-Mleko, M.; Kamysz, E.; Sikorska, E.; Puchalski, C.; Mleko, S.; Ozimek, L.; Kowaluk, G.; Gustaw, W.; Wesołowska-Trojanowska, M. Changes of secondary structure and surface tension of whey protein isolate dispersions upon pH and temperature. Czech J. Food Sci. 2014, 32, 82–89. [Google Scholar] [CrossRef] [Green Version]
  19. Song, X.; Zhou, C.; Fu, F.; Chen, Z.; Wu, Q. Effect of high-pressure homogenization on particle size and film properties of soy protein isolate. Ind. Crops Prod. 2013, 43, 538–544. [Google Scholar] [CrossRef]
  20. Tepari, E.A.; Nakhla, G.; Haroun, B.M.; Hafez, H. Co-fermentation of carbohydrates and proteins for biohydrogen production: Statistical optimization using Response Surface Methodology. Int. J. Hydrogen Energy 2020, 45, 2640–2654. [Google Scholar] [CrossRef]
  21. Çabuk, B.; Nosworthy, M.G.; Stone, A.K.; Korber, D.R.; Tanaka, T.; House, J.D.; Nickerson, M.T. Effect of fermentation on the protein digestibility and levels of non-nutritive compounds of pea protein concentrate. Food Technol. Biotechnol. 2018, 56, 257–264. [Google Scholar] [CrossRef]
  22. Jia, J.; Ji, B.; Tian, L.; Li, M.; Lu, M.; Ding, L.; Liu, X.; Duan, X. Mechanism study on enhanced foaming properties of individual albumen proteins by Lactobacillus fermentation. Food Hydrocoll. 2021, 111, 106218. [Google Scholar] [CrossRef]
  23. Tu, C.; Azi, F.; Huang, J.; Xu, X.; Xing, G.; Dong, M. Quality and metagenomic evaluation of a novel functional beverage produced from soy whey using water kefir grains. LWT 2019, 113, 108258. [Google Scholar] [CrossRef]
  24. dos Santos, D.C.; de Oliveira Filho, J.G.; Santana, A.C.A.; de Freitas, B.S.M.; Silva, F.G.; Takeuchi, K.P.; Egea, M.B. Optimization of soymilk fermentation with kefir and the addition of inulin: Physicochemical, sensory and technological characteristics. LWT 2019, 104, 30–37. [Google Scholar] [CrossRef]
  25. Pranoto, Y.; Anggrahini, S.; Efendi, Z. Effect of natural and Lactobacillus plantarum fermentation on in-vitro protein and starch digestibilities of sorghum flour. Food Biosci. 2013, 2, 46–52. [Google Scholar] [CrossRef]
  26. Klaenhammer, T.R.; Barrangou, R.; Buck, B.L.; Azcarate-Peril, M.A.; Altermann, E. Genomic features of lactic acid bacteria effecting bioprocessing and health. FEMS Microbiol. Rev. 2005, 29, 393–409. [Google Scholar] [CrossRef]
  27. Ayala-Niño, A.; Rodríguez-Serrano, G.M.; Jiménez-Alvarado, R.; Bautista-Avila, M.; Sánchez-Franco, J.A.; González-Olivares, L.G.; Cepeda-Saez, A. Bioactivity of peptides released during lactic fermentation of amaranth proteins with potential cardiovascular protective effect: An in vitro study. J. Med. Food 2019, 22, 976–981. [Google Scholar] [CrossRef]
  28. Carbonaro, M.; Maselli, P.; Nucara, A. Relationship between digestibility and secondary structure of raw and thermally treated legume proteins: A Fourier transform infrared (FT-IR) spectroscopic study. Amino Acids 2012, 43, 911–921. [Google Scholar] [CrossRef]
  29. Wang, Z.; Li, Y.; Jiang, L.; Qi, B.; Zhou, L. Relationship between secondary structure and surface hydrophobicity of soybean protein isolate subjected to heat treatment. J. Chem. 2014, 2014, 475389. [Google Scholar] [CrossRef] [Green Version]
  30. Salazar-Villanea, S.; Hendriks, W.H.; Bruininx, E.; Gruppen, H.; Van Der Poel, A.F.B. Protein structural changes during processing of vegetable feed ingredients used in swine diets: Implications for nutritional value. Nutr. Res. Rev. 2016, 29, 126–141. [Google Scholar] [CrossRef] [Green Version]
  31. Liyana-Pathirana, C.M.; Shahidi, F. Importance of insoluble-bound phenolics to antioxidant properties of wheat. J. Agric. Food Chem. 2006, 54, 1256–1264. [Google Scholar] [CrossRef]
  32. Adebo, O.A.; Gabriela Medina-Meza, I. Impact of fermentation on the phenolic compounds and antioxidant activity of whole cereal grains: A mini review. Molecules 2020, 25, 927. [Google Scholar] [CrossRef] [Green Version]
  33. Liu, Q.; Wang, C.; Guo, G.; Huo, W.J.; Zhang, Y.L.; Pei, C.X.; Zhang, S.L.; Wang, H. Effects of branched-chain volatile fatty acids supplementation on growth performance, ruminal fermentation, nutrient digestibility, hepatic lipid content and gene expression of dairy calves. Anim. Feed Sci. Technol. 2018, 237, 27–34. [Google Scholar] [CrossRef]
  34. Heiniö, R.-L.; Noort, M.W.J.; Katina, K.; Alam, S.A.; Sozer, N.; De Kock, H.L.; Hersleth, M.; Poutanen, K. Sensory characteristics of wholegrain and bran-rich cereal foods–A review. Trends Food Sci. Technol. 2016, 47, 25–38. [Google Scholar] [CrossRef] [Green Version]
  35. Del Hierro, J.N.; Herrera, T.; García-Risco, M.R.; Fornari, T.; Reglero, G.; Martin, D. Ultrasound-assisted extraction and bioaccessibility of saponins from edible seeds: Quinoa, lentil, fenugreek, soybean and lupin. Food Res. Int. 2018, 109, 440–447. [Google Scholar] [CrossRef] [PubMed] [Green Version]
  36. Chan, K.W.; Iqbal, S.; Khong, N.M.H.; Ooi, D.-J.; Ismail, M. Antioxidant activity of phenolics–saponins rich fraction prepared from defatted kenaf seed meal. LWT 2014, 56, 181–186. [Google Scholar] [CrossRef]
  37. Lai, L.-R.; Hsieh, S.-C.; Huang, H.-Y.; Chou, C.-C. Effect of lactic fermentation on the total phenolic, saponin and phytic acid contents as well as anti-colon cancer cell proliferation activity of soymilk. J. Biosci. Bioeng. 2013, 115, 552–556. [Google Scholar] [CrossRef]
  38. Gulitz, A.; Stadie, J.; Wenning, M.; Ehrmann, M.A.; Vogel, R.F. The microbial diversity of water kefir. Int. J. Food Microbiol. 2011, 151, 284–288. [Google Scholar] [CrossRef]
Figure 1. Schematic diagram of evaluation of fermentation treatment of lentil–casein protein complexes (LCPC) generated by structural interactions.
Fermentation 09 00194 g001
Figure 2. Spectroscopic analysis of structural interactions. (A) Evaluation of the nitrogen solubility index of lentil proteins (LP) and lentil–casein protein complexes (LCPC) with various proportions. (B) Fluorescence absorption of LP with various LP to casein proteins (CP) at pH 7. The small picture represents the absorption spectra of LCPC with various LP:CP ratios at pH 7. (C) Fluorescence intensity spectrum of LCPC at a ratio of 1.0:0.1 (LCPC 1.0:0.1) at various pH levels (pH 7 to 12). (D) Fluorescence intensity spectrum of LCPC 1.0:0.1 in the presence of foreign compounds. (E) The ultraviolet-visible wavelength description of LCPC 1.0:0.1 at pH levels ranging from 7 to 12. (F) Profiles of the ultraviolet-visible spectra of LCPC 1.0:0.1 at pH 7. Bars with different letters differ significantly (p < 0.05).
Fermentation 09 00194 g002
Figure 3. Schematic diagram of the mechanism of dual technology (based on protein–protein interaction and fermentation) to generate lentil–casein protein complexes (LCPC) with improved nutrition and protein functionalities. (1) The protein solution (1% w/v) contains lentil proteins (LP) and casein proteins (CP) at a ratio of 1:0.1 in distilled water. The pH of the protein solution was adjusted to 12 for 60 min, then was readjusted to 7.0. (2) Soluble protein composites with novel protein structures were formed based on the structural interaction of lentil proteins and casein. (3) Fermentation was performed for 5 days at 25 °C with a protein complex of (1%, w/v), water kefir (5%, v/v), and distilled water (95%, v/v). (4) microorganism that synthesizes enzymes capable of breaking ester links and consequently releases free soluble phenols. (5) Fermented protein complexes have high digestibility, nutritional value, and soluble proteins.
Fermentation 09 00194 g003
Figure 4. Morphology of the surface of (A) lentil proteins (LP), (B) casein proteins (CP), and lentil–casein protein complexes (LCPC) with various LP:CP ratios; (C) LCPC 1.0:0.1, (D) LCPC 1.0:0.5, and (E) LCPC 1:1.
Fermentation 09 00194 g004
Figure 5. Surface characteristics of lentil proteins (LP) and lentil-casein protein complexes (LCPC). (A) Surface hydrophobicity (Ho) of LCPC 1.0:0.1 at a range of pH 7 to 12. (B) Ho of LP, CP, and LCPC at pH 7. (C) Zeta potential of LPCP 1.0:0.1 at a range of pH 7 to 12. (D) Zeta potential of LP, CP, and LCPC at various LP:CP ratios. Different letters indicate statistically significant differences (p < 0.05).
Fermentation 09 00194 g005
Figure 6. Developments in acetic acid bacteria (yellow bar), acetic acid bacteria (grey bar), and yeast (black bar) microbiological activity (white bar) during the water kefir-assisted fermentation of fermented and unfermented lentil–casein protein complexes at a ratio of 1.0:0.1 (LCPC 1.0:0.1). Bars with different letters differ significantly within the same color bar (p < 0.05).
Fermentation 09 00194 g006
Table 1. Evaluation of the proportion of secondary protein components of lentil proteins (LP), casein proteins (CP) and lentil–casein protein complexes (LCPC).
Secondary Protein ComponentsPeak (cm−1)Protein Samplesp-Value
LPCPLCPC 1.0:0.1LCPC 1.0:0.5LCPC 1:1
β-Sheet
1614.429.0713.2311.3012.0912.28
1622.137.658.008.548.819.06
1633.7111.0410.7511.6011.8212.07
β-Sheet (Ʃ) 27.76 a31.97 a31.44 a32.72 a33.40 a>0.05
Random coils1645.2815.78 d16.00 e15.04 b14.88 a15.16 c<0.05
α-Helix1654.0718.48 d13.48 c9.76 b9.48 a9.30 a<0.05
β-Turn
1668.4310.428.1812.3111.6111.55
1681.9311.1113.8211.1010.7910.74
1693.5016.4516.5520.3420.5219.84
β-Turn (Ʃ) 37.98 a38.55 a43.75 a42.91 a42.13 a>0.05
Means (n = 3) with different superscripts in the same row differ significantly (p < 0.05). LCPC 1:0.1, LCPC 1:0.5, and LCPC 1:1 represent lentil–casein protein complexes at a ratio of 1:0.1, 1:0.5, and 1:1, respectively.
Table 2. Evaluation of the pH, total soluble solids (TSS, Brix), protein digestibility (%), total saponin content (TSC, mg of oleanolic acid per 100 g), and sugar profile (g/L) of the unfermented and fermented lentil–casein protein complex at a ratio of 1.0:0.1 (LCPC 1.0:0.1).
Fermentation Periodp-Value
Day 0Day 1Day 2Day 3Day 4Day 5
pH7.09 ± 0.03 a4.53 ± 0.03 b4.04 ± 0.05 c3.94 ± 0.01 d3.89 ± 0.01 e3.83 ± 0.01 f<0.05
TSS2.13 ± 0.05 a1.40 ± 0.00 b1.30 ± 0.00 c1.20 ± 0.00 d1.20 ± 0.00 d1.10 ± 0.00 e<0.05
Protein digestibility79.53 ± 0.43 b80.60 ± 0.79 b84.42 ± 1.47 a85.33 ± 0.88 a86.39 ± 1.80 a86.79 ± 0.43 a<0.05
TSC46.20 ± 0.05 a45.30 ± 1.11 a41.23 ± 0.60 b38.50 ± 0.51 c37.93 ± 0.64 cd37.13 ± 0.92 d<0.05
Sugars
Fructose0.59 ± 0.02 c2.43 ± 0.09 a1.11 ± 0.04 b0.50 ± 0.02 d0.24 ± 0.01 e0.07 ± 0.01 f<0.05
GlucoseND1.24 ± 0.02 b2.72 ± 0.04 a1.05 ± 0.02 c0.42 ± 0.01 b0.20 ± 0.00 a<0.05
Sucrose5.41 ± 0.14 a1.06 ± 0.02 b0.14 ± 0.01 c0.07 ± 0.00 cdNDND<0.05
Data represent the mean ± standard deviation (n = 3). Means with different superscripts in the same row differ significantly (p < 0.05). ND: not detected.
Table 3. Evaluation of the proportion of secondary protein components of the unfermented and fermented lentil–casein protein complex at a ratio of 1.0:0.1 (LCPC 1.0:0.1).
Secondary Protein ComponentsPeak (cm−1)Fermentation Periodp-Value
Day 0Day 1Day 2Day 3Day 4Day 5
β-Sheet
1614.428.5111.3011.4811.5011.2811.25
1622.1311.588.918.989.068.888.83
1633.7115.3211.7611.8511.8011.5111.58
β-Sheet (Ʃ) 30.90 a31.97 a32.31 a32.34 a31.67 a31.66 a>0.05
RC (Ʃ)1645.2815.32 f15.83 e17.65 d18.85 c20.43 b21.67 a<0.05
α-Helix (Ʃ)1654.079.90 a9.71 b7.71 c7.63 d7.25 e6.58 f<0.05
β-Turn
1668.4312.2912.4113.2313.3813.0313.51
1681.9311.3511.7312.6912.8512.7011.21
1693.5020.2418.3316.4014.9414.9015.3
β-Turn (Ʃ) 43.87 a42.47 a42.32 a41.17 a40.63 a40.07 a>0.05
Ratio (α-helix:β-sheet) 32.0430.3823.8723.5822.9020.81
Means (n = 3) with different superscripts in the same row differ significantly (p < 0.05).
Table 4. Evaluation of total phenolic content (TPC, mg GAE/100 g) and phenolic compounds (mg/100 g) during water kefir-assisted fermentation of lentil–casein protein complex at a ratio of 1.0:0.1 (LCPC 1.0:0.1).
Fermentation Period [Day]p-Value
012345
TPC394.46 ± 3.72 d516.83 ± 8.95 b624.88 ± 7.23 a458.33 ± 11.51 c411.17 ± 11.74 d405.80 ± 14.21 d<0.05
Phenolic Compounds
Catechin34.03 ± 0.48 f61.90 ± 0.54 b63.08 ± 0.77 a59.53 ± 0.21 c56.49 ± 0.14 d51.74 ± 0.39 e<0.05
Chlorogenic84.93 ± 0.98 e89.61 ± 0.76 bc105.03 ± 0.42 a90.62 ± 0.29 b88.45 ± 1.11 cd87.34 ± 0.76 d<0.05
Epicatechin106.85 ± 0.54 f127.87 ± 0.57 b157.55 ± 0.87 a122.05 ± 0.67 a116.31 ± 0.25 d112.33 ± 0.28 e<0.05
Quercetin14.05 ± 0.68 c14.16 ± 0.44 c15.07 ± 0.18 c14.55 ± 0.56 bc16.05 ± 0.34 a3.04 ± 0.10 d<0.05
Rutin2.43 ± 0.05 c1.90 ± 0.08 d2.27 ± 0.04 cd4.50 ± 0.23 a4.37 ± 0.07 a3.69 ± 0.49 b<0.05
Caffeic acidNDNDNDND4.10 ± 0.05 b5.29 ± 0.04 a<0.05
Ferulic acid3.77 ± 0.05 b3.86 ± 0.07 a4.14 ± 0.04 a4.04 ± 0.04 a3.83 ± 0.11 b3.81 ± 0.08 b<0.05
Gallic acid11.76 ± 0.90 e19.44 ± 0.43 b20.51 ± 0.39 b27.67 ± 0.59 a15.85 ± 0.84 c14.02 ± 0.44 d<0.05
Sinapic acid0.00 1.61 ± 0.04 ab1.41 ± 0.11 a1.15 ± 0.03 ab1.00 ± 0.03 ab0.90 ± 0.02 b<0.05
Synergic acid46.90 ± 0.97 b46.96 ± 0.51 b50.27 ± 0.48 a47.60 ± 0.87 b47.45 ± 1.16 b47.28 ± 2.50 b<0.05
Phenolic Compounds (Ʃ)304.71 f367.30 c419.33 a371.72 b353.88 d329.46 e<0.05
Data represent the mean ± standard deviation (n = 3). Means with different superscript letters within the same row are significantly different from each other (p < 0.05). ND: not detected.
Disclaimer/Publisher’s Note: The statements, opinions and data contained in all publications are solely those of the individual author(s) and contributor(s) and not of MDPI and/or the editor(s). MDPI and/or the editor(s) disclaim responsibility for any injury to people or property resulting from any ideas, methods, instructions or products referred to in the content.

