
Dynamic Analysis of the Bacterial Community and Determination of Antioxidant Capacity during the Fermentation of Sour Tea
 and
and 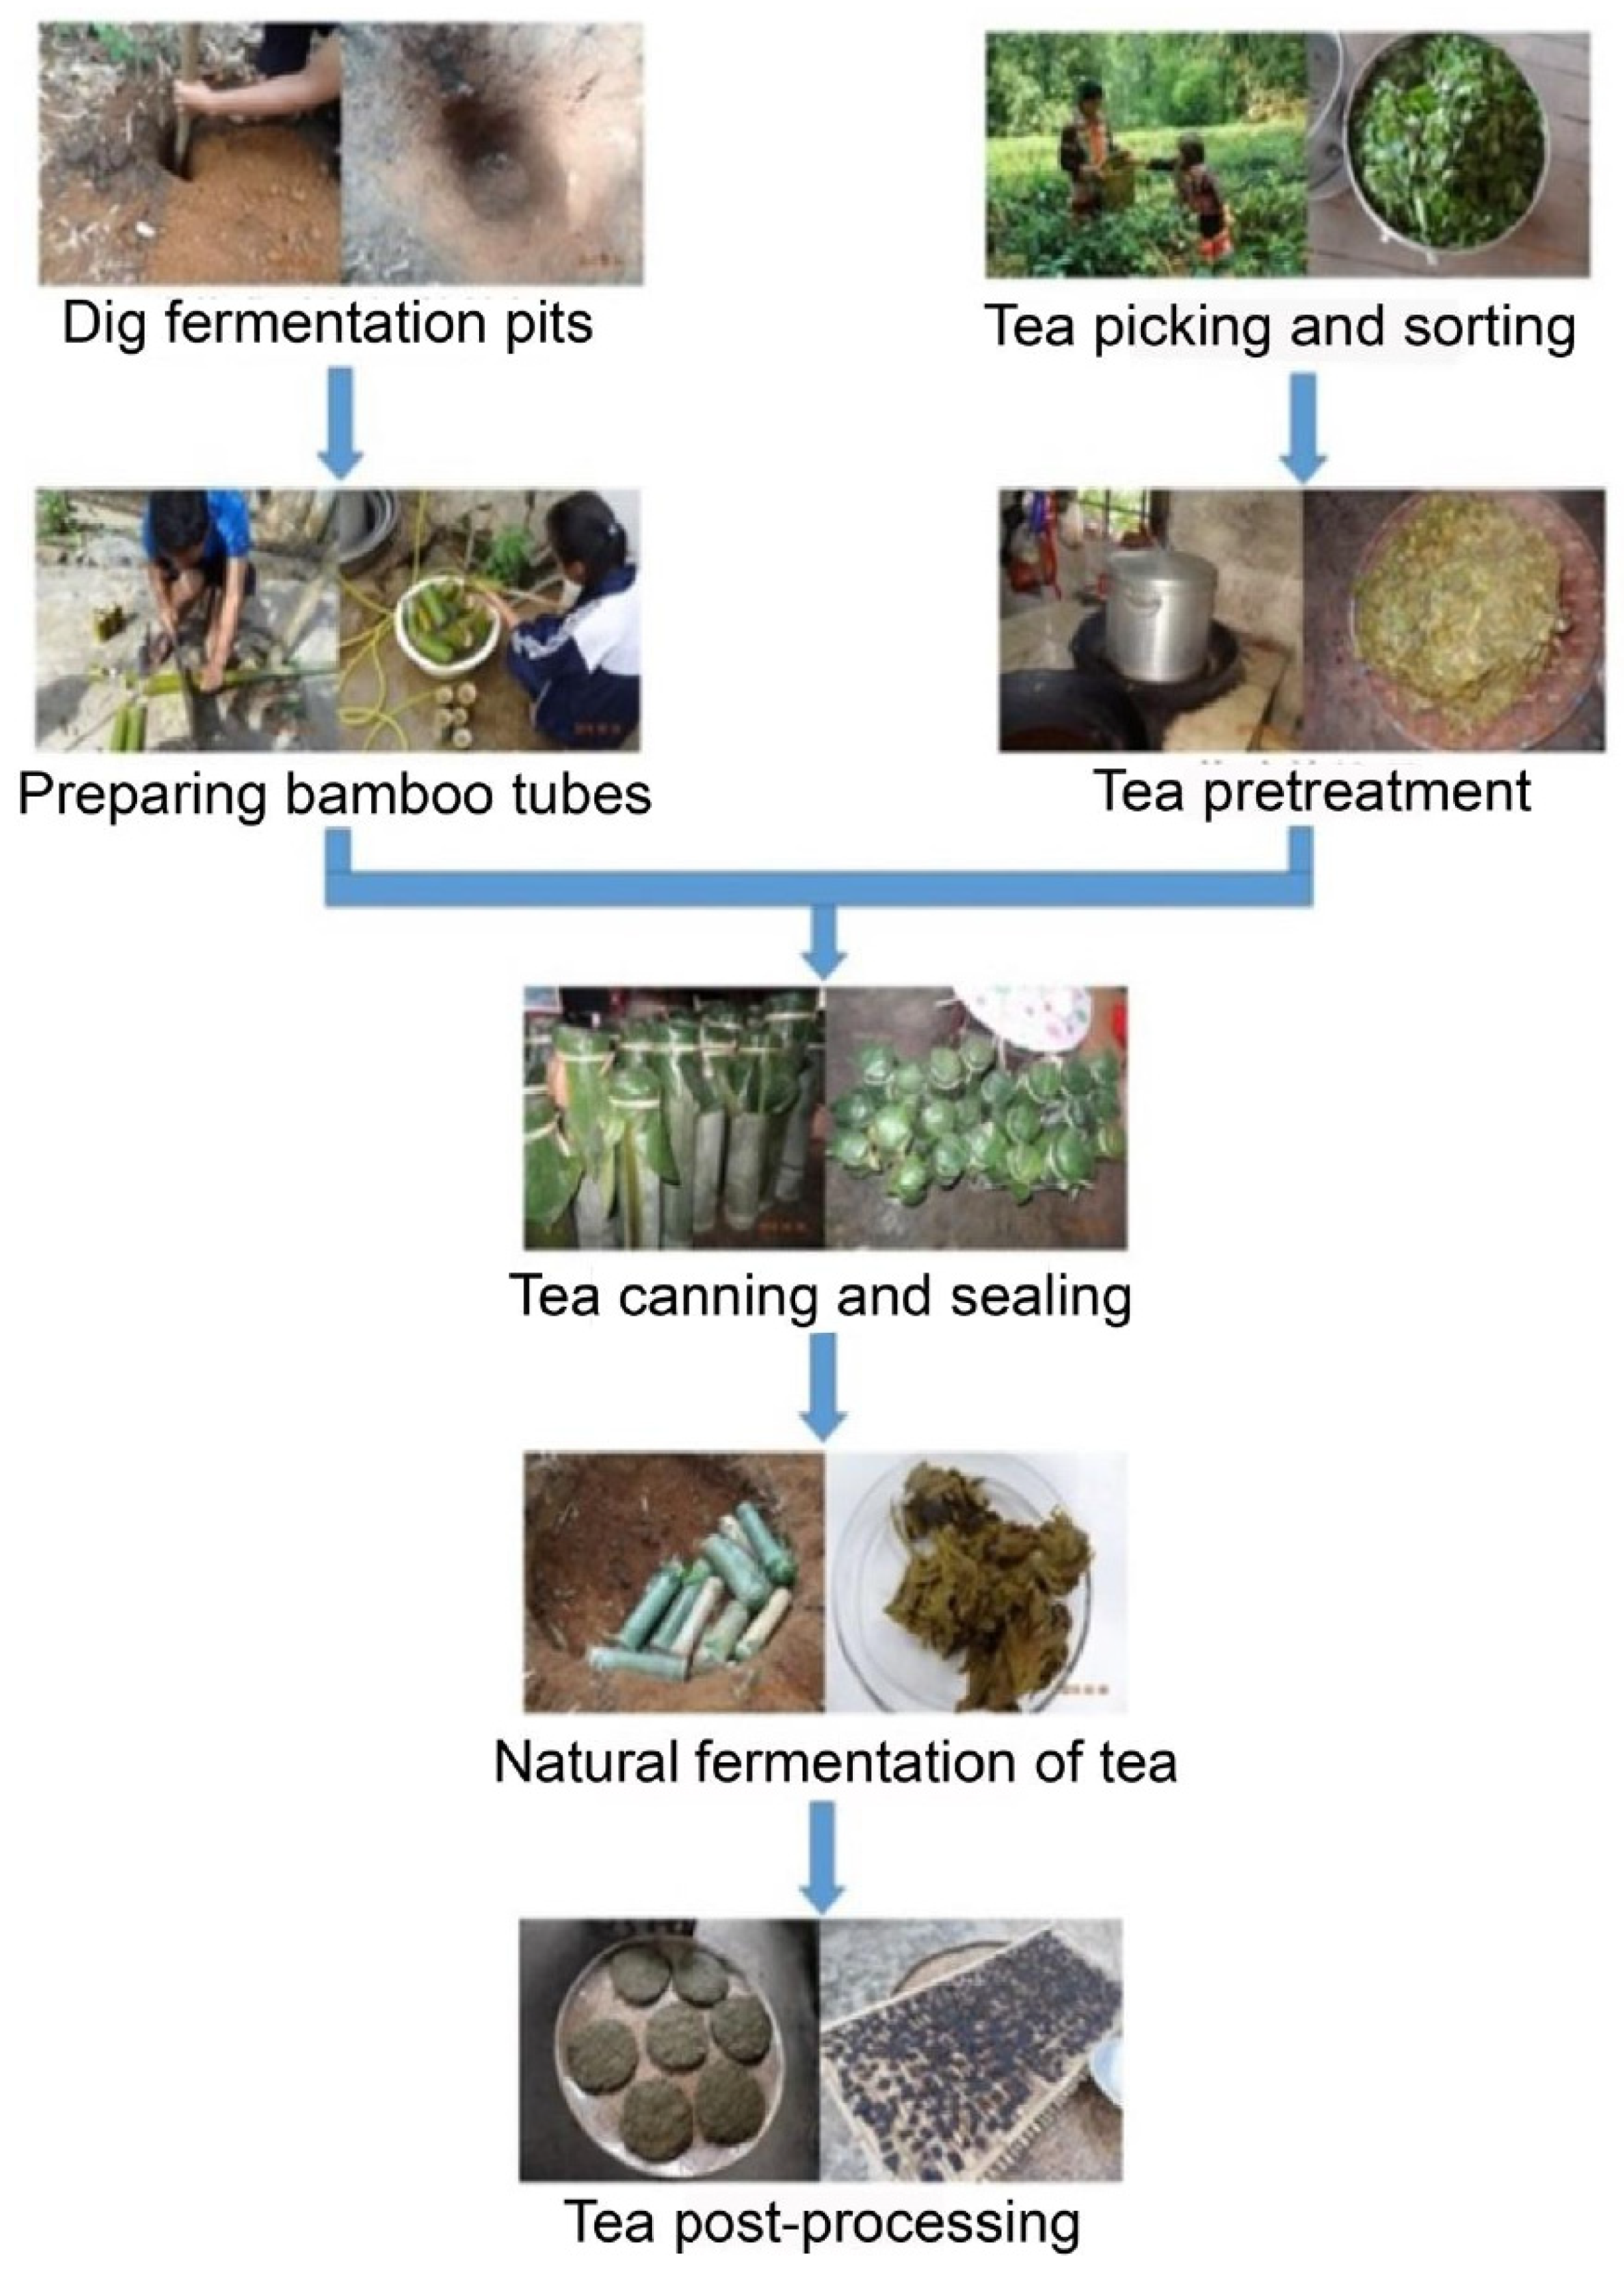
Abstract
:1. Introduction
2. Materials and Methods
2.1. Sample Collection
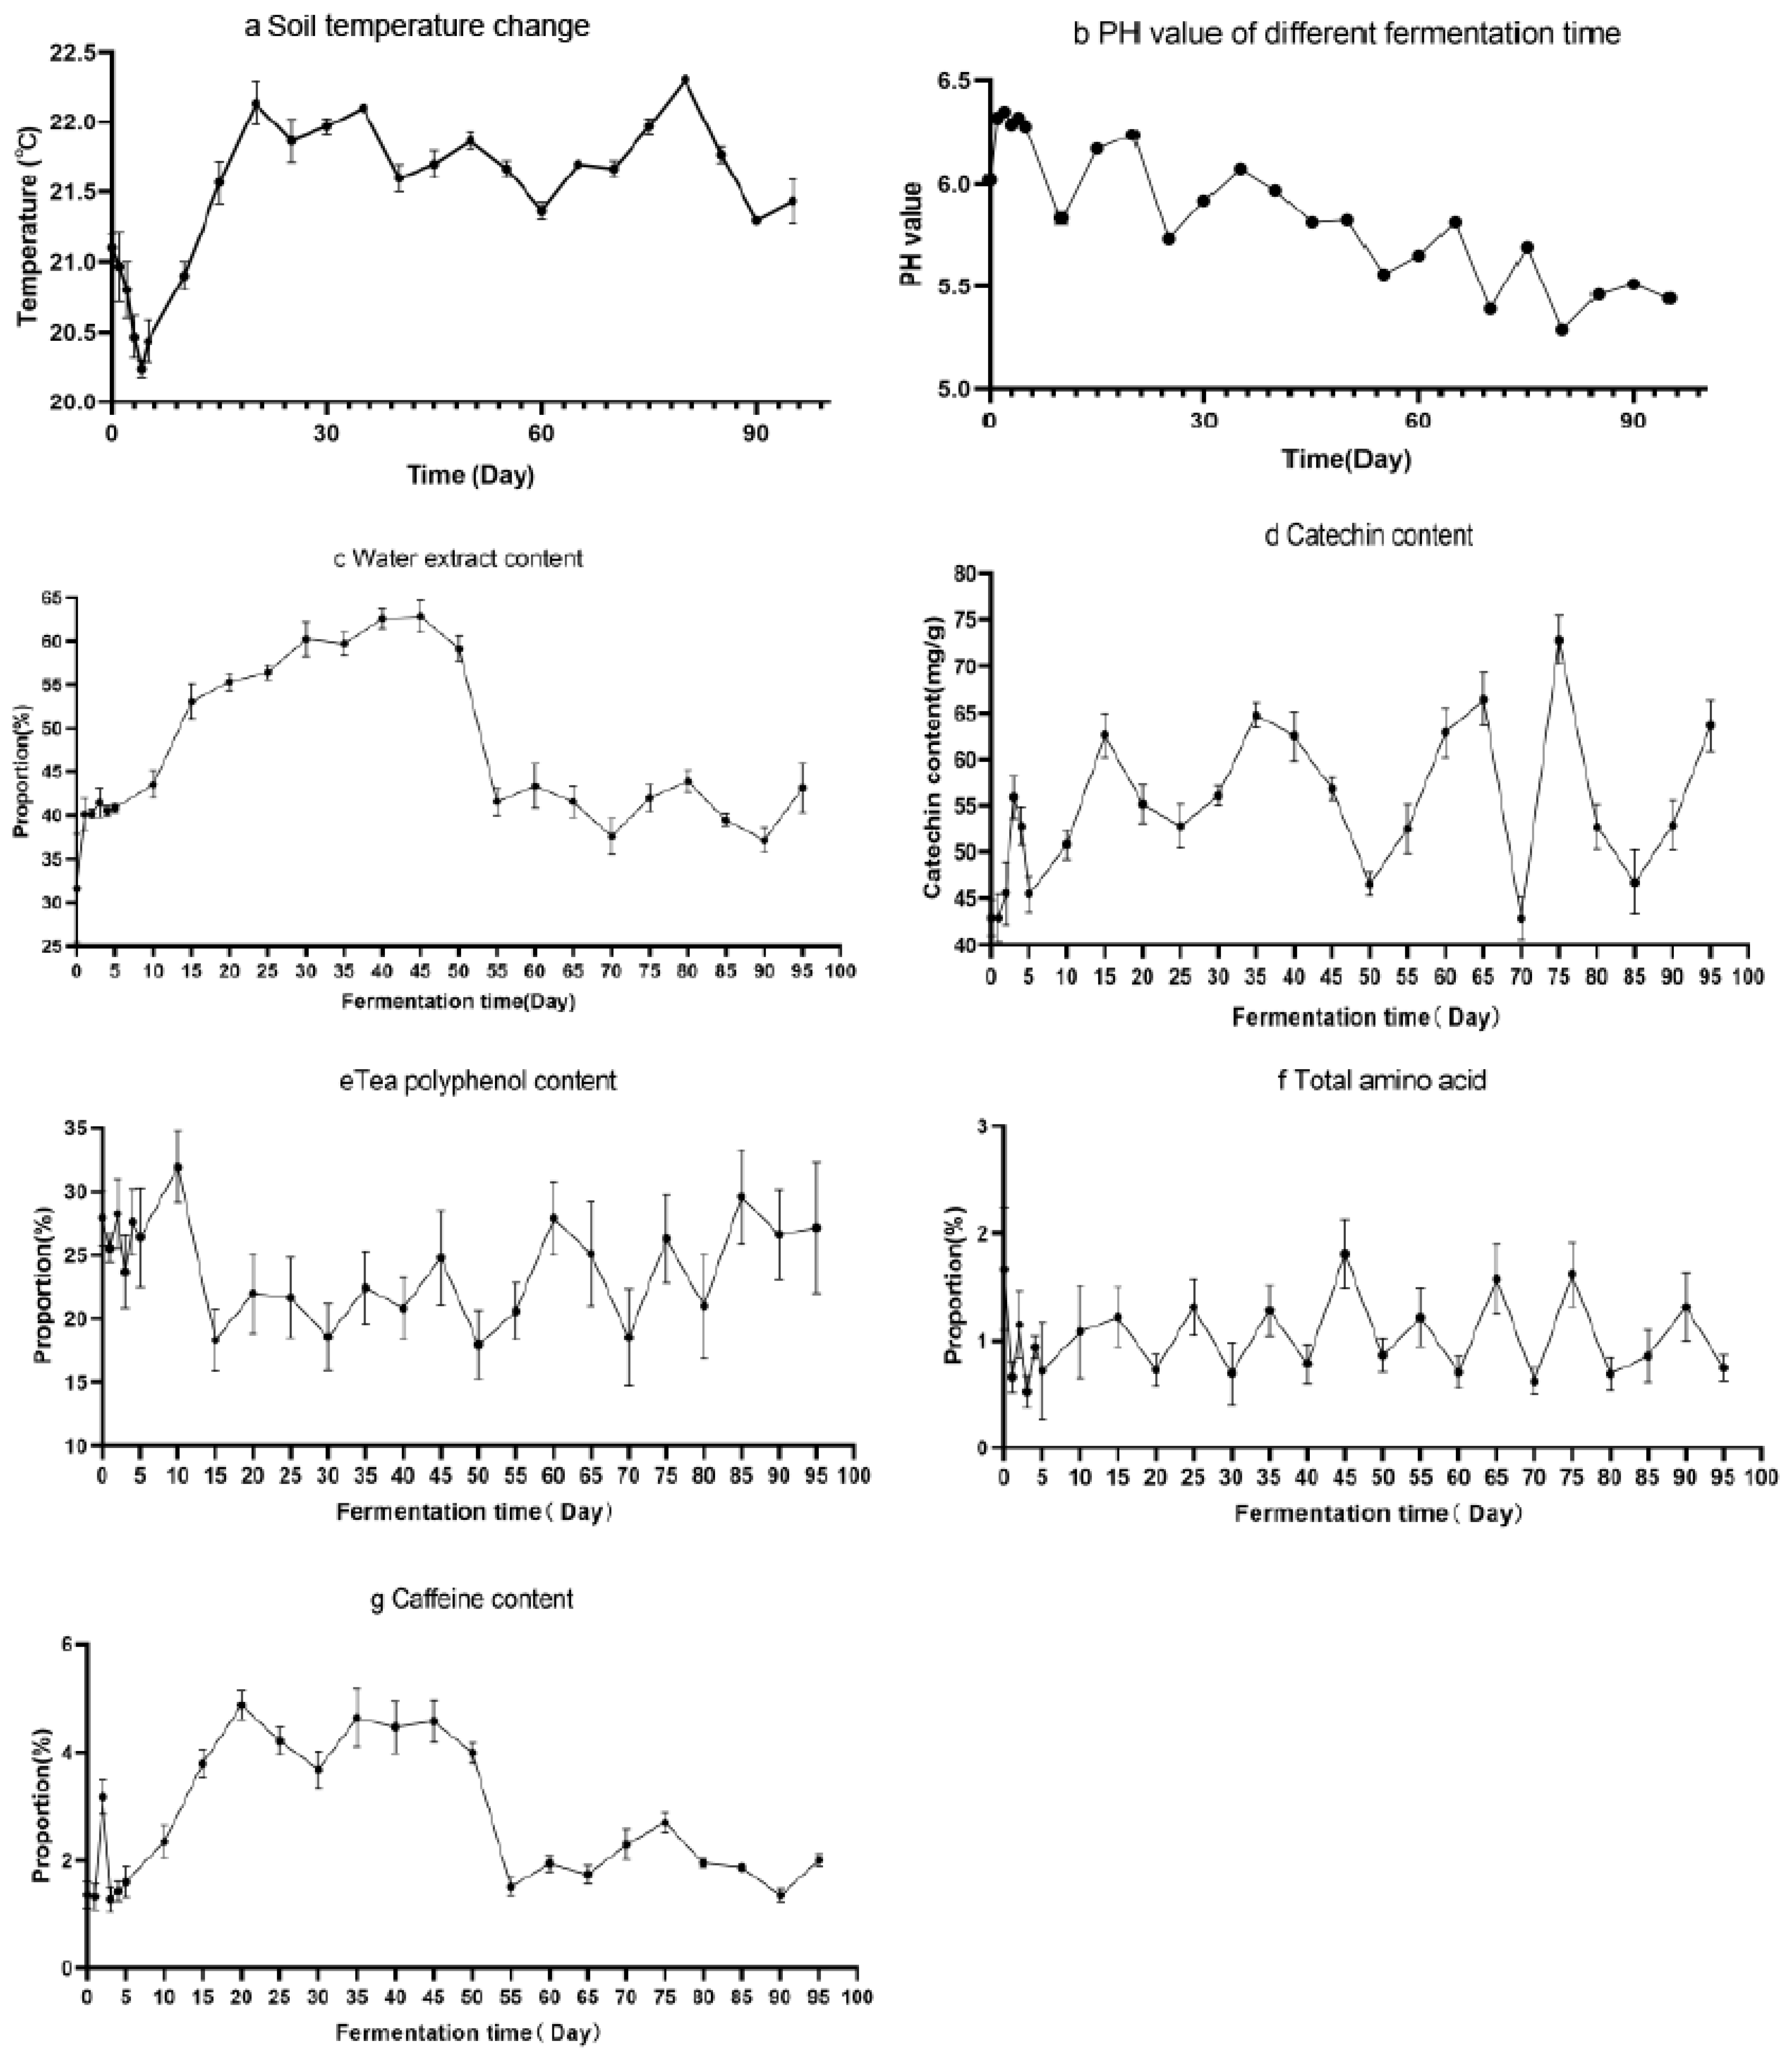
2.2. Analysis of Biochemical Characteristics
2.2.1. pH Determination
2.2.2. Catechin Detection
2.2.3. Tea Polyphenol Detection
2.2.4. Caffeine Detection
2.2.5. Determination of the Total Amount of Free Amino Acids
2.2.6. Determination of the Water Extract
2.3. Whole-Genome DNA of Sour Tea Was Extracted, Amplified and Sequenced by PCR
2.4. Bioinformatics Analysis
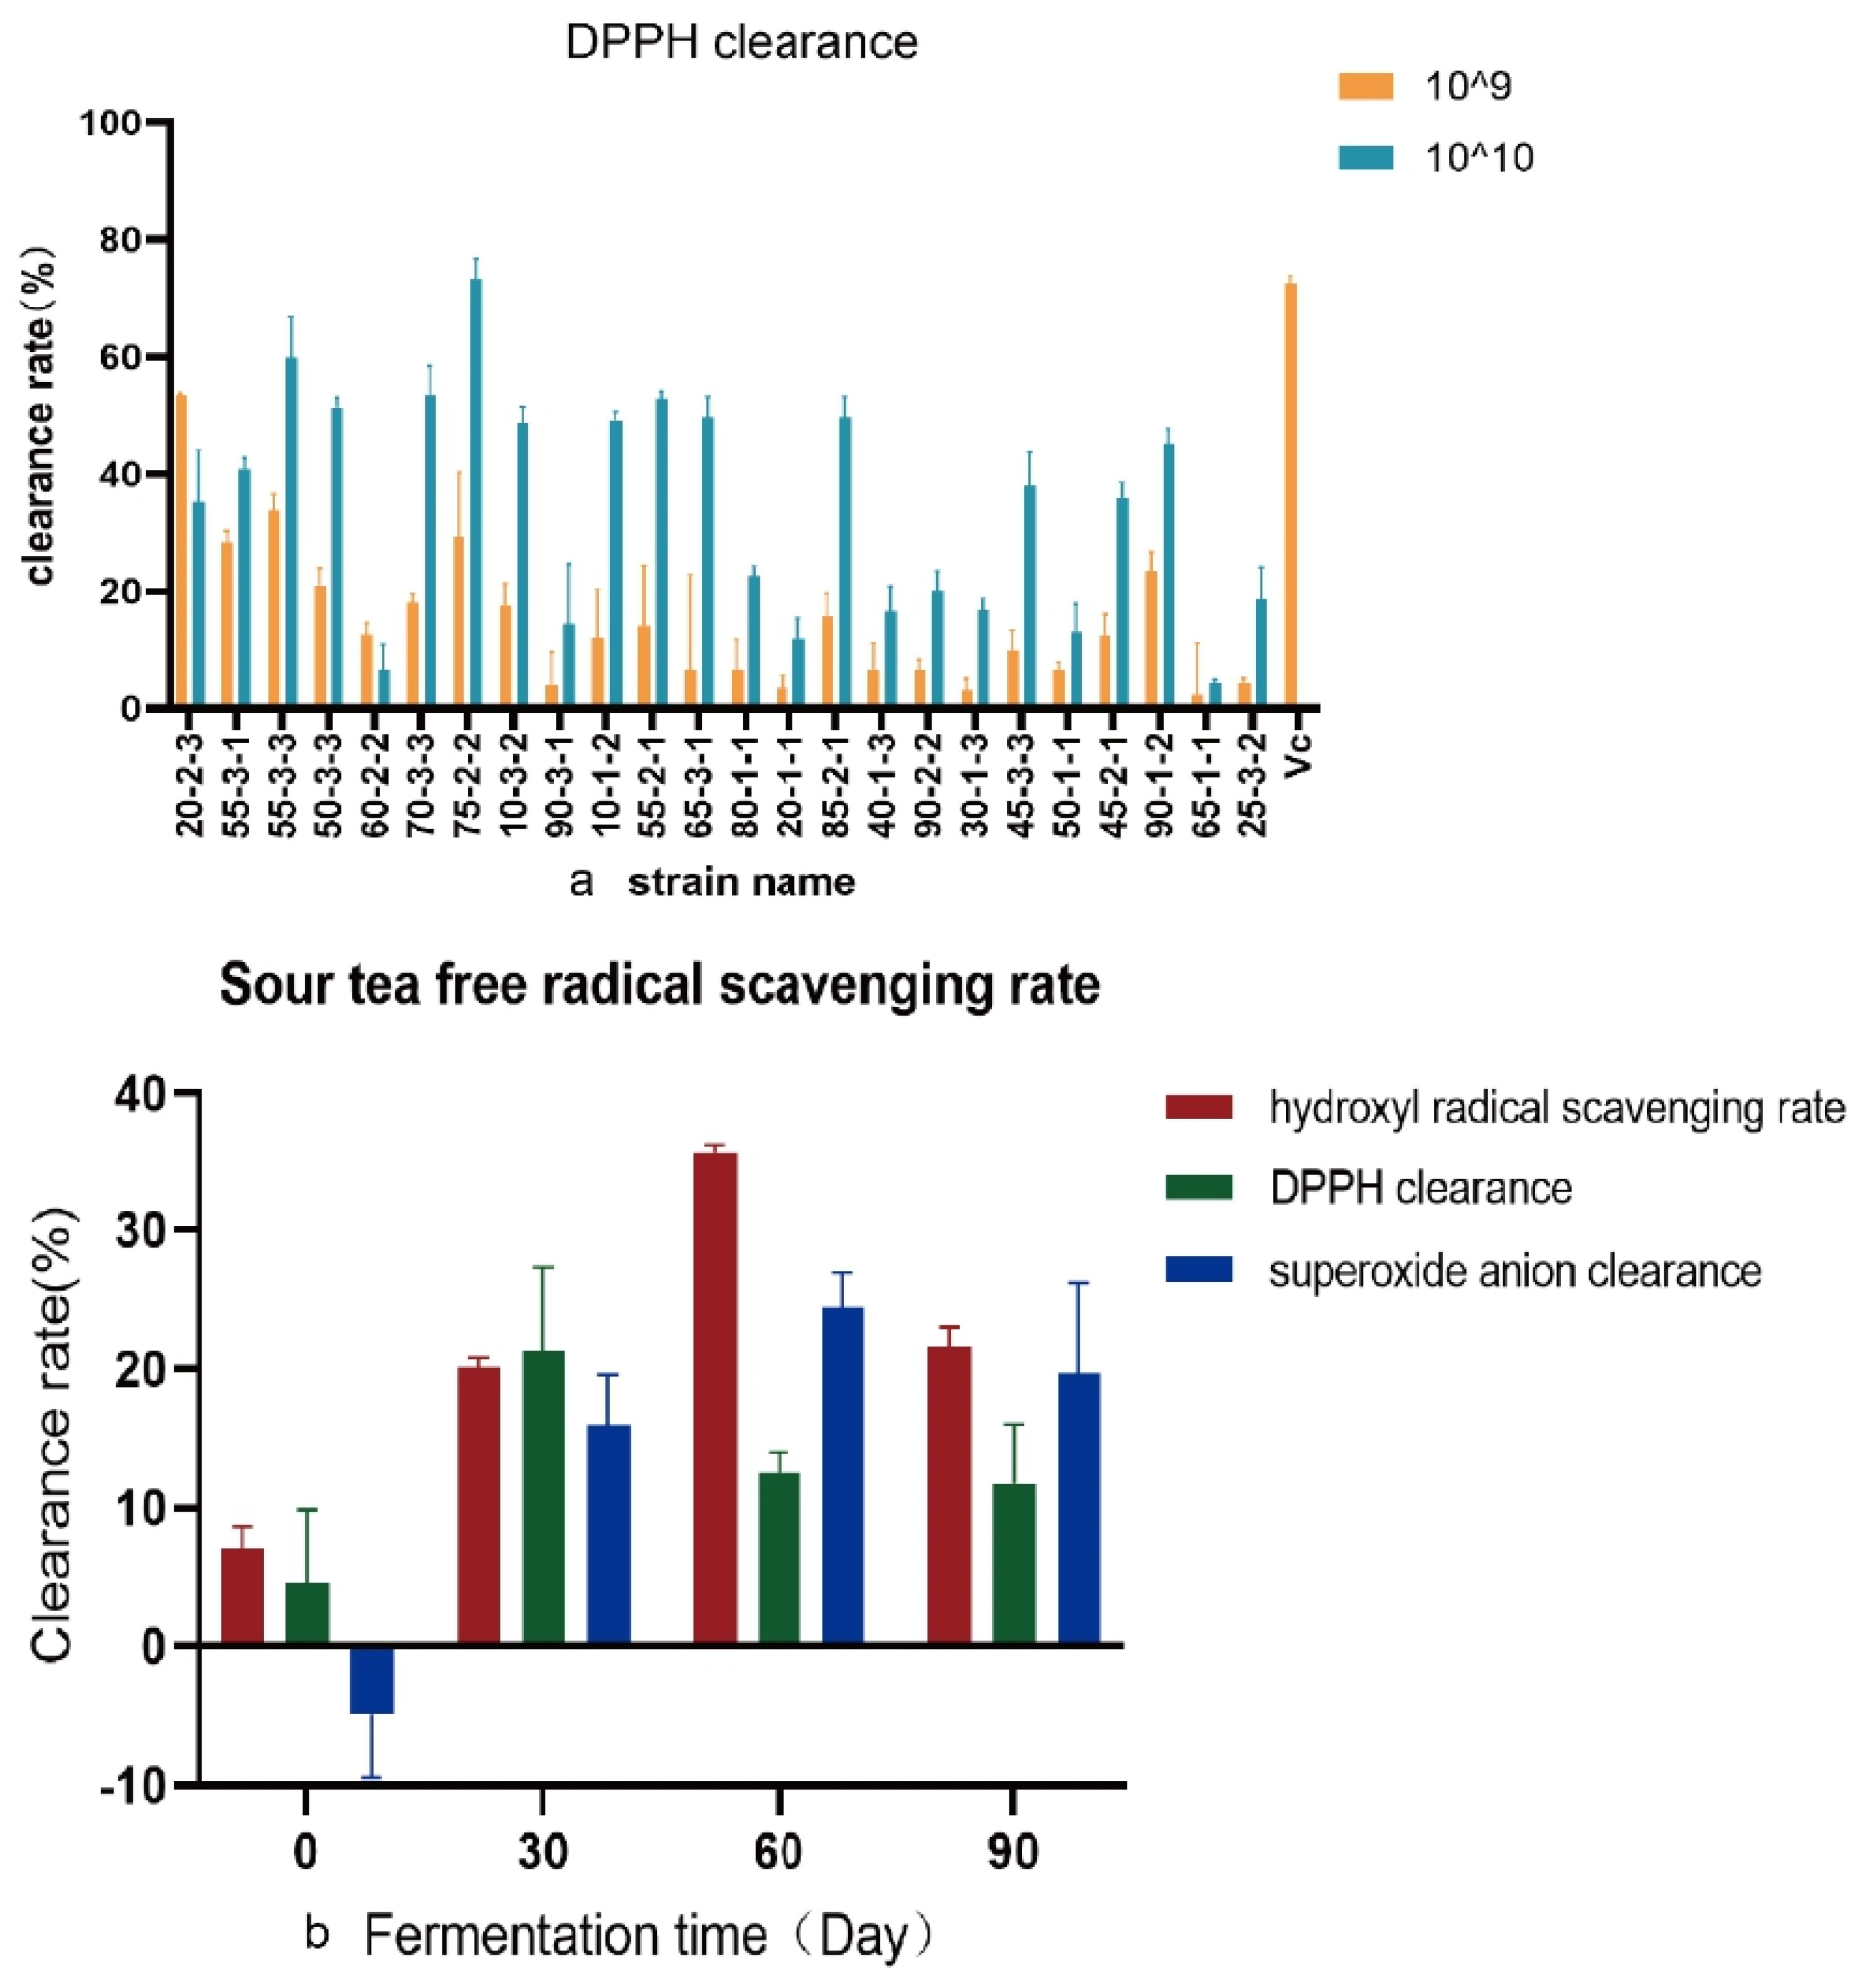
2.5. Radical Scavenging Activity
3. Results
3.1. Physicochemical Analysis
3.2. Free Radical Scavenging Activity of Sour Tea and Lb. plantarum
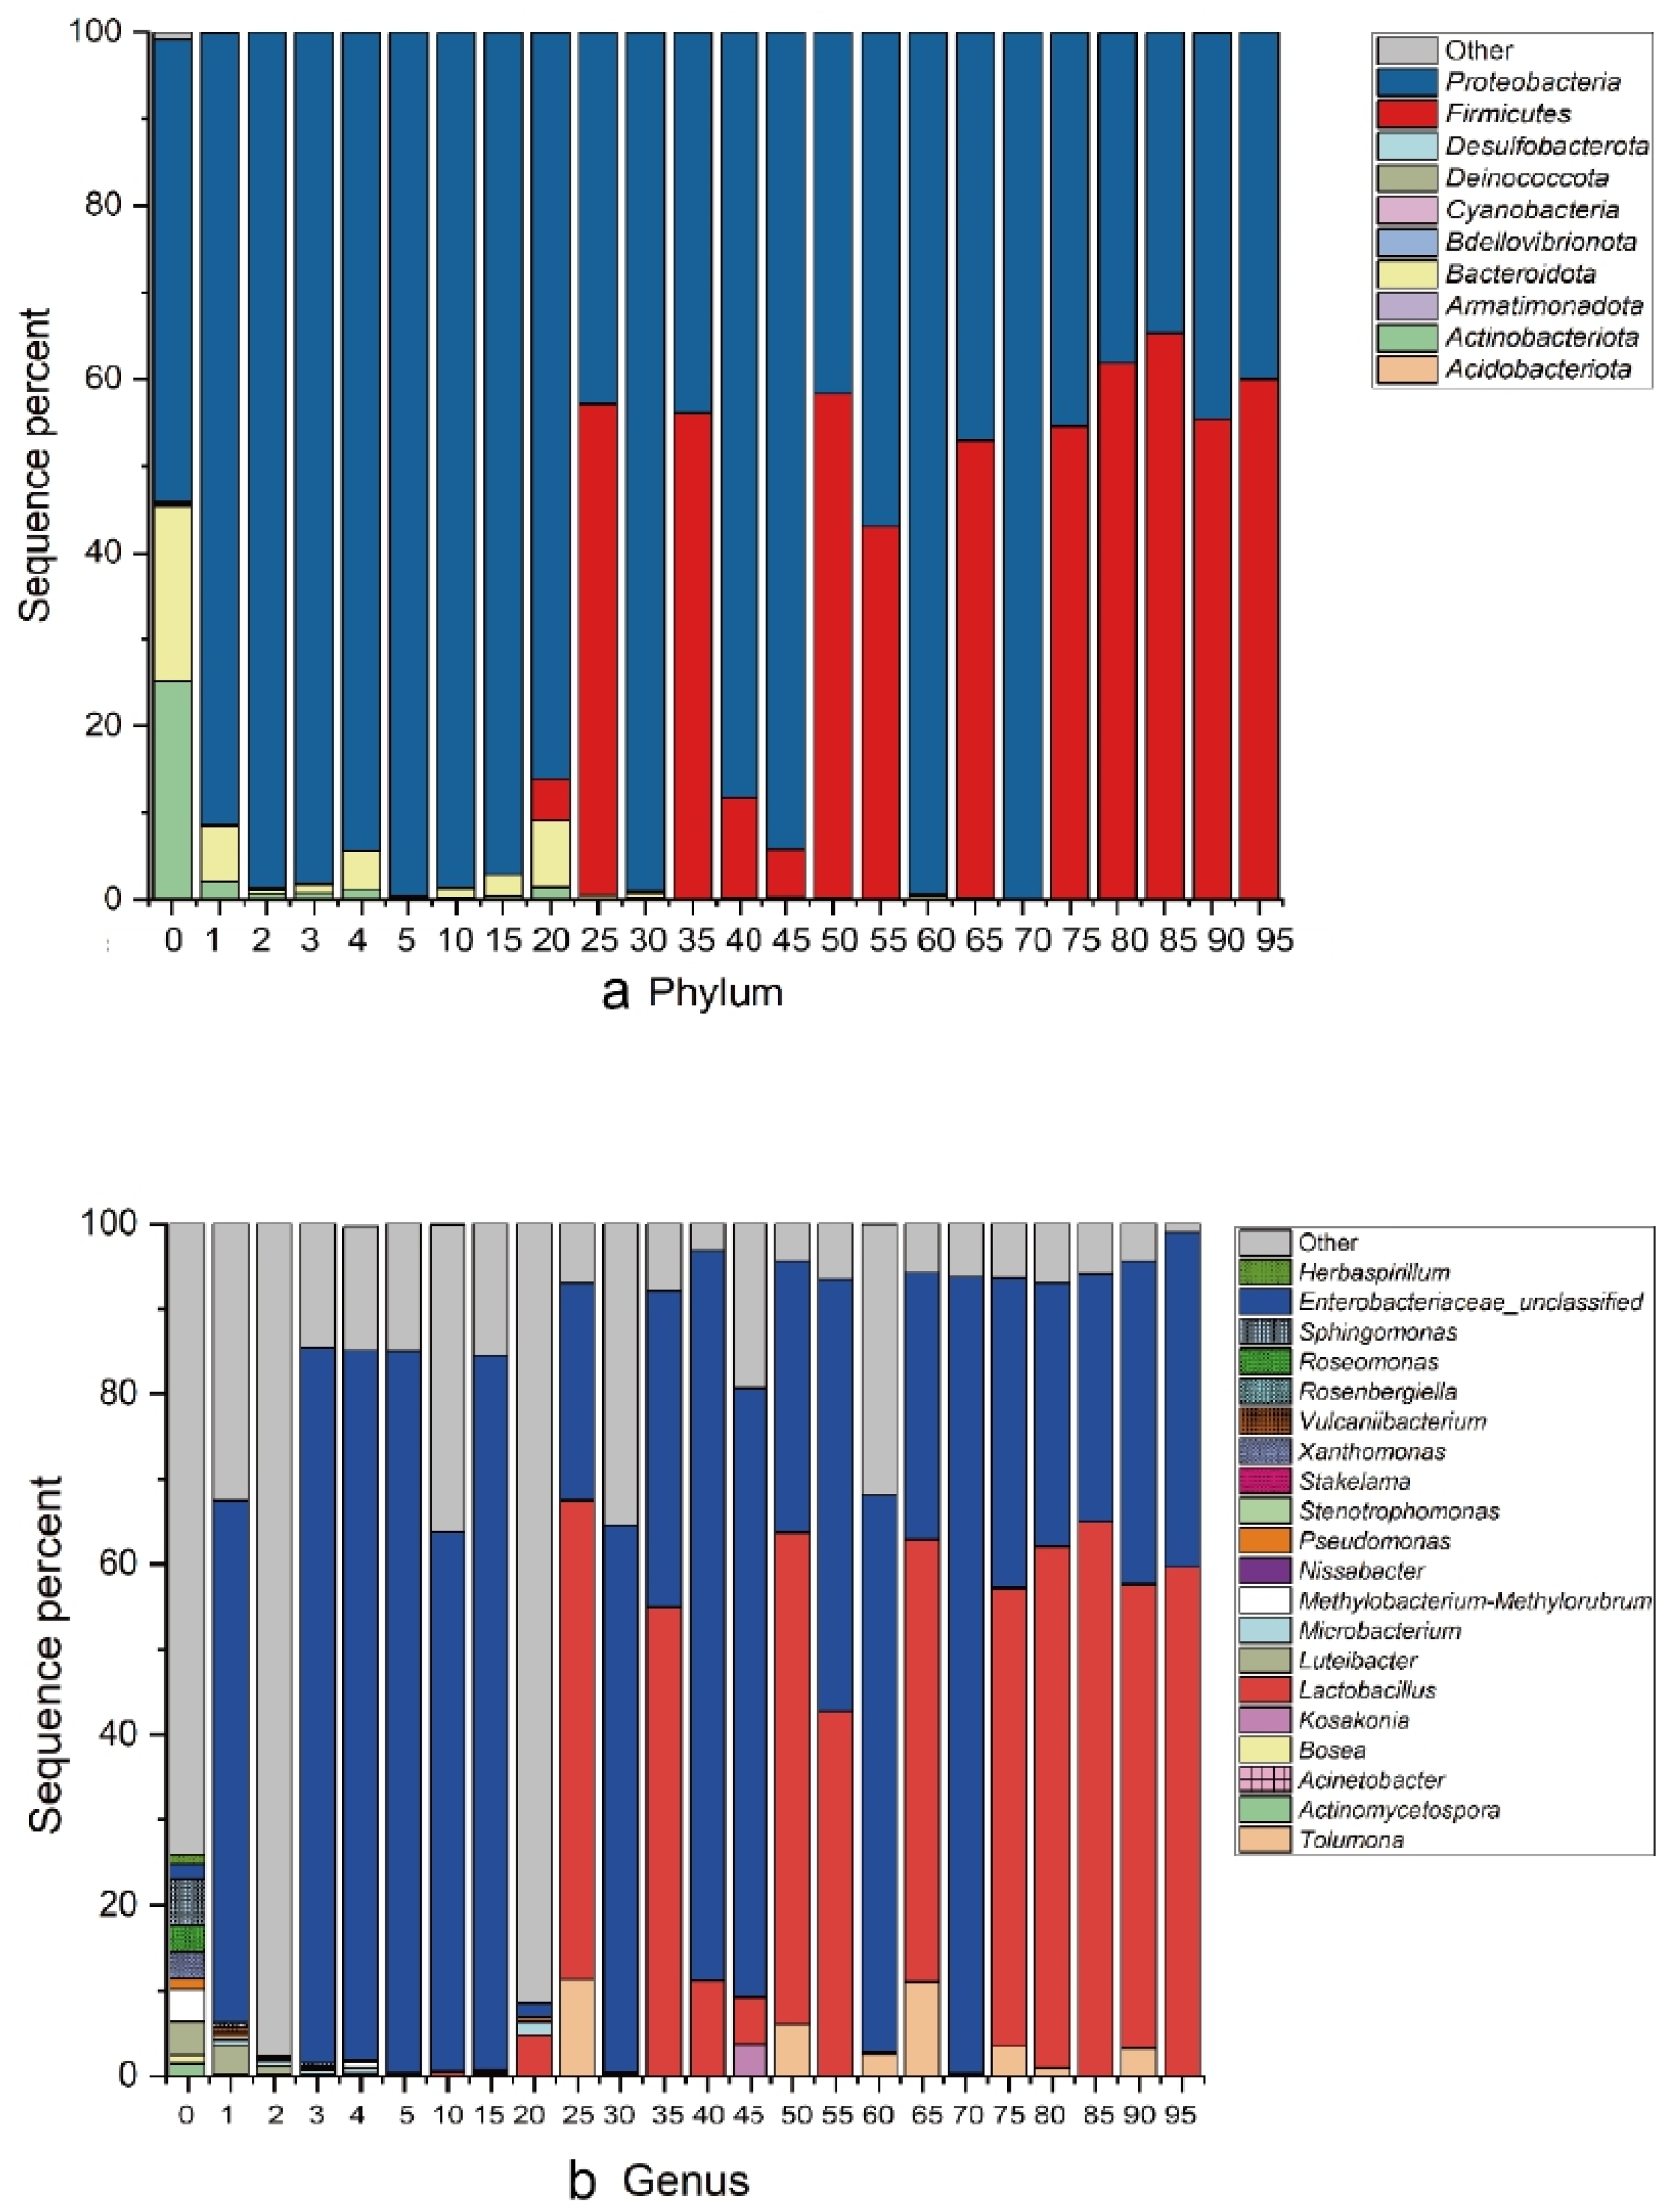
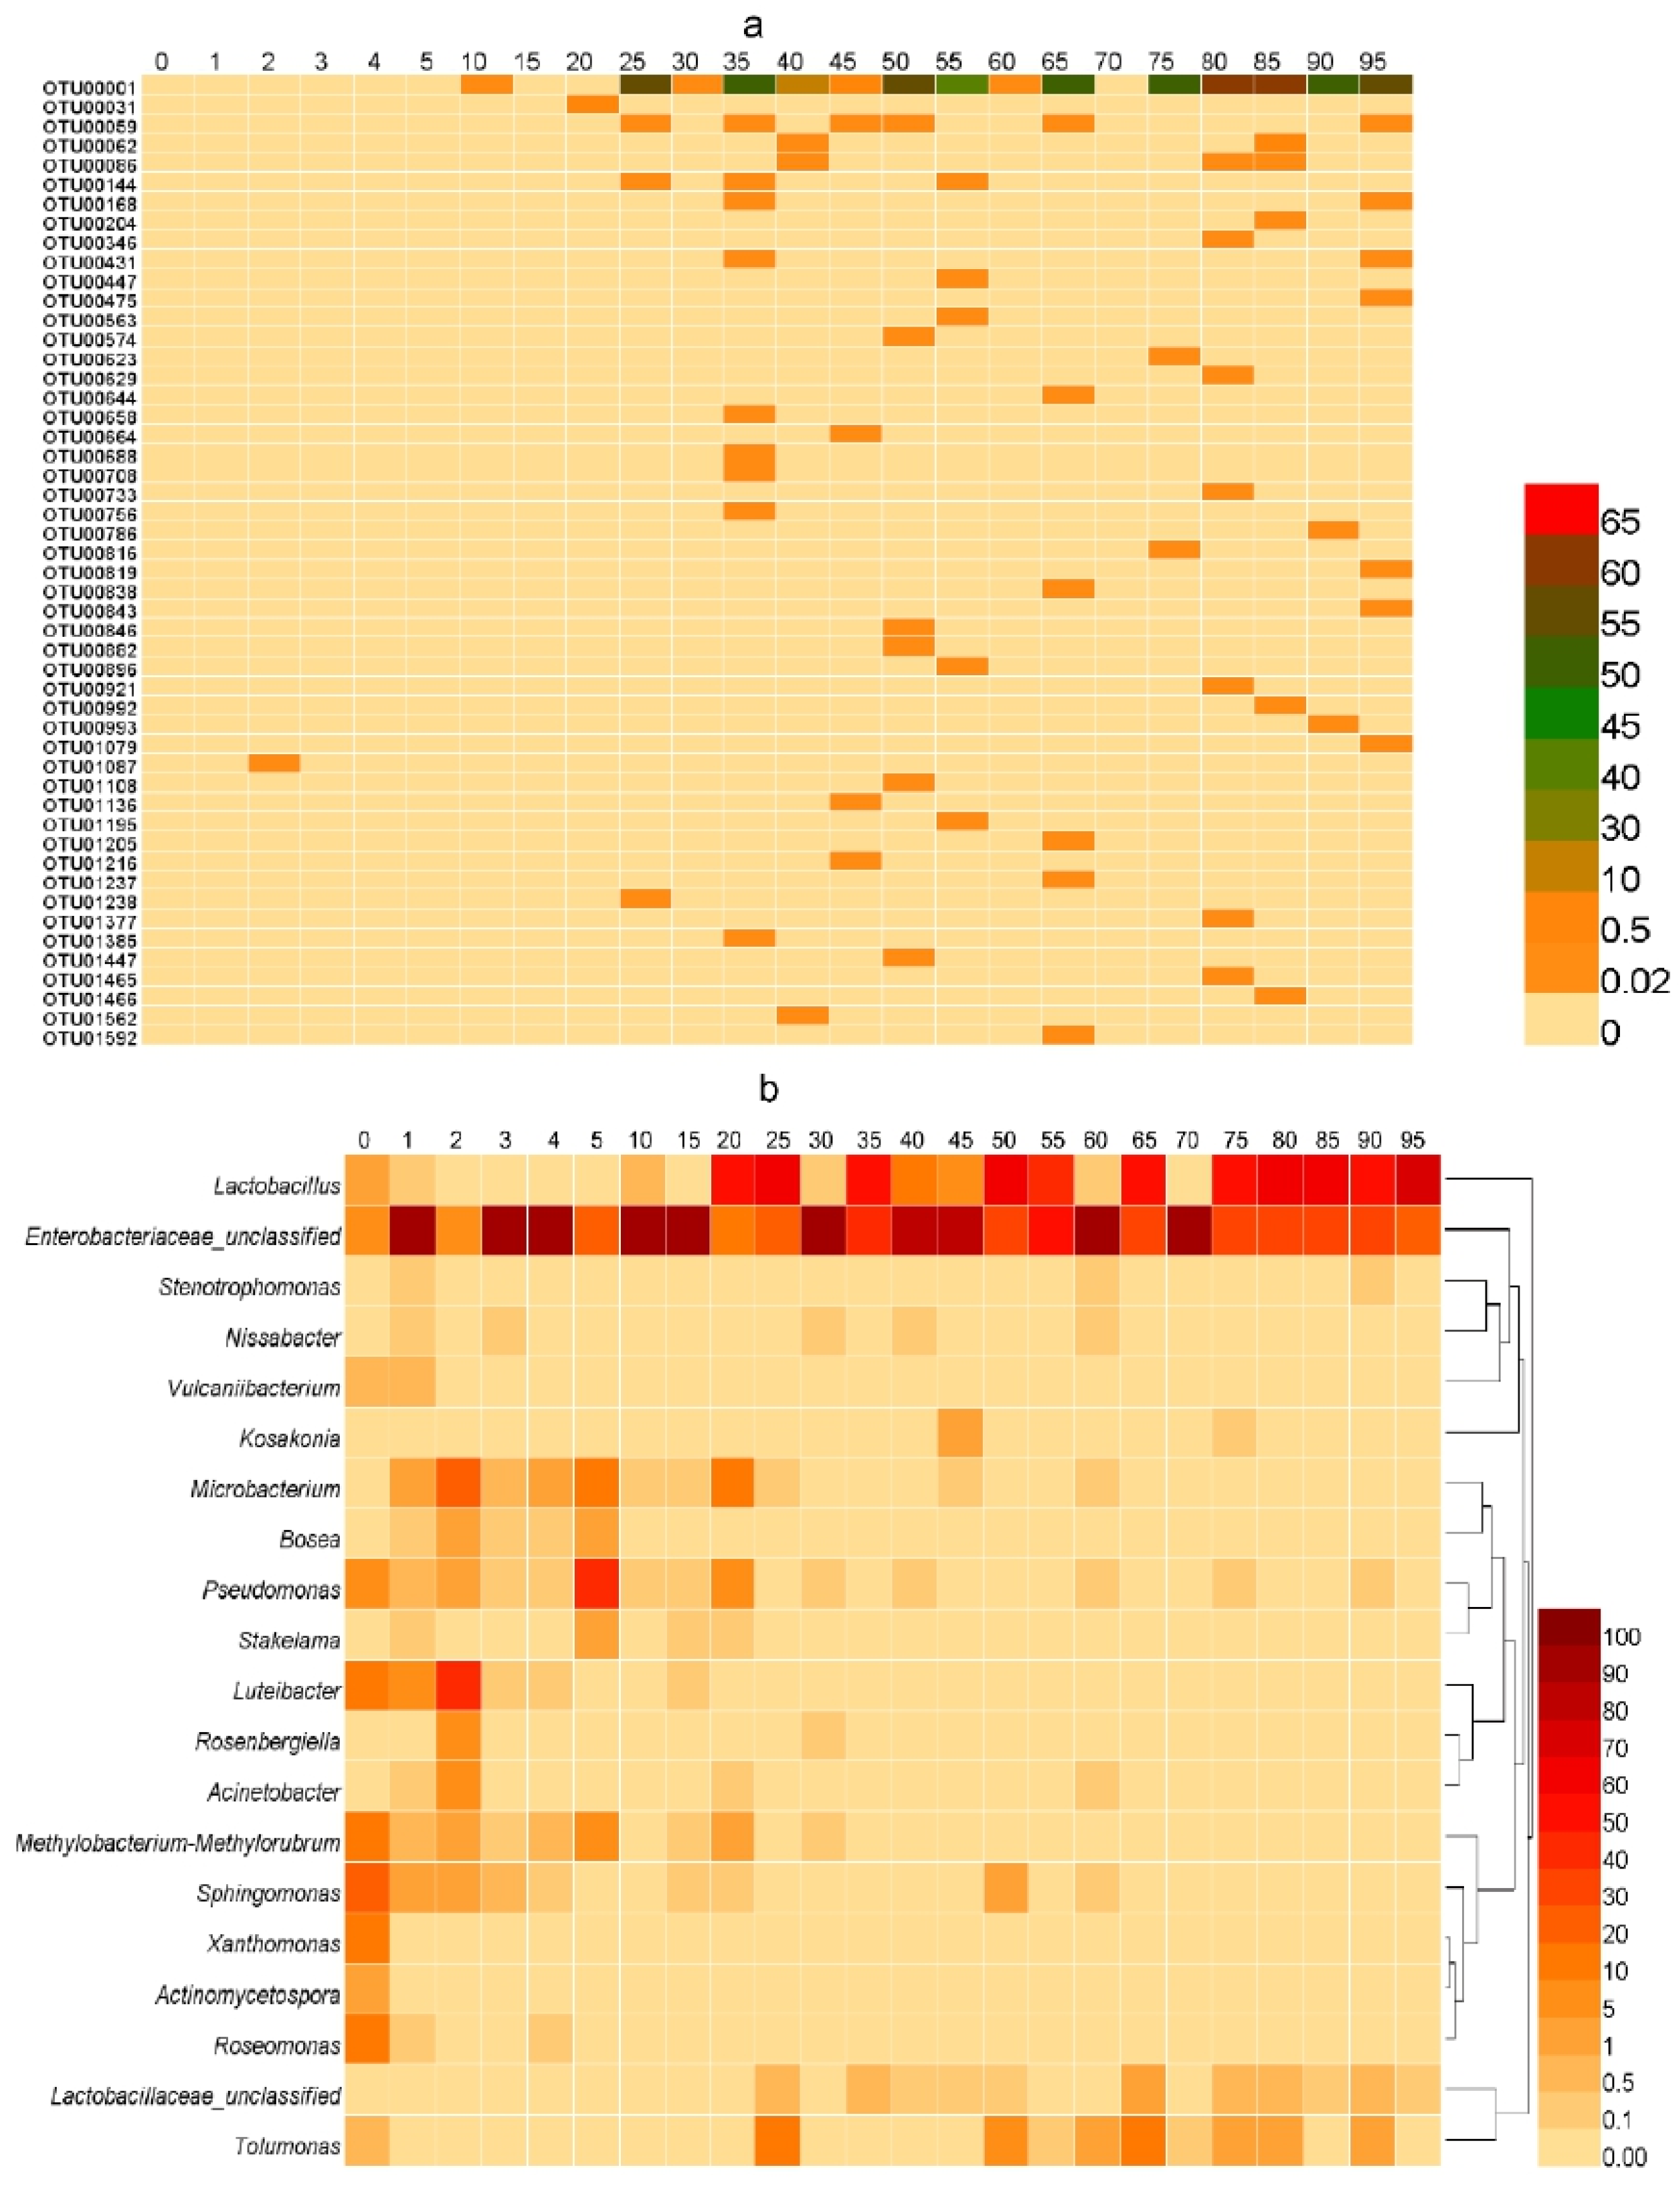
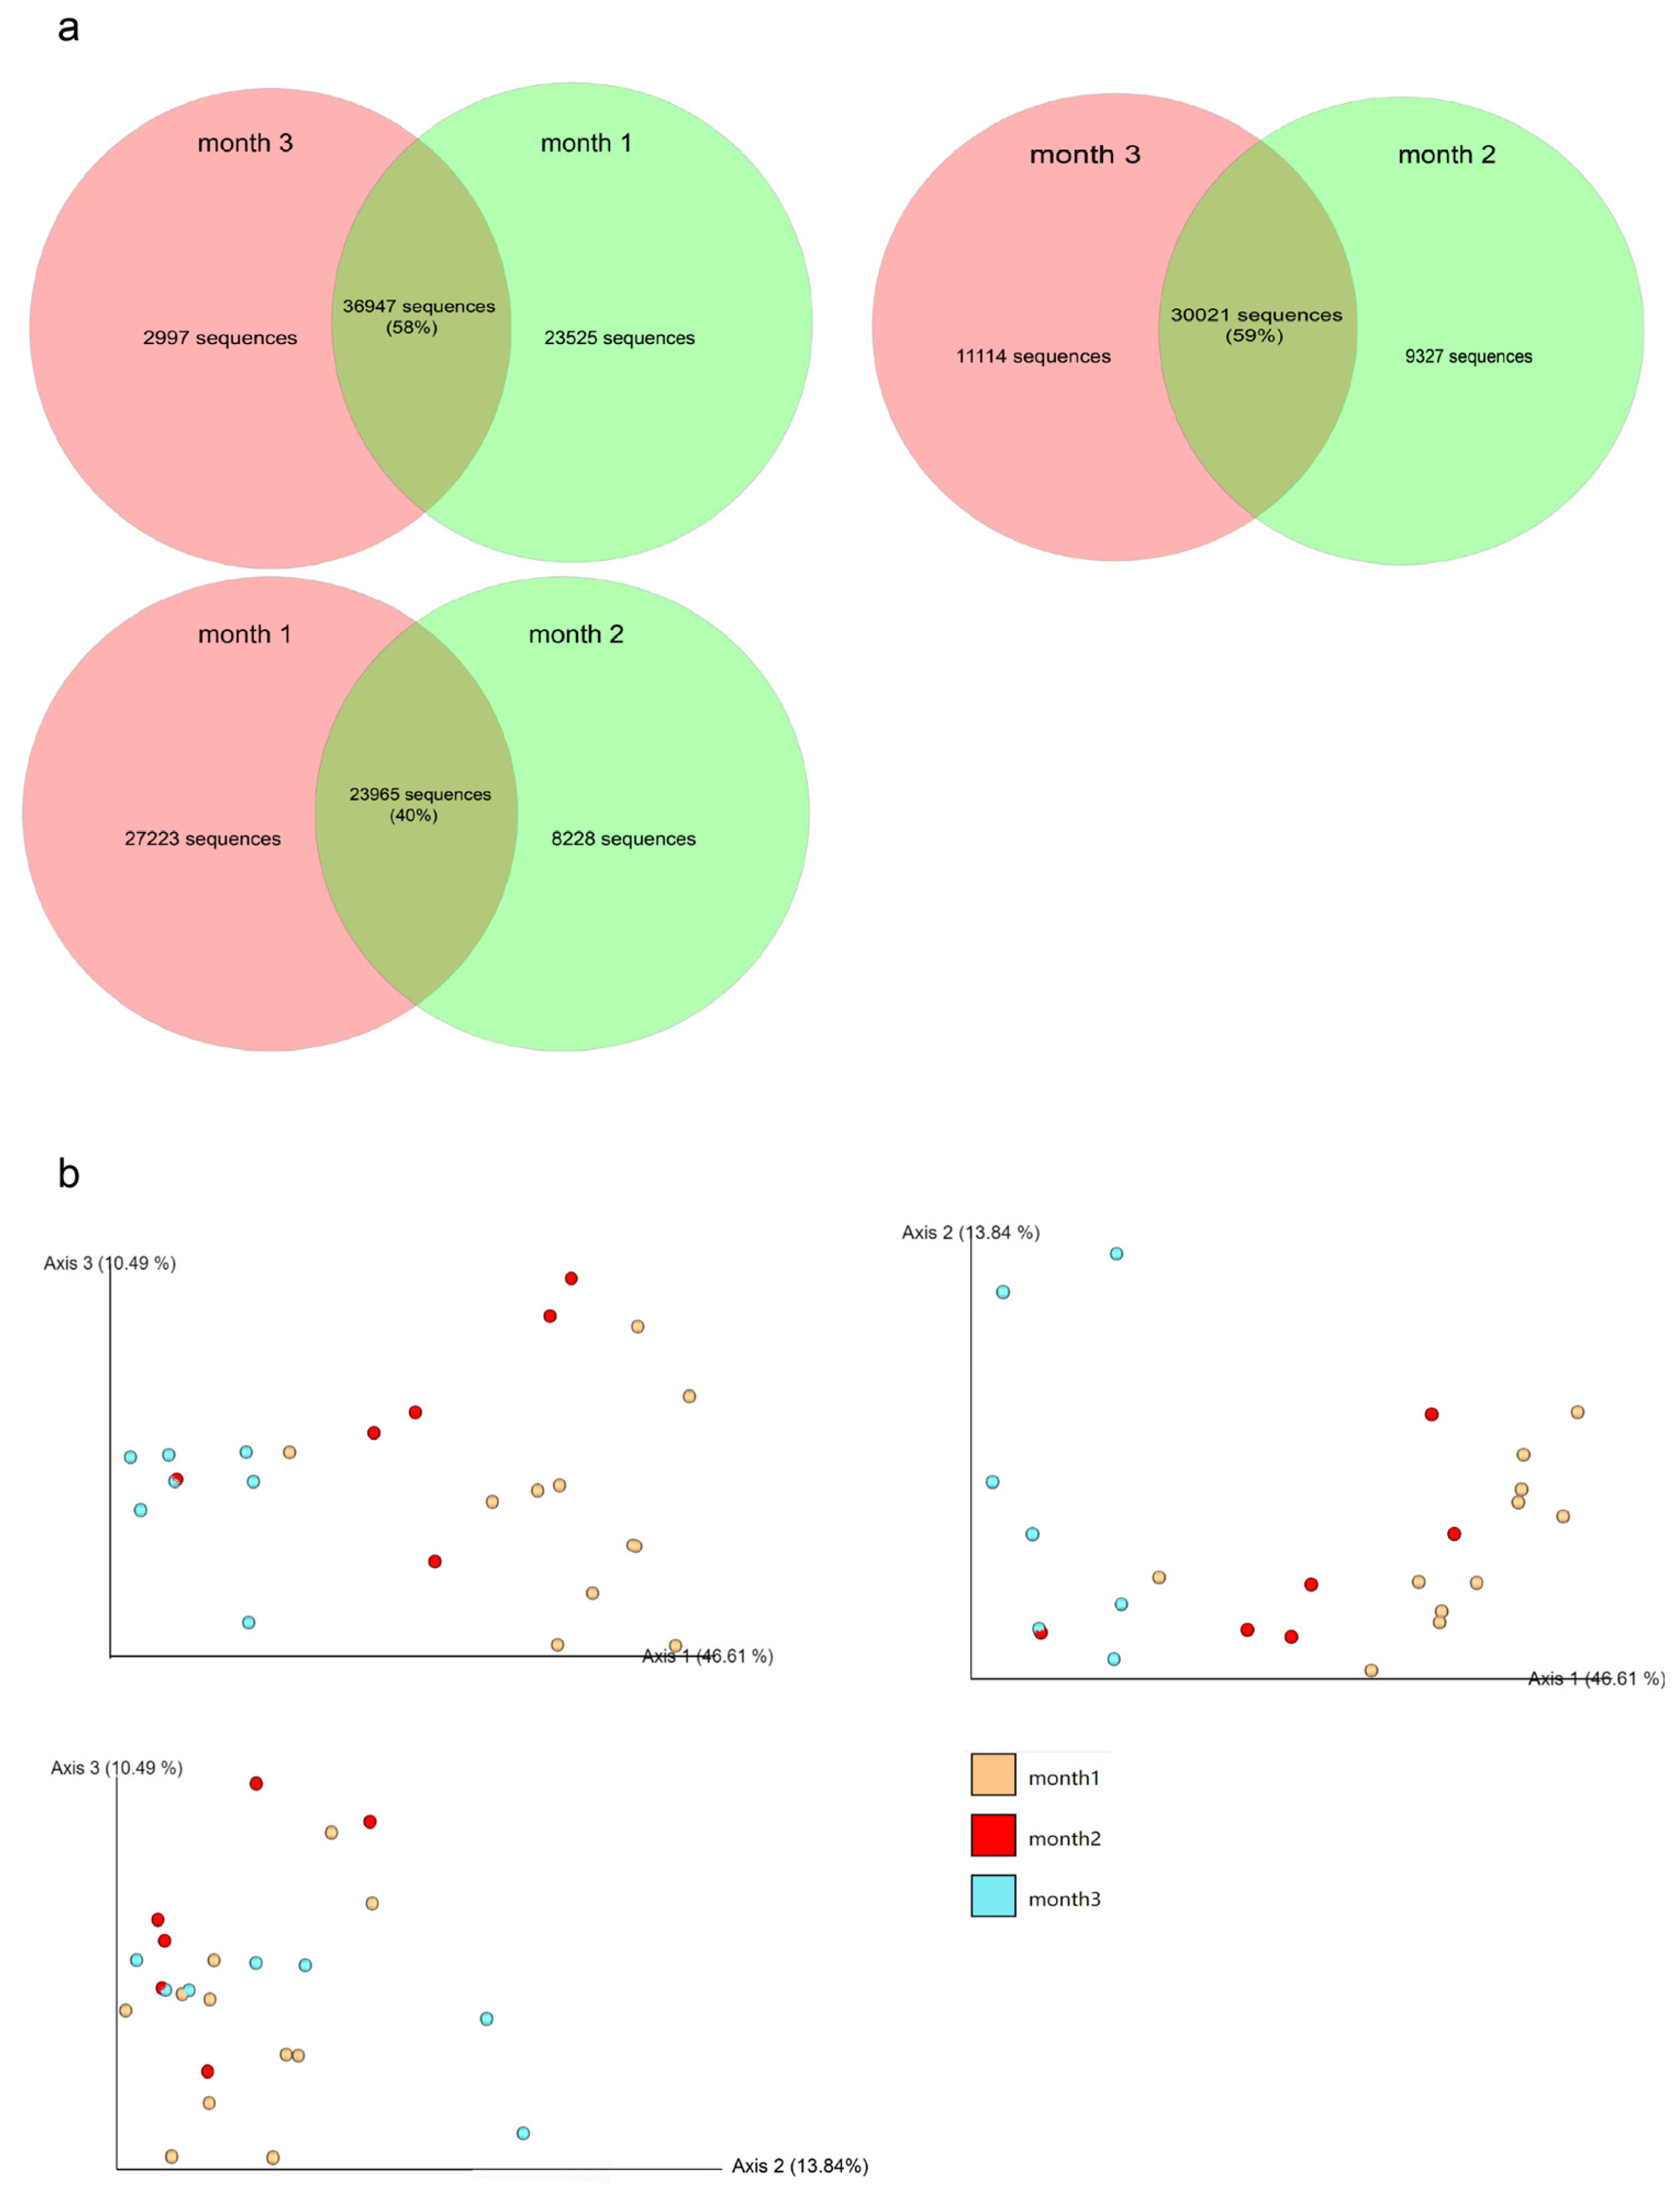
3.3. Microbial Communities during the Fermentation Process
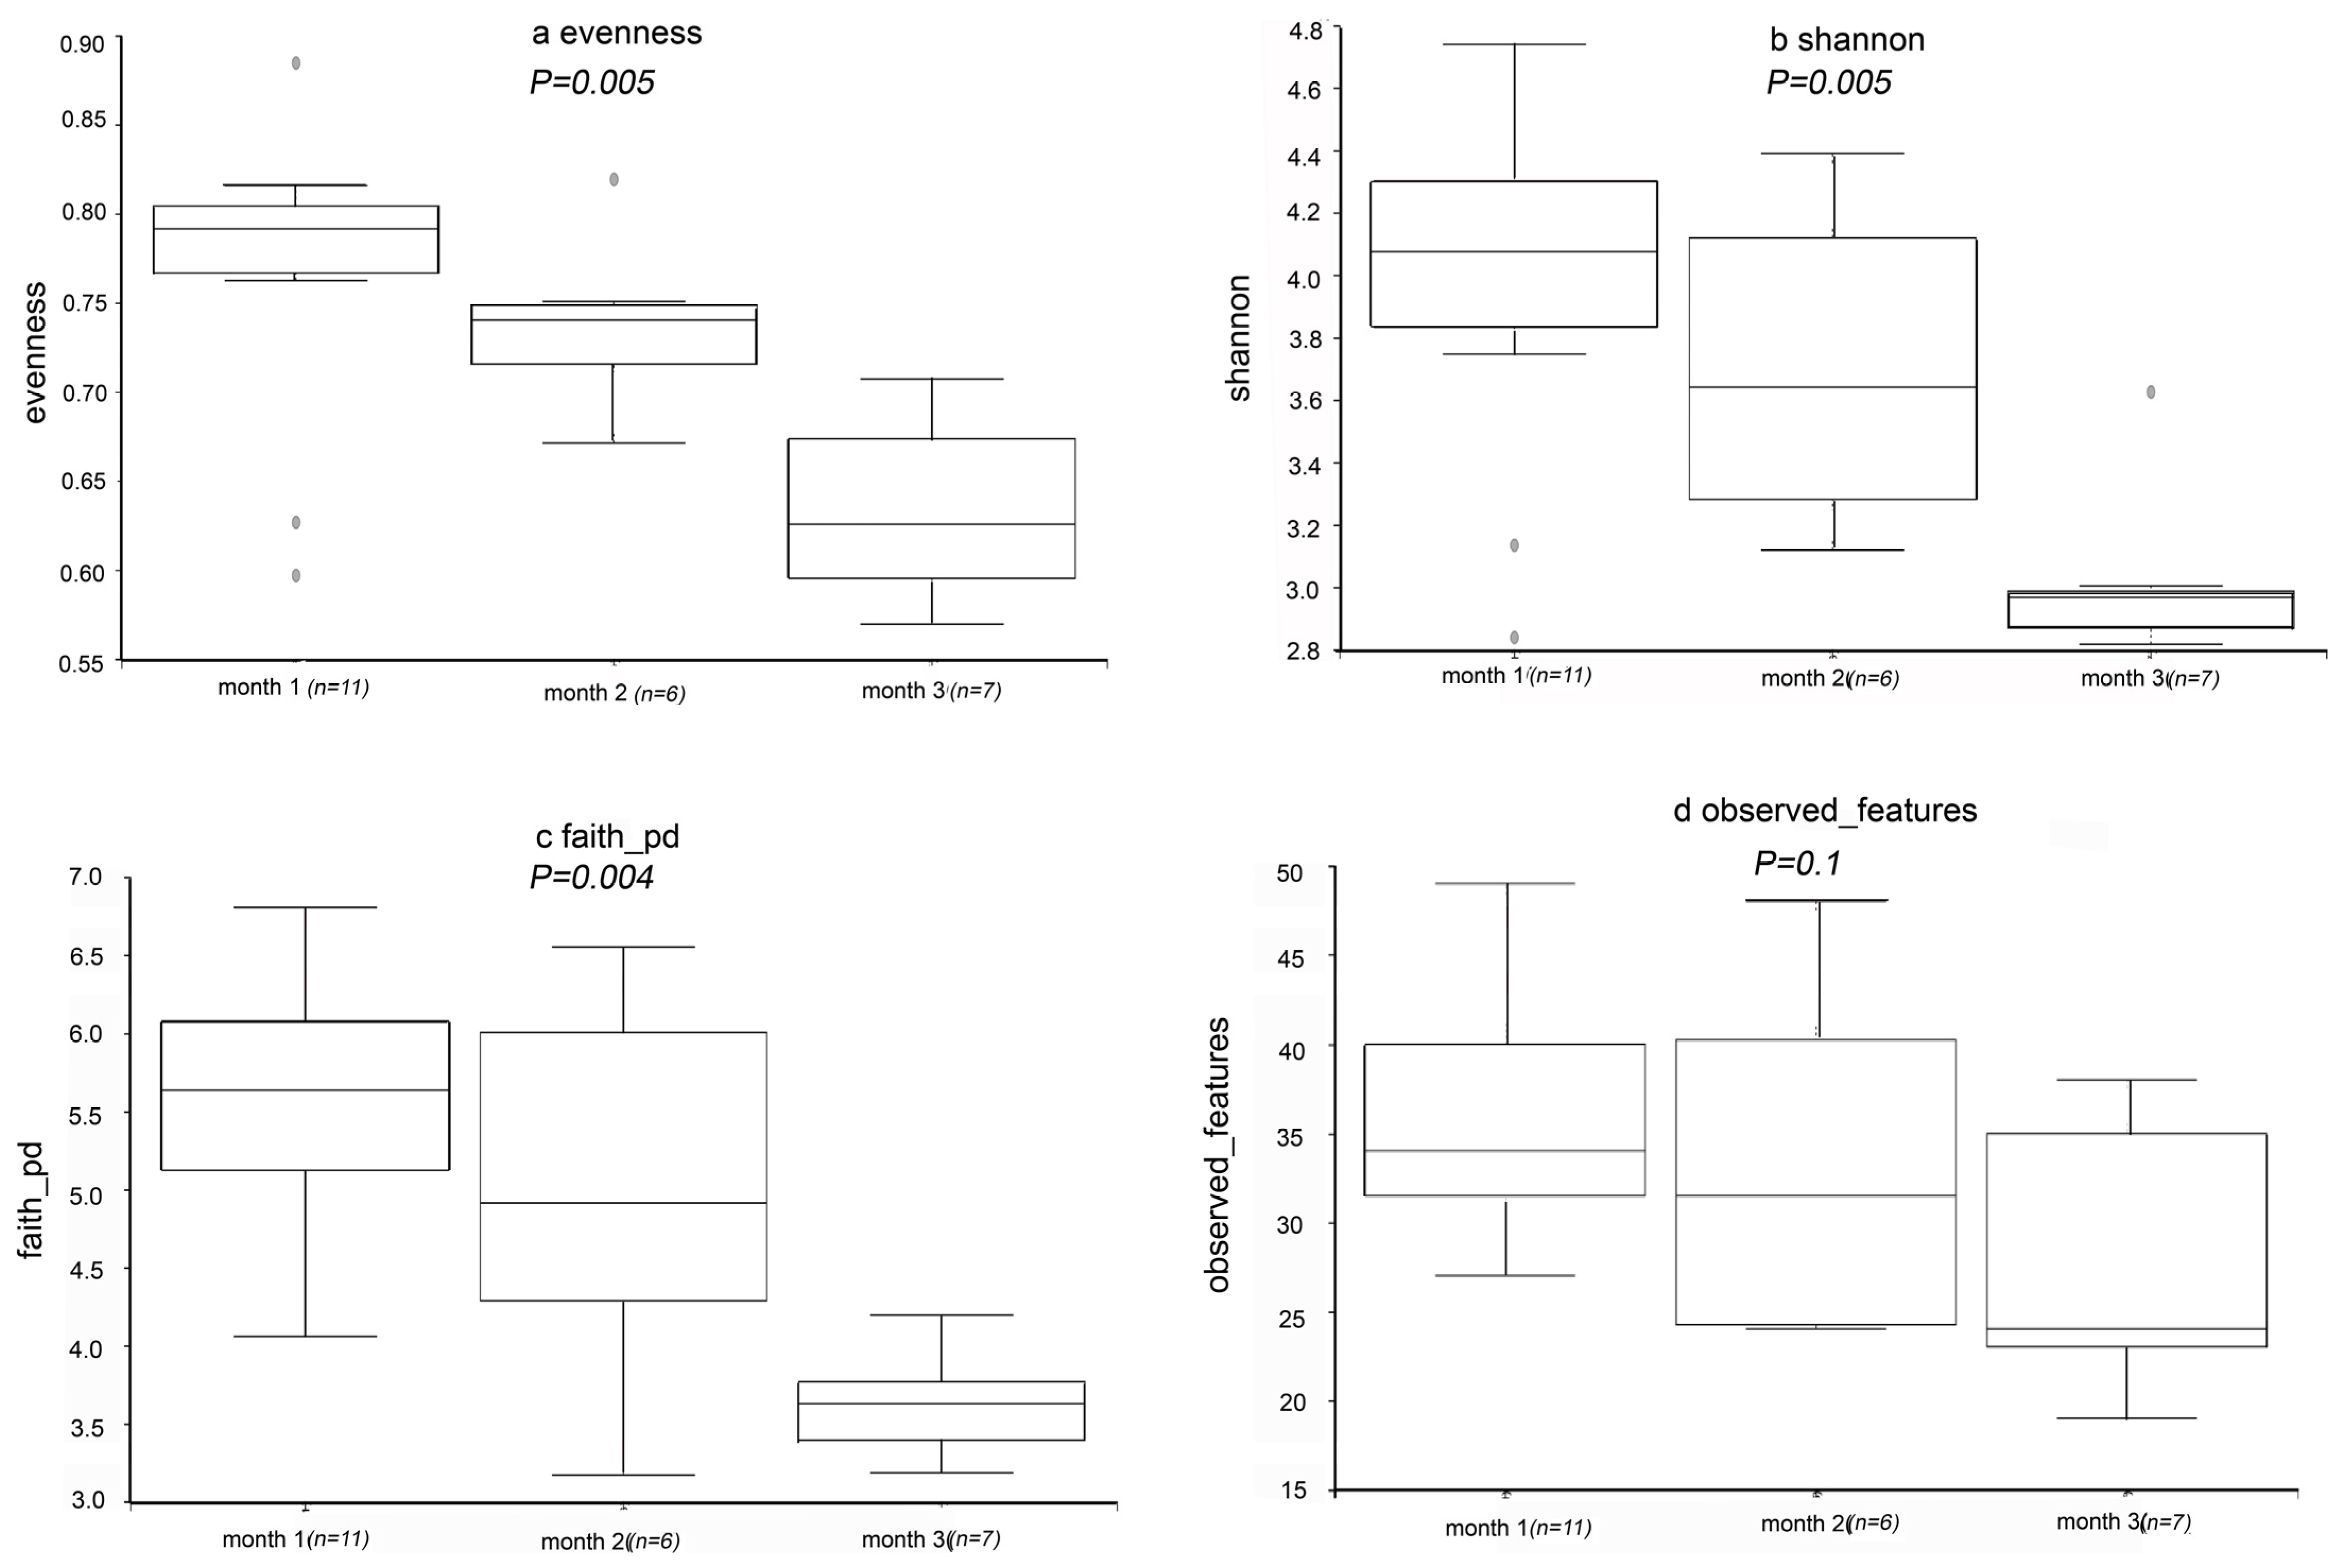
3.3.1. Alpha Diversity Index
3.3.2. Comparison of Community Composition
3.3.3. Microbial Diversity Changes with Fermentation Time
4. Discussion
5. Conclusions
Author Contributions
Funding
Institutional Review Board Statement
Informed Consent Statement
Data Availability Statement
Conflicts of Interest
References
- Wang, D.M.; Lu, J.L.; Miao, A.Q.; Xie, Z.Y.; Yang, D.P. HPLC-DAD-ESI-MS/MS analysis in leaves of 22 tea of polyphenols and purine alkaloids cultivars in China. J. Food Compos. Anal. 2008, 21, 361–369. [Google Scholar] [CrossRef]
- Gong, Z.; Watanabe, N.; Yagi, A.; Etoh, H.; Sakata, K.; Ina, K.; Liu, Q. Compositional Change of Pu-erh Tea during Processing. Biosci. Biotechnol. Biochem. 1993, 57, 1745–1746. [Google Scholar] [CrossRef]
- Kanpiengjai, A.; Chui-Chai, N.; Chaikaew, S.; Khanongnuch, C. Distribution of tannin-’tolerant yeasts isolated from Miang, a traditional fermented tea leaf (Camellia sinensis var. assamica) in northern Thailand. Int. J. Food Microbiol. 2016, 238, 121–131. [Google Scholar] [CrossRef] [PubMed]
- Unban, K.; Khatthongngam, N.; Shetty, K.; Khanongnuch, C. Nutritional biotransformation in traditional fermented tea (Miang) from north Thailand and its impact on antioxidant and antimicrobial activities. J. Food Sci. Technol. 2019, 56, 2687–2699. [Google Scholar] [CrossRef] [PubMed]
- Kato, M.; Tamura, A.; Mizooti, Y.; Omori, M.; Nanba, A.; Miyagawa, K. Changes of Flavor during Manufacturing Process of Japanese Fermented Tea (Awa-bancha) and Its Characteristic. J. Home Econ. Jpn. 1993, 44, 561–565. [Google Scholar]
- Miyazaki, E.; Nakanishi, K. Various component analysis during manufacturing process of Awa-bancha made in spring. Rep. Tokushima Prefect. Ind. Technol. Cent. 2007, 16, 37–40. [Google Scholar]
- Zhao, M.; Su, X.Q.; Nian, B.; Chen, L.J.; Zhang, D.L.; Duan, S.M.; Wang, L.Y.; Shi, X.Y.; Jiang, B.; Jiang, W.W.; et al. Integrated Meta-omits Approaches To Understand the Microbiome of Spontaneous Fermentation of Traditional Chinese Pu-erh Tea. Msystems 2019, 4, e00680-19. [Google Scholar] [CrossRef]
- Chaikaew, S.; Baipong, S.; Sone, T.; Kanpiengjai, A.; Chui-chai, N.; Asano, K.; Khanongnuch, C. Diversity of lactic acid bacteria from Miang, a traditional fermented tea leaf in northern Thailand and their tannin-tolerant ability in tea extract. J. Microbiol. 2017, 55, 720–729. [Google Scholar] [CrossRef] [PubMed]
- Bo, B.; Kim, S.A.; Han, N.S. Bacterial and fungal diversity in Laphet, traditional fermented tea leaves in Myanmar, analyzed by culturing, DNA amplicon-based sequencing, and PCR-DGGE methods. Int. J. Food Microbiol. 2020, 320, 108508. [Google Scholar] [CrossRef]
- Nishioka, H.; Mizuno, T.; Iwahashi, H.; Horie, M. Changes in lactic acid bacteria and components of Awa-bancha by anaerobic fermentation. Biosci. Biotechnol. Biochem. 2020, 84, 1921–1935. [Google Scholar] [CrossRef]
- Cao, Z.H.; Pan, H.B.; Li, S.J.; Shi, C.Y.; Wang, S.F.; Wang, F.Y.; Ye, P.F.; Jia, J.J.; Ge, C.R.; Lin, Q.Y.; et al. In Vitro Evaluation of Probiotic Potential of Lactic Acid Bacteria Isolated from Yunnan De’ang Pickled Tea. Probiotics Antimicrob. Proteins 2019, 11, 103–112. [Google Scholar] [CrossRef]
- Naczk, M.; Shahidi, F. Extraction and analysis of phenolics in food. J. Chromatogr. A 2004, 1054, 95–111. [Google Scholar] [CrossRef]
- Rodríguez, H.; Curiel, J.A.; Landete, J.M.; de las Rivas, B.; de Felipe, F.L.; Gómez-Cordovés, C.; Mancheno, J.M.; Munoz, R. Food phenolics and lactic acid bacteria. Int. J. Food Microbiol. 2009, 132, 79–90. [Google Scholar] [CrossRef]
- Kachouri, F.; Ksontini, H.; Kraiem, M.; Setti, K.; Mechmeche, M.; Hamdi, M. Involvement of antioxidant activity of Lactobacillus plantarum on functional properties of olive phenolic compounds. J. Food Sci. Technol. 2015, 52, 7924–7933. [Google Scholar] [CrossRef] [PubMed]
- He, R.; Ju, X.R.; Yuan, J.; Wang, L.F.; Girgih, A.T.; Aluko, R.E. Antioxidant activities of rapeseed peptides produced by solid state fermentation. Food Res. Int. 2012, 49, 432–438. [Google Scholar] [CrossRef]
- Chu, S.C.; Chen, C.S. Effects of origins and fermentation time on the antioxidant activities of kombucha. Food Chem. 2006, 98, 502–507. [Google Scholar] [CrossRef]
- Ajila, C.M.; Brar, S.K.; Verma, M.; Tyagi, R.D.; Valero, J.R. Solid-state fermentation of apple pomace using Phanerocheate chrysosporium—Liberation and extraction of phenolic antioxidants. Food Chem. 2011, 126, 1071–1080. [Google Scholar] [CrossRef]
- Li, Z.X.; Teng, J.; Lyu, Y.L.; Hu, X.Q.; Zhao, Y.L.; Wang, M.F. Enhanced Antioxidant Activity for Apple Juice Fermented with Lactobacillus plantarum ATCC14917. Molecules 2019, 24, 51. [Google Scholar] [CrossRef] [PubMed]
- Okada, S.; Daengsubha, W.; Uchimura, T.A.I.; Ohara, N.; Kozaki, M. Flora of lactic acid bacteria in Miang produced in northern Thailand. J. Gen. Appl. Microbiol. 1986, 32, 57–65. [Google Scholar]
- Xiao, P.; Huang, Y.Y.; Yang, W.P.; Zhang, B.W.; Quan, X.X. Screening lactic acid bacteria with high yielding-acid capacity from pickled tea for their potential uses of inoculating to ferment tea products. J. Food Sci. Technol. 2015, 52, 6727–6734. [Google Scholar] [CrossRef]
- Jayabalan, R.; Subathradevi, P.; Marimuthu, S.; Sathishkumar, M.; Swaminathan, K. Changes in free-radical scavenging ability of kombucha tea during fermentation. Food Chem. 2008, 109, 227–234. [Google Scholar] [CrossRef] [PubMed]
- Zhao, D.; Shah, N.P. Lactic acid bacterial fermentation modified phenolic composition in tea extracts and enhanced their antioxidant activity and cellular uptake of phenolic compounds following in vitro digestion. J. Funct. Foods 2016, 20, 182–194. [Google Scholar] [CrossRef]
- Zhao, D.Y.; Shah, N.P. Synergistic Application of Black Tea Extracts and Lactic Acid Bacteria in Protecting Human Colonocytes against Oxidative Damage. J. Agric. Food Chem. 2016, 64, 2238–2246. [Google Scholar] [CrossRef] [PubMed]
- Cao, Z.H.; Pan, H.B.; Tong, H.Q.; Gu, D.H.; Li, S.Y.; Xu, Y.P.; Ge, C.R.; Lin, Q.Y. In vitro evaluation of probiotic potential of Pediococcus pentosaceus L1 isolated from paocai-a Chinese fermented vegetable. Ann. Microbiol. 2016, 66, 963–971. [Google Scholar] [CrossRef]
- Caporaso, J.G.; Lauber, C.L.; Walters, W.A.; Berg-Lyons, D.; Lozupone, C.A.; Turnbaugh, P.J.; Fierer, N.; Knight, R. Global patterns of 16S rRNA diversity at a depth of millions of sequences per sample. Proc. Natl. Acad. Sci. USA 2011, 108, 4516–4522. [Google Scholar] [CrossRef]
- Schloss, P.D.; Westcott, S.L.; Ryabin, T.; Hall, J.R.; Hartmann, M.; Hollister, E.B.; Lesniewski, R.A.; Oakley, B.B.; Parks, D.H.; Robinson, C.J. Introducing mothur: Open-Source, Platform-Independent, Community-Supported Software for Describing and Comparing Microbial Communities. Appl. Environ. Microbiol. 2009, 75, 7537. [Google Scholar] [CrossRef]
- Pruesse, E.; Quast, C.; Knittel, K.; Fuchs, B.M.; Ludwig, W.G.; Peplies, J.; Glockner, F.O. SILVA: A comprehensive online resource for quality checked and aligned ribosomal RNA sequence data compatible with ARB. Nucleic Acids Res. 2007, 35, 7188–7196. [Google Scholar] [CrossRef]
- Edgar, R.C.; Haas, B.J.; Clemente, J.C.; Quince, C.; Knight, R. UCHIME improves sensitivity and speed of chimera detection. Bioinformatics 2011, 27, 2194–2200. [Google Scholar] [CrossRef] [PubMed]
- Edgar, R.C. UPARSE: Highly accurate OTU sequences from microbial amplicon reads. Nat. Methods 2013, 10, 996–998. [Google Scholar] [CrossRef]
- Hall, M.; Beiko, R.G. 16S rRNA Gene Analysis with QIIME2. Methods Mol. Biol. 2018, 1849, 113–129. [Google Scholar] [CrossRef]
- Smirnoff, N.; Cumbes, Q.J. Hyroxyl radical scavenging activity of compatible soluts. Phytochemistry 1989, 28, 1057–1060. [Google Scholar] [CrossRef]
- Fernandez, C.; Kalpowitz, N.; Garcia, R.C.; Colell, A.; Miranda, M.; Mari, M.; Ardite, E.; Morales, A. GSH transport in mitochondria: Defense against TNF-induced oxidative stress and alcohol-induced defect. Am. J. Physiol. 1997, 273, 17–271. [Google Scholar]
- Li, Q.; Chai, S.; Li, Y.D.; Huang, J.A.; Luo, Y.; Xiao, L.Z.H. Biochemical Components Associated With Microbial Community Shift During the Pile-Fermentation of Primary Dark Tea. Front. Microbiol. 2018, 9, 1509. [Google Scholar]
- Okada, S.; Takahashi, N.; Ohara, N.; Uchimura, T.; Kozaki, M. Microorganisms Involving in Fermentation of Awa-bancha, Japanese Fermented Tea Leaves: Microorganisms Involving in Fermentation of Japanese Fermented Tea Leaves. Part I. Nippon Shokuhin Kogyo Gakkai-Shi 1996, 43, 12–20. [Google Scholar]
- Horie, M.; Sato, H.; Tada, A.; Nakamura, S.; Sugino, S.; Tabei, Y.; Katoh, M.; Toyotome, T. Regional characteristics of Lactobacillus plantarum group strains isolated from two kinds of Japanese post-fermented teas, Ishizuchi-kurocha and Awa-bancha. Biosci. Microbiota Food Health 2019, 38, 11–22. [Google Scholar] [CrossRef]
- Jayabalan, R.; Malbasa, R.V.; Loncar, E.S.; Vitas, J.S.; Sathishkumar, M. A Review on Kombucha TeaMicrobiology, Composition, Fermentation, Beneficial Effects, Toxicity, and Tea Fungus. Compr. Rev. Food Sci. Food Saf. 2014, 13, 538–550. [Google Scholar] [CrossRef] [PubMed]
- Lin, S.D.; Udompornmongkol, P.; Yang, J.H.; Chen, S.Y.; Mau, J.L. Quality and antioxidant property of three types of tea infusions. J. Food Process. Preserv. 2014, 38, 1401–1408. [Google Scholar] [CrossRef]
- Abe, M.; Takaoka, N.; Idemoto, Y.; Takagi, C.; Imai, T.; Nakasaki, K. Characteristic fungi observed in the fermentation process for Puer tea. Int. J. Food Microbiol. 2008, 124, 199–203. [Google Scholar] [CrossRef]
- Rosenblueth, M.; Martinez, L.; Silva, J.; Martinez-Romero, E. Klebsiella variicola, a novel species with clinical and plant-associated isolates. Syst. Appl. Microbiol. 2004, 27, 27–35. [Google Scholar] [CrossRef]
- Duran-Bedolla, J.; Garza-Ramos, U.; Rodriguez-Medina, N.; Vera, A.A.; Barrios-Camacho, H. Exploring the environmental traits and applications of Klebsiella variicola. Braz. J. Microbiol. 2021, 52, 2233–2245. [Google Scholar] [CrossRef]
- Unban, K.; Chaichana, W.; Baipong, S.; Abdullahi, A.D.; Kanpiengjai, A.; Shetty, K.; Khanongnuch, C. Probiotic and Antioxidant Properties of Lactic Acid Bacteria Isolated from Indigenous Fermented Tea Leaves (Miang) of North Thailand and Promising Application in Synbiotic Formulation. Fermentation 2021, 7, 195. [Google Scholar] [CrossRef]
- Jimenez, N.; Esteban-Torres, M.; Mancheno, J.M.; de las Rivas, B.; Munoz, R. Tannin Degradation by a Novel Tannase Enzyme Present in Some Lactobacillus plantarum Strains. Appl. Environ. Microbiol. 2014, 80, 2991–2997. [Google Scholar] [CrossRef] [PubMed]
- Curiel, J.A.; Rodriguez, H.; Acebron, I.; Mancheno, J.M.; De Las Rivas, B.L.; Munoz, R. Production and Physicochemical Properties of Recombinant Lactobacillus plantarum Tannase. J. Agric. Food Chem. 2009, 57, 6224–6230. [Google Scholar] [CrossRef] [PubMed]
- Landete, J.M.; Plaza-Vinuesa, L.; Montenegro, C.; Santamaria, L.; Reveron, I.; de las Rivas, B.; Munoz, R. The use of Lactobacillus plantarum esterase genes: A biotechnological strategy to increase the bioavailability of dietary phenolic compounds in lactic acid bacteria. Int. J. Food Sci. Nutr. 2021, 72, 1035–1045. [Google Scholar] [CrossRef] [PubMed]
- Manach, C.; Scalbert, A.; Morand, C.; Remesy, C.; Jimenez, L. Polyphenols: Food sources and bioavailability. Am. J. Clin. Nutr. 2004, 79, 727–747. [Google Scholar] [CrossRef] [PubMed]
- Khokhar, S.; Apenten, R.K.O. Iron binding characteristics of phenolic compounds: Some tentative structure-activity relations. Food Chem. 2003, 81, 133–140. [Google Scholar] [CrossRef]


Disclaimer/Publisher’s Note: The statements, opinions and data contained in all publications are solely those of the individual author(s) and contributor(s) and not of MDPI and/or the editor(s). MDPI and/or the editor(s) disclaim responsibility for any injury to people or property resulting from any ideas, methods, instructions or products referred to in the content. |
© 2023 by the authors. Licensee MDPI, Basel, Switzerland. This article is an open access article distributed under the terms and conditions of the Creative Commons Attribution (CC BY) license (https://creativecommons.org/licenses/by/4.0/).
Share and Cite
Zhang, S.; Shi, C.; Liu, C.; Zou, X.; Gong, F.; Li, X. Dynamic Analysis of the Bacterial Community and Determination of Antioxidant Capacity during the Fermentation of Sour Tea. Fermentation 2023, 9, 161. https://doi.org/10.3390/fermentation9020161
Zhang S, Shi C, Liu C, Zou X, Gong F, Li X. Dynamic Analysis of the Bacterial Community and Determination of Antioxidant Capacity during the Fermentation of Sour Tea. Fermentation. 2023; 9(2):161. https://doi.org/10.3390/fermentation9020161
Chicago/Turabian StyleZhang, Shuming, Chunyuan Shi, Chenjian Liu, Xingyuan Zou, Fuming Gong, and Xiaoran Li. 2023. "Dynamic Analysis of the Bacterial Community and Determination of Antioxidant Capacity during the Fermentation of Sour Tea" Fermentation 9, no. 2: 161. https://doi.org/10.3390/fermentation9020161