1. Introduction
During the last decades, the development of new functional foods with health-promoting features attracted the attention of the scientific community more and more [
1]. The formulation of many functional products is based on the exploitation of microbial fermentations, in particular by lactic acid bacteria (LAB) [
2]. In this case, the added value of fermented functional foods can be both direct (probiotic effect) and indirect due to the bioconversions realized by LAB and the ingestion of microbial metabolites synthesized during fermentation (biogenic effect). Overall, the positive effects due to LAB fermentations include the production and accumulation of bioactive compounds with health benefits (e.g., peptides, γ-amino butyric acid, and conjugated linoleic acid), the growth of functional microorganisms making the fermented food a carrier of them through the ingestion. The interaction of ingested functional microorganisms with human epithelial cells from the intestine can modulate several physiological functions [
3]. More recently, LAB and fermentations were also exploited as a new and sustainable strategy for decreasing the phenomenon of food intolerance and allergy [
4]. Finally, the binomial LAB and fermentation often also represent an effective biotechnology to modulate and enhance flavor and organoleptic and texture properties of foods [
5].
Currently, fermented milk and derivatives are among the most diffuse functional products in the market, and the consumers’ demand for alternative products with high acceptance and functionality is increasing more and more. Among them, milk ice cream can be used as a probiotic vehicle because of its composition and it has a potential for the development of new functional formulations. Ice cream is a complex multiphase system consisting of dispersed air cells, partially coalesced fat globules, ice crystals, and a continuous aqueous phase in which dissolved (lactose and mineral salts) and suspended (polysaccharides and proteins) substances are dispersed [
6]. The first attempts to produce ice cream containing functional microorganisms were made in the 1990s, aiming to use frozen dairy desserts as carriers for probiotics [
7]. In these first studies, the enrichment of LAB into the food matrix was obtained by blending ice cream mix with probiotics immediately before freezing, without a fermentation step [
8]. This strategy was supposed to guarantee a better survival of the probiotics due to a higher final pH [
9]. Based on this idea, several studies investigated the survival of microbial cells during the storage of different kinds of ice creams (e.g., produced with cow, goat, or sheep milk) at −20 °C and searched for the most effective incorporation methods of cells [
10,
11,
12,
13]. More recently, novel ice cream formulations have been developed with improved antioxidant and functional properties, nutritional profiles, and innovative flavors by using different technological methods [
14,
15]. However, with this background, the fermentation of cow milk as biotechnology to functionalize ice creams received lower attention.
It is known that lactic fermentation can represent an alternative and natural tool to develop new ice cream formulations with improved nutritional, textural, physical, and rheological properties [
16]. Through fermentation, cow milk can be enriched by bioactive compounds and postbiotics, which, together with microorganisms, can contribute to the functional properties of the final product [
3]. Moreover, fermentation by LAB can also modulate the sensory characteristics adding welcome flavors and increasing the palatability of products without the addition of additives [
5]. The selection of starters is a crucial step due to the different capacities of strains to tolerate the relatively high sugar content that characterizes the ice cream composition, the freezing steps, and the presence of oxygen in the cream [
17]. The addition of dietary fibers can also enhance the rheological and textural characteristics and melting resistance of ice creams preserving sensory properties and probiotics [
18]. According to the National Academies of Science (Washington, DC, USA), the average daily consumption of dietary fiber is significantly lower than the adequate intakes of 38 and 25 g for men and women, respectively [
19]. Therefore, dietary fiber could be included in new ice cream formulations to improve health effects (such as prebiotic activity, lowering cholesterol, and reducing blood glucose responses) and provide laxation effects. Besides, the synthesis of exopolysaccharides (EPS) by lactic acid bacteria has gained a special interest over the last decade due to the functional properties of these biopolymers [
20]. Despite this, a limited number of studies dealing with the application of an in situ EPS production to functionalize ice cream are available [
21,
22]. Antioxidant activity is also a functional property that can be improved in new formulations through different methods. To this aim, hydroxytyrosol (HT) represents a good candidate to be tested as a functional ingredient in new ice cream formulations. It is a phenolic compound drawn as a by-product obtained from the manufacturing of olive oil, and it is considered one of the most powerful antioxidant compounds. Moreover, it is known for beneficial health effects such as anti-inflammatory, anticancer, and as a protector of skin and eyes [
23].
This paper aimed to set up a new biotechnological protocol for manufacturing of functional cow milk ice creams. To this purpose, we hypothesize combining the lactic fermentation with autochthonous strains, the addition of dietary fibers and HT, and the EPS synthesis. The work included: (i) a selection of a tailored mix of autochthonous starters based on pro-technological properties; (ii) the definition of a suitable production process; and (iii) the characterization of microbiological, physical, nutritional, sensory, and especially, functional (antioxidant) properties of produced ice creams. To the best of our knowledge, this is the first time that such a holistic approach has been applied to the formulation of functional fermented cow milk ice creams. Overall, we believe that such an approach can represent a suitable model that can be applied and transferred to develop other new functional ice cream formulations.
2. Materials and Methods
2.1. Isolation of Lactic Acid Bacteria
Mesophilic lactic acid bacteria were isolated from cheese made with raw cow’s milk produced in the South Tyrol region (north Italy). Ten grams of cheese were suspended into 90 mL of sterile physiological solution (NaCl, 0.9%, w/v) and homogenized with a Stomacher® 400 Circulator Lab Blender (Seward Ltd., Worthing, UK). Decimal serial dilutions were prepared in 9 mL of sterile physiological solution and plated on MRS agar medium (Oxoid Ltd., Hampshire, UK) containing 0.1% v/v cycloheximide, for both homogenized cheese and raw milk. After incubation at 30 °C for 48 h, colonies with different morphologies were isolated from the highest plate dilution: twice, catalase-negative, nonmotile rod isolates were cultivated in MRS broth (Oxoid Ltd., Hampshire, UK) at 30 °C for 24 h and restreaked into MRS. All the isolates considered for further analyses showed the capacity to acidify the culture medium. Microbial cultures were stored at −20 °C in 20% (v/v) glycerol.
2.2. Random Amplified Polymorphic DNA-Polymerase Chain Reaction (RAPD-PCR) Analysis
Genomic DNA from each strain was extracted from 2 mL samples of overnight cultures grown in MRS broth, as reported by [
24]. RAPD-PCR was carried out as described by [
25] for the biotyping of isolates using primers M13, P7, and P4 (Invitrogen Life Technologies). RAPD-PCR profiles were acquired by the MCE-202 MultiNA microchip electrophoresis system (Shimadzu s.r.l., Milan, Italy) and analyzed as described by [
26]. Briefly, for each isolate, the presence or absence of fragments into profiles was recorded as 1 or 0, respectively, and imported into an Excel data matrix. Finally, the data matrix was analyzed to assess the similarity of the electrophoretic profiles by determining the Dice coefficients of similarity using the unweighted-pair group method with average linkages (UPGMA) algorithm.
2.3. Genotypic Identification of Isolates
LpigF and LpigR primer pair (Invitrogen Life Technologies, Carlsbad, CA, USA) was used to amplify the 16S rRNA gene fragment of presumptive lactic acid bacteria through polymerase chain reaction (PCR) (C1000 Touch Thermal Cycler, Bio-Rad, Hercules, CA, USA). The reaction mixture contained 0.2 mM of dNTP mix, 1 μM of each primer, 2 mM MgCl
2, 2 U Taq DNA polymerase (Promega, Madison, WI, USA), 1X PCR buffer, 25 ng DNA, and sterile double-distilled water to 25 μL. The PCR program comprised 30 cycles of denaturation for 45 sec at 94 °C, annealing for 1 min at 55 °C, and elongation for 1 min at 72 °C; the cycles were preceded by denaturation at 94 °C for 5 min and followed by elongation at 72 °C for 7 min. All amplicons were identified by sequencing (Eurofins, Luxembourg). The sequences were analyzed using the BLASTN software (
https://blast.ncbi.nlm.nih.gov/Blast.cgi accessed on 10 June 2019).
2.4. Selection of Isolates Based on Kinetics of Growth and Acidification
Isolates were singly used as starters for the fermentation of whole ultra-high temperature processing (UHT) cow’s milk. Cells were first cultivated in MRS broth (Oxoid Ltd., Hampshire, UK) at 30 °C until the late exponential growth phase was reached (ca. 12 h), harvested by centrifugation (7000 rpm, 10 min, 4 °C), washed twice in sterile physiological solution, finally re-suspended in physiological solution, and used to inoculate whole UHT cow’s milk to reach a cell density of ca. 7.0 log CFU/mL (the inoculum was 4% v/v). Milk fermentations were performed in triplicate at 40 °C. The kinetics of growth and acidification during fermentation was determined: growth and pH were monitored at t0 and every 4 h for 48 h. Milk without bacterial inoculum was incubated under the same conditions and used as a control.
Viable cells were enumerated by plating in triplicate on MRS agar (Oxoid Ltd., Hampshire, UK) containing 0.1%
v/
v of cycloheximide, and viable cell counts were calculated as log
10 colony forming units per mL (log CFU/mL). Dilutions with less than 30 or more than 300 colonies were discarded. The kinetics of growth were determined and modeled according to the Gompertz equation as modified by [
27]:
y = k + A exp{-exp[(μ
max e/A)(λ
A − t) + 1]}, where
k is the initial level of the dependent variable to be modeled (log CFU/mL),
A is the difference in cell density between inoculation and the stationary phase, μ
max is the maximum growth rate (expressed as Δlog CFU/mL/h), λ
A is the length of the lag phase (expressed in hours), and
t is the time.
The pH was measured in triplicate by using a pH meter (Sension
+ PH3, Hach-Lange, Lainate, Italy). Acidification data were modeled according to the Gompertz equation as modified by [
27]:
y = k + ΔpH exp{-exp [(V
max e/ΔpH)((λ
pH −
t) + 1]}; where y is dpH/dt (units of pH/min); k is the initial level of the dependent variable to be modeled; ΔpH is the difference in pH (units) between the initial value and the value reached in the stationary phase of lactic acid fermentation; V
max is the maximum acidification rate as dpH/min; λ
pH is the length of the latency phase of acidification expressed in min; and t is the incubation time.
Experimental data were modeled by the non-linear regression procedure of the Statistica 8.0 software package (Statsoft, Hamburg, Germany).
2.5. Screening of Exopolysaccharides (EPS) Biosynthesis
EPS synthesis was screened for isolates by growing cell colonies on plate dishes containing MRS agar added with 292 mM sucrose, 146 mM glucose, and 146 mM fructose. The experiment was performed in triplicate. The mucous colony formation was assessed after incubation at 30 °C for 24–48 h. The strains which produced slimy colonies were recorded as capable of producing EPS [
28].
2.6. Manufacture of the Ice Cream
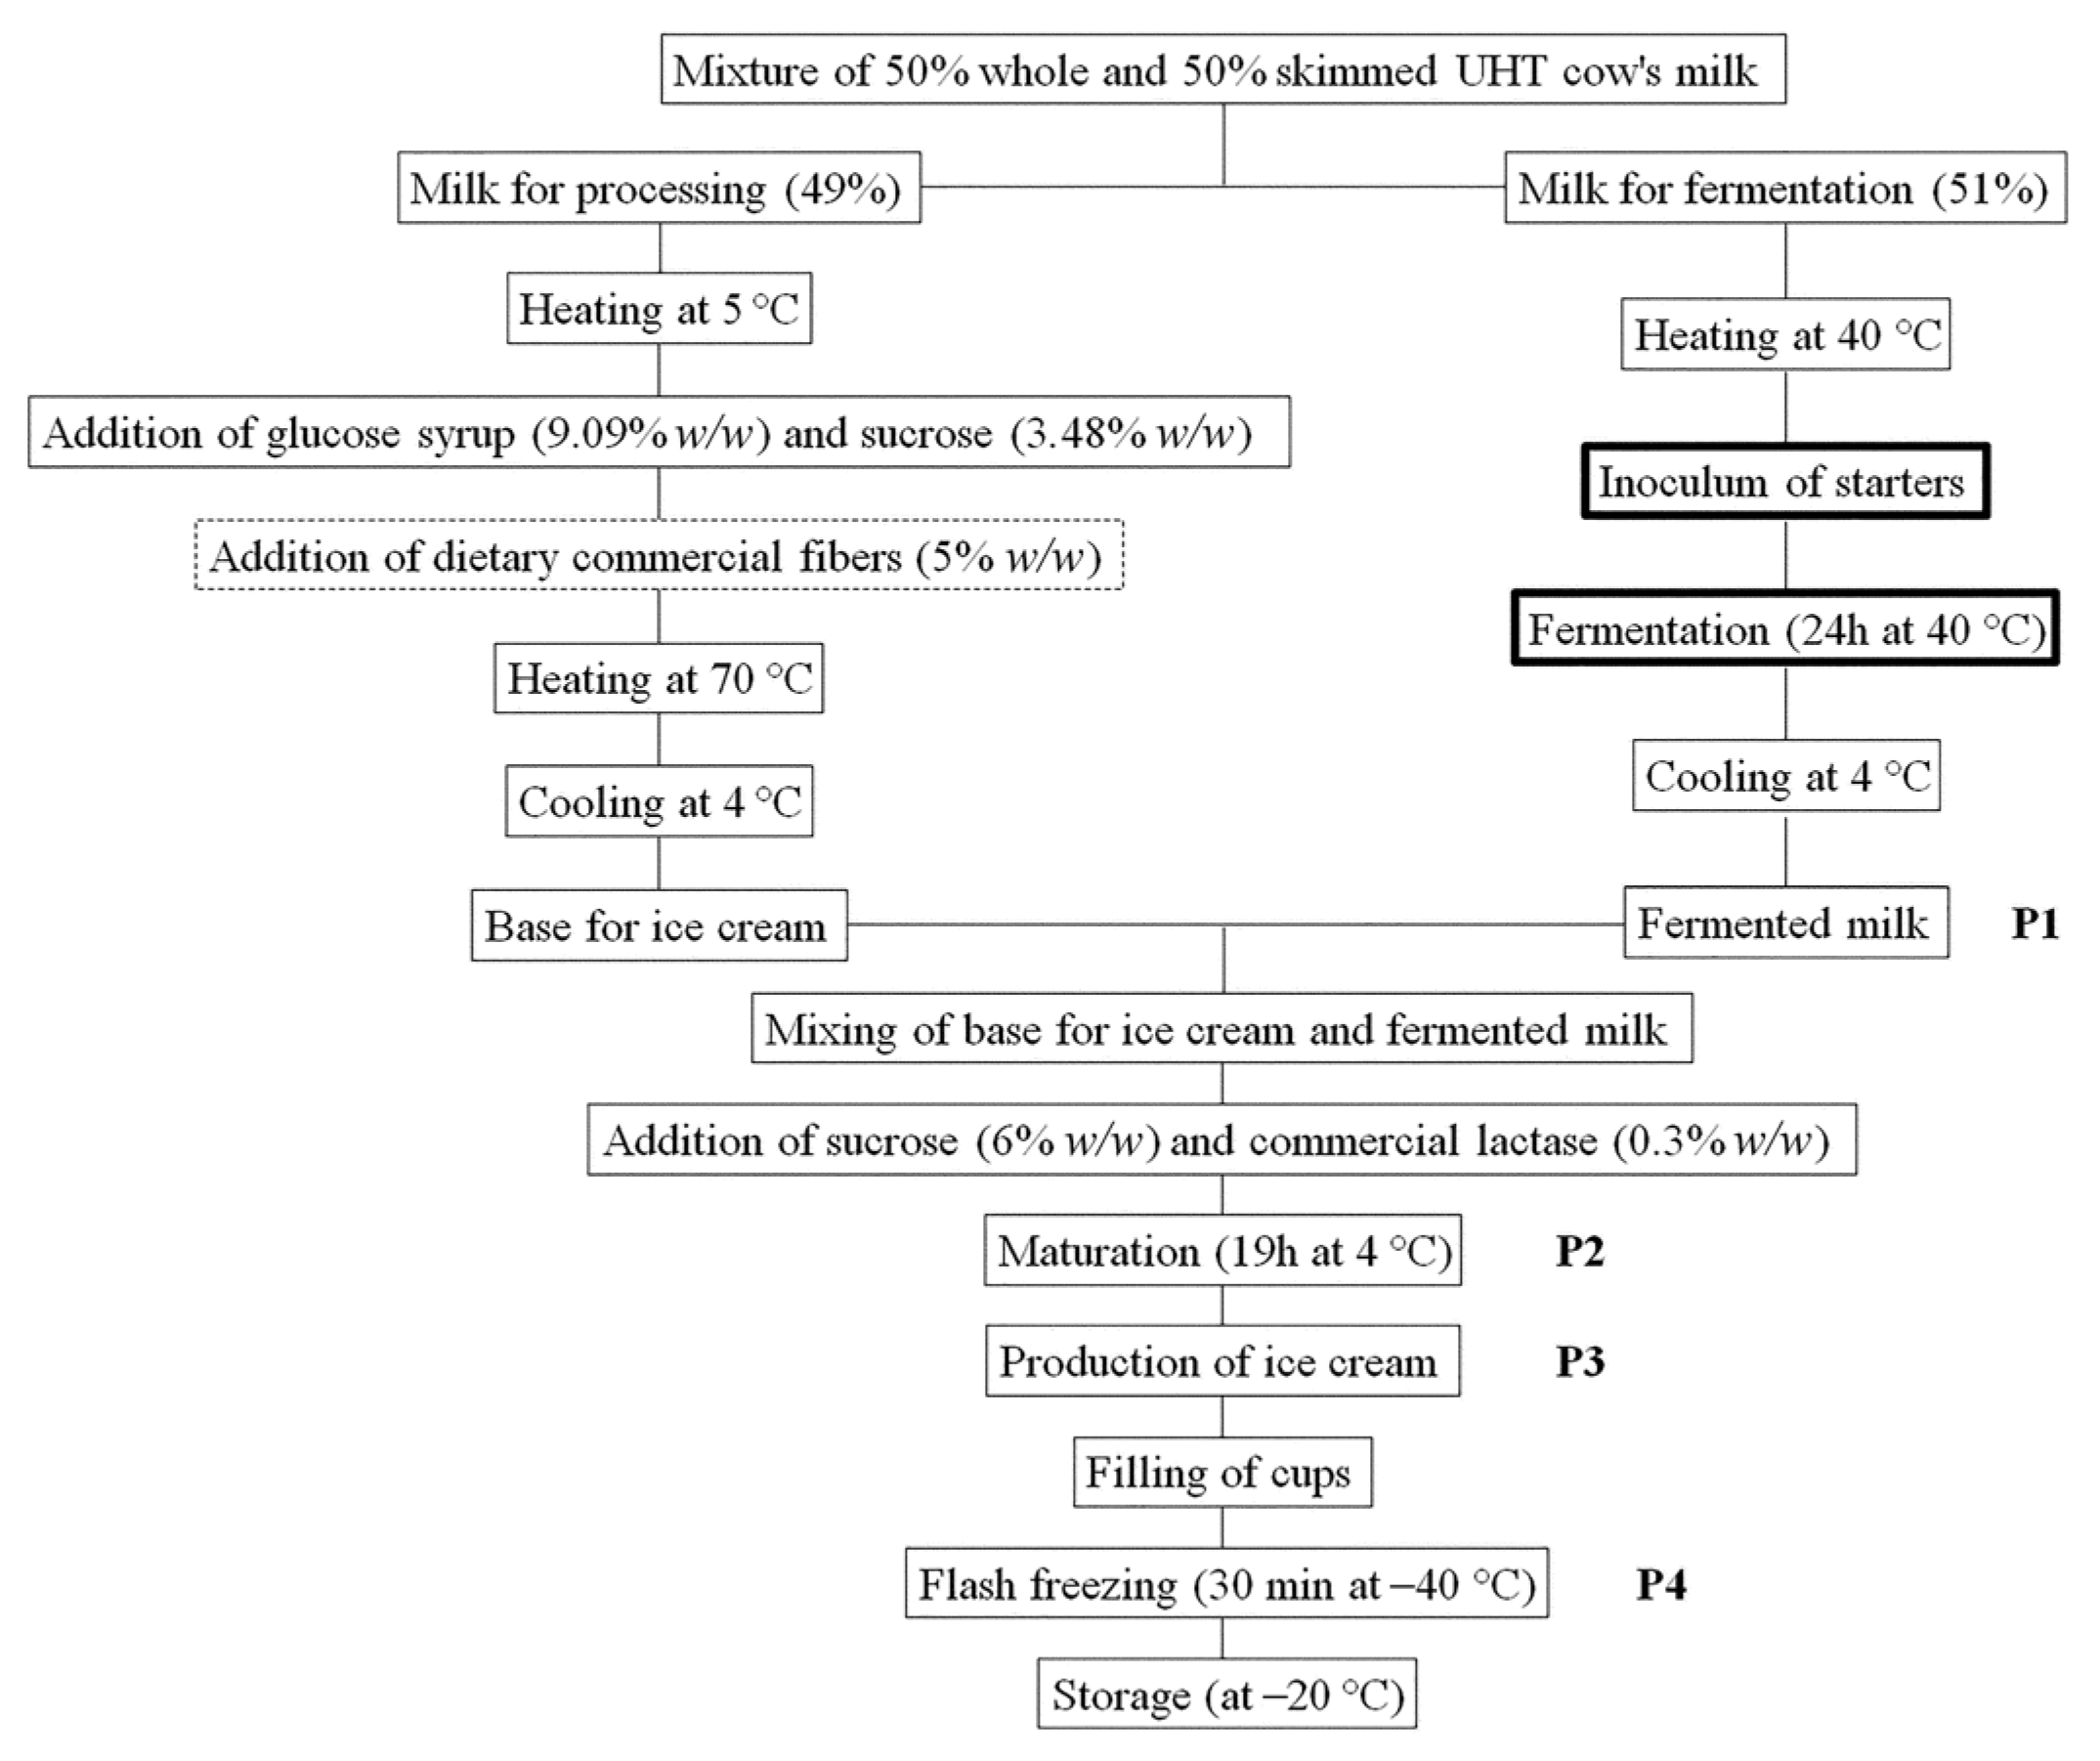
A mixture of 50% whole and 50% skimmed UHT cow’s milk was used for ice cream production at a pilot plant scale. The milk had the following nutritional composition for 100 mL: protein 3.5 g, fat 2.0 g, carbohydrates 5.1 g (4.9 g was lactose). The initial pH was 6.6. The procedure for manufacture is described in
Figure 1.
Table 1 shows all theses considered in this study, with corresponding codes, descriptions, and performed analyses. The codes are presented in the form XX.YY.(H), where XX indicates the thesis (I1, I2, I3, I4, and CO) and YY represents with (5%
w/
w) or without the addition of dietary commercial fibers (AF or WF, respectively), namely inulin, citrus fiber, flour of carob seed, and guar gum. H represents the addition of 50 ppm of HT (purity ≥ 99%. Nova Mentis, Dublin, Ireland); the latter option was tested only on the best performing of the previous thesis. In addition to the strains isolated in this study,
Streptococcus thermophilus 446 (belonging to the Culture Collection of the Department of Soil, Plant and Food Science, University of Bari Aldo Moro) was also included as a starter because it is a recognized producer of EPS. I1 represents ice cream produced with milk fermented by
Lacticaseibacillus paracasei F1,
Lacticaseibacillus casei F14, and
S. thermophilus 446; I2 represents ice cream produced with milk fermented by
L. paracasei F1 and
L. casei F14; I3 represents ice cream produced with milk fermented by
L. paracasei F1; I4 represents ice cream produced with milk fermented by
L. casei F14; CO represents ice cream produced with no fermented milk (control). Fermentations were started as already described for the kinetics of growth and acidification.
S. thermophilus 446 was routinely propagated at 37 °C for 24 h in M17 medium (Oxoid Ltd., Hampshire, UK) before starting fermentations.
2.7. Microbiological Analysis and pH during Ice Cream Production and Storage
Cell density and pH were monitored at four different phases of ice cream production and after 0.5, 1, 2, and 3 months of storage at −20 °C. During the ice cream production, samples were collected after the milk fermentation (P1), the maturation step (P2), the production of ice cream (P3), and the flash freezing step (P4).
Figure 1 reports the sampling points during the ice cream preparation. The pH values were determined in triplicate using a pH meter (Sension
+ PH3, Hach-Lange, Lainate, Italy). Cell density was evaluated through a plate count on MRS (for all ices creams) and M17 (Oxoid Ltd., Hampshire, UK) agar media added with 0.1%
v/
v of cycloheximide after incubation for 48 h at 30 and 37 °C, respectively. Plate count on M17 agar medium was carried out only for thesis I1, where
S. thermophilus 446 was used as a starter, and for control samples. All plate counts were performed in triplicate. The matching between counted colonies and starters was confirmed after processing and storage by RAPD-PCR analyses and sequencing of 16s rRNA gene fragments with the same procedure already described.
2.8. In Situ Viability Staining and Confocal Laser Scanning Microscope (CLSM) Imaging
The cells’ viability in ice creams after 3 months of storage at −20 °C was also assessed by using the LIVE/DEAD BacLight viability kit (Invitrogen, Waltham, MA, USA) and observation by CLSM. This kit comprises two fluorescent nucleic acid stains: SYTO9 and propidium iodide. SYTO9 (excitation and emission maxima, 480 and 500 nm) penetrates both viable and nonviable bacteria, while propidium iodide (excitation and emission maxima, 490 and 635 nm) penetrates bacteria with damaged plasma membranes only, quenching the green SYTO9 fluorescence. Therefore, bacterial cells with compromised membranes emit red fluoresce and those with intact membranes emit green fluoresce [
29]. A working solution containing both fluorescent stains was prepared according to the manufacturer’s instructions. One hundred microliters of the stain was then mixed with an equal volume of ice cream sample. After incubation for 30 min at room temperature under dark conditions, microscope slides were prepared for each sample, covered with a coverslip and qualitatively visualized using a Leica SP8LIA CLSM (Leica Microsystems, Wetzlar, Germany) with a 488 laser. Fluorescence emission was observed between 525–575 nm (for SYTO9) and 535–665 nm (for propidium iodide). Images of twenty randomly selected view fields were captured from each slide with a 63X oil immersion objective by LAS X software (Leica Microsystems, Wetzlar, Germany).
2.9. Determination of Carbohydrates, Organic Acids, and Free Amino Acids
Sugars (lactose, glucose, and galactose) and organic acids (lactic acid) were determined by Ultimate 3000 high-performance liquid chromatography (Thermo Fisher Scientific, Massachusetts, MA, USA). Five grams of sample were added to 25 mL of 5 mM H
2SO
4 and homogenized for 10 min with a Stomacher
® 400 Circulator Lab Blender (Seward Ltd., Worthing, UK). The extract was subsequently centrifuged for 5 min at 5000 rpm and the supernatant was filtered through a 0.20 µm syringe membrane filter (VWR, Radnor, PA, USA). To analyze the concentrations of glucose, galactose, and lactose, HPLC was equipped with a Spherisorb column (80 Å, 4.6 mm × 250 mm, 5 µm) (Waters, Milford, CT, USA) and a 200a refractive index detector (Perkin Elmer, Waltham, MA, USA) [
30]. Elution was at 32 °C, with a flow rate of 1 mL min
−1, using acetonitrile 80%
v/
v as the mobile phase. The injection volume was 2 µL. For analysis of lactic acid, HPLC was equipped with an Aminex HPX-87H column (300 mm × 7.8 mm, 9 µm) (ion exclusion, Bio-Rad, Hercules, CA, USA) and a UV detector operating at 210 nm [
31]. Elution was at 70 °C, with a flow rate of 0.6 mL min
−1, using H
2SO
4 5 mM as the mobile phase. The injection volume was 20 µL. Calibration curves were prepared using pure standards (range 0.5–15 g L
−1). The calibration plots indicate a good correlation between peak areas and analyte concentrations, and regression coefficients were higher than 0.99 in all cases (
Supplementary Table S1). Lactic acid and sugars used as standards were purchased from Sigma-Aldrich (St. Louis, MO, USA).
Total free amino acids concentration was determined through cadmium–ninhydrin spectrophotometric method [
32], by using a UV-1800 spectrophotometer (Shimadzu s.r.l., Milan, Italy). Sixty grams of sample were diluted with 120 mL of distilled water, adjusted pH to 4.6 using HCl 50 mM, centrifuged (10,000 rpm, 10 min at 4 °C), and the supernatant was recovered and used for the assay. All analyses were performed in triplicate.
2.10. Total Titratable Acidity (TTA)
TTA was determined on 10 g of ice cream sample homogenized with 90 mL of distilled water and expressed as the amount (mL) of 0.1 M NaOH to get a pH of 8.3. The pH values were determined by the Sension+ PH3 pH meter with a food penetration probe (Hach-Lange, Lainate, Italy). Analysis was performed in triplicate.
2.11. In Vitro Protein Digestibility of Ice-Cream
The in vitro digestibility was determined according to the method of [
33], with slight modifications. A known amount of sample was incubated with 1.5 mg of pepsin, in 15 mL of 0.1 M HCl, at 37 °C for 3 h. After neutralization with 2 M NaOH and the addition of 4 mg of pancreatin in 7.5 mL of phosphate buffer (pH 8.0); 1 mL of toluene was added to prevent microbial growth, and the solution was incubated for 24 h at 37 °C. After 24 h, the enzyme was inactivated by the addition of 10 mL of trichloroacetic acid (20%,
w/
v), and the undigested protein was precipitated. The volume was made up to 100 mL with distilled water and centrifuged at 5000 rpm for 20 min. The concentration of protein in the supernatant was determined by the Bradford method [
34]. The in vitro protein digestibility was expressed as the percentage of protein dissolved after enzyme hydrolysis. The analysis was performed in triplicate.
2.12. In Vitro Gastrointestinal Batch Digestion of Ice-Cream
An in vitro gastrointestinal batch digestion process was carried out as described by [
35] with slight modifications. Samples of 100 ml were added to 50 mL of distilled water and mixed in a stomacher for 2 min. A control batch without a substrate was also used as a negative control. The solution was mixed with α-amylase (20 mg) in CaCl
2 (1 mM, 6.25 mL) and incubated at 37 °C for 30 min under stirring conditions (100 rpm). Pepsin (2.7 g) was dissolved in 25 mL 0.1 M HCl, and the mixed sample was added. The pH was adjusted to 2.0 using 6 M HCl and incubated at 37 °C for 2 h under stirring conditions (100 rpm). Pancreatin (560 mg) and bile (3.5 g) were dissolved in 125 mL of 0.1 M NaHCO
3, and the sample was added. The pH value was adjusted to 7.0 by using 6 M NaOH and incubated at 37 °C for 3 h under stirring conditions (100 rpm). Afterward, basal growth complements and fecal slurries were prepared as described by [
36] and added to the batches in order to reproduce the colon phase of digestion. Oxygen was removed by nitrogen flushing and fecal batch were incubated at 37 °C in a shaking incubator for 48 h (0.15 mg/mL). Sample aliquots were collected from each batch at time points (0, 16, 24, and 48 h) for short-chain fatty acid (SCFA) analysis.
2.13. Short Chain Fatty Acid (SCFA) Analysis
Aliquots (1.0 mL) of samples were centrifuged (11,000 rpm, 10 min). The supernatant was acidified with 6 M HCl (3:1,
v/
v) and incubated at room temperature for 10 min. The mixture was re-centrifuged at 11,000 rpm for 5 min, filtered using a 0.2 µm PVDF filter (Millipore, Burlington, VT, USA), and used to determine SCFA by HPLC [
37]. An Äkta purifier system (GE Healthcare, Chicago, IL, USA) was equipped with an Aminex HPX-87H column (ion exclusion, particle size of 9 μm, column size of 250 × 4.0 mm; Bio-Rad, Hercules, CA, USA) and a UV detector operating at 210 nm. Elution was at 35 °C with a flow rate of 0.6 mL/min, and 10 mM H
2SO
4 was used as the mobile phase. Standard solutions (1000 mM) of lactic, acetic, propionic, butyric, and succinic acids were separately prepared with ultra-pure water and, after adequate dilution, were used for calibration. The method underwent validation for several parameters (
Supplementary Table S2). The evaluation of the linearity range was through the determination coefficient (r
2). The calibration curves showed good linearity (r
2 value was from 0.981 to 0.994). Limits of quantification (LOQ) values ranged from 1.03 to 1.27 mM, being different for each compound. All chemicals were of analytical grade. Glucose, galactose, lactose, lactic acid, acetic acid, propionic acid, butyric acid, and succinic acid used as standards were obtained from Sigma-Aldrich (St. Louis, MO, USA).
2.14. Sensory Analysis
Sensory analysis was carried out by 10 non-trained panelists (between 25 and 50 years of age, with equal distribution between male and female). The method was adapted from the analysis reported by [
18]. Before analysis, a selection of panelists was made among a larger number of people based on their capacity to distinguish and describe the sensory attributes adopted for the study. Then, the selected panelists were instructed to sniff each sample before tasting. Samples of ice creams were randomly coded and served in plastic cups (25 g) at −20 °C, together with non-salted table biscuits and still water. Samples were evaluated in three replicate sessions using three experimental replicates for each type of ice cream. Panelists were placed separately in rooms for unbiased evaluation of sensory attributes. Ice creams were scored based on continuous 0–10 scales, from 0 (lowest) to 10 (highest). The appearance was evaluated as white intensity. The texture was evaluated as smoothness. Olfactory attributes referred to odor intensity, and gustatory attributes were evaluated as flavor intensity and acidity.
2.15. Measurement of Transepithelial Electrical Resistance (TEER), Release of Inflammatory Cytokines Interleukin-6 (IL-6) and -8 (IL-8), and of Intracellular Reactive Oxygens Species (ROS) of Caco-2 Cells
The most promising thesis of fermented ice cream (both with and without the addition of fiber and with the addition of 50 ppm HT to the formulation) and the no fermented ice cream (as control) was selected for these tests. Human intestinal Caco-2 cells HTB-37 obtained from American Type Culture Collection (ATCC, Manassas, VA, USA) were routinely cultured in Dulbecco modified eagle’s medium (DMEM) high glucose supplemented with 10%
v/
v heat-inactivated fetal bovine serum, 1%
v/
v non-essential amino acids, 1%
v/
v L-glutamine and 1%
v/
v penicillin and streptomycin as previously reported [
38]. Caco-2 cells (passage 10–25) were sub-cultured once a week by dissociating with trypsin (Tryple L-select) and seeded at a density 30 × 10
3/cm
2 (split 1:6). All the reagents used for the cultures were purchased from Gibco (Gibco-Thermo Fisher Scientific, Waltham, MA, USA).
For TEER experiments, Caco-2 cells were seeded at a concentration of 250 × 103 on 1 µm pore size inserts (polyethylene terephthalate transwells®, Merck KGaA, Darmstadt, Germany), allocated in 12-well culture plates (Falcon) with 0.5 mL of complete culture medium in the Ap compartment, while the Bl compartment was filled with 1.5 mL, and let them differentiate in culture. The medium was changed every two days. After 21 days of culture to allow differentiation, cells were exposed for 24 h to 100 μg/mL of lyophilized ice creams alone and in combination with TNF-α (2 ng/mL) and IL-1β (25 ng/mL) (Peprotech-Thermofisher Waltham, MA, USA). DMEM alone was used as the negative control, and DMEM containing TNF-α (2 ng/mL) and IL-1β (25 ng/mL) was used as the positive control. After cell treatment, the integrity of the monolayer was monitored for 48 h by measuring TEER with the Millicell ERS device (Millipore-Sigma, San Luis, MO, USA). The measurements were expressed in Ohms·cm2, after subtracting the mean values of the resistance from cell-free inserts. TEER data were recorded at room temperature.
For IL-6 and IL-8 cytokines release detection, Caco-2 cells were plated in 12-well plates at a concentration of 200 × 103 cells/well, cultivated for 21 days, and exposed for 24 h at 37 °C to lyophilized ice creams at the concentration of 100 μg/mL alone or in combination with IL-1 beta (25 ng/mL). DMEM was used as the negative control, while IL-1 beta (25 ng/mL) was used as the positive control. Synthesis of the pro-inflammatory IL-6 and IL-8 was measured after 24 h using the enzyme-linked immunosorbent assay (ELISA) (Bender MedSystems, Wien, Austria). One hundred µL from each well was collected and transferred into a 96 well-plate (Perkin Elmer, Waltham, MA, USA) and analyzed in triplicate by a spectrophotometer (Victor3, Perkin-Elmer, Waltham, MA, USA) at 450 nm. Quantification was carried out using a reference standard curve as provided by the manufacturer.
The intracellular generation of ROS was assessed by measuring the oxidation of the probe 20,70-dichlorofluorescin diacetate (DCFH-DA) (Molecular Probes, Lifesciences, Eugene, OR, USA). Briefly, the confluent Caco-2 cells in the 24-well plates were pretreated for 6 h with freeze-dried ice cream powder (100 µg/mL). A set of the samples were also treated with TNF-α (2 ng/mL) and IL-1β (25 ng/mL) for 6 h before the end of the treatment to induce oxidative stress, and after 24 h 100 µL from each well were collected and transferred into a black microtiter 96 well-plate. The fluorescence intensity of DCFH-DA (relative fluorescence units, FU) was measured at an excitation and emission wavelength of 485 nm and 520 nm, respectively, using a Victor3 spectrofluorimeter (Perkin Elmer, Waltham, MA, USA).
For these tests, three biological replicates were considered, which were analyzed in triplicate.
2.16. Statistical Analyses
The mean values, standard deviation of the means, Student’s t-test analysis, and variance analysis with one-way ANOVA of all replicates were calculated using Prism 4 (GraphPad, Boston, MA, USA). Differences were considered significant with p-values (p) < 0.05. Individual comparisons were made post hoc with the Tukey-Kramer test. Clustering analysis was performed with the default method available in R and based on Euclidean distance and McQuitty linkage.
3. Results
3.1. Isolation, Typing and Identification of Lactic Acid Bacteria
A total of 24 putative lactic acid bacteria were isolated from cheese. Gram-positive, catalase-negative, nonmotile isolates able to acidify the cultural medium were subjected to RAPD-PCR analysis. The isolates were grouped into five clusters at a similarity level of 70% based on RAPD patterns. For each cluster, one isolate was selected as representative and identified through the partial sequencing of the 16S gene. The isolates were identified as
L. paracasei and
L. casei (
Table 2).
3.2. Pro-Technological Properties of Isolated Strains
Five strains representative of each cluster (
L. paracasei F1,
L. paracasei F2,
L. paracasei F5,
L. paracasei F13,
L. casei F14) were singly used as a starter to ferment (40 °C, for 48 h) whole UHT cow’s milk and the pro-technological properties were assessed based on the extent of pH decrease (ΔpH), rate of pH reduction (Vmax), length of lag phase (λ
pH) (about acidification), increase of cell density (A), maximum growth rate (μ
max), and length of the lag phase (λ
A) (about growth). The ranges of the variables for all strains tested are given in
Table 3.
Starting from an initial cell density of ca. 7 log CFU/mL, after 48 h of fermentation, the cell density of tested strains increased to 8.74 ± 0.11–9.10 ± 0.12 log CFU/mL. L. paracasei F1, L. paracasei F2 and L. casei F14 had increases in cell density significantly higher (p < 0.05) than other strains (2.00 ± 0.03, 2.02 ± 0.01, and 1.92 ± 0.04 Δlog CFU/mL, respectively). L. paracasei F2 and L. paracasei F13 displayed a significantly (p < 0.05) higher value of μmax (0.31 ± 0.01 and 0.24 ± 0.02 Δlog CFU/mL/h, respectively), while L. paracasei F1, L. paracasei F5, and L. casei F14 resulted in a length of the growth lag phase significantly (p < 0.05) lower than other strains (13.50 ± 0.20, 12.49 ± 0.30, and 14.23 ± 0.20 h, respectively). The initial pH value of whole UHT cow’s milk was 6.76 ± 0.01. After 48 h of fermentation, L. paracasei F1, L. paracasei F2, L. paracasei F13, and L. casei F14 showed a significantly (p < 0.05) higher decrease of pH (2.37 ± 0.03, 2.40 ± 0.01, 2.40 ± 0.01, and 2.41 ± 0.01 pH units, respectively). The rate of pH reduction had no significant (p > 0.05) variation among strains. The mean values ranged between 0.16 and 0.17 ΔpH/min. However, L. paracasei F1, L. paracasei F13, and L. casei F14 showed a significantly (p < 0.05) lower length of the pH lag phase (13.15 ± 0.20, 13.04 ± 0.20, and 13.46 ± 0.20 min, respectively).
None of the strains isolated in this study was found to be EPS producers at the colony level.
3.3. Microbiological Analysis and pH during the Ice Cream Manufacture and Storage
The initial pH value of whole UHT cow’s milk (P0) was 6.65 ± 0.05. After fermentation (production step P1), pH values significantly (p < 0.05) decreased to values between 3.78 ± 0.02–4.36 ± 0.03. After the maturation step (P2), pH values slightly but significantly (p < 0.05) increased in almost all fermented ice creams to 4.32 ± 0.04–4.64 ± 0.03 and remained mostly stable until the end of processing. In the negative controls produced with no fermented milk (CO.AF and CO.WF), the pH values were between 6.26 ± 0.03 and 6.68 ± 0.02 all along the process.
Plate counts confirmed that the cell density after the inoculum (P0) was ca 7.0 ± 0.0 log CFU/mL for all theses, with the exception being CO.AF and CO.WF where no inoculum was made (cell density < 2 log CFU/mL). After fermentation (P1), in all theses with fermented milk, the cell densities significantly (p < 0.05) increased by 2–3 logarithmic cycles compared to the inoculum (P0). During the following production steps, the cell density of lactobacilli decreased in all theses; nevertheless, the cell densities were still consistent at the end of the process. The final cell density of lactobacilli in the thesis without the addition of dietary fibers was 8.0 ± 0.0, 9.2 ± 0.1, 8.8 ± 0.4, and 8.5 ± 0.2 log CFU/g for I1.WF, I2.WF, I3.WF, and I4.WF, respectively. In the thesis with the addition of dietary fibers, cell densities were 7.6 ± 0.0, 8.8 ± 0.1, 8.9 ± 0.1, and 9.1 ± 0.1 log CFU/g for I1.AF, I2.AF, I3.AF and I4.AF, respectively. The final level of streptococci was 8.7 ± 0.1 and 8.9 ± 0.6 log CFU/mL for I1.WF and I1.AF, respectively. When the ice cream was produced with no fermented milk, the cell density ranged between <2 and 2.6 ± 0.0 log CFU/mL and between 3.5 ± 0.0 and 5.7 ± 0.0 log CFU/mL for lactobacilli and streptococci, respectively, with no significant (p > 0.05) variation during the process.
During storage, the pH varied slightly but not significantly (p > 0.05) (data not shown).
After three months of conservation at −20 °C, the cell density of lactobacilli in the theses without the addition of dietary fibers decreased to 7.8 ± 0.2, 9.0 ± 0.0, 8.6 ± 0.2, and 8.6 ± 0.1 log CFU/g for I1.WF, I2.WF, I3.WF, and I4.WF, respectively. In the theses with the addition of dietary fibers, cell densities decreased to 7.4 ± 0.1, 8.3 ± 0.0, 8.5 ± 0.1, and 8.7 ± 0.1 log CFU/g for I1.AF, I2.AF, I3.AF, and I4.AF, respectively. With the exception of I3.AF thesis, these changes were not statistically significant. In the theses with no fermented milk (control), cell density ranged between 3.0 ± 0.1 and 3.3 ± 0.0 log CFU/g for samples without the addition of dietary fibers (CO.WF) and between <2 and 2.3 ± 0.1 log CFU/g for samples with the addition of dietary fibers (CO.AF).
In the thesis I1, cell densities of streptococci decreased to 8.5 ± 0.1 log CFU/g for samples without the addition of dietary fibers (I1.WF) and to 8.2 ± 0.1 log CFU/g for samples with the addition of dietary fibers (I1.AF), but only for I1.WF was it statistically significant. The control thesis without the addition of dietary fibers (CO.WF) showed a statistically significant decrease in cell density from 5.6 ± 0.0 to 5.2 ± 0.2 log CFU/g, while the control with the addition of dietary fibers (CO.AF) ranged between 3.0 ± 0.1 and 3.6 ± 0.1 log CFU/g and changes were not statistically significant.
The persistence of the selected starters throughout the processing and storage period was confirmed using the RAPD-PCR profile of bacterial starters and 16s rRNA sequences (data not shown).
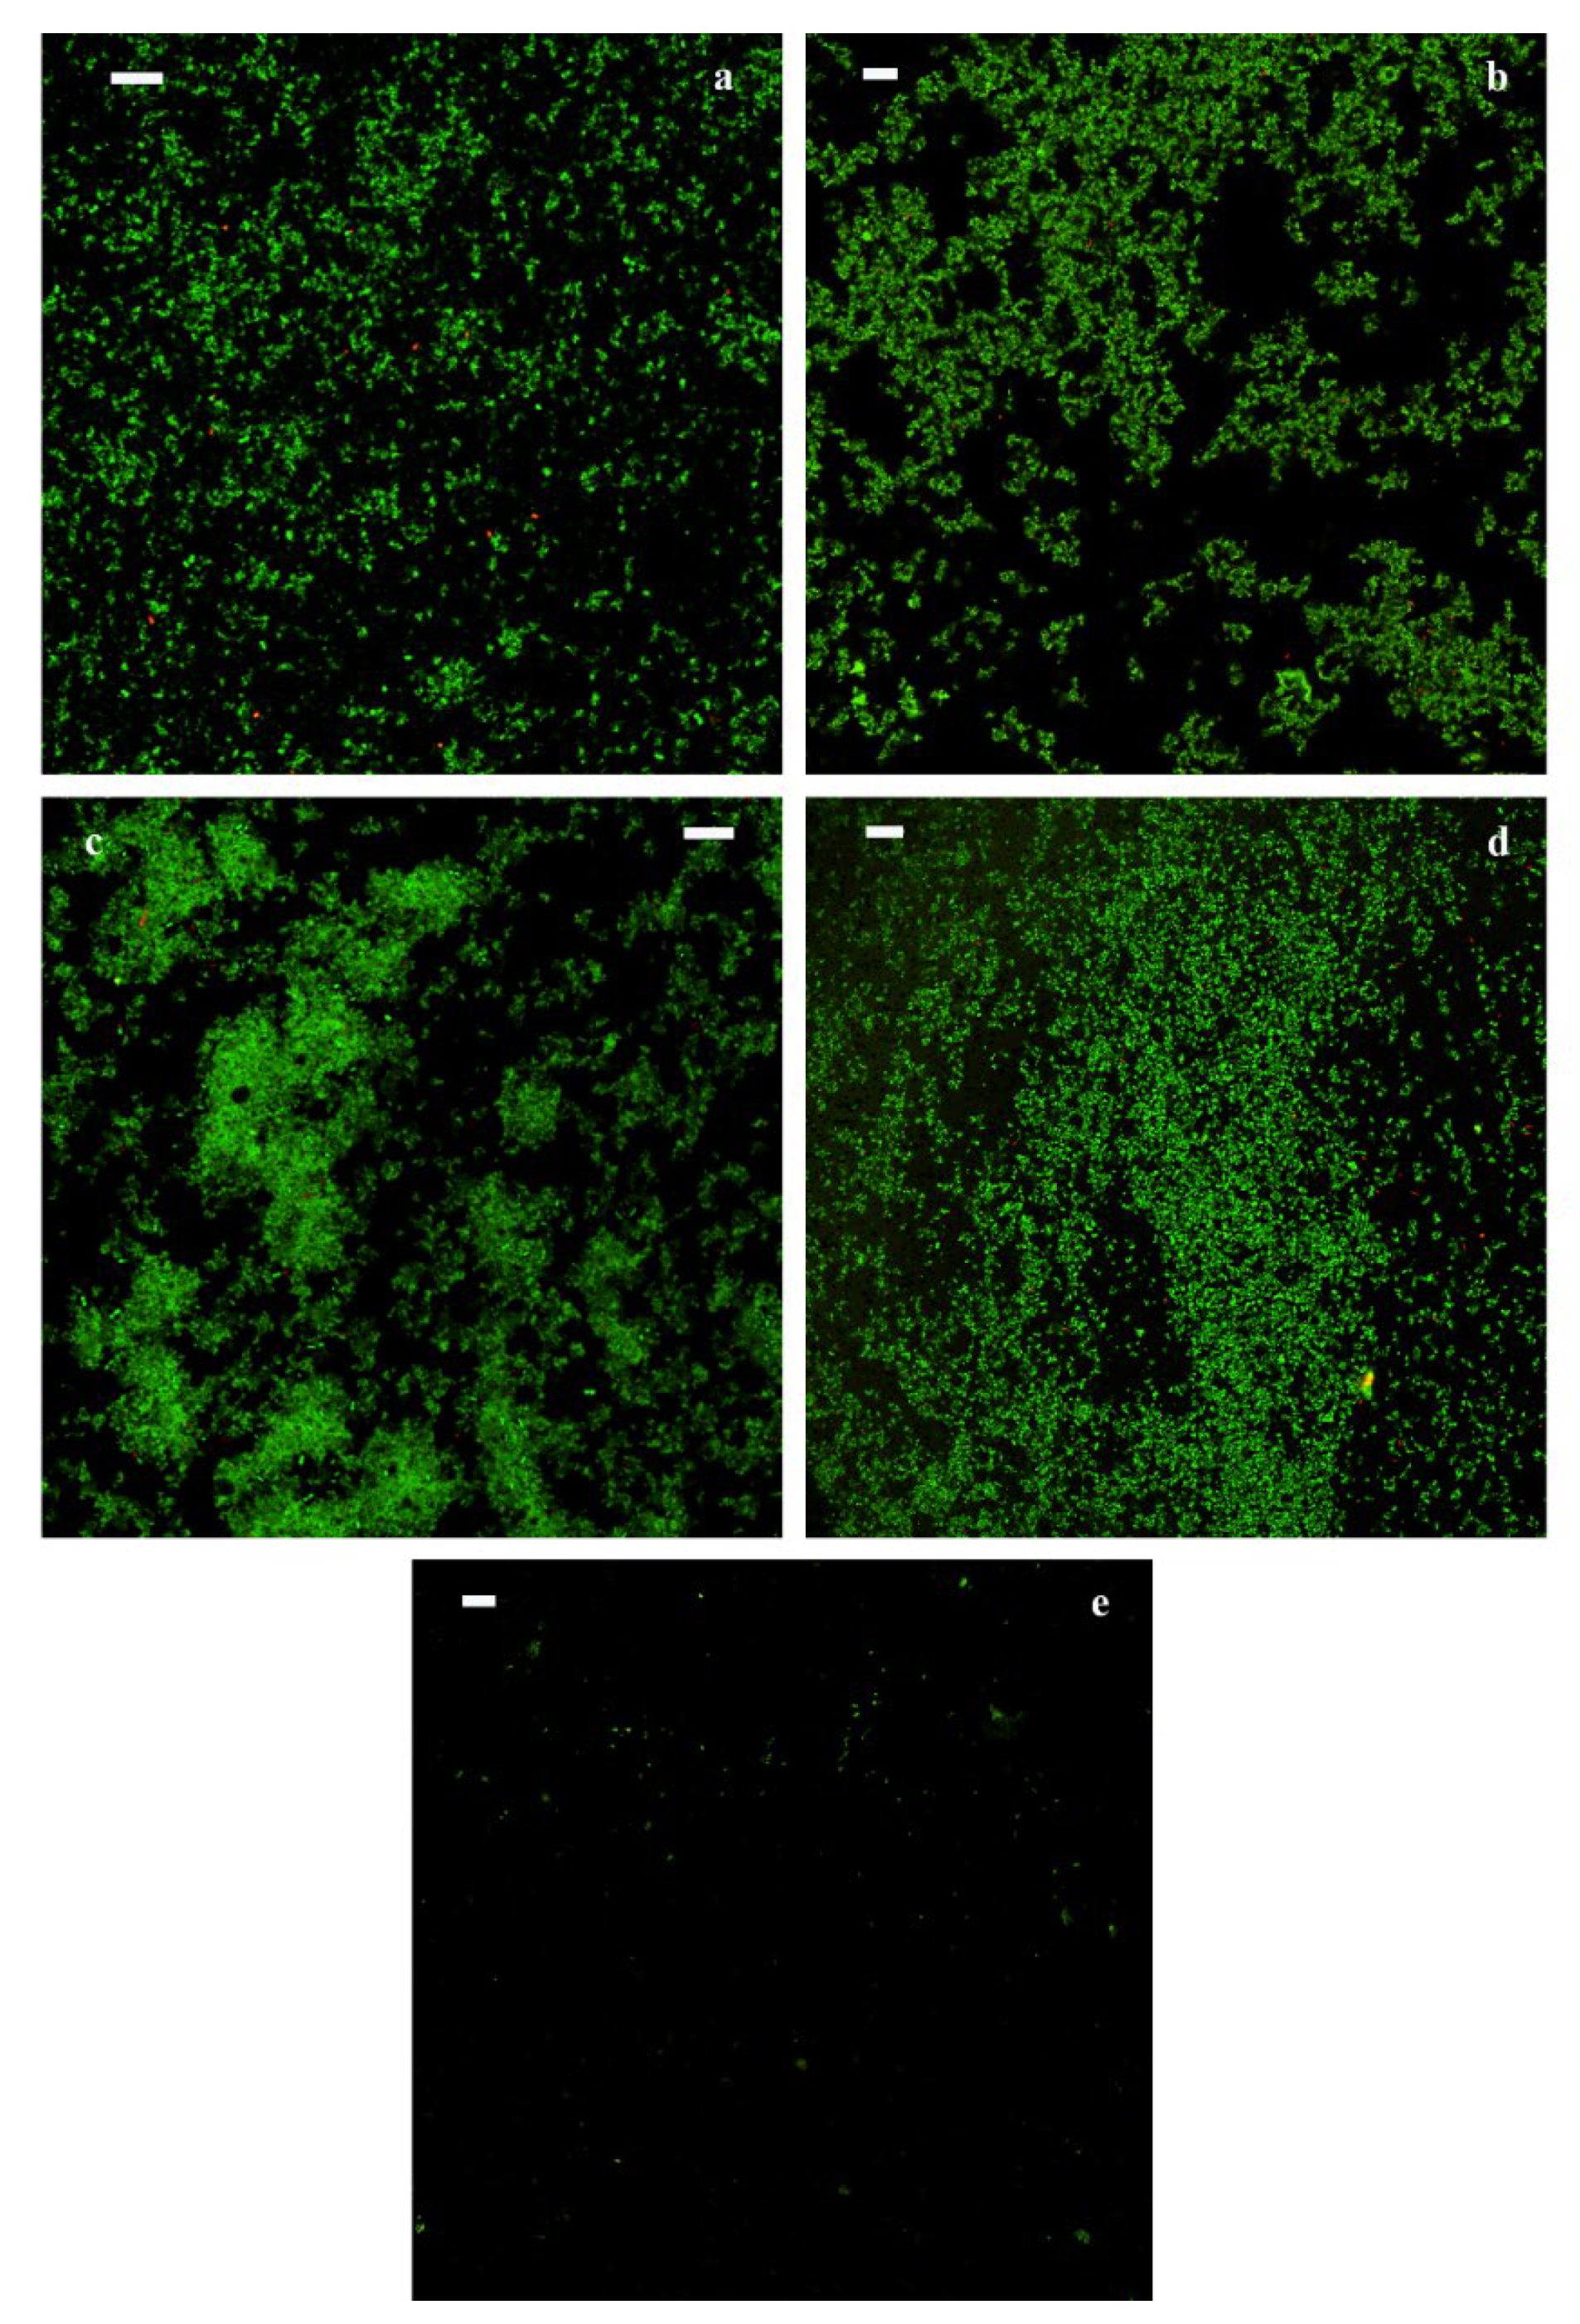
Qualitative observations of samples after 3 months of storage by CLSM confirmed that a high density of living cells was present in all theses with fermented milk, both with and without the addition of dietary fibers (green fluorescence), while dead cells (red fluorescence) are negligible (
Figure 2). The control samples (CO.WF and CO.AF) showed lower cell density compared to samples with fermented milk.
3.4. TTA, Carbohydrate, Organic acid, Free Amino Acid Analyses, and In Vitro Protein Digestibility
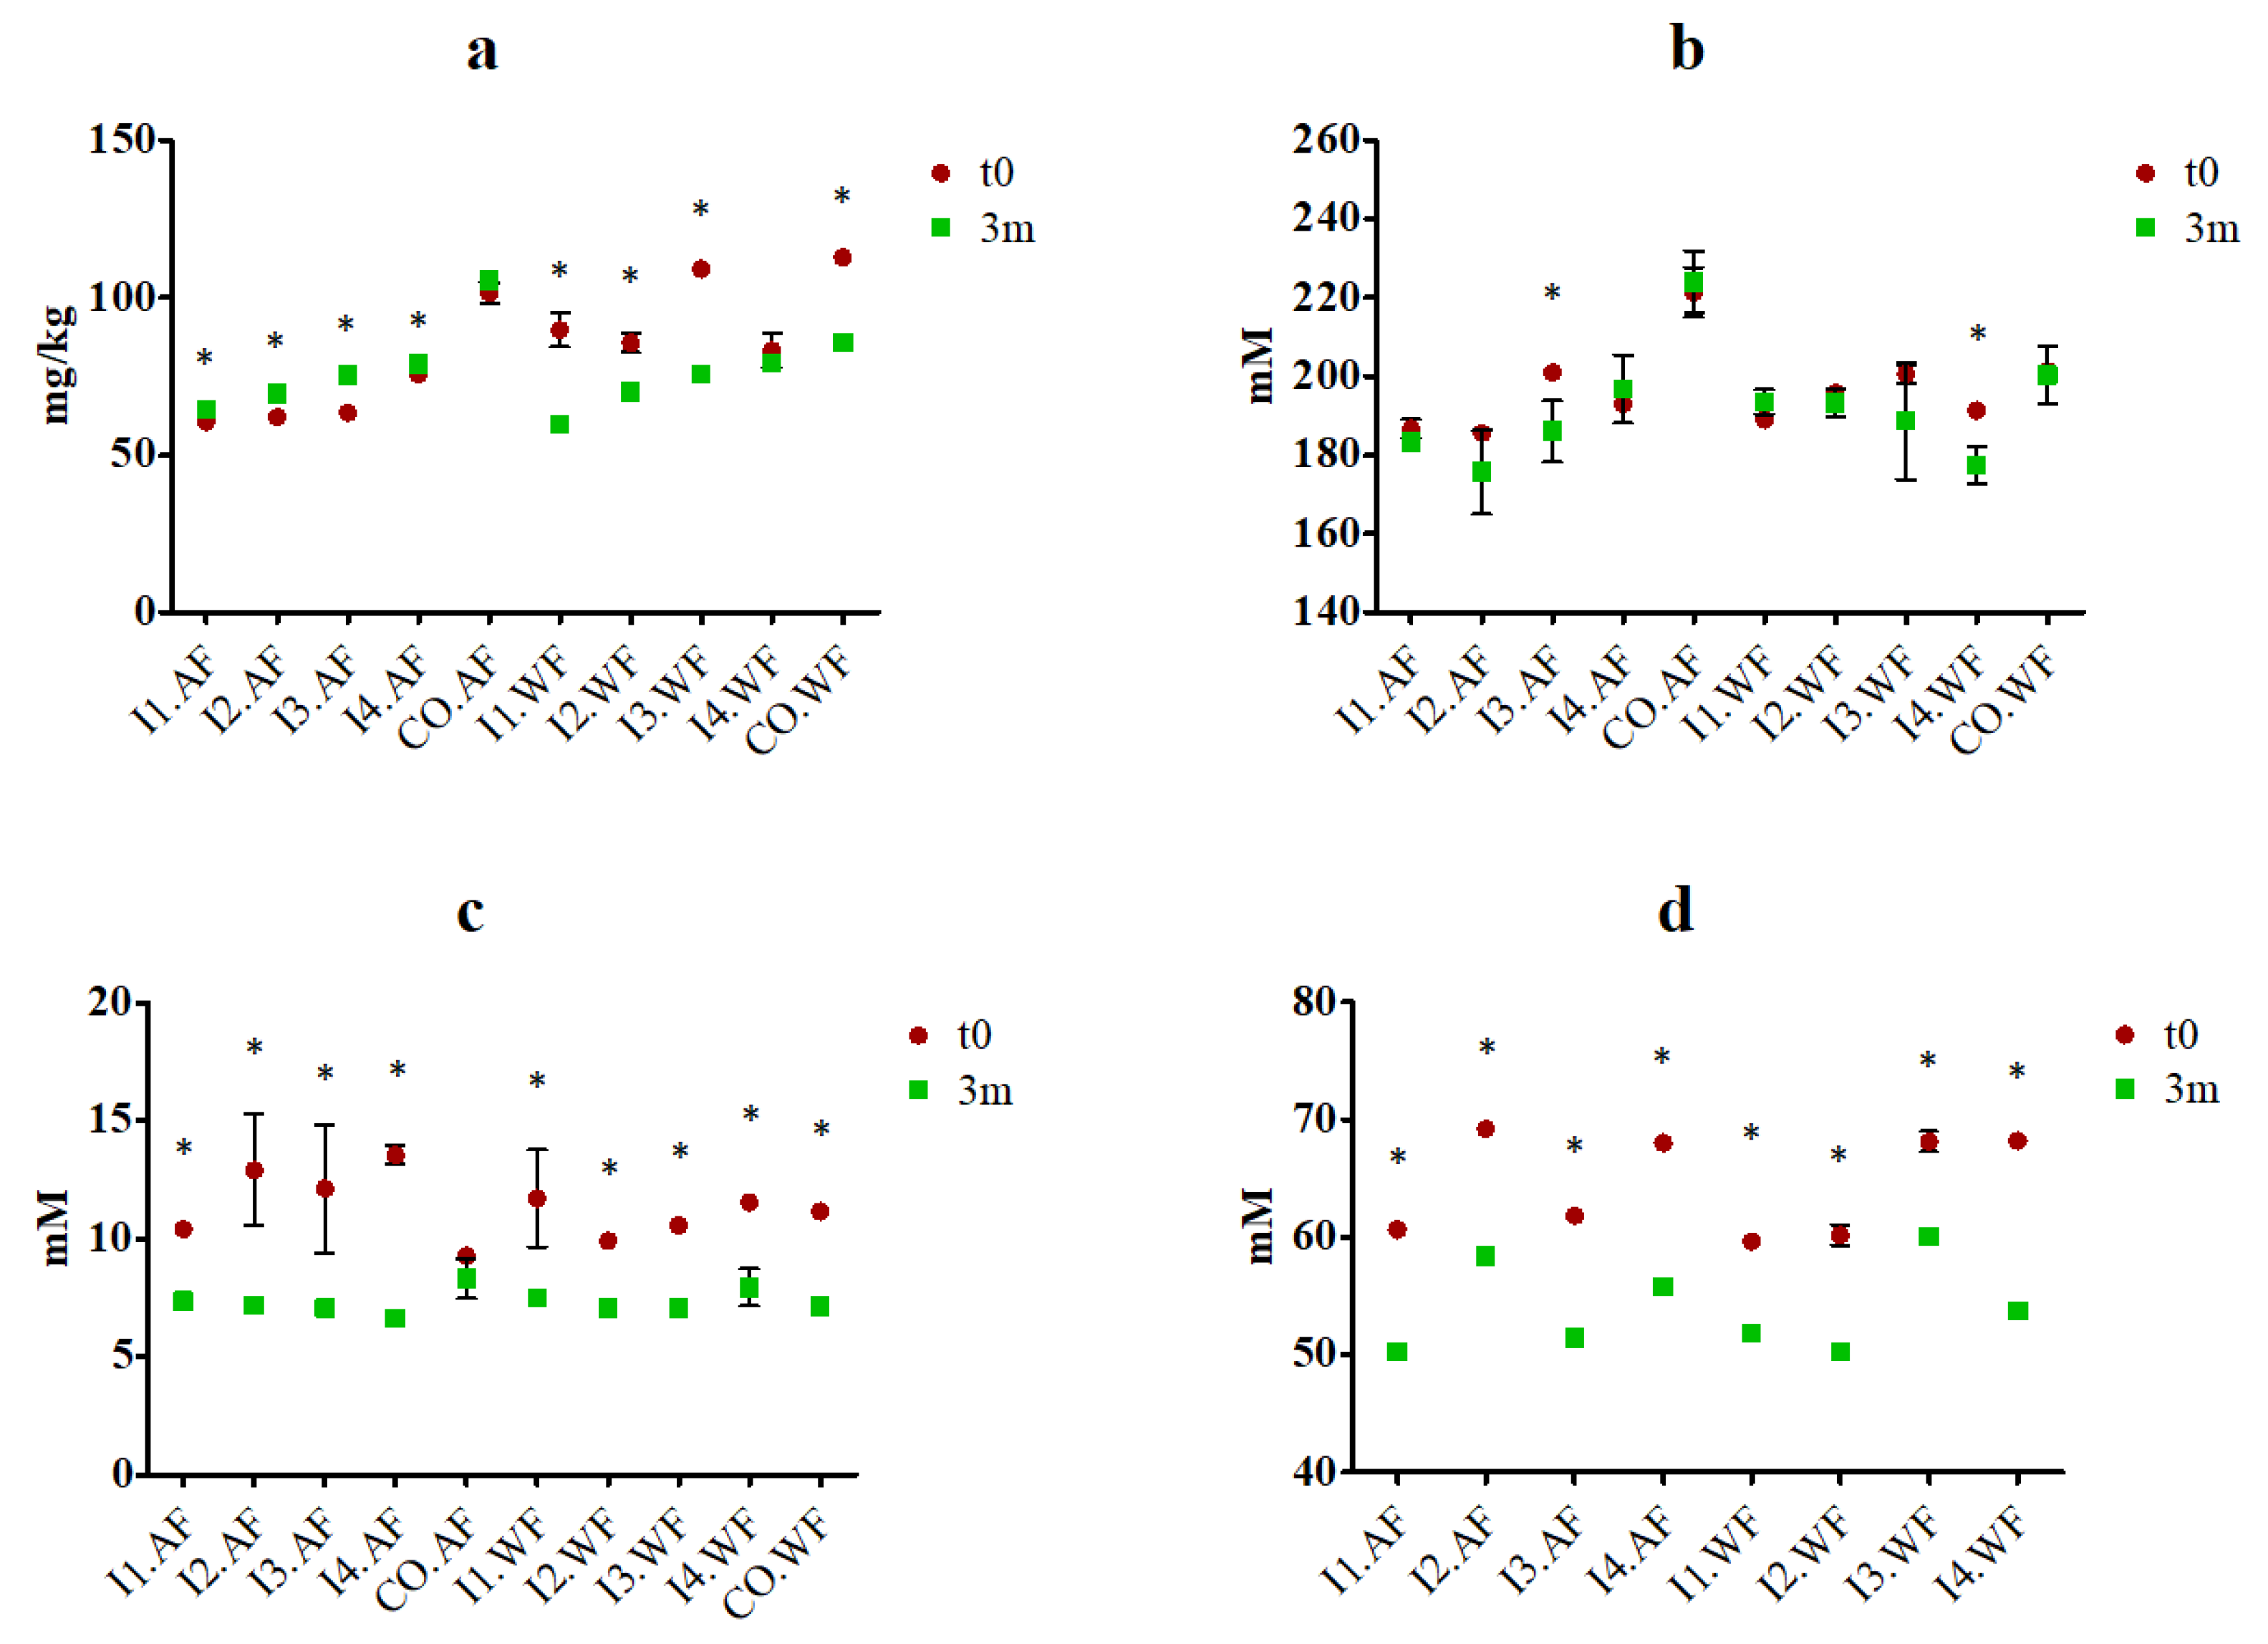
In samples with fermented milk, TTA ranged between 5.1 ± 0.5 and 6.5 ± 0.5 mL of 0.1 M NaOH (measured in I3.AF and I2.AF, respectively), while the values in control samples (CO.AF and CO.WF) were lower (
p < 0.05) and between 0.7 ± 0.1 and 0.9 ± 0.2 mL of 0.1 M NaOH. Theses with fermented milk did not differ significantly among them, while they have significantly higher values compared to no fermented ice creams (CO.WF and CO.AF). Changes after 3 months of storage were not statistically significant, with the exception being I2.AF and I3.AF, which had final values statistically different compared to t0. The concentration of lactose, glucose, galactose, and lactic acid free amino acids were measured in fresh ice creams and after 3 months of storage. In fresh ice creams produced with fermented milk, lactic acid concentrations ranged between 49.6 ± 0.1 and 69.2 ± 0.3 mM, and it had a significant (
p < 0.05) decrease after 3 months of storage in all theses, while it was not found in ice creams produced with no fermented milk. Glucose concentration in fresh ice creams ranged between 185.6 ± 0.6 and 221.3 ± 6.4 mM, and after storage, it displayed a significant decrease (
p < 0.05) only in I3.AF and I4.WF. Galactose concentrations were between ca. 9.3 ± 0.1 and 14.2 ± 0.5 mM at t0, and significantly decreased (
p < 0.05) in all theses except CO.AF. Lactose concentrations were under the detection limit (< 0.6 mM) for all samples both in fresh ice cream and after storage. Free amino acids concentration in fresh ice cream ranged between 60.6 ± 0.3 and 105.7 ± 0.3 mg/kg. Overall, it was higher in fermented ice creams without the addition of fiber compared to fermented ice creams with fiber addition. However, after storage, it increased in all ice creams produced with the addition of dietary fibers, and such variation was significant (
p < 0.05) for all theses with fermented milk. On the contrary, the concentration significantly decreased (
p < 0.05) in all theses without the addition of dietary fiber, except for I4.FW, in which the decrease resulted in no significant (
p > 0.05) (
Figure 3). Protein digestibility ranged from 93.31 to 94.25%, with no significant (
p > 0.05) differences between theses and during storage.
3.5. In Vitro Gastrointestinal Batch Digestion of Ice-Cream and Short Chain Fatty Acid (SCFA) Analysis
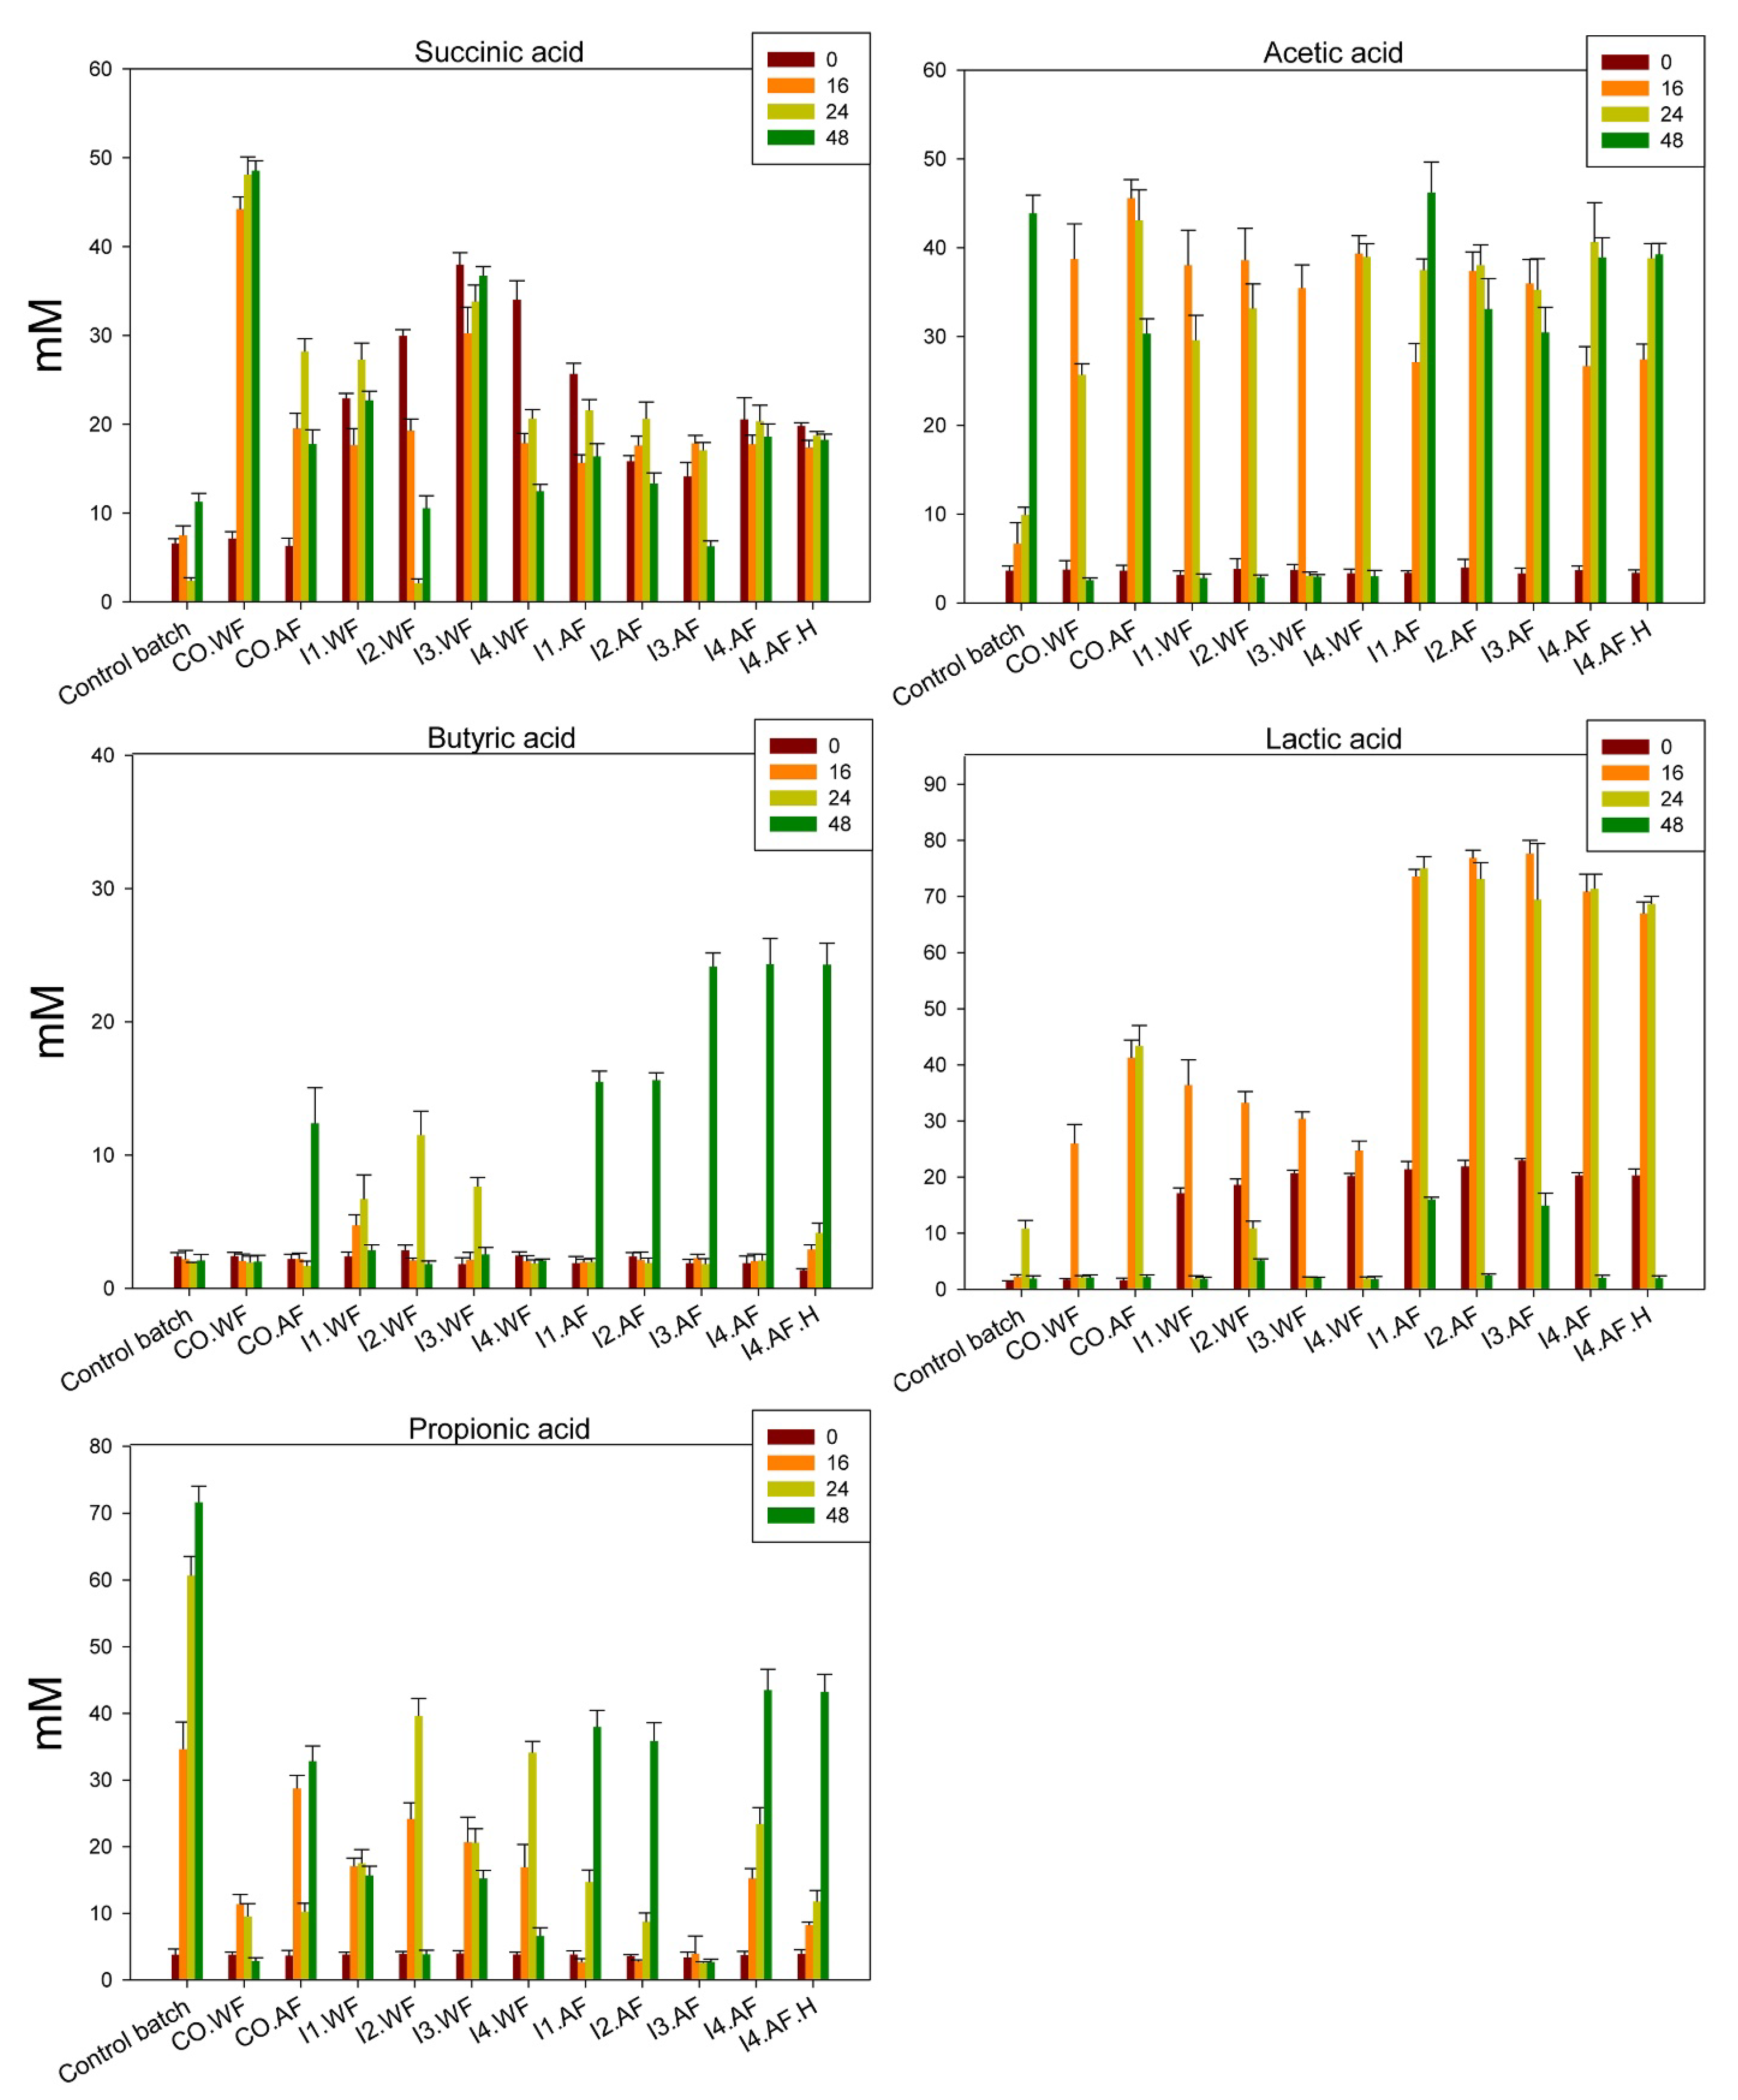
HPLC analysis was used to identify and quantify the main SCFA (succinic, acetic, butyric, lactic, and propionic acids) in fecal batch cultures. Analysis was carried out at 0, 16, 24, and 48 h of incubation (
Figure 4). Overall, the fatty acid trends determined by fresh ice cream and ice cream stored for 1 month at −20 °C were mostly similar (
Figure 4 and
Supplementary Figure S1, respectively). At the beginning of incubation, fermented ice cream determined higher (
p < 0.05) lactic and succinic acid values than CO.AF and CO.WF. During incubation, the level of succinic acid followed a fluctuating trend for all thesis, first increasing and then decreasing, or toward stable levels. A similar trend was found for lactic acid. Fiber fortification resulted in the highest (
p < 0.05) levels of lactic and butyric acid. For the latter, the highest values were found for thesis I3.AF, I4.AF, and I4.AF.H after 48 h of fecal batch incubation. The addition of the fiber also changed the acetic and propionic acid profiles (
Figure 4 and
Figure S1).
3.6. Sensory Analysis
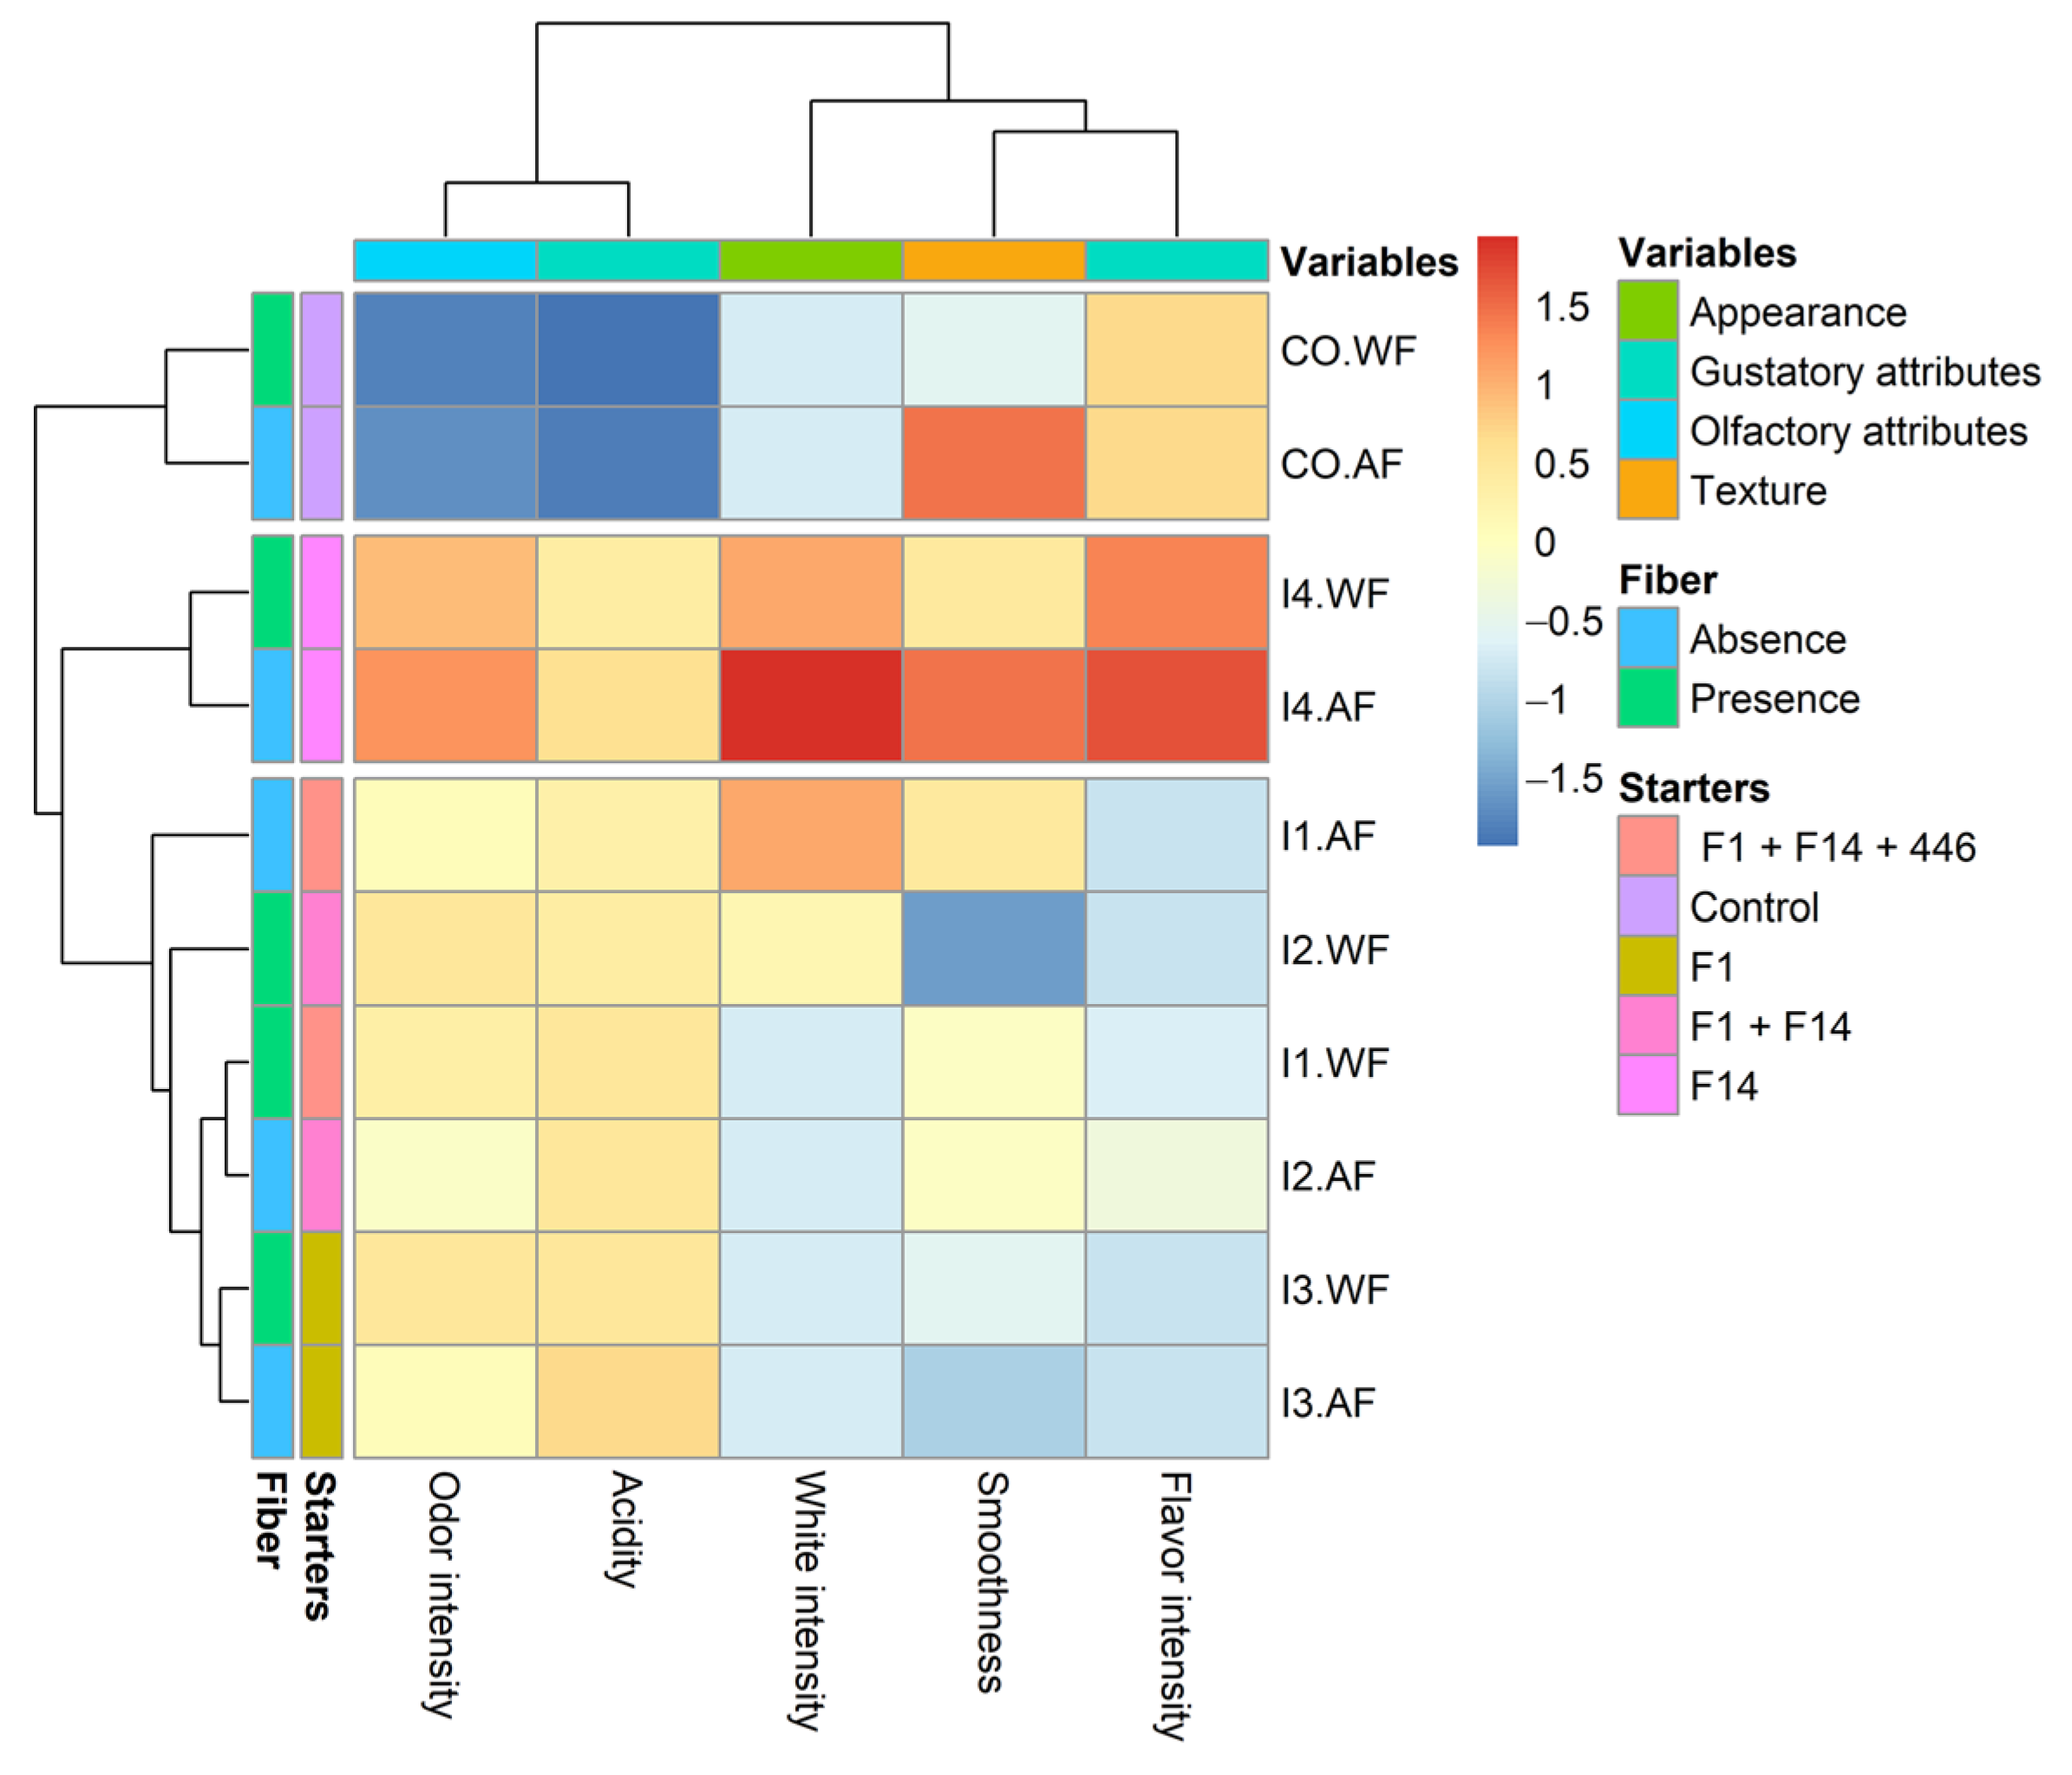
Sensory analysis of milk ice creams (CO.WF and CO.AF) was compared to that of ice creams fermented with selected strains. The pseudo-heat map (
Figure 5) summarizes the result highlighting differences among different theses. Three main clusters can be identified corresponding to control theses (CO.AF and CO.WF), I4 theses (both with and without fiber addition), and all other fermented theses (I1, I2 and I3). The starters of fermentations appear as the main driver of clustering, while the fiber addition did not affect the overall perception of panelists. In terms of color appearance (white intensity), thesis I4.AF and I4.WF obtained the highest scores. In terms of smoothness, CO.AF and I4.AF supplied the highest scores. Panelists perceived higher odor intensity and acidity in fermented ice creams compared to no fermented ice creams. About the flavor intensity, the I4 theses resulted in the most appreciated, with I4.AF showing the highest score.
3.7. HT Addition
The addition of 50 ppm HT to the recipe of I4.AF ice cream, the most promising thesis based on sensory analysis, was also investigated. Lactobacilli were detected at a cell density of 9.2 ± 0.1 log CFU/g in fresh ice-cream, and 9.0 ± 0.1 log CFU/g after one month of storage at −20 °C. The value of pH was 4.4 ± 0.0, without significant (p > 0.05) changes during storage.
3.8. Antioxidant and Anti-Inflammatory Features of Fermented Ice Cream in Caco-2 Cell Culture
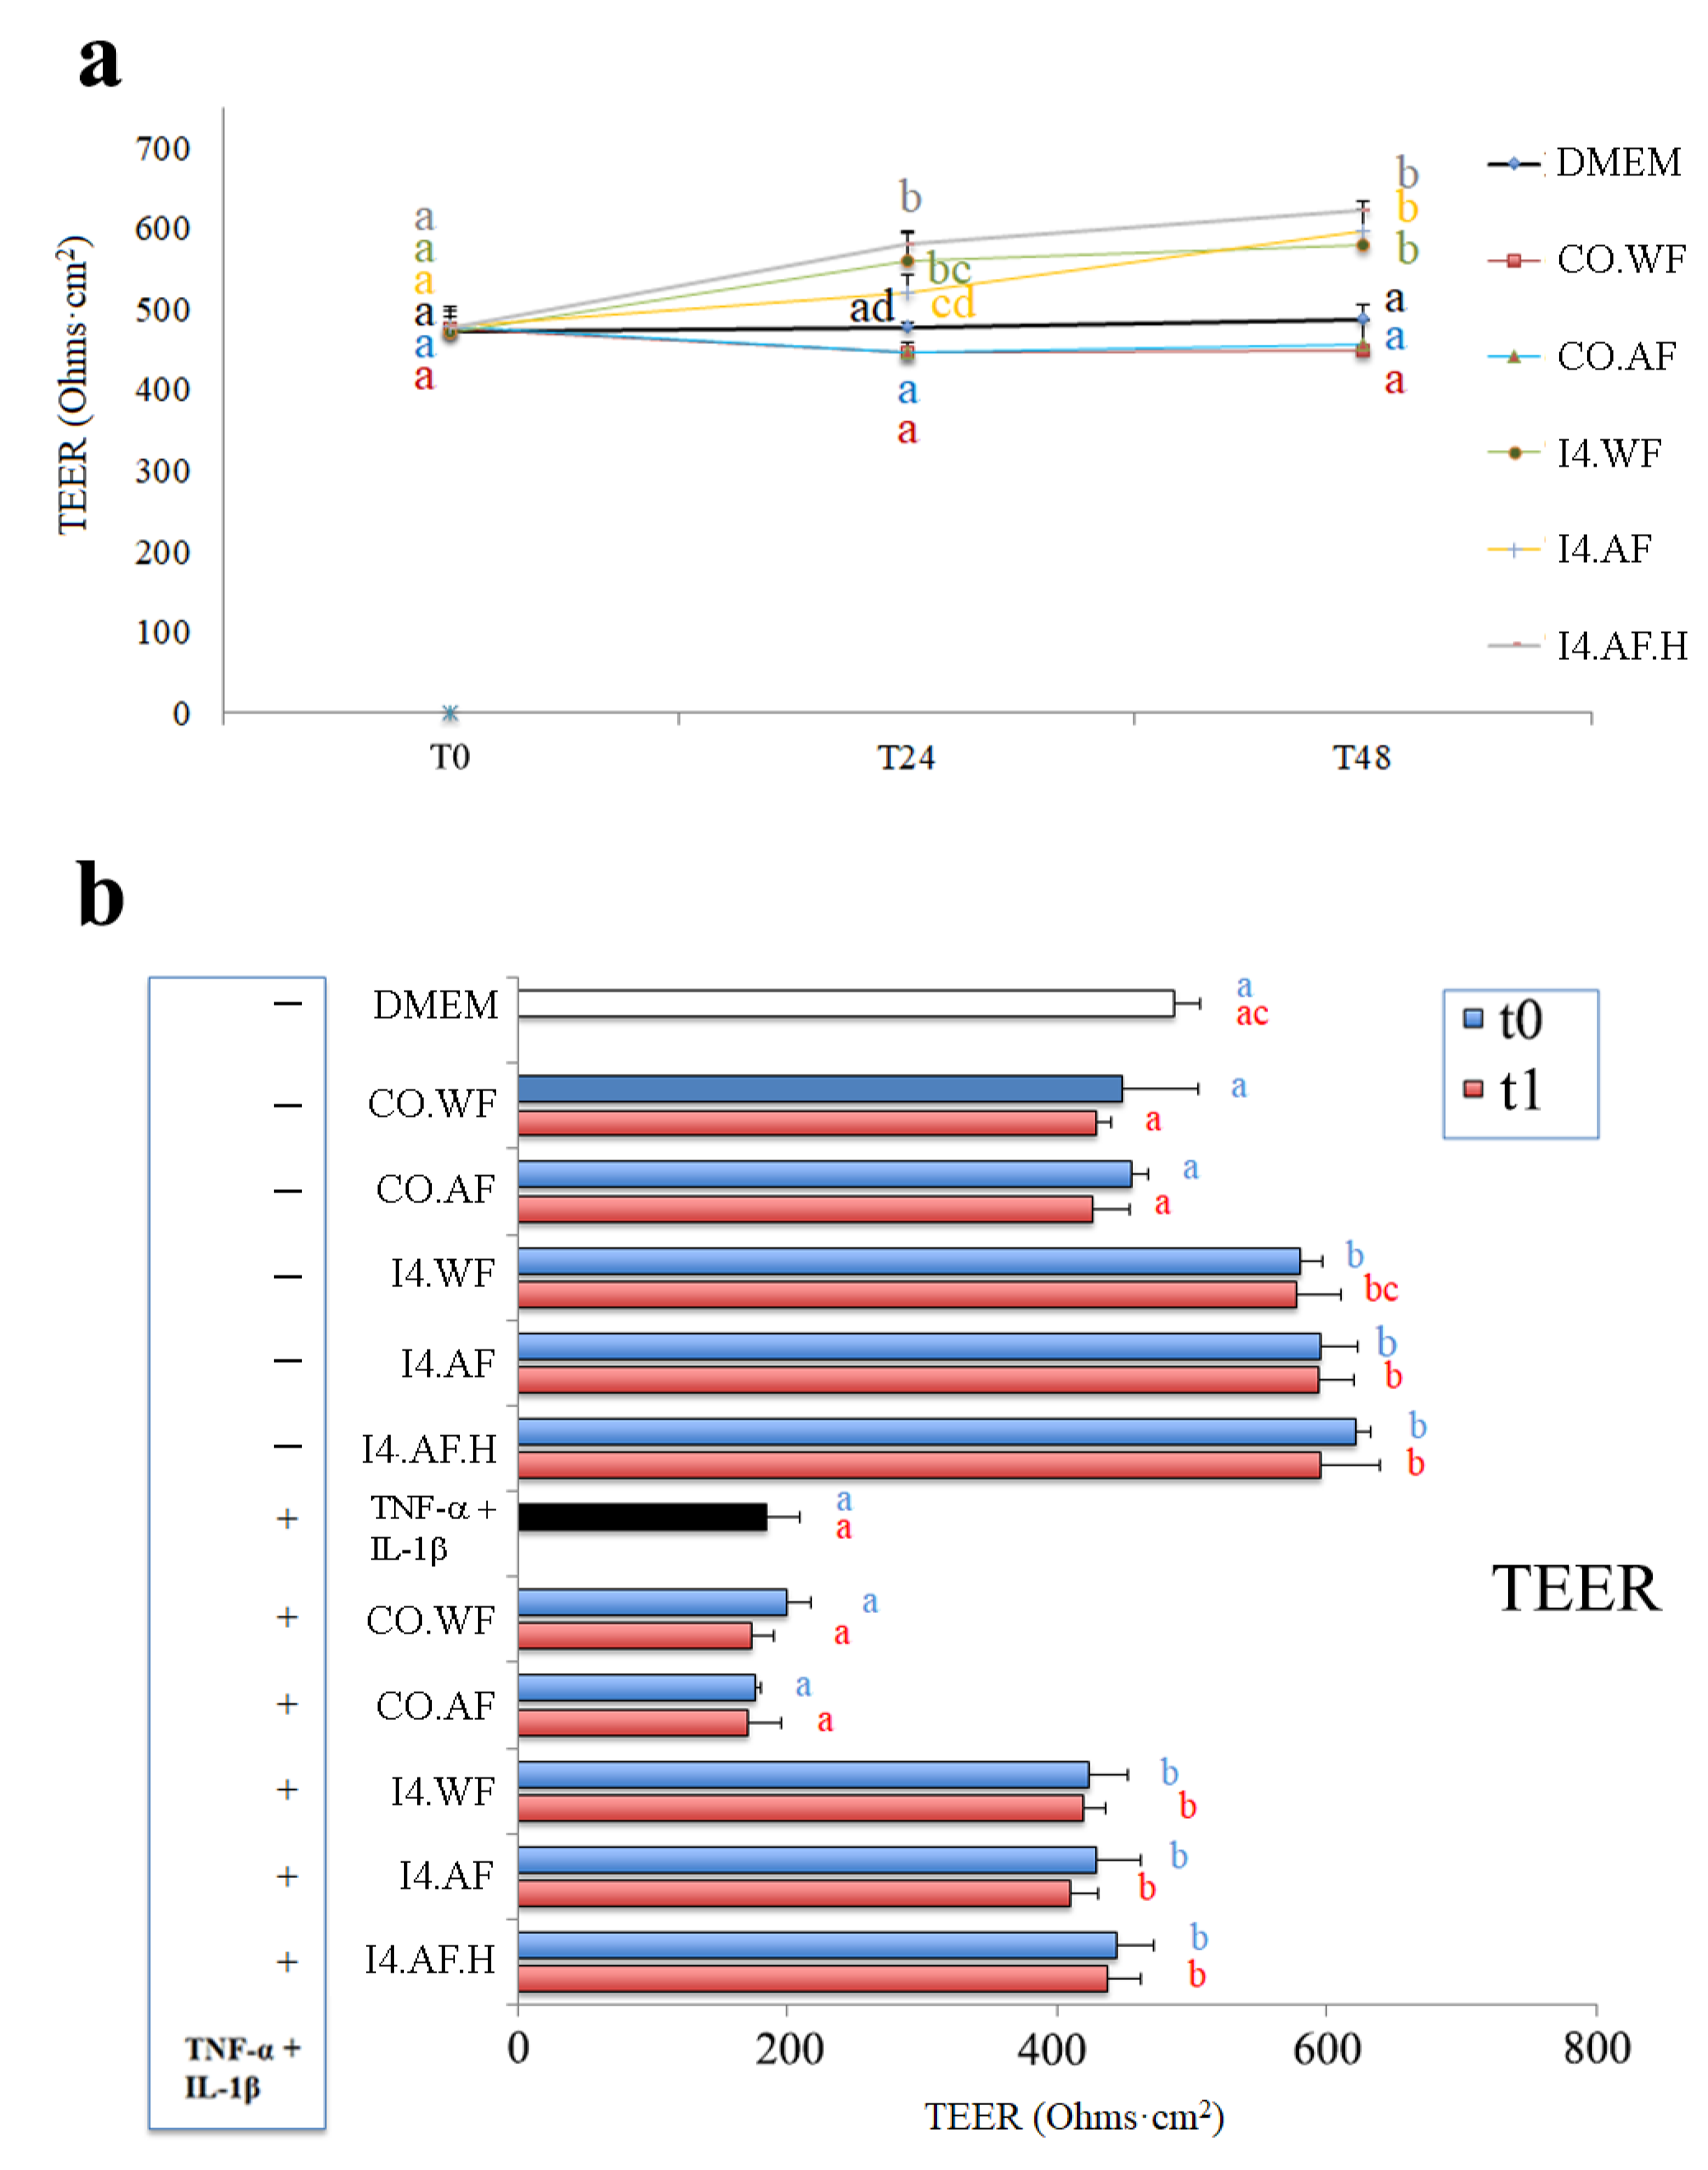
The protection of the most promising thesis (I4) of fermented ice cream towards oxidative stress was investigated on human intestinal Caco-2 cells. TEER is a widely accepted method to quantitatively measure the dynamics of epithelial integrity through an in vitro model. Compared to the negative control (DMEM, 486.7 ± 19.5 ohms × cm
2 at 48 h), the fresh fermented ice cream (theses I4.WF, I4.AF, and I4.AF.H) induced a significant (
p < 0.05) increase of TEER in Caco-2 cells both at 24 and 48 h of incubation (values at 48 h between 580.0 ± 17.1 and 622.0 ± 11.1 ohms x cm
2), while no fermented ice creams (CO.WF and CO.AF) induced any significant variation (values at 48 ranged between 448.3 ± 56.5 and 455.3 ± 11.9 ohms x cm
2) (
Figure 6a). The
Figure 6b reports the TEER at 48 h of incubation, when ice cream (both fresh and after one month of storage at −20 °C) was used to treat Caco-2 cells, both alone and in combination with TNF-α (2 ng/mL) and IL-1β (25 ng/mL). In Caco-2 not subjected to the inflammatory stimulus and treated with ice creams after one month of storage, the results confirmed the significant increase of TEER induced by the fermented ice cream (values between 594.0 ± 26.1 and 595.7 ± 43.8 ohms × cm
2) compared to the TEER measured in the negative control (DMEM, 486.7 ± 19.5 ohms × cm
2) and in Caco-2 cells treated with no fermented ice cream (values between 428.7 ± 11.7 and 426.0 ± 28.1 ohms × cm
2), with the exception being I4.WF (577.7 ± 33.1 ohms × cm
2), which resulted not significantly dissimilar compared to DMEM. Instead, if also subjected to the inflammatory stimulus, the TEER of positive control (DMEM containing TNF-α and IL-1β) and of Caco-2 cells treated with no fermented ice cream was lower and ranged between 170.7 ± 24.6 (CO.AF after 1 month of storage) and 199.0 ± 19.1 (fresh CO.WF) ohms × cm
2. However, the values measured in cell lines treated with fermented ice creams (both fresh and after 1 month of storage) were near to those of negative control (DMEM) and resulted significantly higher (
p < 0.05) than those displayed by the positive control and Caco-2 treated with no fermented ice cream.
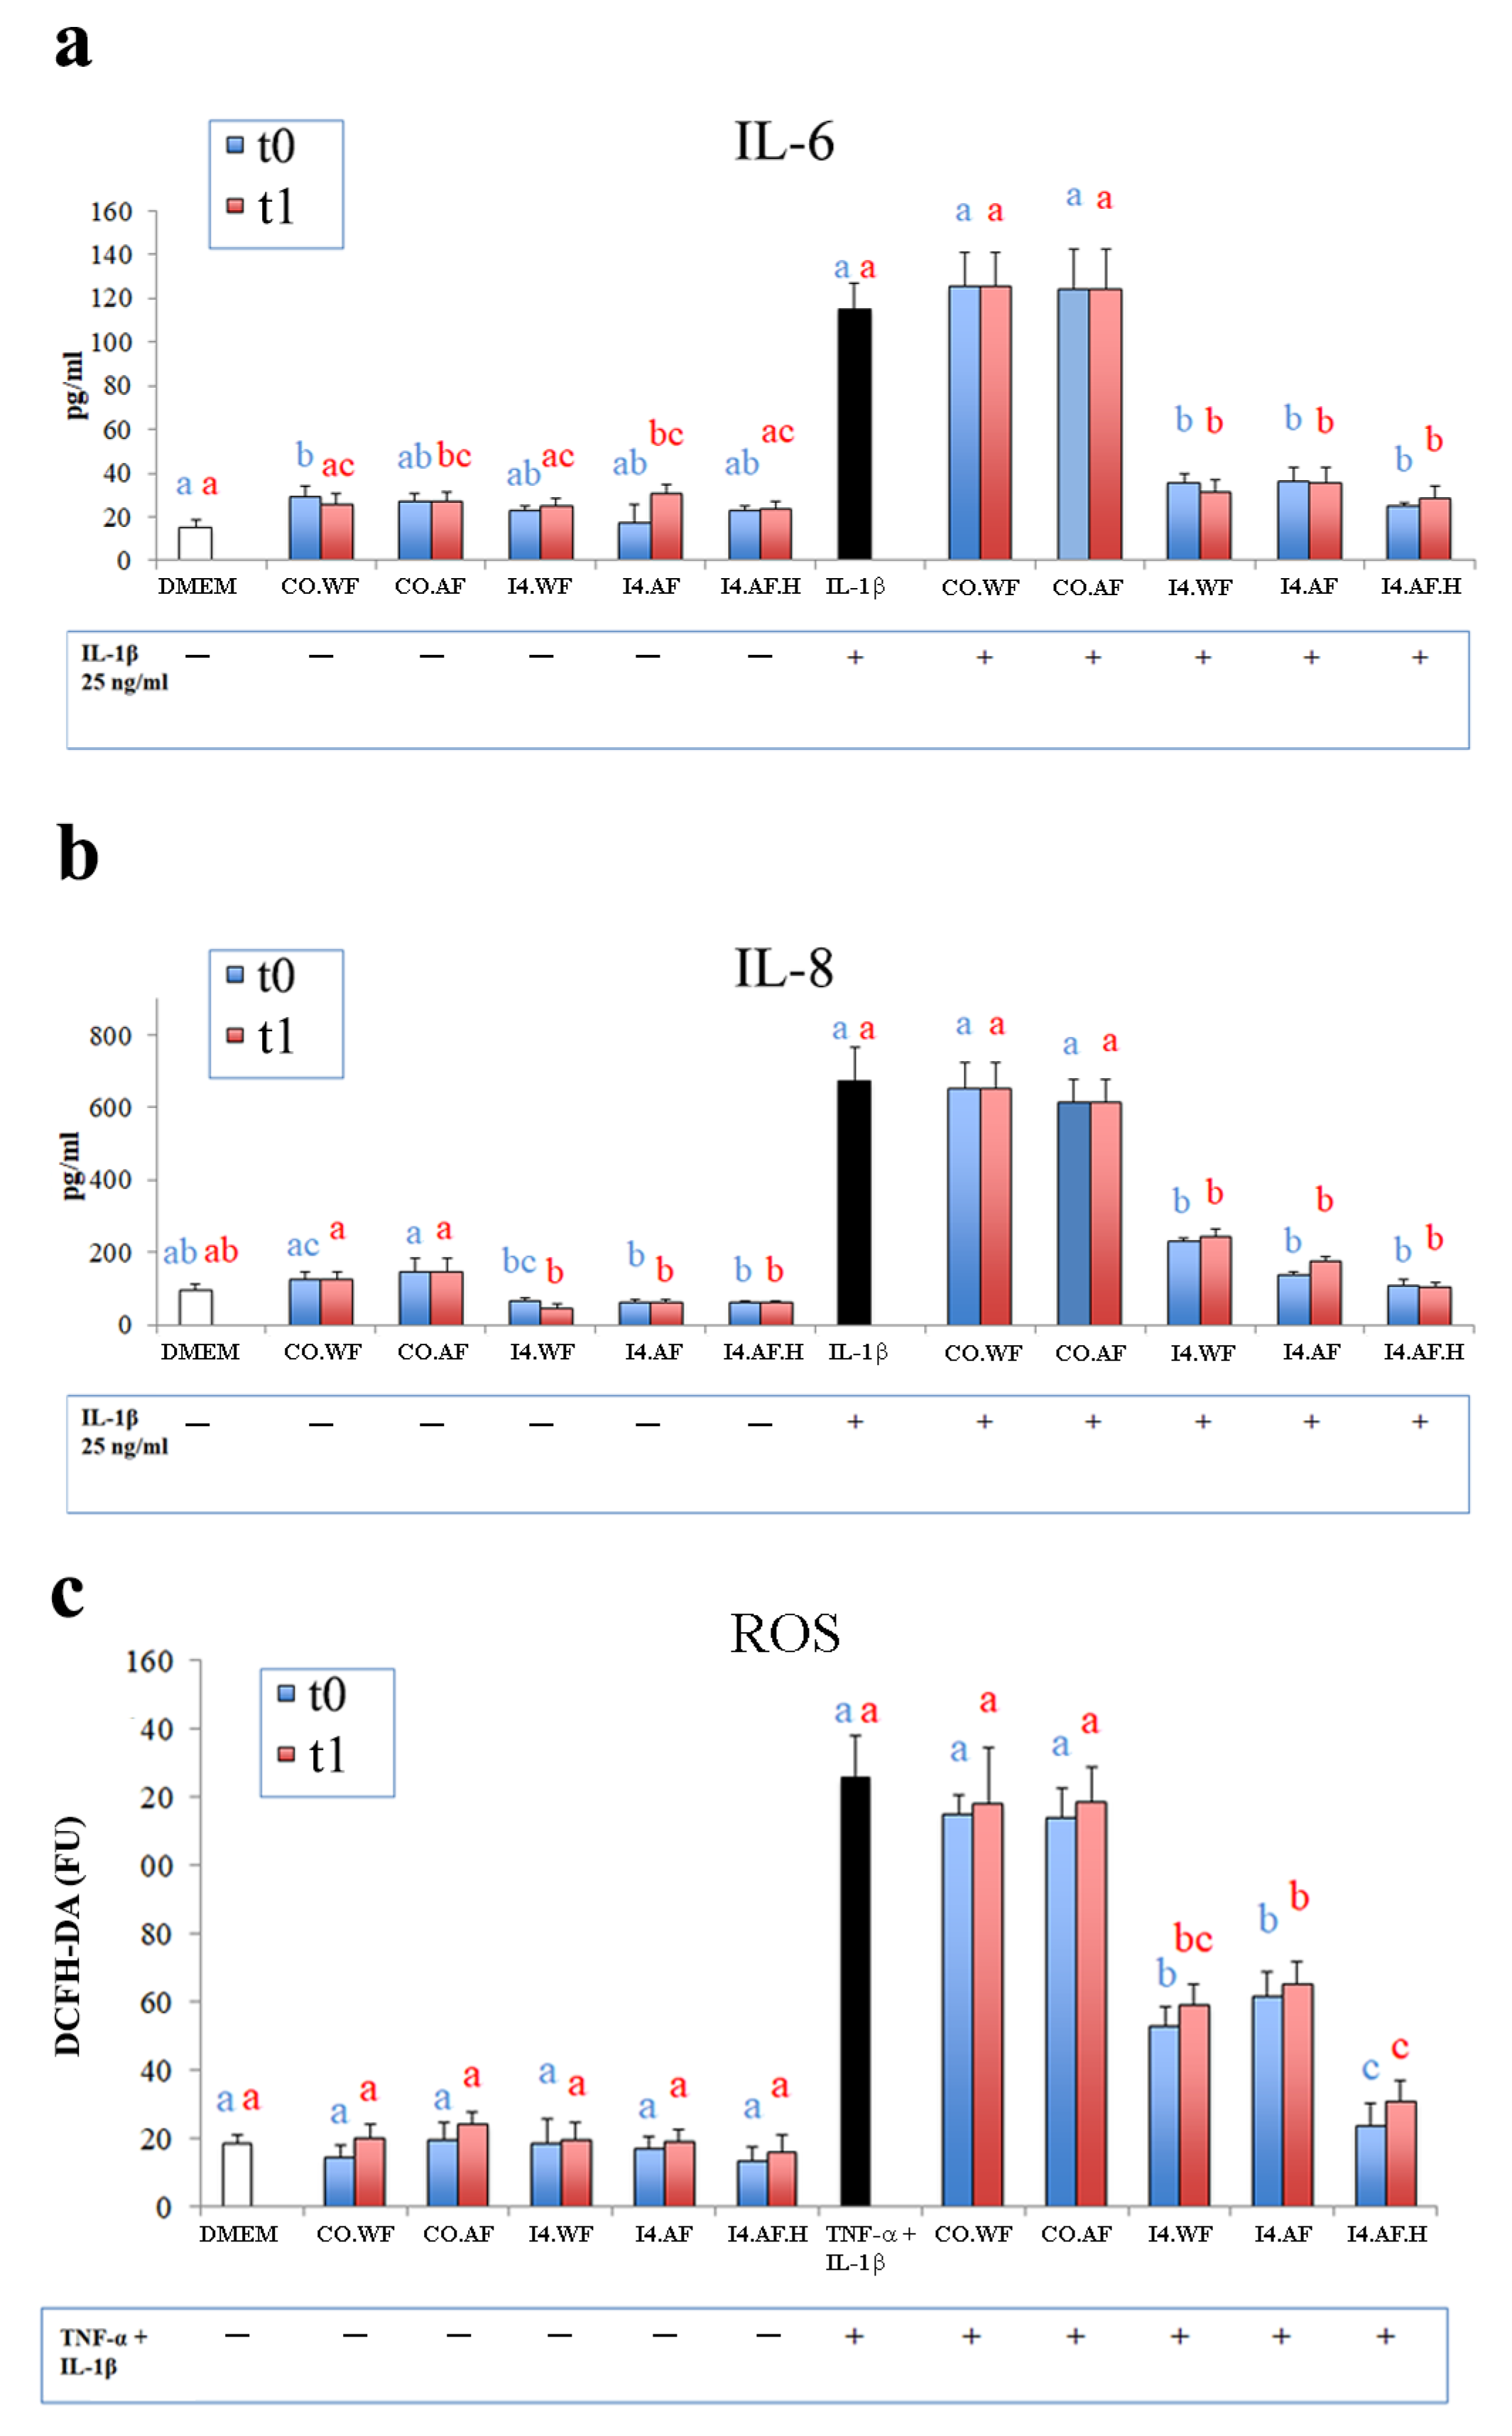
In Caco-2 cells not subjected to the inflammatory stimulus, ELISA analysis revealed no significant changes in IL-6 and IL-8 levels, with the only exception of cells treated with fresh CO.WF and with CO.AF and I4.AF after 1 month of storage. However, in this case, differences were small even if significant and, overall, the absolute values ranged between 15.5 ± 3.1 (DMEM) and 30.7 ± 4.2 (I4.AF after 1 month of storage) pg/mL for IL-6, and between 46.0 ± 11.1 (I4.WF after 1 month of storage) and 145.3 ± 39.1 (CO.AF) pg/mL for IL-8. In Caco-2 cells stimulated with IL-1β, significant decreases in levels of IL-6 and IL-8 were obtained when a treatment with fermented ice creams was applied compared to positive controls (DMEM treated with IL-1β) and cells treated with no fermented ice creams. The decreases were significant both if fresh ice creams and if ice creams after one month of storage were used (
Figure 7a,b, respectively). In particular, the concentrations of IL-6 were 114.7 ± 12.3 pg/mL in the positive control, between 124.0 ± 18.2 and 125.7 ± 15.0 pg/mL when cells were treated with no fermented ice creams (CO.AF and CO.WF) and between 24.7 ± 1.5 and 36.0 ± 6.6 pg/mL if treated with fermented ice creams, while the concentration of IL-8 was 673.7 ± 91.7 pg/mL in the positive control, and it ranged between 614.0 ± 65.0 and 651.7 ± 73.5 pg/mL and between 104.0 ± 13.0 and 244.3 ± 21.0 pg/mL when the treatment was performed with no fermented and with fermented ice creams, respectively.
No significant differences in intracellular ROS levels were detected in human intestinal cells treated with ice cream only (both fermented and unfermented) compared to the negative control, both with fresh and with 1-month old ice cream (
Figure 7c). In this case, the ROS level was 18.7 ± 2.5 DFCH-DA (FU) for negative control, while it ranged between 13.7 ± 4.0 and 24.0 ± 3.6 DFCH-DA (FU) if cells were treated with ice creams. If subjected to the oxidative stress with TNF-α and IL-1β, a significant decrease of the intracellular level of ROS resulted in human intestinal cells treated with fermented ice cream compared to the positive control (125.7 ± 12.0 CFCH-DA FU) and to those subjected to a treatment with no fermented ice creams (values between 113.7 ± 8.7 and 118.3 ± 10.5 CFCH-DA FU). In this case, the treatment with fermented ice cream, both fresh and after 1 month of storage, displayed lower final levels of ROS compared to the unfermented ice cream. The lowest (
p < 0.05) values were detected with the formulation added of HT (I4.AF.H): 23.7 ± 6.8 and 31.0 ± 6.2 CFCH-DA FU for fresh and 1-month old ice cream, respectively.
4. Discussion
The intrinsic chemical, structural and physical features of ice cream make this matrix suitable for delivering functional microorganisms. The enrichment of functional microorganisms into ice cream can be obtained by blending it with probiotics immediately before freezing [
8] or through the fermentation of milk [
21]. In this paper, we explored the second case as, with this approach, the ice cream can also be enriched with positive postbiotics which, together with microorganisms, enhance the functional properties [
39]. The screening of starters was based on strains belonging to
Lacticaseibacillus genus that naturally inhabits the raw milk to have a better adaptation and to guarantee high fermentation performance.
L. paracasei F1 and
L. casei F14 were selected as they resulted in both fast-growing and fast-acidifying strains. Both species were very often isolated in milk and are largely recognized for their multiple pro-biotic activities [
40,
41]. As EPS produced by LAB are known for their functional properties and the Generally Recognized as Safe (GRAS) status [
21], the EPS producer
S. thermophilus 446 strain was also considered for starters formulations considering that none of the selected autochthonous lactobacilli showed EPS production at the colony level. According to previous studies, to ensure high adaptability and fast acidification of milk, starters were inoculated at a cell density of ca. 7 log CFU/mL [
42]. Ice creams manufactured with fermented milk differed for the used starters. Despite a slight decreasing trend of cell densities being observed, starter strains remained viable at high densities both along the production process, and during three months of storage. The decrease observed at the maturation step can be explained with the dilution effect due to the mixing of fermented milk with skimmed UHT milk.
L. paracasei F1 and
L. casei F14 cell viability were more affected by the co-presence of
S. thermophilus 446 (thesis I1). This is in agreement with previous studies, which hypothesized an inhibition effect due to the metabolites (like organic acids and antimicrobial agents) secreted by
S. thermophilus and the competition effect for the nutrients present in the milk [
43]. Apart from the control produced with no fermented milk, all ice creams had pH values < 5 at the end of the production process and after storage. The slight increase in pH at the maturation step is due to the addition of the base for ice cream (containing no fermented milk, sugars, stabilizer, fibers, and emulsifier) to the fermented milk (
Figure 1), which is characterized by higher pH (ca. 6), increasing the overall pH of the mixture. The addition of fibers to the recipe did not affect pH, TTA, and cell viability in the mixtures. The commercial lactase enzyme added to the mixture just before the maturation step (0.3%
w/
w) contributed to lactose transformation as demonstrated by the low level of such sugar and the presence of galactose in no fermented ice creams samples (controls), where lactic acid is not present.
Regarding the content of glucose, the ice creams studied in this work represent complex systems. The raw milk contained 130 mM of lactose as only sugar, but the glucose values measured in the ice creams were higher. This is due to the ice cream recipe: in fact, additional sugars were added both to the no fermented milk fraction (9.1%
w/
w of glucose syrup (Roquette, Lestrem, France. Dextrose equivalent 59–62, glucose 21–31%
w/
w, and disaccharides 35%
w/
w, as for manufacturer specifications) and 3.5%
w/
w of sucrose) and to the base for ice cream mixture after milk fermentation (6%
w/
w of sucrose) (
Figure 1). Overall, the amount of glucose added to the mixture after the fermentation step was 5 time higher compared to the quantity originally present before the fermentation step. Therefore, final glucose values resulted from the combination of two opposite factors: from one side the glucose consumption by bacterial starters during the fermentation, from the other side the addition to the mixture of further and higher amount of glucose and sucrose after the fermentation step. As matter of fact, in general glucose values were higher in no fermented ice creams (controls) compared to fermented counterpart. Fluctuation of galactose concentrations were found after storage as observed also in previous studies [
44]. Even galactose concentrations resulted from the combination of two opposite factors occurring during the production process: first it is consumed by bacterial starters, then it is added due to the hydrolysis of lactose.
As microbiological and chemical analyses did not highlight differences among fermented ice creams, a sensory analysis was used to select the most promising microbial starters. White intensity, smoothness, acidity, odor, and flavor intensity of ice cream samples were evaluated by no trained panelists, who assigned the highest scores to the theses I4.WF and I4.AF. Therefore, these were chosen for further experiments. HT is a well-known functional ingredient used to develop new functional products. It is claimed to exert antioxidant activity thanks to its ability to break down peroxidation chain reactions, scavenging of free radicals, and the prevention of metal ions [
45]. In this paper, its addition to the recipe of the most promising thesis was also considered (thesis I4.AF,H) since it did not affect cell viability and fermentation. Such findings agree with [
44] that investigated the addition of phenolic compounds for the production of functional milk (yogurt-like) beverages, and neither interference with the fermentation by LAB nor impact on volatile compounds was observed.
We used in vitro digestion and fecal batches to investigate possible links between human consumption of ice cream and implications at the gut level. In particular, HPLC analysis was used to identify and quantify the main SCFA produced in fecal batch cultures, though we are aware that synthesis of SCFA in the human colon is a highly dynamic process that follows complex enzymatic pathways and involves an extensive number of bacterial species belonging to different phyla. In the initial stages of fecal batches incubation, fermented ice cream provided substantial amounts of lactic and succinic acids. These two organic acids are generated by the metabolism of
L. casei and
L. paracasei during milk fermentation and represent important SCFA precursors at a gut level, as well as playing a role in the modulation of intestinal inflammation [
46]. Trends in lactic and succinic acid levels during fecal batches incubation were in agreement with those of butyric acid, whose production by the gut microbiota prevents the accumulation of organic acids and stabilizes the intestinal environment [
46]. An interesting result was represented by the high levels of butyric acid in batches containing fermented ice cream, since butyric acid is the preferred energy source for colonocytes, affect peripheral organs indirectly by activation of hormonal and nervous systems, and act as a potent anti-inflammatory agent [
46].
As intestinal cells are extremely susceptible to oxidative injury when exposed to lipid peroxidation products and luminal oxidants derived by food ingestion, the antiradical and anti-inflammatory properties of I4.AF, I4.WF and I4.AF.H ice cream was further investigated on human intestinal Caco-2 cells, which represent one of the most widely used in vitro models to mimic the intestinal mucosa, by measuring the TEER, ROS, cytokines IL-6 and IL-8 and comparing with those of control theses (CO.AF and CO.WF) [
47]. Under the conditions of our study, the treatment with fermented ice cream halted the dramatic increase of IL-8 and IL-6 levels induced by pro-inflammatory stimulus in Caco-2 cells. Previous studies have highlighted the key role of pro-inflammatory mediators, such as IL-8 and IL-6, in the acute phase inflammatory reaction, which represents one of the main targets for the treatment of inflammatory disorders of the gastrointestinal tract [
48,
49]. Fermented ice cream significantly counteracted also the TNF-α and IL-1β-induced intracellular accumulation of ROS. Such activity is useful when antioxidant defenses are overwhelmed by the accumulation of ROS, resulting in oxidative stress that leads to damage of cellular structures and biomacromolecules in the human body [
50,
51].
As, under investigation conditions, cell lines develop functional and morphological traits of enterocytes that include their intercellular tight junctions, we assessed the TEER, which measures the dynamics of epithelial integrity [
52]. During 48 h of incubation in DMEM, TEER was stable. However, the pretreatment of cells with fermented ice cream induced, after 48 h, an increase of TEER between ca. 19 and 28%. For I4.AF and I4.AF.H, such effect was still evident even after one month of storage at −20° (an increase of ca. 22%). Treatment of human colon cells with TNF-α and IL-1β induced a cellular inflammatory response by stimulating the secretion of primary histopathologic indicators of inflammation like IL-8 and IL-6 [
53] that caused a TEER decrease of 62%. However, when cells were preliminary treated (apical compartment) with fermented ice creams and subsequently stimulated (basolateral compartment) with TNF-α and IL-1β, the negative effect of cytokine mix on the TEER was attenuated by ca. 79–86%. Such beneficial effects are also displayed when dietary fibers and/or HT are added to the ice cream recipe (I4.AF and I4.AF.H), and it persisted even if ice cream is stored at −20 °C for one month before the assay (attenuation between 75–84%).
The beneficial functional properties of fermented ice creams are likely attributable to the presence of bioactive peptides, which can be released during milk fermentation from caseins and serum proteins of milk. Bioactive peptides may exert multiple actions, including antioxidant, anti-inflammatory, and immunomodulatory roles [
54,
55,
56,
57]. Furthermore, fermentation can affect the activity of other functional components that normally occur in fermented milk, such as amino acids, uric acid, vitamins, enzymes (superoxide dismutase, catalase, glutathione peroxidase), fatty acids, and coenzyme Q
10. Finally, we cannot exclude a direct role of
L. casei F14, since it was detected at high cell densities during all processing and storage stages of fermented ice cream. Many strains of
L. casei were previously reported as valuable probiotics with anti-inflammatory activity [
58,
59].
The antiradical and anti-inflammatory properties of fermented ice creams proposed in the present study are of high importance not only because they were not reported before in ice cream products, but also as they were obtained without additives, simply through the fermentation of milk with the selected starter during the production process. The milk fermentation by L. casei F14 per se played a key role, whereas the addition of HT only contributed to further enhance the antiradical activity of ice cream, while no contribution was detected for anti-inflammatory activity, and no protective effect on Caco-2 cells was brought about by the addition of fibers.
In conclusion, the biotechnological protocol we proposed for manufacturing a new ice cream formulation resulted in promising antioxidant properties acquired through the fermentation of milk with a selected starter. The milk fermentation by
L. casei F14 conferred to the resulting ice cream the ability to counteract the accumulation of pro-inflammatory mediators (IL-8 and IL-6) and ROS, and to preserve the Caco-2 cell monolayer integrity. Since it was reported that the human antioxidant defense system benefits from the intake of foods allowing a concentration of antioxidant compounds in gastrointestinal environments [
50], it can reasonably be hypothesized that the fermented ice cream developed in this work could help to counteract the oxidative stress and inflammatory process at the intestinal level and to support the maintenance of barrier integrity also in vivo subjects [
38]. Of course, further studies focused on the gastrointestinal tract by using simulators and/or through in vivo trials should confirm the potential and clarify the individual compounds responsible for antioxidant and anti-inflammatory effects. However, the results of the present study provide solid evidence to support one more time the fermentation by selected starters as a tool to improve the functional values and to propose novel products to benefit the food industry and consumers.


 ,
, 


