
Monitoring β-Fructofuranosidase Activity through Kluyveromyces marxianus in Bioreactor Using a Lab-Made Sequential Analysis System
 ,
,  , , , , and
Abstract
:1. Introduction
2. Materials and Methods
2.1. Microorganism
2.2. Culture Media
2.3. Inoculums Conditions
2.4. Bioreactor Conditions
2.5. Biomass Determination
2.6. Reducing Sugars Determination
2.7. Off β-Fructofuranosidase Activity Determination at the Laboratory
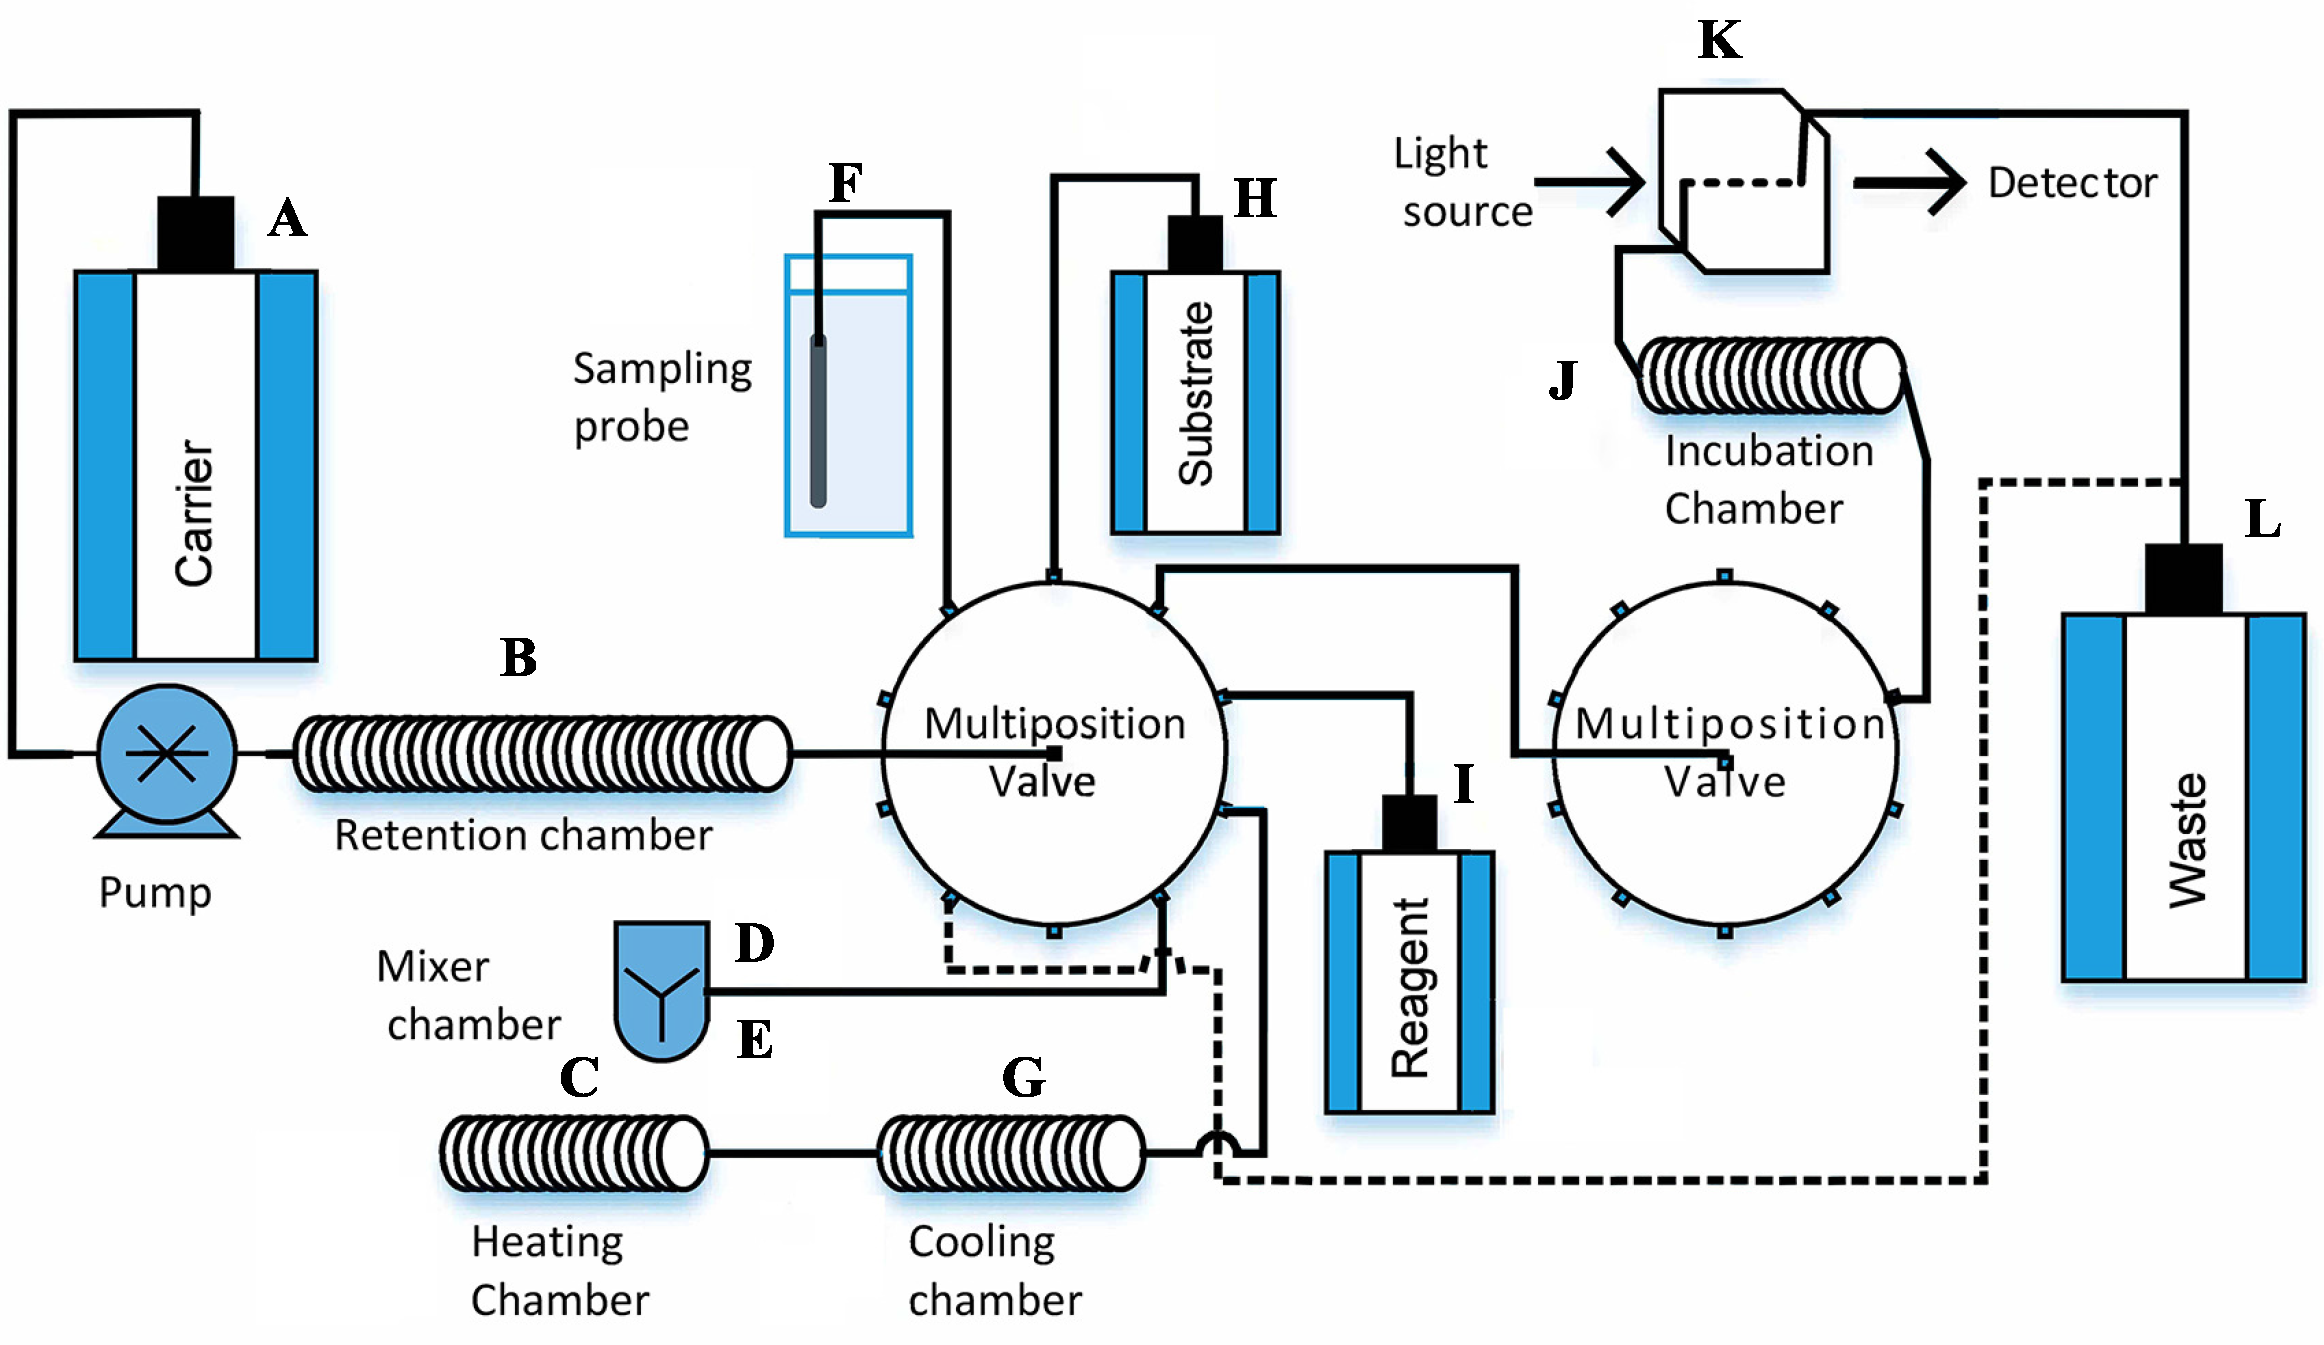
2.8. General Description of the Lab-Made SIA System
2.9. β-Fructofuranosidase Activity Set up in the Lab-Made SIA System
- Free cell samples supernatant (m) was taken out automatically from the bioreactor at selected times and pumped into the holding chamber of the SIA system.
- An automatic dilution with the carrier water (a) was performed depending on the time of the culture and it was homogenized in the mixing chamber.
- The diluted sample (ds) was mixed in equal parts with the substrate (s) by suction cycles ds/s/ds/s.
- The mixture was injected into the incubation chamber, where it was maintained at 50 ± 2 °C for 15 min.
- The incubated sample (mi) was sent to the retention chamber and mixed with the reagent DNS (r) in suction cycles mi/r/mi/r. Due to the corrosive nature of phenol, this compound was not used in the preparation of the DNS reagent.
- The mixture was injected into the heating chamber, where it was maintained at 93 ± 2 °C for 5 min.
- Afterwards, the mixture was injected into the cooling chamber submerged on ice where it was kept for 1 min.
- The mixture was automatically diluted in a 1:4 ratio with a carrier and homogenized in the mixing chamber.
- Finally, the sample was injected into the detector where it was read at 540 nm. To eliminate any trace of the previous sample, a cleaning cycle was carried out after each analysis. All these hardware sequences were controlled with an algorithm designed with the software LabVIEW™. One second of operation of injection/suction is equivalent to a flow rate of 20 µL/s, with a standard deviation of 6%.
2.10. Calculating β-Fructofuranosidase Activity
2.11. Validation and Statistical Comparison
3. Results
3.1. Lab-Made SIA Hardware Modifications to Determine -Fructofuranosidase
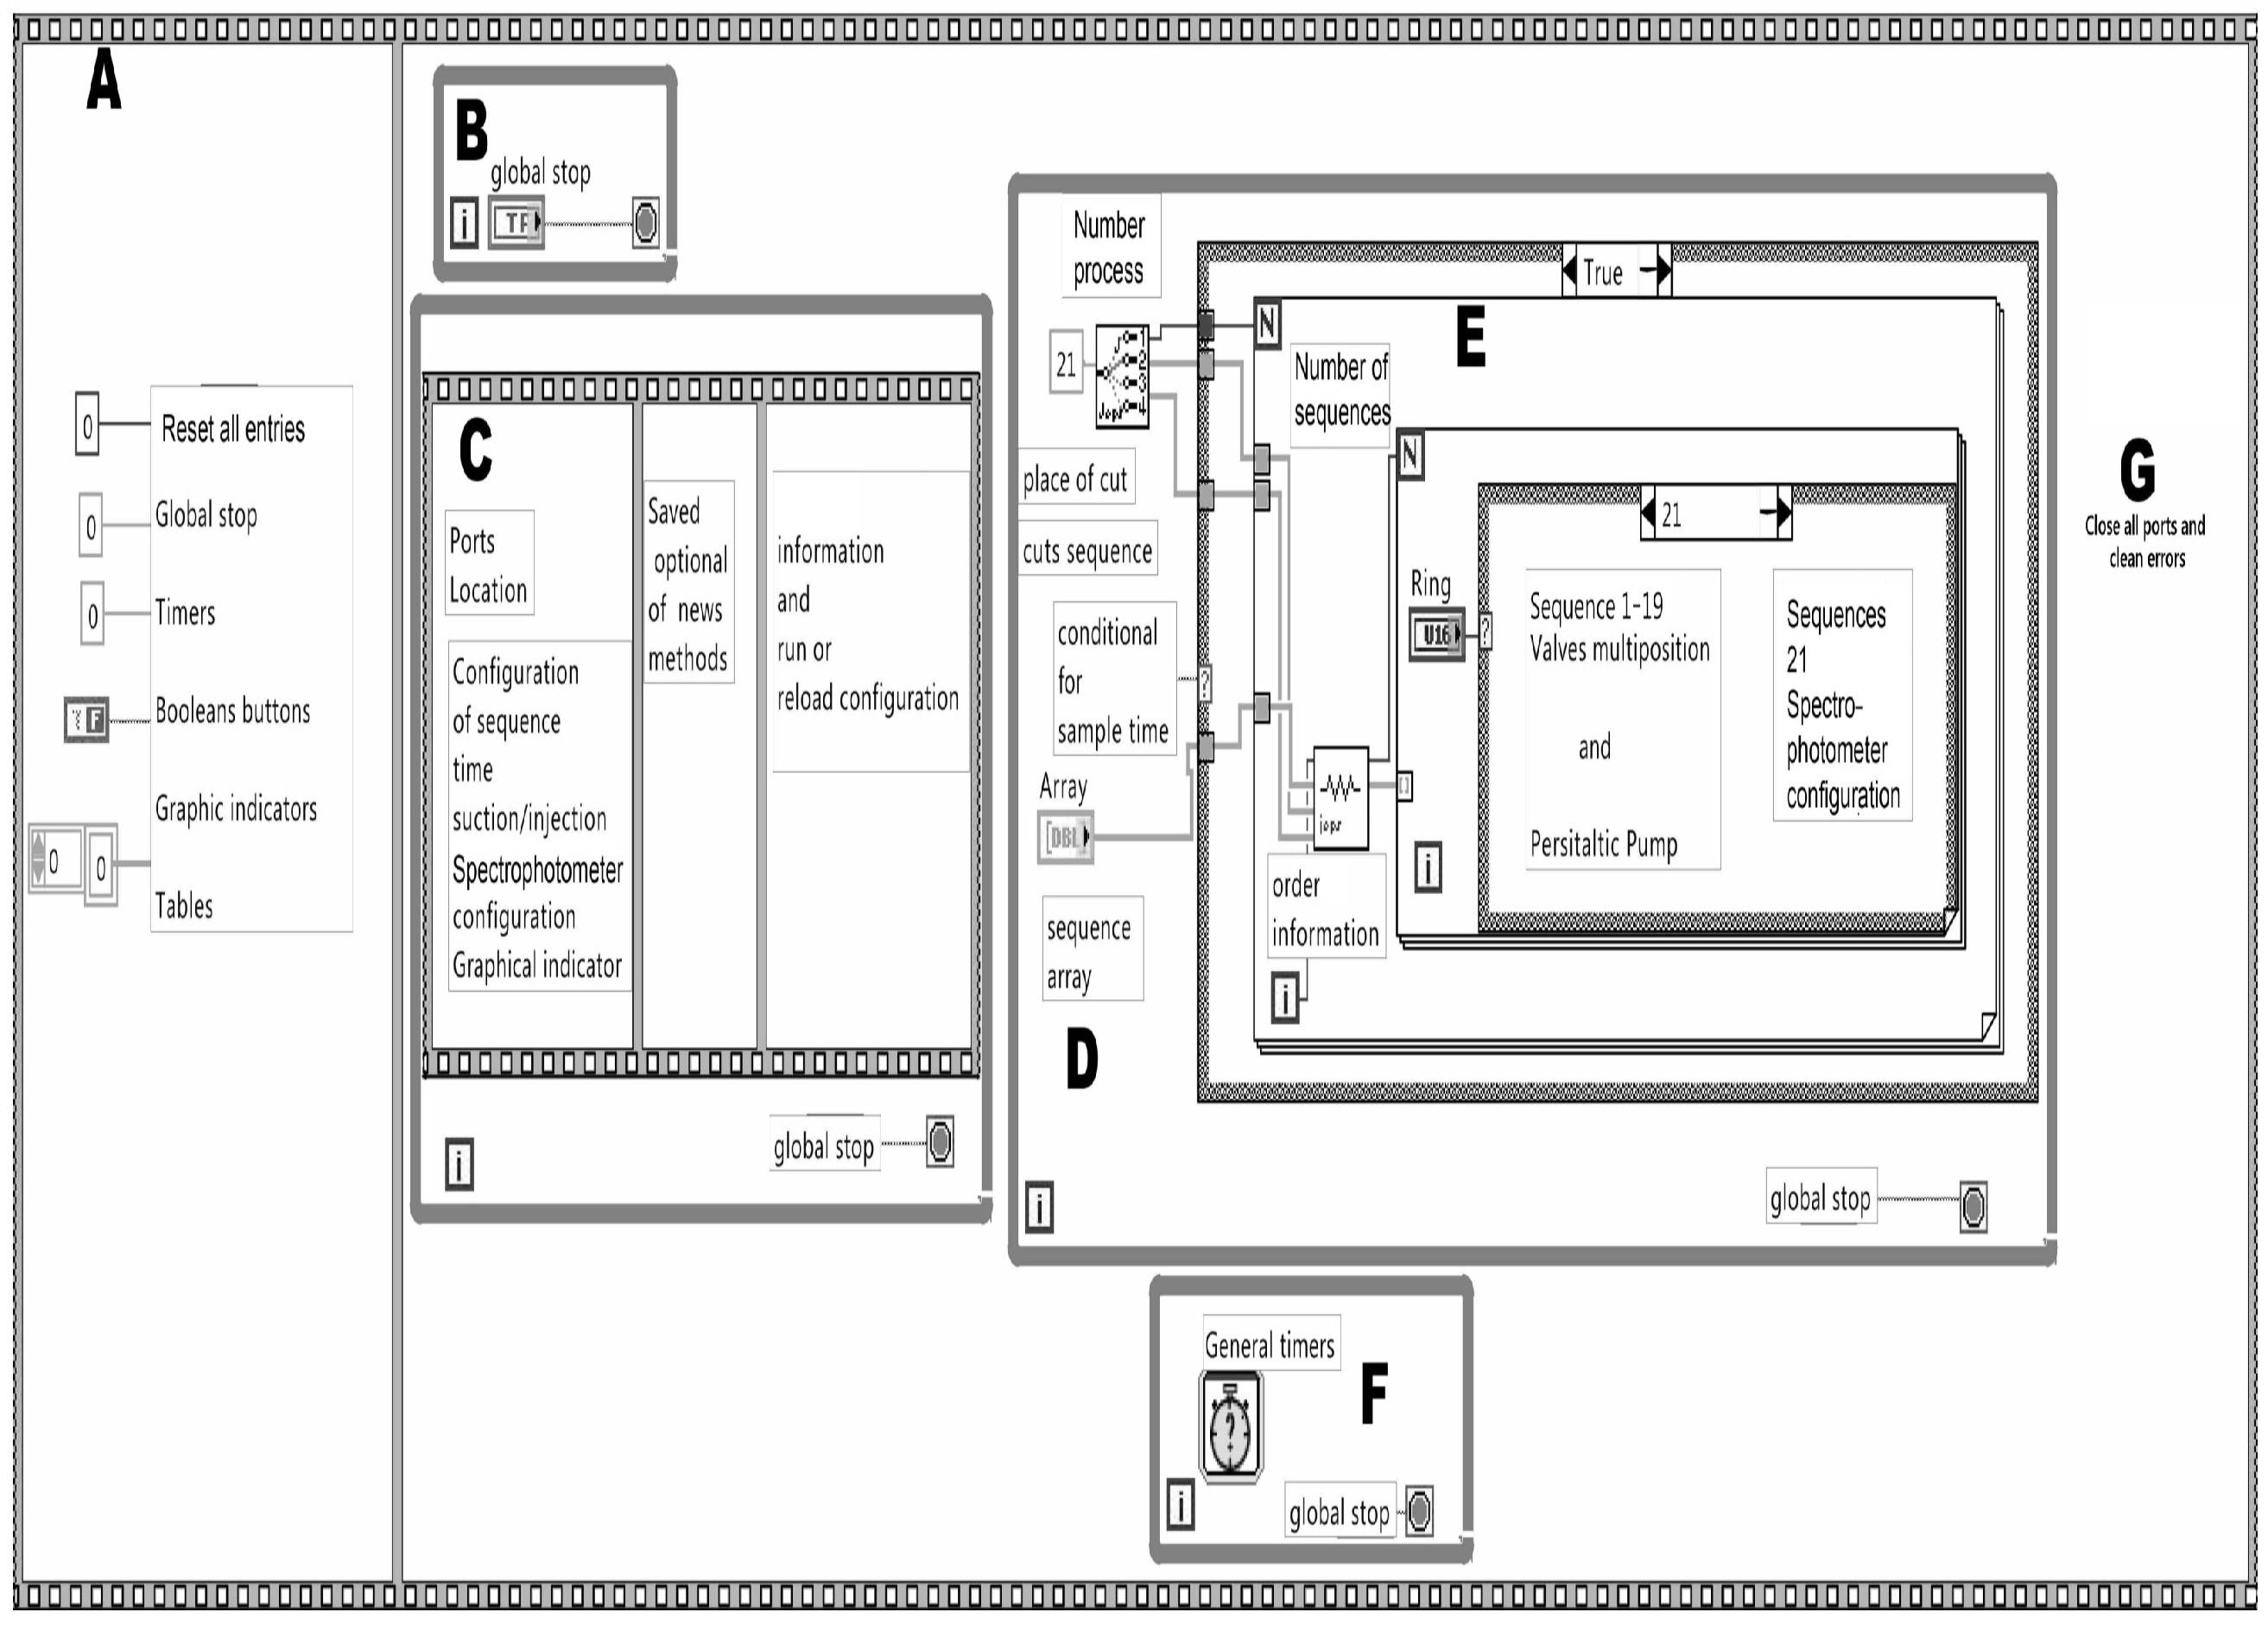
3.2. Virtual Code to Control the Lab-SIA System
3.3. Virtual Code to Control the Peristaltic Pump
3.4. Virtual Code to Control the Multiposition Valves
3.5. Spectrophotometer Control
3.6. General Virtual Code to Control the SIA System
3.7. Description of the User Interface That Controls the Lab-Made SIA System
3.8. β-Fructofuranosidase Activity Determination Using the Lab-Made SIA System
3.8.1. Calibration Curve
3.8.2. Sequence Followed in the SIA System to Determine -Fructofuranosidase Activity
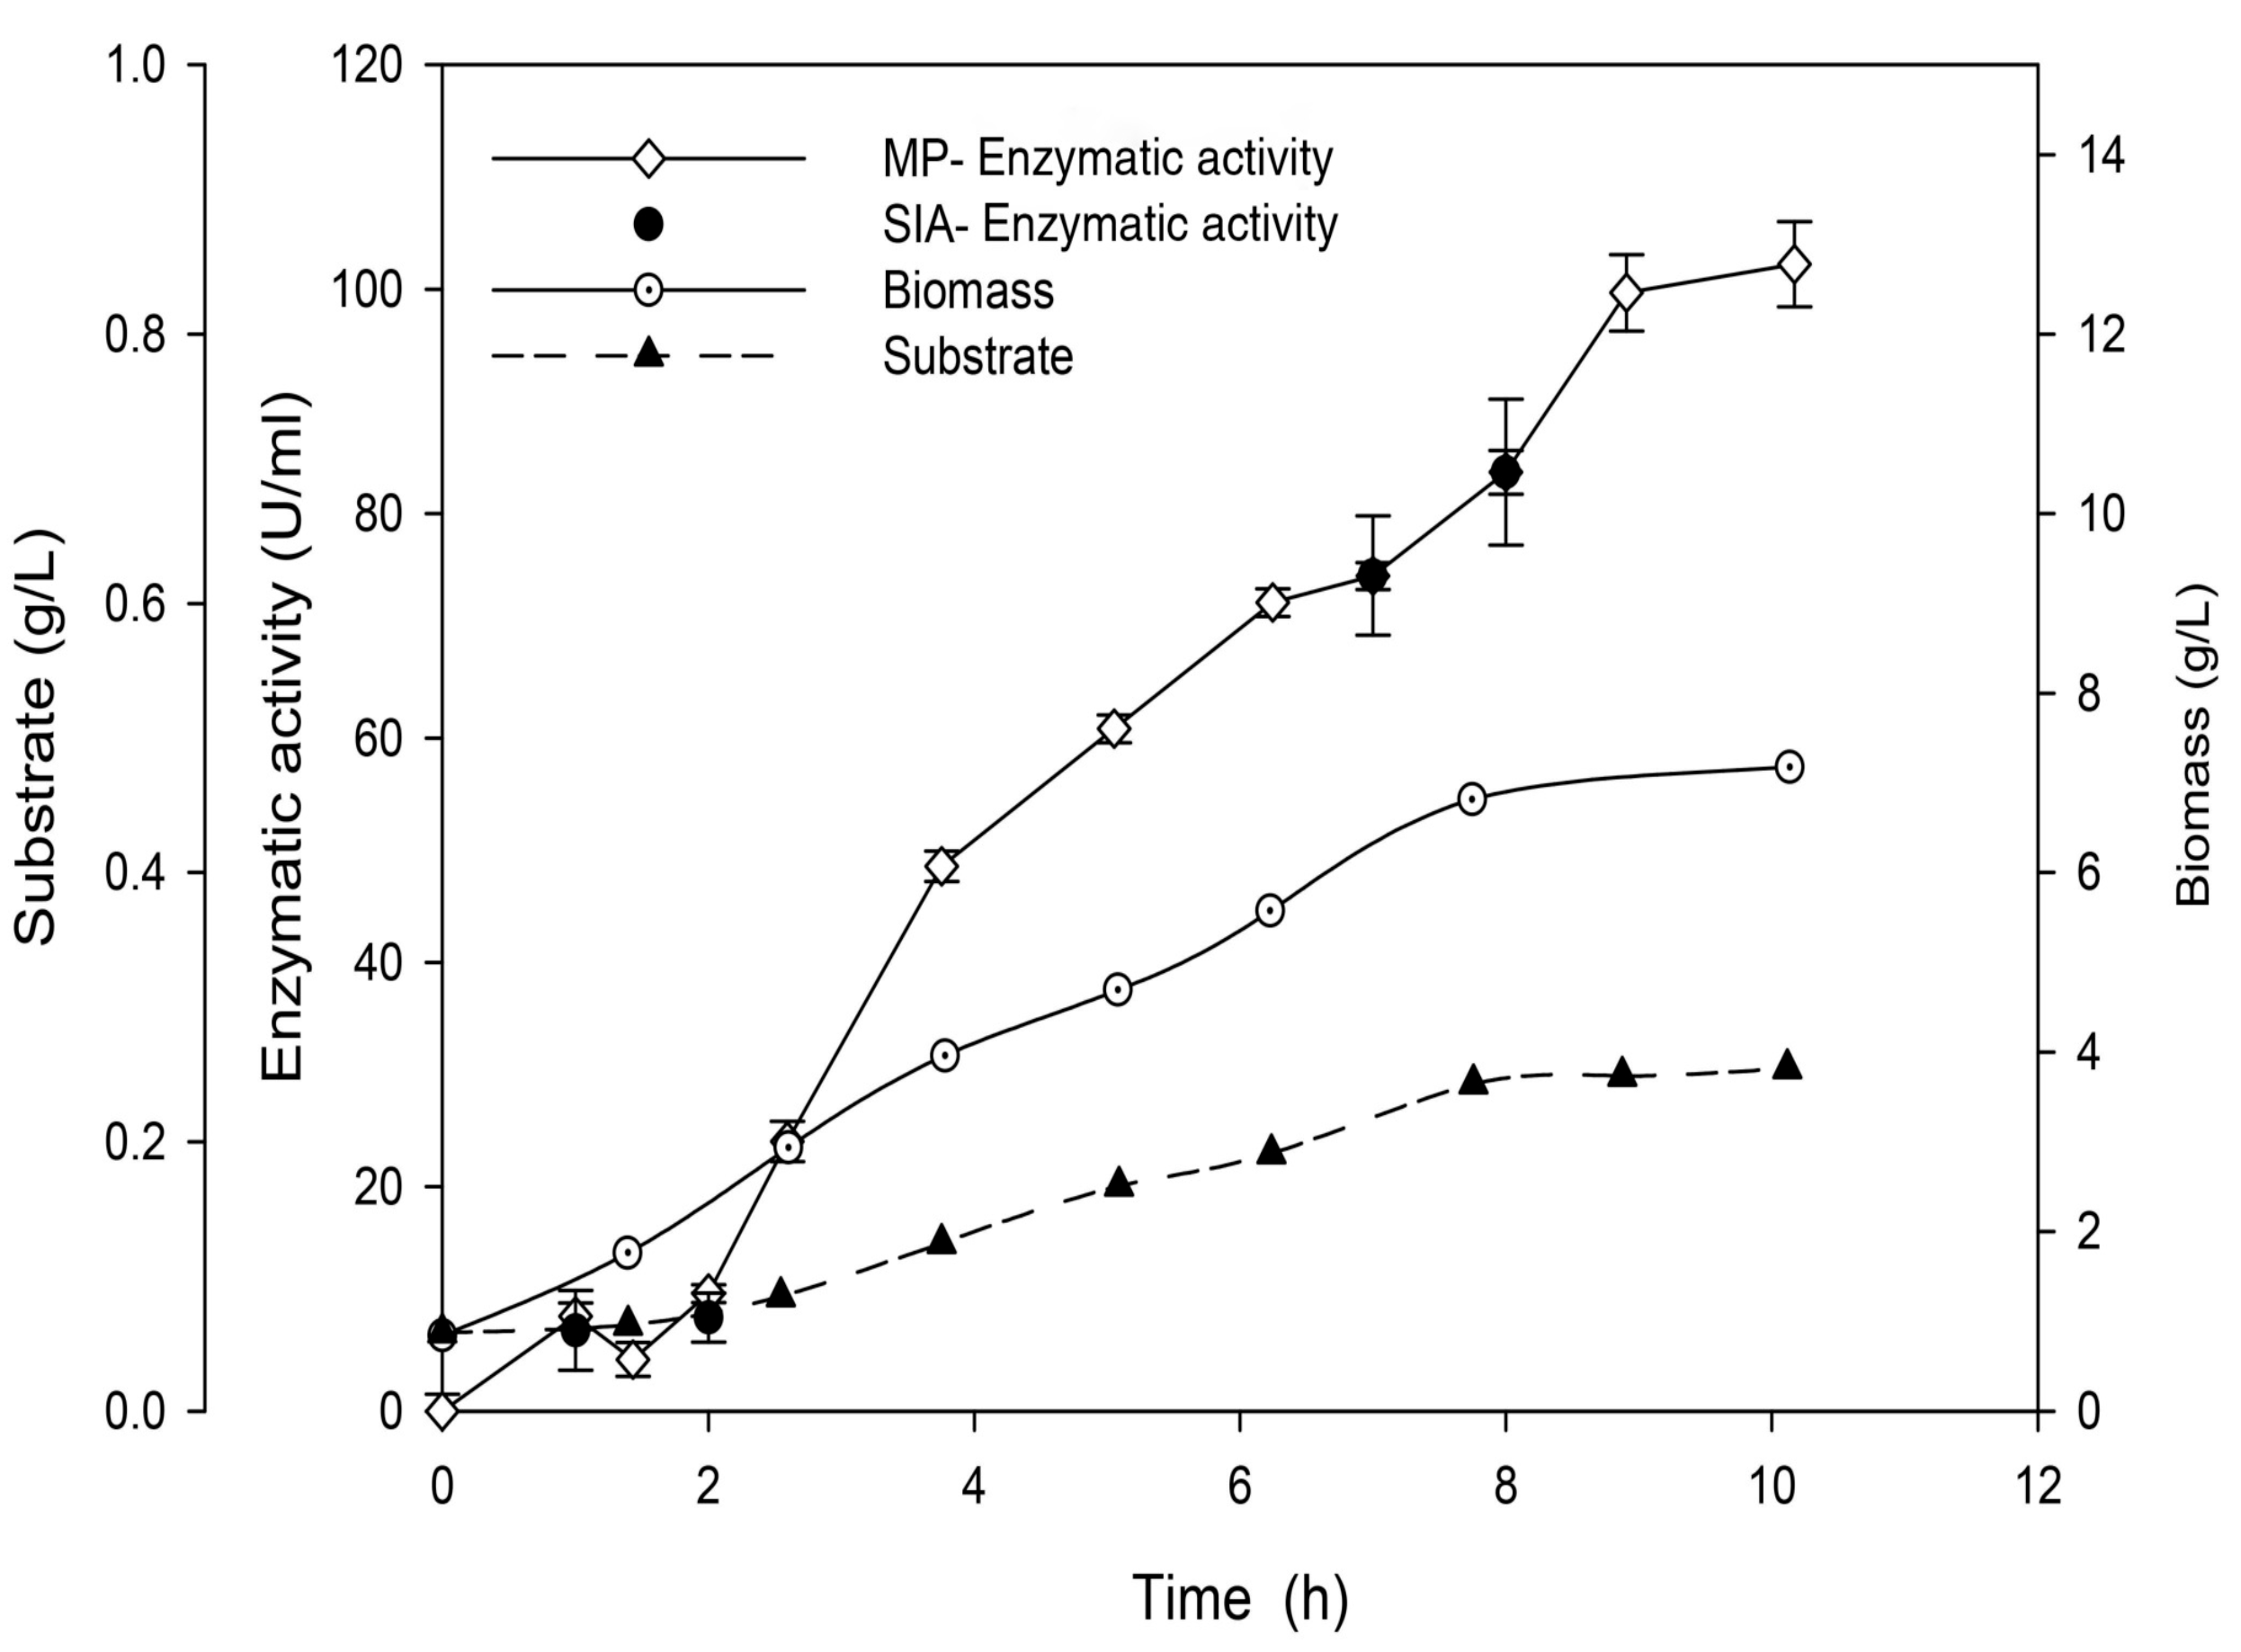
3.8.3. Automatic -Fructofuranosidase Activity Determination
4. Discussion
5. Conclusions
Author Contributions
Funding
Institutional Review Board Statement
Informed Consent Statement
Data Availability Statement
Acknowledgments
Conflicts of Interest
Abbreviations
| DNS | 3,5-dinitrosalicylic acid |
| FIA | flow injection analysis |
| FOS | fructooligosaccharides |
| Mp | microplate technique |
| SIA | sequential injection analysis |
References
- Fonseca, G.G.; Heinzle, E.; Wittmann, C.; Gombert, A.K. The yeast Kluyveromyces marxianus and its biotechnological potential. Appl. Microbiol. Biotechnol. 2009, 79, 339–354. [Google Scholar] [CrossRef] [PubMed]
- Lane, M.M.; Morrissey, J.P. Kluyveromyces marxianus: A yeast emerging from its sister’s shadow. Fungal Biol. Rev. 2010, 24, 17–26. [Google Scholar] [CrossRef]
- Rajkumar, A.S.; Morrissey, J.P. Rational engineering of Kluyveromyces marxianus to create a chassis for the production of aromatic products. Microb. Cell Factories. 2020, 19, 207. [Google Scholar] [CrossRef] [PubMed]
- Flores, J.A.; Gschaedler, A.; Amaya-Delgado, L.; Herrera-López, E.J.; Arellano, M.; Arrizon, J. Simultaneous saccharification and fermentation of Agave tequilana fructans by Kluyveromyces marxianus yeasts for bioethanol and tequila production. Bioresour. Technol. 2013, 146, 267–273. [Google Scholar] [CrossRef]
- Leonel, L.V.; Arruda, P.V.; Chandel, A.K.; Felipe, M.G.A.; Sene, L. Kluyveromyces marxianus: A potential biocatalyst of renewable chemicals and lignocellulosic ethanol production. Crit. Rev. Biotechnol. 2021, 41, 1131–1152. [Google Scholar] [CrossRef]
- Baptista, M.; Domingues, L. Kluyveromyces marxianus as a microbial cell factory for lignocellulosic biomass valorisation. Biotechnol. Adv. 2022, 60, 108027. [Google Scholar] [CrossRef]
- Varela, J.A.; Gethins, L.; Stanton, C.; Ross, P.; Morrissey, J.P. Applications of Kluyveromyces marxianus in Biotechnology. In Yeast Diversity in Human Welfare; Satyanarayana, T., Kunze, G., Eds.; Springer: Singapore, 2017; pp. 439–454. [Google Scholar] [CrossRef]
- Karim, A.; Gerliani, N.; Aïder, M. Kluyveromyces marxianus: An emerging yeast cell factory for applications in food and biotechnology. Int. J. Food Microbiol. 2020, 333, 108818. [Google Scholar] [CrossRef]
- Homayouni-Rad, A.; Azizi, A.; Oroojzadeh, P.; Pourjafar, H. Kluyveromyces marxianus as a probiotic yeast: A mini-review. Curr. Nutr. Food Sci. 2020, 16, 1163–1169. [Google Scholar] [CrossRef]
- Bilal, M.; Ji, L.; Xu, Y.; Xu, S.; Lin, Y.; Iqbal, H.; Cheng, H. Bioprospecting Kluyveromyces marxianus as a robust host for industrial biotechnology. Front. Bioeng. Biotechnol. 2022, 10, 851768. [Google Scholar] [CrossRef]
- Barranco-Florido, E.; Garcıa-Garibay, M.; Gómez-Ruiz, L.; Azaola, A. Immobilization system of Kluyveromyces marxianus cells in barium alginate for inulin hydrolysis. Process Biochem. 2001, 37, 513–519. [Google Scholar] [CrossRef]
- Singh, R.S.; Singh, T.; Hassan, M.; Kennedy, J.F. Updates on inulinases: Structural aspects and biotechnological applications. Int. J. Biol. Macromol. 2020, 164, 193–210. [Google Scholar] [CrossRef] [PubMed]
- García-Aguirre, M.; Sáenz-Álvaro, V.A.; Rodríguez-Soto, M.A.; Vicente-Magueyal, F.J.; Botello-Álvarez, E.; Jimenez-Islas, H.; Cárdenas-Manríquez, M.; Rico-Martínez, R.; Navarrete-Bolaños, J.L. Strategy for Biotechnological Process Design Applied to the Enzymatic Hydrolysis of Agave Fructo-oligosaccharides To Obtain Fructose-Rich Syrups. J. Agric. Food Chem. 2009, 57, 10205–10210. [Google Scholar] [CrossRef] [PubMed]
- Ricca, E.; Calabrò, V.; Cursio, S.; Iorio, G. The state of the art in the production of fructose from inulin enzymatic hydrolysis. Crit. Rev. Biotechnol. 2007, 27, 129–145. [Google Scholar] [CrossRef] [PubMed]
- Waleckx, E.; Mateos-Diaz, J.C.; Gschaedler, A.; Colonna-Ceccaldi, B.; Brin, N.; García-Quezada, G.; Villanueva-Rodríguez, S.; Monsan, P. Use of inulinases to improve fermentable carbohydrate recovery during tequila production. Food Chem. 2011, 124, 1533–1545. [Google Scholar] [CrossRef]
- FOS. Market Worth 3.52 Billion By 2024, 2019. Available online: https://markets.businessinsider.com/news/stocks/fructo-oligosaccharides-fos-market-size-worth-3-52-billion-by-2024-hexa-research-1027578303 (accessed on 1 October 2023).
- Miller, G.L. Use of Dinitrosalicylic Acid Reagent for Determination of Reducing Sugar. Anal. Chem. 1959, 31, 426–428. [Google Scholar] [CrossRef]
- Ruzicka, J.; Hansen, E.H. Flow injection analyses: Part I. A new concept of fast continuous flow analysis. Anal. Chim. Acta 1975, 78, 145–157. [Google Scholar] [CrossRef]
- Ruzicka, J.; Marshall, G.D. Sequential injection: A new concept for chemical sensors, process analysis and laboratory assays. Anal. Chim. Acta 1990, 237, 32–343. [Google Scholar] [CrossRef]
- Cántizares-Macías, P.; Hernández-Garciadiego, L.; Gómez-Ruíz, H. An Automated Flow Injection Analysis Procedure for the Determination of Reducing Sugars by DNSA Method. J. Food Sci. 2001, 66, 407–411. [Google Scholar] [CrossRef]
- Kumar, M.A.; Thakur, M.S.; Senthuran, A.; Senthuran, V.; Karanth, N.G.; Hatti-Kaul, R.; Mattiasson, B. An automated flow injection analysis system for on-line monitoring of glucose and L-lactate during lactic acid fermentation in a recycle bioreactor. World J. Microbiol. Biotechnol. 2001, 17, 23–29. [Google Scholar] [CrossRef]
- Ferreira, L.S.; Trierweiler, J.O.; De Souza, M.B., Jr.; Folly, R.O.M. A lactose fia-biosensor system for monitoring and process control. Braz. J. Chem. Eng. 2004, 21, 307–315. [Google Scholar] [CrossRef]
- Wongsa, C.; Udomsom, S.; Budwong, A.; Kiwfo, K.; Grudpan, K.; Paengnakorn, P. Sequential injection amperometric system coupling with bioreactor for in-line glucose monitoring in cell culture application. Molecules 2022, 27, 6665. [Google Scholar] [CrossRef] [PubMed]
- Ruzicka, J. Lab-on-valve: Universal microflow analyzer based on sequential and bead injection. Analyst 2000, 125, 1053–1060. [Google Scholar] [CrossRef]
- Araujo, A.R.T.S.; Gaspar, D.; Lúcio, M.; Reis, S.; Saraiva, M.L.M.F.S.; Lima, J.L.F.C. Sequential injection system for phospholipase A2 activity evaluation: Studies on liposomes using an environment-sensitive fluorescent probe. Talanta 2009, 79, 1125–1129. [Google Scholar] [CrossRef]
- Pinto, P.C.A.G.; Saraiva, M.L.M.F.S.; Lima, J.L.F.C. Sequential injection analysis as a tool for implementation of enzymatic assays in ionic liquids. Talanta 2008, 77, 479–483. [Google Scholar] [CrossRef]
- Vidigal, S.S.M.P.; Tóth, I.V.; Rangel, A.O.S.S. Sequential Injection Lab-on-Valve System for the Determination of the Activity of Peroxidase in Vegetables. J. Agric. Food. Chem. 2010, 58, 2071–2075. [Google Scholar] [CrossRef]
- Sandoval-Ventura, O.; Cañizares-Macías, M.P. Evaluation of the Enzymatic Activity of Glucose Oxidase Immobilized on Multiwalled Carbon Nanotubes and on Controlled Pore Glass by Sequential Injection Analysis. Anal. Lett. 2016, 49, 639–653. [Google Scholar] [CrossRef]
- Pliego, J.; Mateos, J.C.; Rodriguez, J.; Valero, F.; Baeza, M.; Femat, R.; Camacho, R.; Sandoval, G.; Herrera-López, E.J. Monitoring lipase/esterase activity by stopped flow in a sequential injection analysis system using p-nitrophenyl butyrate. Sensors 2015, 15, 2798–2811. [Google Scholar] [CrossRef]
- Silvestre, C.I.C.; Pinto, P.C.A.G.; Segundo, M.A.; Saraiva, M.L.M.F.S.; Lima, J.L.F.C. Enzyme based assays in a sequential injection format: A review. Anal. Chim. Acta 2011, 689, 160–177. [Google Scholar] [CrossRef]
- Kurbanoglu, S.; Unal, M.A.; Ozkan, S.A. Recent developments on electrochemical flow injection in pharmaceuticals and biologically important compounds. Electrochim. Acta 2018, 287, 135–148. [Google Scholar] [CrossRef]
- Schindler, R.; Le Thanh, H.; Lendl, B.; Kellner, R. Determination of enzyme kinetics and chemometric evaluation of reaction products by FTIR spectroscopy on the example of β-fructofuranosidase. Vib. Spectrosc. 1998, 16, 127–135. [Google Scholar] [CrossRef]
- Schindler, R.; Lendl, B. Simultaneous determination of enzyme activities by FTIR-spectroscopy in an one-step assay. Anal. Chim. Acta 1999, 391, 19–28. [Google Scholar] [CrossRef]
- Herrera, A.; Arrizon, J.; Barcena-Soto, M.; Soltero, J.; Mateos-Díaz, J.; Casillas, N. Amperometric Titration of Fructan Oligosaccharides of Agave Tequilana Webber, Blue Variety, in a Rotating Disk Electrode. ECS Trans. 2011, 36, 351–362. [Google Scholar] [CrossRef]
- Busch, M.; Höbel, W.; Polster, J. Software FIACRE: Bioprocess monitoring on the basis of flow injection analysis using simultaneously a urea optode and a glucose luminescence sensor. J. Biotechnol. 1993, 31, 327–343. [Google Scholar] [CrossRef] [PubMed]
- Cocovi-Solberg, D.J.; Miró, M. CocoSoft: Educational software for automation in the analytical chemistry laboratory. Anal. Bioanal. Chem. 2015, 407, 6227–6233. [Google Scholar] [CrossRef]
- Lenehan, C.E.; Barnett, N.W.; Lewis, S.W. Design of LabVIEW®-based software for the control of sequential injection analysis instrumentation for the determination of morphine. J. Autom. Methods Manag. Chem. 2002, 24, 99–103. [Google Scholar] [CrossRef]
- Sklenarova, H.; Svoboda, A.; Solich, P.; Polasek, M.; Karlícek, R. Simple laboratory-made automated sequential injection analysis (SIA) device. II. SIA operational software based on LabVIEW® programming language. Instrum. Sci. Technol. 2002, 30, 353–360. [Google Scholar] [CrossRef]
- Solich, P.; Svoboda, A.; Sklenárova, H.; Polasek, M.; Karlícek, R. Simple laboratory-made automated Sequential Injection Analysis (SIA) device. I. Design and testing of the hardware component. Instrum. Sci. Technol. 2002, 30, 13–20. [Google Scholar] [CrossRef]
- Wagner, C.; Armenta, S.; Lendl, B. Developing automated analytical methods for scientific environments using LabVIEW. Talanta 2010, 80, 1081–1087. [Google Scholar] [CrossRef]
- Hernández-Maya, F.M.; Cañizares-Macías, M.P. Evaluation of the activity of β-glucosidase immobilized on polydimethylsiloxane (PDMS) with a microfluidic flow injection analyzer with embedded optical fibers. Talanta 2018, 185, 53–60. [Google Scholar] [CrossRef]
- Míguez, N.; Gimeno-Pérez, M.; Fernández-Polo, D.; Cervantes, F.V.; Ballesteros, A.O.; Fernández-Lobato, M.; Ribeiro, M.H.; Plou, F.J. Immobilization of the β-fructofuranosidase from Xanthophyllomyces dendrorhous by Entrapment in Polyvinyl Alcohol and Its Application to Neo-Fructooligosaccharides Production. Catalysts 2018, 8, 201. [Google Scholar] [CrossRef]
- Moore, J.H. Artificial intelligence programming with LabVIEW: Genetic algorithms for instrumentation control and optimization. Comput. Methods Programs Biomed. 1995, 47, 73–79. [Google Scholar] [CrossRef]
- Instrument Driver Network. Ocean Optics 2000 4000, Certified LabVIEW Plug and Play (Project-Style) Instrument Driver; National Instruments: Austin, TX, USA, 2016. [Google Scholar]
- Zagatto, E.A.G.; Arruda, M.A.Z.; Jacintho, A.O.; Mattos, I.L. Compensation of the Schlieren effect in flow-injection analysis by using dual-wavelength spectrophotometry. Anal. Chim. Acta 1990, 234, 153–160. [Google Scholar] [CrossRef]
- Santharam, L.; Samuthirapandi, A.B.; Easwaran, S.N.; Mahadevan, S. Modeling of exo-inulinase biosynthesis by Kluyveromyces marxianus in fed-batch mode: Correlating production kinetics and metabolic heat fluxes. Appl. Biochem. Biotechnol. 2017, 101, 1877–1887. [Google Scholar] [CrossRef] [PubMed]
- Corona, R.; Morales-Burgos, A.M.; Pelayo Ortiz, C.; Arias, J.; García-Sandoval, J. Substrates’ and products’ inhibition in fructanase production by a new Kluyveromyces marxianus CF15 from Agave tequilana fructan in a batch reactor. Bioprocess Biosyst. Eng. 2019, 42, 1779–1791. [Google Scholar] [CrossRef] [PubMed]
- Dills, W.L., Jr. Protein fructosylation: Fructose and the Maillard reaction. Am. J. Clin. Nutr. 1993, 58, 779S–787S. [Google Scholar] [CrossRef] [PubMed]
- Negrulescu, A.; Patrulea, V.; Mincea, M.M.; Ionascu, C.; Vlad-Oros, B.A.; Ostafe, V. Adapting the reducing sugars method with dinitrosalicylic acid to microtiter plates and microwave heating. J. Braz. Chem. Soc. 2012, 23, 2176–2182. [Google Scholar] [CrossRef]
- Gusakov, A.V.; Kondratyeva, E.G.; Sinitsyn, A.P. Comparison of two methods for assaying reducing sugars in the determination of carbohydrase activities. Int. J. Anal Chem. 2011, 2011, 283658. [Google Scholar] [CrossRef]
- Shao, Y.; Lin, A.H.M. Improvement in the quantification of reducing sugars by miniaturizing the Somogyi-Nelson assay using a microtiter plate. Food Chem. 2018, 240, 898–903. [Google Scholar] [CrossRef]
- Wood, I.P.; Elliston, A.; Ryden, P.; Bancroft, I.; Roberts, I.N.; Waldron, K.W. Rapid quantification of reducing sugars in biomass hydrolysates: Improving the speed and precision of the dinitrosalicylic acid assay. Biomass Bioenergy 2012, 44, 117–121. [Google Scholar] [CrossRef]
- Başkan, K.S.; Tütem, E.; Akyüz, E.; Özen, S.; Apak, R. Spectrophotometric total reducing sugars assay based on cupric reduction. Talanta 2016, 147, 162–168. [Google Scholar] [CrossRef]
- Xu, H.; Leng, X.; Wang, M.; Zhang, G. Glucose Measurement in the Presence of Tea polyphenols. Food Anal. Methods 2012, 5, 1027–1032. [Google Scholar] [CrossRef]
- Urban, P.L.; Goodall, D.M.; Bruce, N.C. Enzymatic microreactors in chemical analysis and kinetic studies. Biotechnol. Adv. 2006, 24, 42–57. [Google Scholar] [CrossRef] [PubMed]
- Alhadeff, E.M.; Salgado, A.M.; Cos, O.; Pereira, N.; Belkis, V.; Valero, F. Enzymatic microreactors for the determination of ethanol by an automatic sequential injection analysis system. Appl. Biochem. Biotechnol. 2007, 137, 17–25. [Google Scholar] [CrossRef] [PubMed]
- Flores-Cosío, G.; Herrera-López, E.J.; Arellano-Plaza, M.; Gschaedler, A.; Sánchez, A.; Amaya-Delgado, L. Dielectric property measurements as a method to determine the physiological state of Kluyveromyces marxianus and Saccharomyces cerevisiae stressed with furan aldehydes. Appl. Microbiol. Biotechnol. 2019, 103, 1–10. [Google Scholar] [CrossRef] [PubMed]
- Flores-Cosío, G.; Herrera-López, E.J.; Arellano-Plaza, M.; Gschaedler-Mathis, A.; Kirchmayr, M.; Amaya-Delgado, L. Application of dielectric spectroscopy to unravel the physiological state of microorganisms: Current state, prospects and limits. Appl. Microbiol. Biotechnol. 2020, 104, 6101–6113. [Google Scholar] [CrossRef] [PubMed]


| Described Action | Sequence | Valve Port Position | Pump Operation | Time (s) |
|---|---|---|---|---|
| Sample | 0 | 2 | Suction | 4 |
| Dilution 1:10 | 1 | 7 | Injection | 40 |
| Air | 2 | 8 | Suction | 2 |
| To mixer chamber | 3 | 7 | Injection | 4 |
| Agitation | 4 | 22 | Stop | 30 |
| Dilution stage if this is required 1:10 | ||||
| To retention chamber | 5 | 7 | Suction | 5 |
| Supernatant | 6 | 1 | Suction | 1 |
| To retention chamber | 7 | 7 | Suction | 1 |
| Supernatant | 8 | 1 | Suction | 1 |
| Air | 9 | 8 | Suction | 2 |
| To incubation chamber | 10 | 10 | Injection | 35 |
| To retention chamber | 11 | 7 | Suction | 40 |
| Waste | 12 | 5 | Injection | 55 |
| Cleaning mixer system * | 13–16 | Cleaning process | 280 | |
| Washing chamber ** | 17 | 8 | Injection | 120 |
| To retention chamber ** | 18 | 8 | Suction | 65 |
| Waste ** | 19 | 5 | Injection | 70 |
| To retention chamber ** | 20 | 8 | Suction | 20 |
| Waste ** | 21 | 5 | Injection | 30 |
| Incubation 50 C | 22 | 10 | Stop | 200 |
| To retention chamber | 23 | 10 | Suction | 30 |
| Reagent DNS | 24 | 9 | Suction | 1 |
| To retention chamber | 25 | 10 | Suction | 1 |
| Reagent DNS | 26 | 9 | Suction | 1 |
| To retention chamber | 27 | 10 | Suction | 1 |
| Reagent DNS | 28 | 9 | Suction | 2 |
| To retention chamber | 29 | 10 | Suction | 3 |
| Described Action | Sequence | Valve Port Position | Pump Operation | Time (s) |
|---|---|---|---|---|
| To retention chamber | 5 | 7 | Suction | 8 |
| Air | 6 | 8 | Suction | 2 |
| To storage | 7 | 10 | Injection | 8 |
| To retention chamber | 8 | 7 | Suction | 40 |
| Waste | 9 | 5 | Injection | 55 |
| Cleaning mixer system | 10 | 7 | Injection | 180 |
| To retention chamber | 11 | 7 | Suction | 65 |
| Waste | 12 | 5 | Injection | 75 |
| To retention chamber | 13 | 10 | Suction | 8 |
| Air | 14 | 7 | Injection | 44 |
| Dilution 1:10 | 15 | 8 | Suction | 2 |
| To mixing chamber | 16 | 7 | Injection | 4 |
| Agitation | 17 | 22 | - | 30 |
| Waste | 18 | 10 | Injection | 60 |
| Described Action | Sequence | Valve Port Position | Pump Operation | Time (s) |
|---|---|---|---|---|
| Air | 0 | 3 | Suction | 1 |
| From bioreactor | 1 | 2 | Suction | 60 |
| Waste | 2 | 5 | Injection | 80 |
| Air | 3 | 3 | Suction | 1 |
| From bioreactor | 4 | 2 | Suction | 60 |
| Waste | 5 | 5 | Injection | 80 |
| Air | 6 | 3 | Suction | 1 |
| From bioreactor | 7 | 2 | Suction | 60 |
| Waste | 8 | 5 | Injection | 90 |
| Sample | Microplate Enzymatic Activity (U/mL) | Std Desv. | SIA Enzymatic Activity (U/mL) | Std Desv. | % Error SIA vs. Microplate |
|---|---|---|---|---|---|
| A1 | 8.45 | 1.20 | 7.20 | 3.56 | 14.79 |
| A2 | 10.47 | 0.80 | 8.34 | 2.18 | 20.39 |
| B1 | 74.45 | 1.21 | 74.50 | 5.33 | 0.07 |
| B2 | 83.70 | 1.95 | 83.70 | 6.50 | 0.00 |
Disclaimer/Publisher’s Note: The statements, opinions and data contained in all publications are solely those of the individual author(s) and contributor(s) and not of MDPI and/or the editor(s). MDPI and/or the editor(s) disclaim responsibility for any injury to people or property resulting from any ideas, methods, instructions or products referred to in the content. |
© 2023 by the authors. Licensee MDPI, Basel, Switzerland. This article is an open access article distributed under the terms and conditions of the Creative Commons Attribution (CC BY) license (https://creativecommons.org/licenses/by/4.0/).
Share and Cite
Barbosa-Hernández, E.J.; Pliego-Sandoval, J.E.; Gschaedler-Mathis, A.; Arrizon-Gaviño, J.; Arana-Sánchez, A.; Femat, R.; Herrera-López, E.J. Monitoring β-Fructofuranosidase Activity through Kluyveromyces marxianus in Bioreactor Using a Lab-Made Sequential Analysis System. Fermentation 2023, 9, 963. https://doi.org/10.3390/fermentation9110963
Barbosa-Hernández EJ, Pliego-Sandoval JE, Gschaedler-Mathis A, Arrizon-Gaviño J, Arana-Sánchez A, Femat R, Herrera-López EJ. Monitoring β-Fructofuranosidase Activity through Kluyveromyces marxianus in Bioreactor Using a Lab-Made Sequential Analysis System. Fermentation. 2023; 9(11):963. https://doi.org/10.3390/fermentation9110963
Chicago/Turabian StyleBarbosa-Hernández, Edwin J., Jorge E. Pliego-Sandoval, Anne Gschaedler-Mathis, Javier Arrizon-Gaviño, Alejandro Arana-Sánchez, Ricardo Femat, and Enrique J. Herrera-López. 2023. "Monitoring β-Fructofuranosidase Activity through Kluyveromyces marxianus in Bioreactor Using a Lab-Made Sequential Analysis System" Fermentation 9, no. 11: 963. https://doi.org/10.3390/fermentation9110963