Article

Non-Invasive Digital Technologies to Assess Wine Quality Traits and Provenance through the Bottle

by
Natalie Harris
1,
Claudia Gonzalez Viejo
1,*,
Christopher Barnes
2 and
Sigfredo Fuentes
1
1
Digital Agriculture, Food and Wine Sciences Group, School of Agriculture and Food, Faculty of Veterinary and Agricultural Sciences, University of Melbourne, Melbourne, VIC 3010, Australia
2
Agriculture and Food Systems, Faculty of Veterinary and Agricultural Sciences, University of Melbourne, Dookie, VIC 3647, Australia
*
Author to whom correspondence should be addressed.
Fermentation 2023, 9(1), 10; https://doi.org/10.3390/fermentation9010010
Submission received: 16 November 2022 / Revised: 9 December 2022 / Accepted: 20 December 2022 / Published: 23 December 2022

Abstract

:
Due to increased fraud rates through counterfeiting and adulteration of wines, it is important to develop novel non-invasive techniques to assess wine quality and provenance. Assessment of quality traits and provenance of wines is predominantly undertaken with complex chemical analysis and sensory evaluation, which tend to be costly and time-consuming. Therefore, this study aimed to develop a rapid and non-invasive method to assess wine vintages and quality traits using digital technologies. Samples from thirteen vintages from Dookie, Victoria, Australia (2000–2021) of Shiraz were analysed using near-infrared spectroscopy (NIR) through unopened bottles to assess the wine chemical fingerprinting. Three highly accurate machine learning (ML) models were developed using the NIR absorbance values as inputs to predict (i) wine vintage (Model 1; 97.2%), (ii) intensity of sensory descriptors (Model 2; R = 0.95), and (iii) peak area of volatile aromatic compounds (Model 3; R = 0.88). The proposed method will allow the assessment of provenance and quality traits of wines without the need to open the wine bottle, which may also be used to detect wine fraud and provenance. Furthermore, low-cost NIR devices are available in the market with required spectral range and sensitivity, which can be affordable for winemakers and retailers and can be used with the machine learning models proposed here.

1. Introduction

Wines are composed of complex chemical compounds that contribute to quality traits such as colour, clarity, body, taste, flavour, and aroma profiles. Quality traits and sensory characteristics of the wine depend on many factors, such as grape cultivars, climate, canopy and irrigation management, geological regions, soil types, winemaking practices, and the complex interactions between these [1,2]. Quality attributes of grapes related to optimal ripening and harvest conditions include sugar content, alcohol content, total anthocyanins, pH, and tannins [3,4]. Aroma is one of the most important sensory attributes of wine, with hundreds of volatile organic compounds that contribute to the chemical complexity of wines [5,6]. Phenolic compounds also determine the quality and contribute to wine colour, antioxidant properties, taste, acidity, flavour, and mouthfeel [7,8,9]. There are high complexities in the attempt to define wine quality. However, physical–chemometric techniques can objectively assess wine quality traits [10]. Sensory analysis using trained panels can also identify specific wine characteristics to define quality traits [11]. These techniques have also been implemented to assess the provenance and counterfeiting of wines or to detect mislabelling from wineries.
There has been an increase in the employment of emerging digital technologies to assess quality traits for food and beverages. These include near-infrared spectroscopy (NIR), electronic noses (e-nose), and computer vision algorithms (CV) that are integrated with machine learning as an artificial intelligence approach for data analysis [12]. These technologies have been utilised to assess: beer quality traits, including chemometrics, aroma, foam parameters, bubble attributes, colour, and common beer faults [13,14,15,16]; faults or off-aromas/flavours in wine [17]; smoke taint in wine and berries [18,19,20,21,22]; aroma and rancidity in olive oil [23]; and quality traits of sourdough bread [24].
Specifically, NIR can offer a complete chemical fingerprinting profile of wines depending on the spectral range and sensitivity of different instruments. For berries, NIR has been used to assess ripening parameters such as total soluble solids, pH, and total anthocyanins, with limited success for texture parameters [25,26,27]. Furthermore, NIR analysis has been conducted for wine quality traits such as alcohol content, sugar content, pH, volatile phenolic compounds [28,29,30], and sensory descriptors [31]; it has also been used for the detection of smoke-related compounds [19] and the detection of adulteration with water and sugar [32]. Recent advances in chemometric analysis integrated with machine learning algorithms have identified key attributes for classifying wine based on varietals and geographic origins [33,34,35].
However, most of this research is based on wine samples extracted by direct measurement of the final products before bottling or after opening wine bottles, along with principal component analysis (PCA) for statistical analysis or modelling using partial least squares (PLS). Therefore, this research presents the implementation of NIR spectroscopy measured through the bottles of unopened wines in parallel with ML techniques to assess wine quality traits, and provenance, as a potential method to evaluate counterfeiting and mislabelling.

2. Materials and Methods

2.1. Sites and Sample Description

For this study, thirteen different vintages of Shiraz (Table 1) from 2000–2021 produced at Dookie College Winery from The University of Melbourne, Victoria, Australia (36°38′ S, 145°71′ E) were used. This vineyard region had a mean annual rainfall of 496 mm with monthly extremes within 1.4–119 mm and an average daily solar exposure of 17 MJ/m2 with extremes within 6–31 MJ/m2 according to weather reported from 2000 to 2021 and obtained from the Dookie Agricultural College station 081013 and the Bureau of Meteorology.
All wines underwent the same production techniques as they were produced in the same winery; the only difference was the vintage. The wine bottles were all the standard for red wine, with standard 750 mL size, Bordeaux shape, and amber colour. The only variation in the bottle within vintages was the closure type (Table 1).

2.2. Near-Infrared Spectroscopy

A hand-held near-infrared (NIR) spectroscopy device (MicroPHAZIR™RX Analyzer; Thermo Fisher Scientific, Waltham, MA, USA) was utilised to measure the samples through the bottle from three different positions (i) top, (ii) middle, and (iii) bottom, and from three sides of the bottle (three readings per position/location, n = 27). A custom-made attachment for the NIR was used to ensure no variations in light and environment. The device was calibrated using a white standard at the beginning and every 10 measurements (Figure 1). The chemical fingerprinting was obtained within 1596–2396 nm (every 7–9 nm). NIR absorbance measurements of the glass were subtracted to obtain values for the wine.

2.3. Gas Chromatography–Mass Spectroscopy

A 5 mL sample for each wine vintage in triplicate was transferred to a 20 mL vial with a magnetic screw cap. As described by Gonzalez Viejo et al. [14,15], samples were analysed with a gas chromatograph with a mass-selective detector 5977B (GC–MSD; Agilent Technologies, Inc., Santa Clara, CA, USA) linked with an autosampler system PAL3 (CTC Analytics AG, Zwingen, Switzerland). An HP-5MS column (Agilent Technologies, Inc., Santa Clara, CA, USA; length: 30 m, inner diameter: 0.25 mm, and film: 0.25 μ) was used, and the carrier gas was helium at 1 mL min−1 flow rate. The headspace method was used with a solid phase microextraction (SPME). A blank sample was used at the start to ensure no carryover from previous measurements. The samples were analysed with the National Institute of Standards and Technology (NIST; National Institute of Standards and Technology, Gaithersburg, MD, USA) library and identified the volatile compounds with greater than 80% certainty.

2.4. Descriptive Sensory Evaluation

A sensory panel with 12 participants from The University of Melbourne (UoM; Ethics ID: 1953926.4) completed training using a combined method from the International Standard methodology (ISO 8586-1: 1993E) and quantitative descriptive analysis (QDA®) method as outlined by Gonzalez Viejo et al. [16] with relevant red wine samples and references. Once trained, a blind sensory session was conducted in the sensory laboratory in a focus group-type room located in the Faculty of Veterinary and Agricultural Sciences (FVAS) of the UoM. Samples (30 mL) were served at 20 °C in clear plastic cups, following COVID-19 safety measures, and labelled with 3-digit random codes; panellists were provided with palate cleanser options of water and plain water crackers. The sensory descriptors (Table 2) evaluated by the participants in the questionnaire were displayed in the BioSensory Application (App; The University of Melbourne, Parkville, VIC, Australia; [36]) that consisted of rating the intensity of sensory attributes in a 15 cm non-structured scale.

2.5. Statistical Analysis and Machine Learning Modelling

The data were analysed with ANOVA for statistically significant differences between wine samples using Fisher’s least significant difference (LSD) post hoc test (α = 0.05) using XLSTAT 2020.3.1 (Addinsoft, New York, NY, USA). Multivariate data analysis based on principle component analysis (PCA) was developed in Matlab R2021a® based on covariance to find relationships between variable and their associations with the samples.
Three ML models were developed using artificial neural networks (ANN) with a code developed in Matlab® 2021a [37], automatically testing 17 training algorithms to find the most accurate models with no under- or overfitting. Model 1 was developed for classification using the absorbance values of NIR data through the bottle (1596–2396 nm) as inputs to predict wine vintage (Figure 2a). Model 1 was constructed using the Bayesian Regularization algorithm. Data were divided using the interleaved method, with 70% used for training and 30% for testing. Performance was analysed using means squared error (MSE). Model 2 was developed using regression ANN with absorbance values of NIR data through the bottle (1596–2396 nm) to predict 20 sensory descriptors (Figure 2b). This model was constructed using the Levenberg–Marquardt algorithm. Data were randomly divided for training (70%), validation (15%), and testing (15%) using a performance algorithm based on MSE. On the other hand, Model 3 was also developed using regression ANN with absorbance values of NIR data through the bottle (1596–2396 nm) to predict the peak area of 17 volatile aroma compounds (Figure 2c). Similar to Model 1, the Bayesian Regularization algorithm was used to construct the model with a random data division using 70% of samples for training and 30% for testing. A neuron trimming test (3, 5, 7, and 10 neurons) was conducted for the three models to assess the optimal number of neurons with no under- or overfitting. The optimal values for the neurons in each model are shown in Figure 2.

3. Results and Discussion

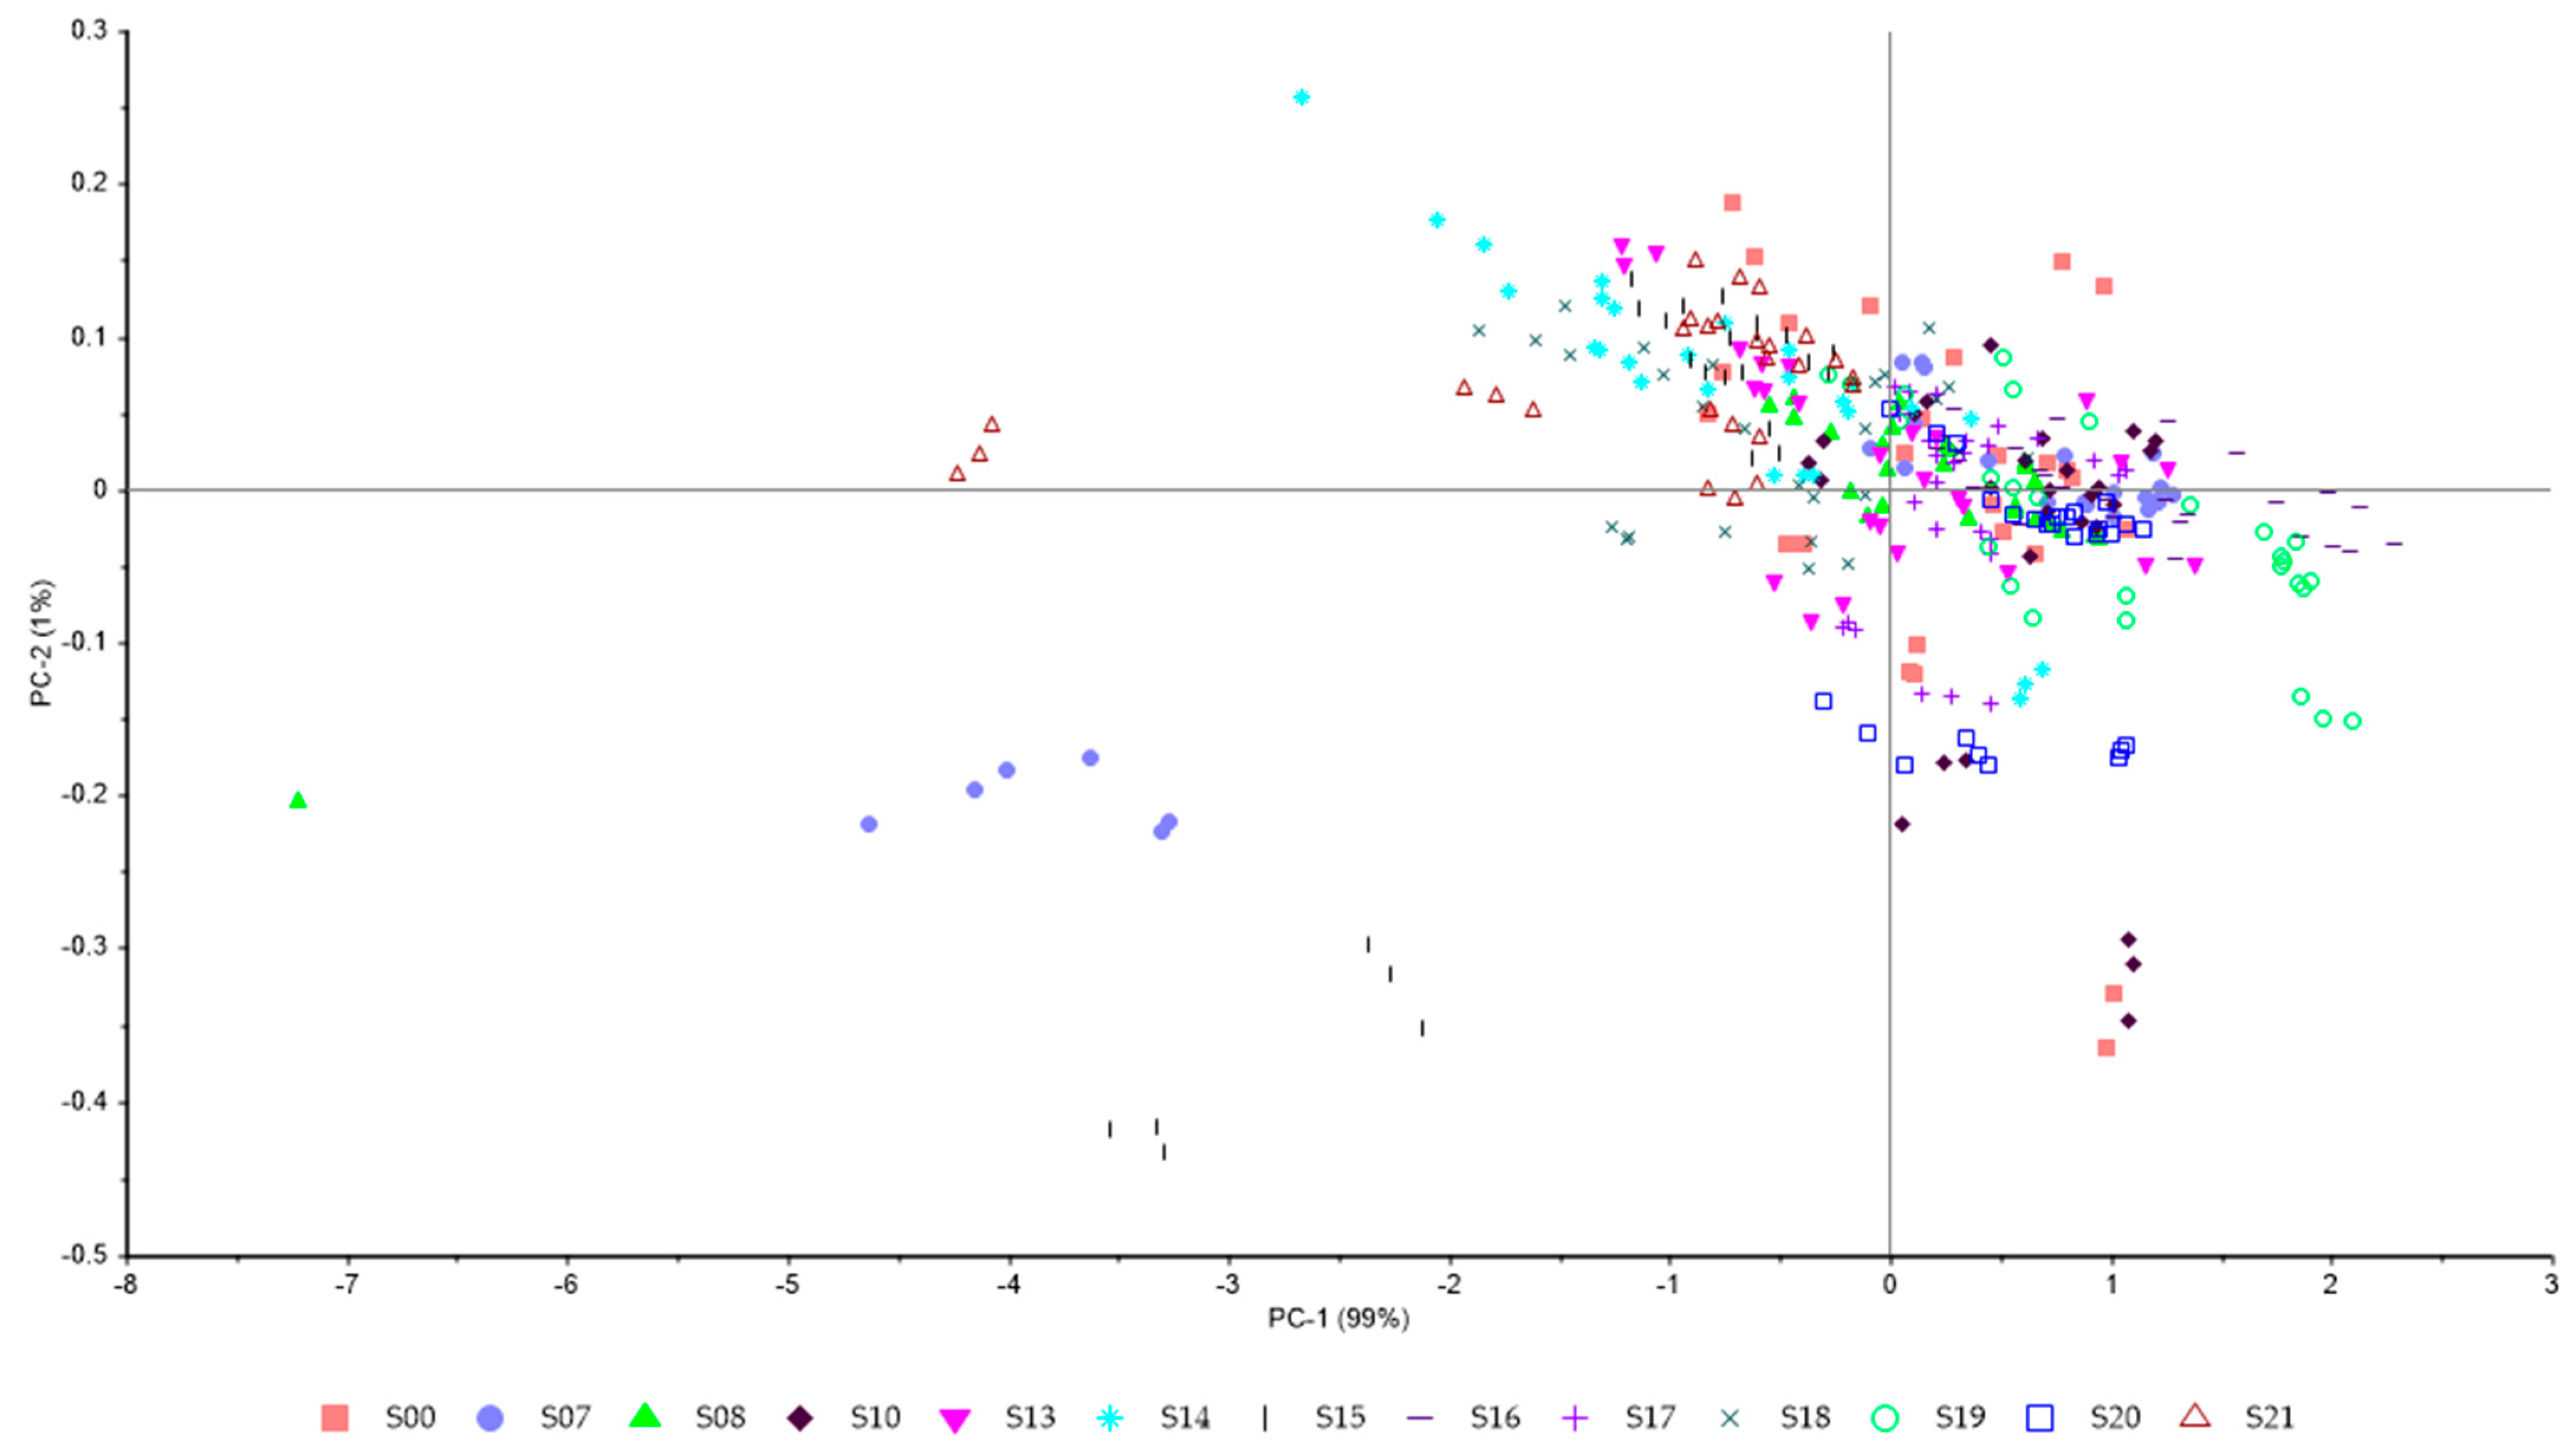
3.1. Near-Infrared Spectroscopy

Figure 3 shows the PCA with the NIR absorbance values (1596–2396 nm) through the bottle for all vintages. The PCA accounted for 100% of the total data variability, with principal component one (PC1) representing 99% and principal component two (PC2) accounting for 1%. It can be observed that some samples from vintages S07, S14, S15, and S19 grouped visibly; however, most cannot be properly differentiated using PCA constructed from the NIR. The lack of discrimination of samples using PCA may be because it only assesses the linear relationships between variables and samples [38]. These results may also be reflected in modelling strategies such as PLS, not only to classify different vintages but also intrinsic chemometry from different wines, which has shown lower accuracies in modelling different wine compositions [39,40].

3.2. Gas Chromatography–Mass Spectroscopy

There were 17 volatile aromatic compounds (VAC) associated with the wine samples identified by GC–MS (Table 3; Table S1). Most of the compounds were associated with aromas such as fruity, floral, and liquor [41]. VAC14 Butanedioic acid (aroma cooked apple) had the highest peak area for vintages 2000, 2008, 2010, 2013, 2014, 2015, and 2018; VAC15 Octanoic acid (aroma fruity, winey, waxy, apricot, banana, and brandy) for vintages 2007, 2016, 2017, 2019, and 2021; and VAC10 Benzenemethanol (aroma fresh, sweet, and gardenia) for vintage 2020. Butanedioic acid was reported in Syrah [42] and Saperavi red wine [43], Octanoic acid in Syrah from Brazil [44] and Australian Shiraz [45,46], and Benzenemethanol in Cabernet Sauvignon [21].

3.3. Descriptive Sensory Evaluation

Figure 4 shows the ANOVA results for the sensory descriptors. There were significant differences (p < 0.05) in all descriptors, except for aroma smoke and pepper, warming, tingling, and perceived quality. Vintage 2014 had the highest intensity for descriptors of clarity (12.72), aroma blackcurrant (9.73), and aroma prune (10.88); for vintage 2021, these were aroma blackberry (8.94), aroma butter (8.14), and aroma redcurrant (10.05). The lowest intensities for cedar (3.10), blackberry (3.60), redcurrant (4.75), and blackcurrant (5.38) aromas were for vintage 2020. Vintage 2017 had the highest perceived quality (9.41), with lower intensities for sour/acidic (4.88) and astringency (4.60), while vintage 2010 was lowest for perceived quality (5.23), with lower intensities for sour/acidic (4.82) and astringency (4.93). The typical descriptors for Shiraz, as described in other studies, include dark fruit, red fruit, prune, pepper, cedar, woody, and smoke [45,46,48].

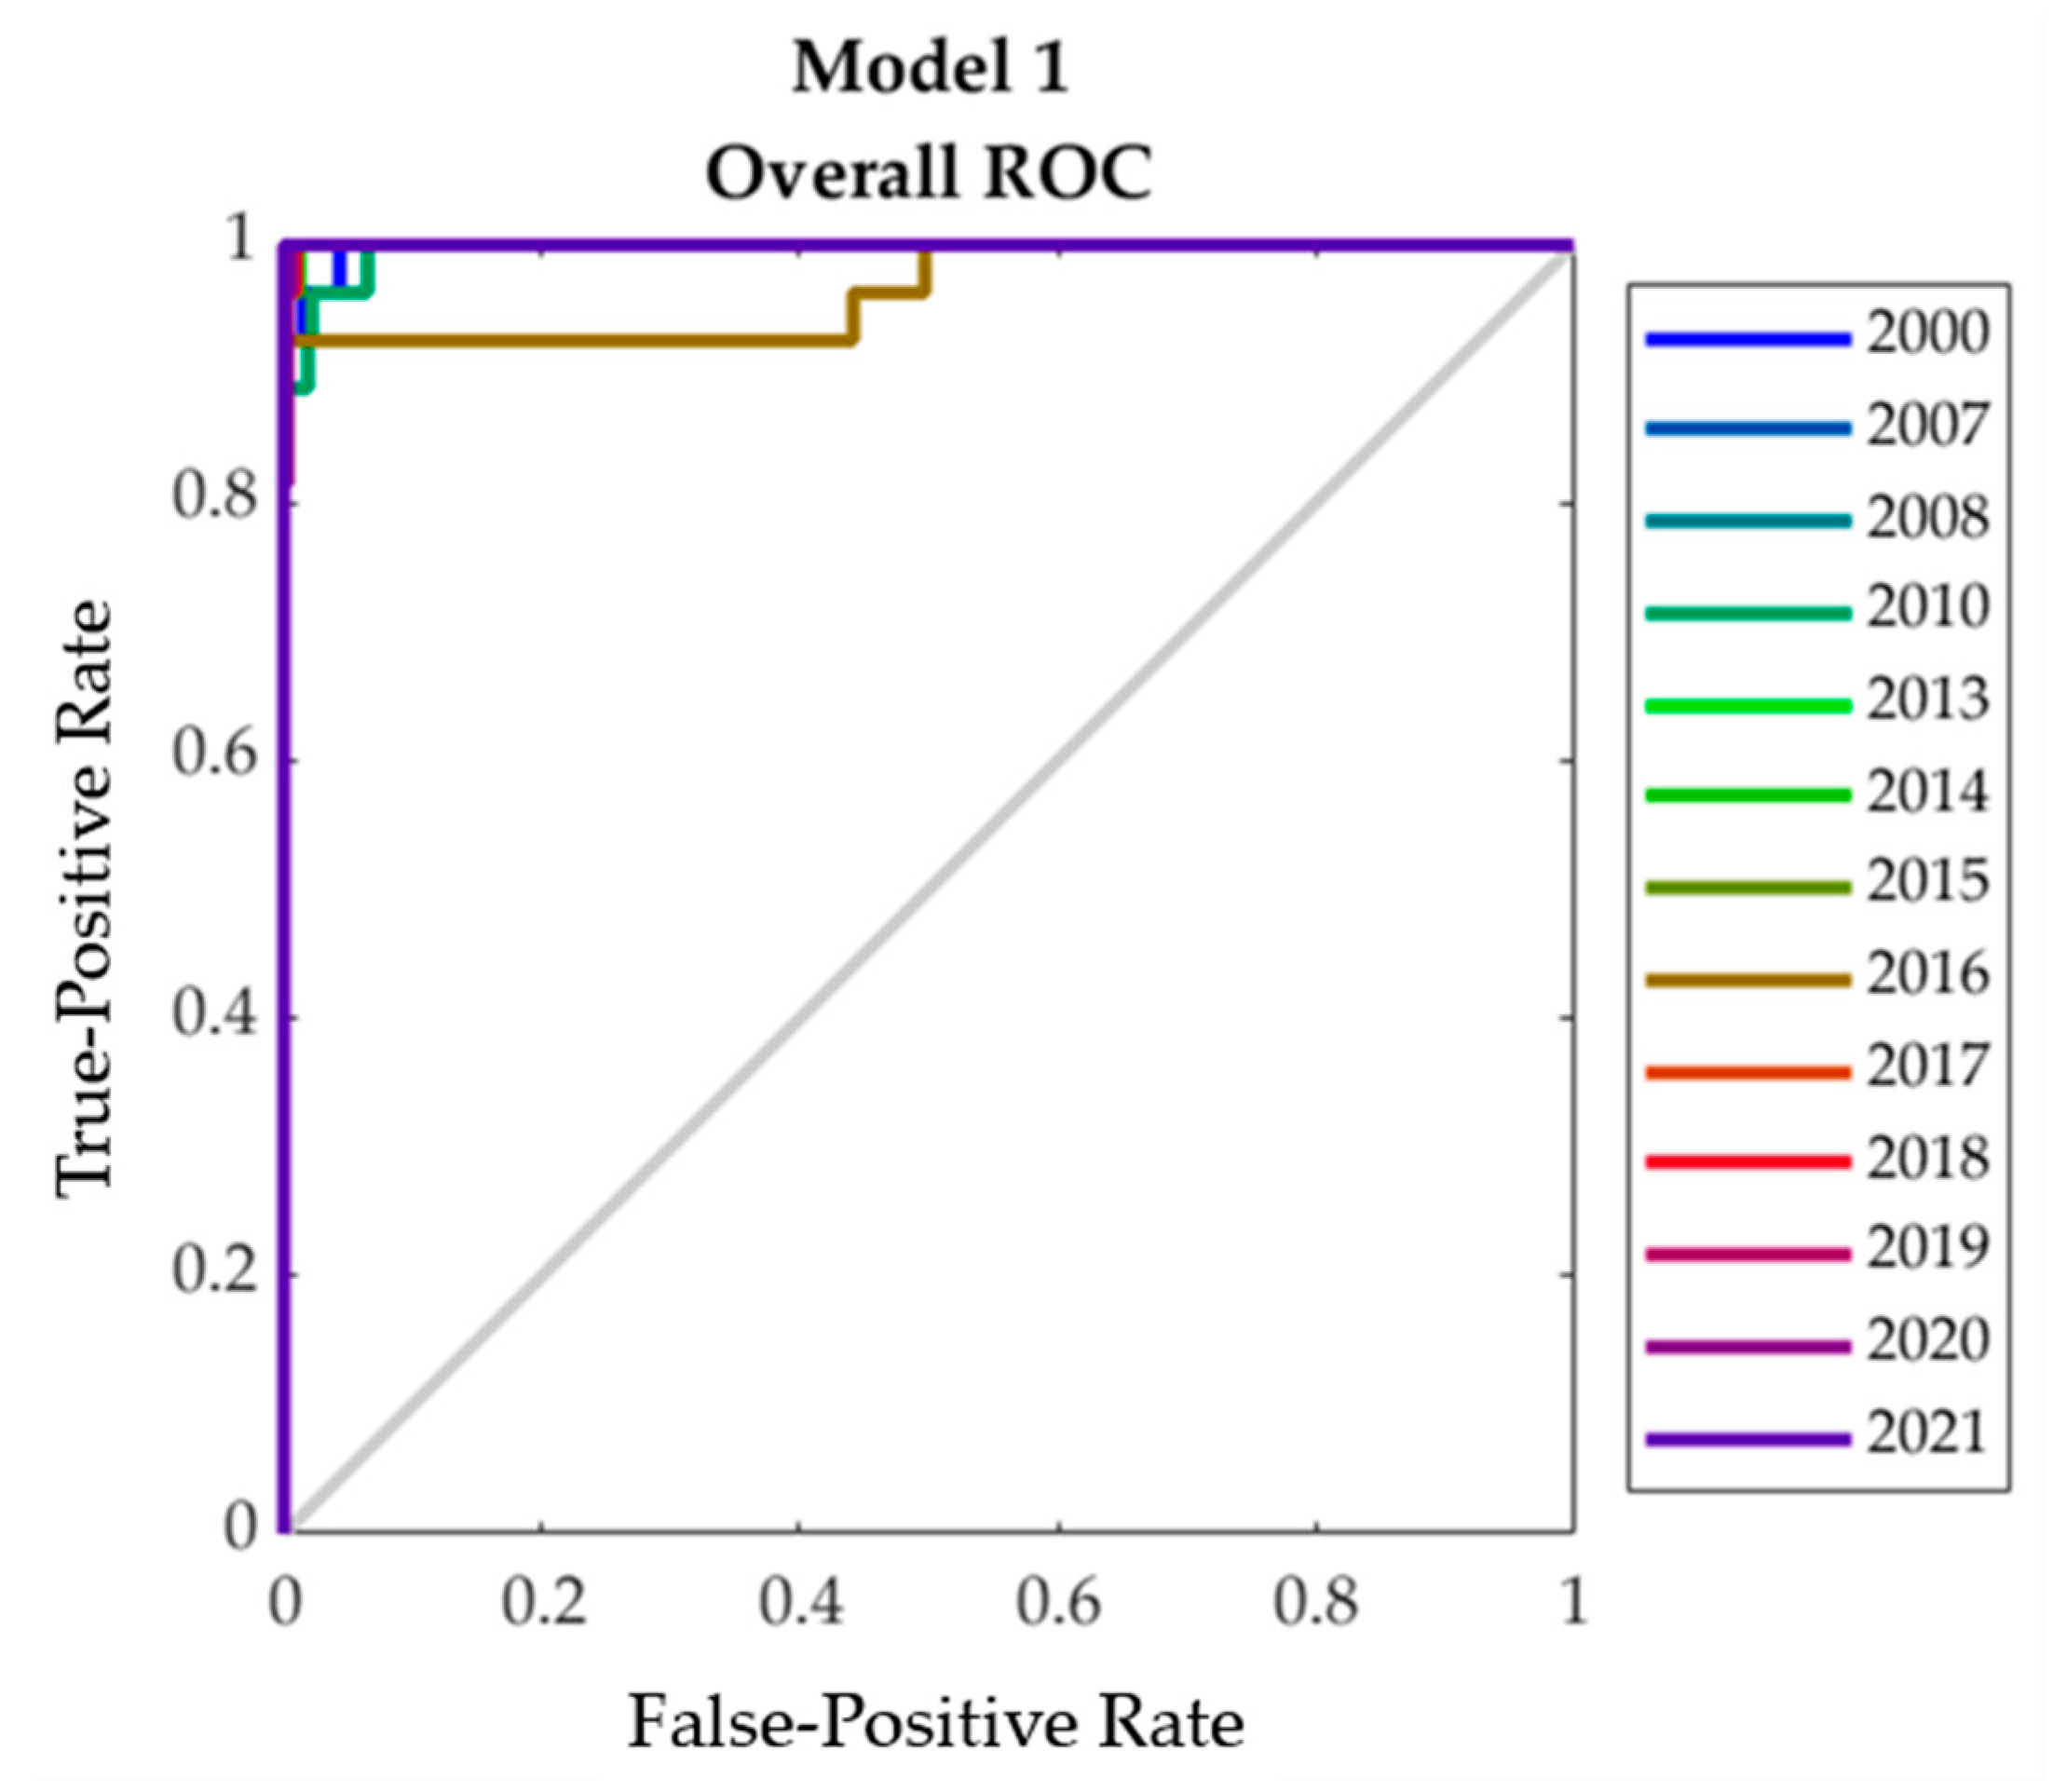
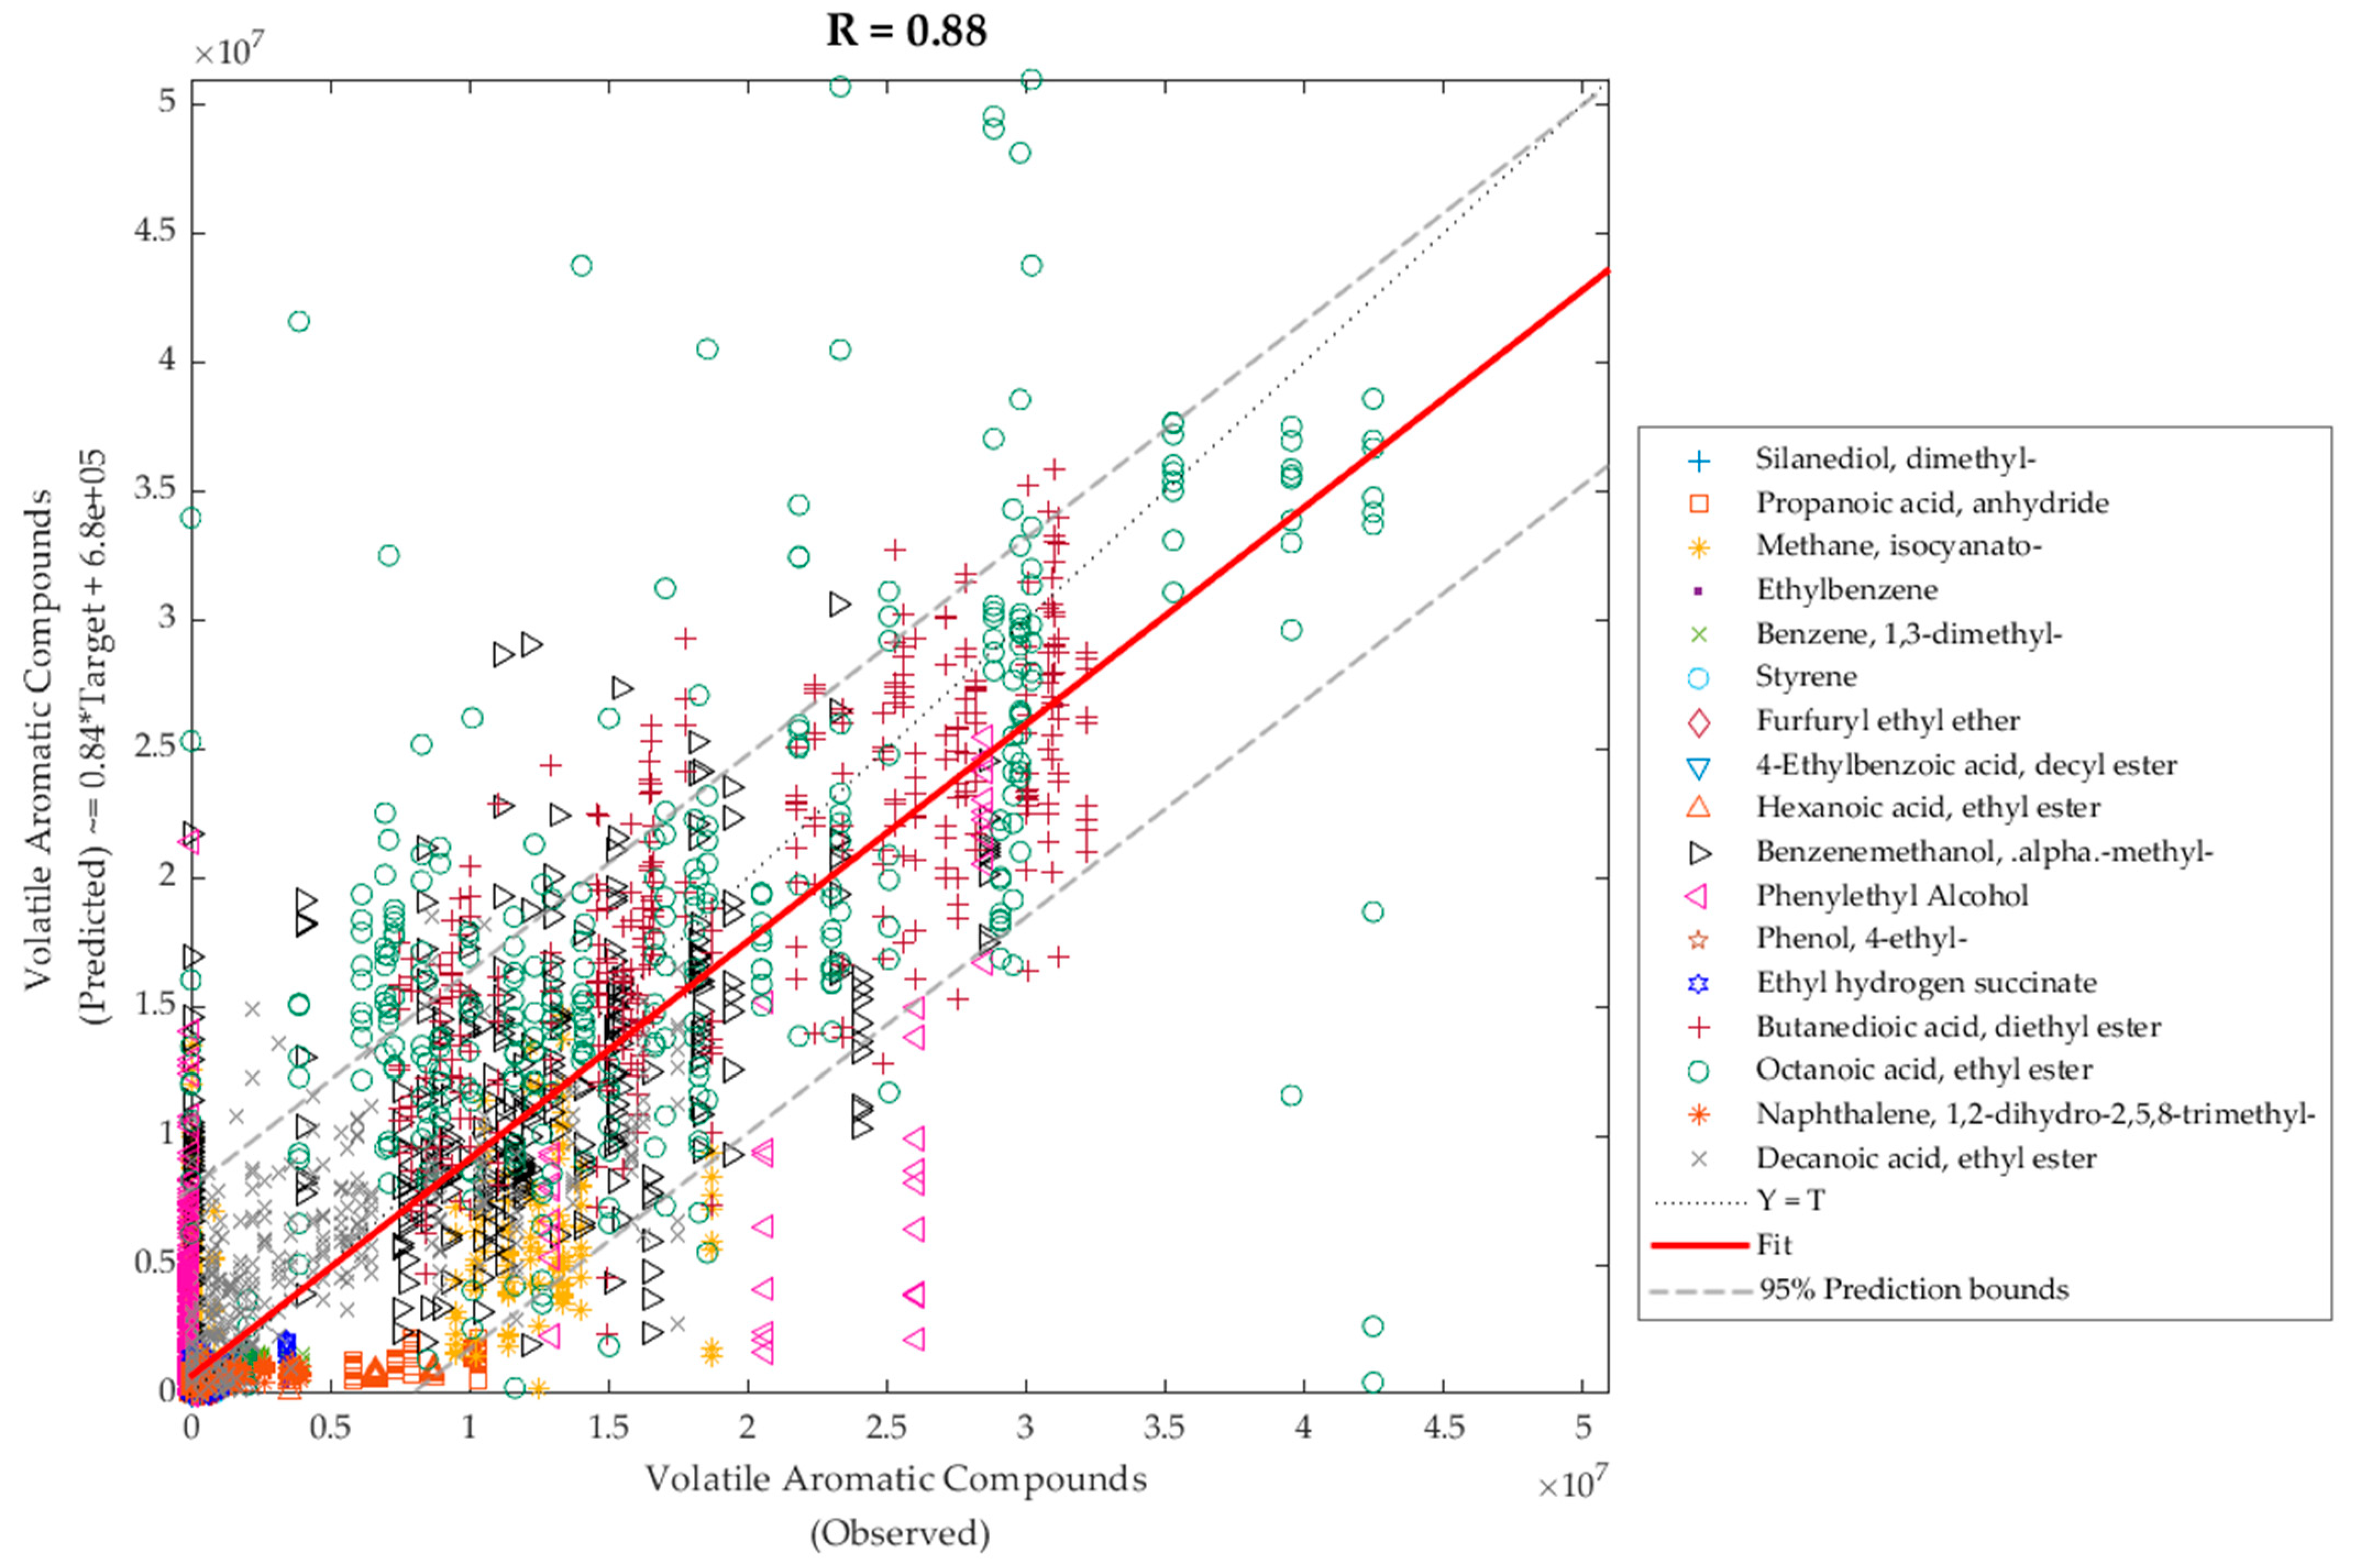
3.4. Machine Learning Modelling

Model 1 had a high overall accuracy of 97% for the classification of wines according to vintage with inputs of NIR absorbance values through the bottle (Table 4). This model did not present signs of under- or overfitting as the performance (MSE) value of the training (<0.01) stage was lower than the testing (0.01).
Due to the high accuracy and no signs of overfitting, the ML models obtained are highly replicable since the bottle material and thickness are usually consistent with the commercial source by the winery used in this study. Models would need to be retrained for wineries using different shapes of bottles or internal and external diameters. The receiver operating characteristics curve (Figure 5) shows that all the vintages were close to the true-positive (sensitivity) rate, with 2010 as the lowest sensitivity (0.89) followed by 2000, 2016, and 2017 (all with 0.92), confirming the model accuracy and suitability to classify the samples according to their vintage. A possible explanation for the slightly lower sensitivities for the vintages 2010, 2000, 2016, and 2017 is seasonal variability. For vintage 2010, there was lower rainfall than average from winter to early summer and higher rainfall than average from February to March. Similarly, for vintage 2000 and 2016, there was lower rainfall than average for January to March and higher for November and December. However, vintage 2017 had higher rainfall than average for winter, with the other months like the average [49].
It is well known that the variability of weather conditions and water availability within seasons directly impact the quality traits of grapes produced and the subsequent winemaking process [50]. Seasonal variability made it possible for the ML models to establish a pattern of analysis to distinguish different vintages from the same winery, which can be used to establish consistency and traceability of different bottles to avoid mislabelling. Furthermore, by incorporating vintage weather variability, these models can achieve better predictions for extreme seasonality or climatic anomalies, such as droughts, high rainfall, heatwaves, and others. Previous studies have incorporated these variables obtaining highly accurate predictions of seasonality effects on aroma profiles of Pinot Noir wines in Victoria [51].
Table 5 shows that Model 2 had high accuracy based on the correlation coefficient (R = 0.95, Figure 6) to predict the intensity of 20 sensory descriptors. It can be observed that the slopes of all stages were high (≥0.88), and the performance value of the testing stage (MSE = 0.26) was lower than the validation and testing stages (MSE = 0.56 and 0.63, respectively), with the last two values being very close, confirming no signs of overfitting of the models. Figure 6 shows the predicted (y-axis) and observed (x-axis) values of the 20 descriptors from the sensory analysis. It can be observed that, based on the prediction bounds, 5% of the data were outliers (351 out of 7020 data points), with most outliers from clarity and colour intensity. This is expected since the NIR spectral range is above the UV–VIS, which is the colour spectra.
The prediction of 17 volatile aromatic compounds depicted for Model 3 (Table 6), which had high overall accuracy based on correlation coefficient (Figure 7; R = 0.88; slope ≥ 0.84). It can be observed that there were no signs of under- or overfitting since the MSE value of the training stage was lower (0.91 × 10¹³) than the testing stage (2.37 × 10¹³). Figure 7 shows the overall model with 95% prediction bounds and presented 4.67% outliers (284 out of 5967 data points), with the highest number of outliers being octanoic acid, ethyl ester—which may be due to the fact that the NIR spectral range in which it is usually found (1177–1210 nm) is below the measured range (1596–2396 nm) [52]. Likewise, phenylethyl alcohol had some outliers because this is usually found within 1415–1445 and 2445–2505 nm [53]. However, despite these outliers, it can be seen that the ANN model can find patterns within the inputs and predict these compounds using the 1596–2396 nm range.
Table S2 in supplementary material shows the optimal parameters obtained as a result of the models to attain high accuracy and performance. The proposed method of measuring NIR through the bottle for wine assessment provided highly accurate and robust models for classifying vintages and predicting sensory descriptors and aroma profiles. Results are comparable to those obtained with NIR absorbance values (1596–2396 nm) from direct wine samples to predict sensory profiles (R = 0.92; slope = 0.85) [31] for the classification of faults for red wine (94–96%) and white wine (96–97%) [17] and from direct beer samples for the prediction of important aromas (R = 0.91, slope = 0.87) [13]. Other authors have reported methods to assess wine authenticity through the bottle using a frequency-swept electrical field with statistical analysis such as PCA [54]; however, this method is not as affordable, portable, or easy to use as the NIR method proposed in this study.

4. Conclusions

The novel application of NIR spectroscopy through the bottle coupled with machine learning modelling can effectively and accurately assess wine quality traits and provenance. Since this method is non-invasive, seeing as the wine bottle does not need to be opened to obtain chemical fingerprinting, the application could be utilised by wineries and retailers to provide a rapid and robust tool for the acceptability and quality traits of wine; monitoring of wines during transport, storage, and ageing; assessment of provenance; and for the detection of adulteration, counterfeiting, and mislabelling. Furthermore, it is recommended to incorporate further information, such as vintage weather and management (water balance) information, in order to increase the accuracy of models related to sensory and aroma profile prediction using NIR through bottles. These technologies will offer an advantage to the wine industry, retailers, and consumers to verify the provenance and authenticity of wines throughout the production and value chains.

Supplementary Materials

The following supporting information can be downloaded at: https://www.mdpi.com/article/10.3390/fermentation9010010/s1, Table S1: Mean values ± standard error of the volatile aromatic compounds identified in the shiraz wine samples using gas chromatography mass spectroscopy.; Table S2: Statistical parameters resulting from the machine learning models.

Author Contributions

Conceptualization, N.H., C.G.V. and S.F.; methodology, N.H., C.G.V. and S.F.; software, C.G.V. and S.F.; validation, C.G.V., C.B. and S.F.; formal analysis, N.H., C.G.V. and S.F.; investigation, N.H., C.G.V. and S.F.; resources, C.G.V., C.B. and S.F.; data curation, N.H., C.G.V. and S.F.; writing—original draft preparation, N.H., C.G.V. and S.F.; writing—review and editing, N.H., C.G.V., C.B. and S.F.; visualization, N.H., C.G.V. and S.F.; supervision, C.G.V. and S.F. All authors have read and agreed to the published version of the manuscript.

Funding

This research received no external funding.

Institutional Review Board Statement

Not applicable.

Informed Consent Statement

Not applicable.

Data Availability Statement

Data and intellectual property belong to the University of Melbourne; any sharing needs to be evaluated and approved by the University.

Acknowledgments

N.H. was supported by an Australian Government Research Training Program (RTP) Scholarship. The authors want to acknowledge Robyn Warner from The University of Melbourne for providing access to the GC–MS equipment and NIST library.

Conflicts of Interest

The authors declare no conflict of interest.

References

  1. Barátossy, G.; Berinkeiné Donkó, M.; Csikorné Vásárhelyi, H.; Héberger, K.; Rácz, A. Comprehensive classification and regression modeling of wine samples using 1H NMR spectra. Foods 2020, 10, 64. [Google Scholar] [CrossRef] [PubMed]
  2. Van Leeuwen, C.; Seguin, G. The concept of terroir in viticulture. J. Wine Res. 2006, 17, 1–10. [Google Scholar] [CrossRef]
  3. Gomes, V.M.; Fernandes, A.M.; Faia, A.; Melo-Pinto, P. Comparison of different approaches for the prediction of sugar content in new vintages of whole Port wine grape berries using hyperspectral imaging. Comput. Electron. Agric. 2017, 140, 244–254. [Google Scholar] [CrossRef]
  4. Silva, R.; Gomes, V.; Mendes-Faia, A.; Melo-Pinto, P. Using support vector regression and hyperspectral imaging for the prediction of oenological parameters on different vintages and varieties of wine grape berries. Remote Sens. 2018, 10, 312. [Google Scholar] [CrossRef] [Green Version]
  5. Liu, H.; Li, Q.; Yan, B.; Zhang, L.; Gu, Y. Bionic electronic nose based on MOS sensors array and machine learning algorithms used for wine properties detection. Sensors 2018, 19, 45. [Google Scholar] [CrossRef] [PubMed] [Green Version]
  6. Majchrzak, T.; Wojnowski, W.; Płotka-Wasylka, J. Classification of Polish wines by application of ultra-fast gas chromatography. Eur. Food Res. Technol. 2018, 244, 1463–1471. [Google Scholar] [CrossRef]
  7. da Costa, N.L.; Llobodanin, L.A.G.; de Lima, M.D.; Castro, I.A.; Barbosa, R. Geographical recognition of syrah wines by combining feature selection with extreme learning machine. Measurement 2018, 120, 92–99. [Google Scholar] [CrossRef]
  8. Garde-Cerdán, T.; da Costa, N.L.; Rubio-Bretón, P.; Barbosa, R.; Baroja, E.; Martínez-Vidaurre, J.M.; Pérez-Álvarez, E.P. The most important parameters to differentiate tempranillo and tempranillo blanco grapes and wines through machine learning. Food Anal. Methods 2021, 14, 2221–2236. [Google Scholar] [CrossRef]
  9. Merkytė, V.; Longo, E.; Windisch, G.; Boselli, E. Phenolic compounds as markers of wine quality and authenticity. Foods 2020, 9, 1785. [Google Scholar] [CrossRef]
  10. Ranaweera, R.K.; Capone, D.L.; Bastian, S.E.; Cozzolino, D.; Jeffery, D.W. A review of wine authentication using spectroscopic approaches in combination with chemometrics. Molecules 2021, 26, 4334. [Google Scholar] [CrossRef]
  11. Han, F.; Zhang, D.; Aheto, J.H.; Feng, F.; Duan, T. Integration of a low-cost electronic nose and a voltammetric electronic tongue for red wines identification. Food Sci. Nutr. 2020, 8, 4330–4339. [Google Scholar] [CrossRef] [PubMed]
  12. Fuentes, S.; Tongson, E.; Viejo, C.G. Novel digital technologies implemented in sensory science and consumer perception. Curr. Opin. Food Sci. 2021, 41, 99–106. [Google Scholar] [CrossRef]
  13. Gonzalez Viejo, C.; Fuentes, S. Beer aroma and quality traits assessment using artificial intelligence. Fermentation 2020, 6, 56. [Google Scholar] [CrossRef]
  14. Viejo, C.G.; Fuentes, S.; Godbole, A.; Widdicombe, B.; Unnithan, R.R. Development of a low-cost e-nose to assess aroma profiles: An artificial intelligence application to assess beer quality. Sens. Actuators B Chem. 2020, 308, 127688. [Google Scholar] [CrossRef]
  15. Gonzalez Viejo, C.; Fuentes, S.; Hernandez-Brenes, C. Smart detection of faults in beers using near-infrared spectroscopy, a low-cost electronic nose and artificial intelligence. Fermentation 2021, 7, 117. [Google Scholar] [CrossRef]
  16. Gonzalez Viejo, C.; Fuentes, S.; Torrico, D.D.; Howell, K.; Dunshea, F.R. Assessment of beer quality based on a robotic pourer, computer vision, and machine learning algorithms using commercial beers. J. Food Sci. 2018, 83, 1381–1388. [Google Scholar] [CrossRef]
  17. Gonzalez Viejo, C.; Fuentes, S. Digital Assessment and Classification of Wine Faults Using a Low-Cost Electronic Nose, Near-Infrared Spectroscopy and Machine Learning Modelling. Sensors 2022, 22, 2303. [Google Scholar] [CrossRef]
  18. Summerson, V.; Gonzalez Viejo, C.; Szeto, C.; Wilkinson, K.L.; Torrico, D.D.; Pang, A.; Fuentes, S. Classification of smoke contaminated Cabernet Sauvignon berries and leaves based on chemical fingerprinting and machine learning algorithms. Sensors 2020, 20, 5099. [Google Scholar] [CrossRef]
  19. Summerson, V.; Viejo, C.G.; Torrico, D.; Pang, A.; Fuentes, S. Detection of smoke-derived compounds from bushfires in Cabernet-Sauvignon grapes, must, and wine using Near-Infrared spectroscopy and machine learning algorithms. OenoOne 2020, 54, 1105–1119. [Google Scholar] [CrossRef]
  20. Summerson, V.; Gonzalez Viejo, C.; Torrico, D.D.; Pang, A.; Fuentes, S. Digital Smoke Taint Detection in Pinot Grigio Wines Using an E-Nose and Machine Learning Algorithms Following Treatment with Activated Carbon and a Cleaving Enzyme. Fermentation 2021, 7, 119. [Google Scholar] [CrossRef]
  21. Summerson, V.; Gonzalez Viejo, C.; Pang, A.; Torrico, D.D.; Fuentes, S. Assessment of Volatile Aromatic Compounds in Smoke Tainted Cabernet Sauvignon Wines Using a Low-Cost E-Nose and Machine Learning. Modelling 2021, 26, 5108. [Google Scholar] [CrossRef] [PubMed]
  22. Fuentes, S.; Summerson, V.; Gonzalez Viejo, C.; Tongson, E.; Lipovetzky, N.; Wilkinson, K.L.; Unnithan, R.R. Assessment of Smoke Contamination in Grapevine Berries and Taint in Wines Due to Bushfires Using a Low-Cost E-Nose and an Artificial Intelligence Approach. Sensors 2020, 20, 5108. [Google Scholar] [CrossRef] [PubMed]
  23. Gonzalez Viejo, C.; Fuentes, S. Digital Detection of Olive Oil Rancidity Levels and Aroma Profiles Using Near-Infrared Spectroscopy, a Low-Cost Electronic Nose and Machine Learning Modelling. Chemosensors 2022, 10, 159. [Google Scholar] [CrossRef]
  24. Gonzalez Viejo, C.; Harris, N.M.; Fuentes, S. Quality Traits of Sourdough Bread Obtained by Novel Digital Technologies and Machine Learning Modelling. Fermentation 2022, 8, 516. [Google Scholar] [CrossRef]
  25. Basile, T.; Marsico, A.D.; Perniola, R. Use of Artificial Neural Networks and NIR Spectroscopy for Non-Destructive Grape Texture Prediction. Foods 2022, 11, 281. [Google Scholar] [CrossRef] [PubMed]
  26. Ferrara, G.; Melle, A.; Marcotuli, V.; Botturi, D.; Fawole, O.A.; Mazzeo, A. The prediction of ripening parameters in Primitivo wine grape cultivar using a portable NIR device. J. Food Compos. Anal. 2022, 114, 104836. [Google Scholar] [CrossRef]
  27. Rouxinol, M.I.; Martins, M.R.; Murta, G.C.; Mota Barroso, J.; Rato, A.E. Quality Assessment of Red Wine Grapes through NIR Spectroscopy. Agronomy 2022, 12, 637. [Google Scholar] [CrossRef]
  28. Anjos, O.; Caldeira, I.; Fernandes, T.A.; Pedro, S.I.; Vitória, C.; Oliveira-Alves, S.; Canas, S. PLS-R Calibration Models for Wine Spirit Volatile Phenols Prediction by Near-Infrared Spectroscopy. Sensors 2021, 22, 286. [Google Scholar] [CrossRef]
  29. Chen, J.; Liao, S.; Yao, L.; Pan, T. Rapid and simultaneous analysis of multiple wine quality indicators through near-infrared spectroscopy with twice optimization for wavelength model. Front. Optoelectron. 2020, 14, 329–340. [Google Scholar] [CrossRef]
  30. Kljusurić, J.G.; Boban, A.; Mucalo, A.; Budić-Leto, I. Novel application of NIR spectroscopy for non-destructive determination of ‘maraština’ wine parameters. Foods 2022, 11, 1172. [Google Scholar] [CrossRef]
  31. Fuentes, S.; Torrico, D.D.; Tongson, E.; Gonzalez Viejo, C. Machine learning modeling of wine sensory profiles and color of vertical vintages of pinot noir based on chemical fingerprinting, weather and management data. Sensors 2020, 20, 3618. [Google Scholar] [CrossRef] [PubMed]
  32. Hencz, A.; Nguyen, L.L.P.; Baranyai, L.; Albanese, D. Assessment of wine adulteration using near infrared spectroscopy and laser backscattering imaging. Processes 2022, 10, 95. [Google Scholar] [CrossRef]
  33. da Costa, N.L.; Valentin, L.A.; Castro, I.A.; Barbosa, R.M. Predictive modeling for wine authenticity using a machine learning approach. Artif. Intell. Agric. 2021, 5, 157–162. [Google Scholar] [CrossRef]
  34. Nyitrainé Sárdy, Á.D.; Ladányi, M.; Varga, Z.; Szövényi, Á.P.; Matolcsi, R. The effect of grapevine variety and wine region on the primer parameters of wine based on 1h nmr-spectroscopy and machine learning methods. Diversity 2022, 14, 74. [Google Scholar] [CrossRef]
  35. Portinale, L.; Leonardi, G.; Arlorio, M.; Coisson, J.D.; Travaglia, F.; Locatelli, M. Authenticity assessment and protection of high-quality Nebbiolo-based Italian wines through machine learning. Chemom. Intell. Lab. Syst. 2017, 171, 182–197. [Google Scholar] [CrossRef]
  36. Fuentes, S.; Gonzalez Viejo, C.; Torrico, D.D.; Dunshea, F.R. Development of a Biosensory Computer Application to Assess Physiological and Emotional Responses from Sensory Panelists. Sensors 2018, 18, 2958. [Google Scholar] [CrossRef] [Green Version]
  37. Gonzalez Viejo, C.; Torrico, D.D.; Dunshea, F.R.; Fuentes, S. Development of artificial neural network models to assess beer acceptability based on sensory properties using a robotic pourer: A comparative model approach to achieve an artificial intelligence system. Beverages 2019, 5, 33. [Google Scholar] [CrossRef] [Green Version]
  38. Ciucci, S.; Ge, Y.; Durán, C.; Palladini, A.; Jiménez-Jiménez, V. Enlightening discriminative network functional modules behind Principal Component Analysis separation in differential-omic science studies. Sci. Rep. 2017, 7, 1–24. [Google Scholar] [CrossRef] [Green Version]
  39. Cozzolino, D.; Kwiatkowski, M.J.; Waters, E.J.; Gishen, M. A feasibility study on the use of visible and short wavelengths in the near-infrared region for the non-destructive measurement of wine composition. Anal. Bioanal. Chem. 2007, 387, 2289–2295. [Google Scholar] [CrossRef]
  40. Cozzolino, D.; Smyth, H.E.; Gishen, M. Feasibility study on the use of visible and near-infrared spectroscopy together with chemometrics to discriminate between commercial white wines of different varietal origins. J. Agric. Food Chem. 2003, 51, 7703–7708. [Google Scholar] [CrossRef]
  41. Company, T.G.S. The Good Scents Company Information System. Available online: http://www.thegoodscentscompany.com/data/rw1038291.html (accessed on 3 October 2022).
  42. Somkuwar, R.G.; Sharma, A.K.; Kambale, N.; Banerjee, K.; Bhange, M.A.; Oulkar, D.P. Volatome finger printing of red wines made from grapes grown under tropical conditions of India using thermal-desorption gas chromatography-mass spectrometry (TD-GC/MS). J. Food Sci. Technol. 2020, 57, 1119–1130. [Google Scholar] [CrossRef] [PubMed]
  43. Ieri, F.; Campo, M.; Cassiani, C.; Urciuoli, S.; Jurkhadze, K.; Romani, A. Analysis of aroma and polyphenolic compounds in Saperavi red wine vinified in Qvevri. Food Sci. Nutr. 2021, 9, 6492–6500. [Google Scholar] [CrossRef] [PubMed]
  44. Barbará, J.A.; Nicolli, K.P.; Souza-Silva, É.A.; Biasoto, A.C.T.; Welke, J.E.; Zini, C.A. Volatile profile and aroma potential of tropical Syrah wines elaborated in different maturation and maceration times using comprehensive two-dimensional gas chromatography and olfactometry. Food Chem. 2020, 308, 125552. [Google Scholar] [CrossRef] [PubMed]
  45. Kustos, M.; Gambetta, J.M.; Jeffery, D.W.; Heymann, H.; Goodman, S.; Bastian, S.E. A matter of place: Sensory and chemical characterisation of fine Australian Chardonnay and Shiraz wines of provenance. Food Res. Int. 2020, 130, 108903. [Google Scholar] [CrossRef]
  46. Mayr, C.M.; Geue, J.P.; Holt, H.E.; Pearson, W.P.; Jeffery, D.W.; Francis, I.L. Characterization of the key aroma compounds in Shiraz wine by quantitation, aroma reconstitution, and omission studies. J. Agric. Food Chem. 2014, 62, 4528–4536. [Google Scholar] [CrossRef]
  47. Feng, T.; Ma, N.; Wang, K.; Zhuang, H.; Chen, D.; Yao, L.; Xu, J. Exploring relationships between aroma, tasty components properties, and marketing price of chinese cabernet sauvignon using gas chromatography mass spectrum and high-performance liquid chromatography. J. Food Qual. 2022, 2022, 1–13. [Google Scholar] [CrossRef]
  48. Pearson, W.; Schmidtke, L.M.; Francis, I.L.; Carr, B.T.; Blackman, J.W. Characterising inter– and intra–regional variation in sensory profiles of Australian Shiraz wines from six regions. Aust. J. Grape Wine Res. 2020, 26, 372–384. [Google Scholar] [CrossRef]
  49. Meterology, B.O. Australian Governement; Monthly Rainfall; Station: Dookie Agricultural College; Station Number: 81013. Available online: http://www.bom.gov.au/climate/averages/tables/cw_081013.shtml (accessed on 27 September 2022).
  50. Sáenz-Navajas, M.P.; Jeffery, D.W. Perspectives on Wines of Provenance: Sensory Typicality, Quality, and Authenticity. ACS Food Sci. Technol. 2021, 1, 986–992. [Google Scholar] [CrossRef]
  51. Fuentes, S.; Gonzalez Viejo, C.; Wang, X.; Torrico, D.D. Aroma and quality assessment for vertical vintages using machine learning modelling based on weather and management information. In Proceedings of the 21st GiESCO International Meeting, Thessaloniki, Greece, 17–21 June 2019. [Google Scholar]
  52. Buback. Octanoic Acid Ethyl Ester; John Wiley & Sons, Inc.: Hoboken, NJ, USA, 1989. [Google Scholar]
  53. Buback. 2-Phenylethanol; John Wiley & Sons, Inc.: Hoboken, NJ, USA, 1989. [Google Scholar]
  54. Augustine, M.P.; Harley, S.J.; Lim, V.; Stucky, P. Authentication Device for Full Intact Wine Bottles. U.S. Patent 9,488,599, 8 November 2016. [Google Scholar]
Figure 1. Near-infrared spectroscopy hand-held device, including the custom-made attachment to avoid external light, and sample of the Bertie Shiraz wine bottle from 2021 vintage.
Fermentation 09 00010 g001
Figure 2. Machine learning diagrams showing the inputs, targets, and number of neurons used for (a) classification Model 1, (b) regression Model 2, and (c) regression Model 3. Abbreviations: W—weights; b—bias.
Fermentation 09 00010 g002
Figure 3. Principal component analysis (PCA) constructed from the NIR absorbance values through the bottle for Shiraz vertical vintages, x-axis representing the principal component one (PC1), while y-axis representing principal component two (PC2). Abbreviations are shown in Table 1.
Fermentation 09 00010 g003
Figure 4. Mean values of sensory descriptors for Shiraz vertical vintages. Significant differences are denoted by different letters (a–g) based on ANOVA and post hoc test Fisher’s least significant difference (LSD) at α = 0.05. Sample abbreviations are displayed in Table 1. Error bars = standard error (range: 0.32–1.82).
Fermentation 09 00010 g004
Figure 5. Overall receiver operating characteristics (ROC) curve showing the true-positive (sensitivity) and false-positive (specificity) rates of Model 1 for all vintages.
Fermentation 09 00010 g005
Figure 6. Overall machine learning model to predict sensory descriptors using NIR absorbance values measured through the bottles as inputs.
Fermentation 09 00010 g006
Figure 7. Overall machine learning model to predict volatile aromatic compounds using NIR absorbance values measured through the bottles as inputs.
Fermentation 09 00010 g007
Table 1. Shiraz vertical vintages used for this study, including abbreviation, closure type, and alcohol content.
VintageLabel/AbbreviationClosureAlcohol Content %
2000S00Cork14.2
2007S07Cork14.9
2008S08Screw Cap14.5
2010S10Cork13.8
2013S13Cork13.8
2014S14Cork13.8
2015S15Cork14.3
2016S16Screw Cap14.3
2017S17Screw Cap14.5
2018S18Cork14.5
2019S19Screw Cap14.5
2020S20Screw Cap14.2
2021S21Cork14.5
Table 2. Sensory descriptors evaluated and anchors used during sensory session.
DescriptorAnchors
ClarityLight–Dark
Colour IntensityAbsent–Intense
Aroma TruffleAbsent–Intense
Aroma SmokeAbsent–Intense
Aroma BlackberryAbsent–Intense
Aroma BlackcurrantAbsent–Intense
Aroma PruneAbsent–Intense
Aroma ButterAbsent–Intense
Aroma PepperAbsent–Intense
Aroma CedarAbsent–Intense
Aroma VioletAbsent–Intense
Aroma RedcurrantAbsent–Intense
BitterAbsent–Intense
Sour/AcidicAbsent–Intense
SweetnessAbsent–Intense
AstringencyAbsent–Intense
BodyLight–Full
WarmingAbsent–Intense
TinglingAbsent–Intense
Perceived QualityUnacceptable–Excellent
Table 3. Volatile aromatic compounds identified by GC–MS for wine samples.
LabelVolatile Aromatic CompoundAroma *
VAC1Silanediol, dimethyl-NR
VAC2Methane, isocyanato-NR
VAC3Propanoic acid, anhydrideLike acetaldehyde
VAC4EthylbenzeneSweet/Fruity
VAC5Benzene, 1,3-dimethyl-Plastic
VAC6StyreneSweet/Balsam/Floral/Plastic
VAC7Furfuryl ethyl etherSweet/Spicy
VAC84-Ethylbenzoic acid, decyl esterNR
VAC9Hexanoic acid, ethyl esterSweet/Pineapple/Waxy/Green Banana
VAC10Benzenemethanol, alpha.-methyl-Fresh/Sweet/Gardenia
VAC11Phenylethyl AlcoholFloral/Rose
VAC12Phenol, 4-ethyl-Castoreum/Smoke
VAC13Ethyl hydrogen succinateChocolate **
VAC14Butanedioic acid, diethyl esterCooked Apple
VAC15Octanoic acid, ethyl esterFruity/Winey/Waxy/Apricot/Banana/Brandy
VAC16Naphthalene, 1,2-dihydro-2,5,8-trimethyl-NR
VAC17Decanoic acid, ethyl esterSweet/Waxy/Apple/Grape/Brandy
Abbreviations: VAC—volatile aromatic compounds; NR—not reported. * Associated aromas were obtained from The Good Scents Company [41]. ** Associated aroma from Feng et al. [47].
Table 4. Results from the classification machine learning model to predict wine vintages. Abbreviations: MSE—means square error.
StageSamplesAccuracyErrorPerformance
(MSE)
Training24699.2%0.8%<0.01
Testing10592.4%7.6%0.01
Overall35197.2%2.8%-
Table 5. Regression machine learning model results in predicting wine sensory descriptors using NIR absorbance values as input. Abbreviations: R—correlation coefficient; MSE—means squared error.
StageSamplesObservationsRSlopeMSE
Training24549000.970.930.26
Validation5310600.920.890.56
Testing5310600.920.880.63
Overall35170200.950.91-
Table 6. Regression machine learning model results in predicting 17 volatile aromatic compounds using NIR absorbance values as input. Abbreviations: R—correlation coefficient; MSE—means squared error.
StageSamplesObservationsRSlopeMSE
Training24641850.920.840.91 × 1013
Testing10517850.800.852.37 × 1013
Validation35159670.880.84-
Disclaimer/Publisher’s Note: The statements, opinions and data contained in all publications are solely those of the individual author(s) and contributor(s) and not of MDPI and/or the editor(s). MDPI and/or the editor(s) disclaim responsibility for any injury to people or property resulting from any ideas, methods, instructions or products referred to in the content.

