Article

Effects of Different Additives on the Chemical Composition, Fermentation Profile, In Vitro and In Situ Digestibility of Paper mulberry Silage

College of Animal Science and Technology, China Agricultural University, Beijing 100193, China
*
Author to whom correspondence should be addressed.
These authors contributed equally to this work.
Fermentation 2022, 8(9), 435; https://doi.org/10.3390/fermentation8090435
Submission received: 3 August 2022 / Revised: 26 August 2022 / Accepted: 27 August 2022 / Published: 2 September 2022
(This article belongs to the Section Microbial Metabolism, Physiology & Genetics)

Abstract

:
Paper mulberry (Broussonetia papyrifera) plants are served as a local roughage in China, and they are mostly processed as silage for ruminants. This study aimed to explore the effects of different silage additives on the chemical composition, fermentation profile, as well as the in vitro and in situ digestibility of paper mulberry (PM) silage. Four groups consisting of PM silage, three with additives and one without any additives as the control group (CON), were established. The three experimental groups with additives were set up as follows: CON with 5 × 10⁶ CFU per gram of fresh PM weight of lactic acid bacteria (Lactobacillus plantarum) (LAB); CON with 3% fresh PM weight of molasses (MOL) added to the PM silage; and CON with both LAB and MOL added (LM). After 45 days of ensiling at 20 °C, all of the PM treatment groups increased their ash content and decreased their water-soluble carbohydrate content (p < 0.05). Meanwhile, the pH and NH3-N content of the PM silage were lower in the additive treatment groups than in the CON group (p < 0.05). Lactic acid in the LM group was the highest (p < 0.05) among the four groups, and trace amounts of butyric acid was detected only in the CON group. In vitro dry matter digestibility was similar among all groups. Results of the in situ experiment found that the effective digestibility of the PM silage dry matter, as well as the acid detergent fiber digestibility was higher in the LM group than in the CON group (p < 0.05). In conclusion, the addition of LAB, MOL, and their combination can improve PM silage fermentation and improve the in situ digestibility of dry matter and acid detergent fiber; however they do not affect in the vitro digestibility of PM silage.

1. Introduction

Paper mulberry (Broussonetia papyrifera, PM) is a woody plant that is native to mainland Southeast Asia and East Asia. Because of its strong rooting ability and rapid growth, PM is considered a plant capable of providing environmental afforestation in many areas [1]. Two decades ago, wide areas of PM were planted to perform a soil erosion prevention function in China [2]. PM is also a pioneer plant species in heavy metal contaminated areas, which can alleviate the soil pollution status [2]. For the animal production industry, PM can provide high protein and is rich in bioactive substances, therefore it is widely used as a roughage source for ruminants [3]. Research has shown that ensiled PM could enhance the immunity and antioxidant capacity of dairy cows [4]. However, several quality problems may exist during the production of PM silage, such as detectable butyric acid and peculiar smells, which is a sign of poor fermentation and will further lower the feed intake of animals [5]. pH is one of the most important indices in silage fermentation, and low pH can inhibit bacterial activity, resulting in reduced fermentation and nutrient loss [6]. Lactic acid is one of the most important acids involved in fermentation, which is widely studied and plays the most important role in downregulating the silage pH [6]. We must be paying attention to these two indices when evaluating silage fermentation quality.
Lactic acid bacteria (LAB) are capable of prompting the production of lactic acid, and then decreasing the pH and inhibiting the production of the ammonia-N content of silage [6]. Therefore, it is the most commonly used silage biological additive [6]. Molasses (MOL) can be used as a supplementary substrate for LAB to proliferate in, thereby accelerating the silage pH reduction [7]. Some researchers have indicated that adding molasses together with probiotics can improve the nutritional value of silage as it facilitates a better silage fermentation profile and mitigates nutrient loss [7,8]. When molasses and LAB are applied to silage together, the in situ dry matter (DM) degradation and crude protein (CP) effective digestibility of amaranth plants can be improved [8]. Similarly, earlier research showed that the combination of molasses and LAB could improve the in vitro organic matter digestibility of mixed potato–wheat straw silage [7]. However, no available information about the effects on digestibility of adding LAB and molasses to PM silage can be obtained.
In this study, LAB, MOL, and their combination were selected as silage additives. We aimed to explore the effects of these different silage additives on the chemical composition, fermentation profile, as well as the in vitro and in situ digestibility of PM silage.

2. Materials and Methods

2.1. Preparation of Paper Mulberry Silage

We started harvesting the PM plants when their height reached 1.2 m, and we cut them at a cutting height of 0.2 m. After harvest, the PM was chopped into lengths of 1–2 cm with a manual forage chopper (93ZT-300; Xingrong Co., Ltd., Guangzhou, Guangdong, China), and then mixed well. To establish the replicates for each experimental condition, the chopped paper mulberry was split into four equal parts and treated with: (1) no additive (CON), (2) Lactobacillus plantarum additive (LAB), (3) molasses additive (MOL), and (4) L. plantarum and molasses additives together (LM). These additives were dissolved in 4 L of deionized water/t fresh forage and sprayed onto the silage, supplying a final concentration of 5 × 10⁶ CFU of L. plantarum or 3% molasses per gram of fresh PM weight. The same dosage was used for the LM group. As for the CON group, the same amount of deionized water alone was applied. The fresh PM was chopped and then packed into a plastic polyethylene bottle (0.5 L capacity); each bottle contained at least 550 g of fresh PM. Finally, every flask was degassed and sealed using a vacuum sealer. Each treatment had three replicates (each flask as a replicate), and the bottle-silos for each treatment were stored at an ambient temperature for 45 days.

2.2. Chemical Composition and Fermentation Profile Detection

In each bottle, 20 g of silage was blended with 180 mL of deionized water and stored at 4 °C for 24 h, after which the silage juice was filtered through 4 layers of cheesecloth for the detection of fermentation characteristics. The pH value of the silage juice was measured with a pH meter (model pH B-4; Shanghai Chemical, Shanghai, China). Ammonia nitrate (NH3-N) in the silage juice was measured using the phenol–sodium hypochlorite colorimetry method, as described by Broderick et al. [9]. Organic acid was measured by using liquid chromatography, according to Yuan et al. [10]. The remaining portion of the sample was immediately put into a forced-draft oven (DGG-9240B; Shanghai ShenXin, Shanghai, China) at 55 °C for 48 h until a constant weight was obtained, to measure its dry matter (DM) content (method 950.15), following the procedure outlined by the Association of Official Analytical Chemists (AOAC, 2000) [11]. Then, the dried samples were milled through a 1 mm screen by using a feedstuff mill (KRT-34; KunJie, Beijing, China) and stored for subsequent analysis. The neutral detergent fiber (NDF) and acid detergent fiber (ADF) were determined using a fiber analyzer (A2000i; American ANKOM, Macedon, NY, USA) as described by Van Soest et al. [12]. Nitrogen was measured using method 984.13 according to the authors of AOAC [11], after which crude protein (CP) was calculated by multiplying the nitrogen content by 6.25. The ash (method 924.05) and ether extract (EE, method 920.39) were measured according to the AOAC procedures [11]. Finally, to determine the WSC content, the anthrone method described by Murphy [13] was used.

2.3. In Vitro Fermentation and In Situ Digestibility Experiment

The in vitro gas production measurements were performed using the Automated Trace Gas Recording System (AGRS) for microbial fermentation as described by Bai et al. [14]. Briefly, 500 mg samples from each treatment were weighed into 120 mL glass bottles individually, and 50 mL of freshly prepared buffer solution was added to each bottle [15], along with 25 mL of corresponding filtered rumen fluid collected from three rumen fistulated cows. All the animal use procedures carried out during this experimental period were approved by the China Agriculture University Laboratory Animal Welfare and Animal Experimental Ethical Faculty (protocol number: AW81102202-1-2). All the cows were in a stage of high lactation, having a diet of 60% forage and 40% concentrate with a net energy of 8.16 MJ/kg; the ingredients and chemical composition of the cows’ diet is outlined in Table S1. Next, the bottles were purged with nitrogen gas for 5 s, sealed with a butyl rubber stopper to create an anaerobic environment, and individually connected with medical plastic infusion pipes to the gas inlets of the AGRS, to continuously record cumulative gas production. Methods of measuring pH and NH3-N were the same as described previously. Gas production, volatile fatty acids (VFA), and in vitro digestible dry matter (IVDMD) were all measured according to Zhang et al. [16].
The quality of the silage from the CON and LM groups was further studied by determining the in situ DM, CP, NDF, and ADF degradation following the procedure described by Mehrez et al. [17]. Samples were milled through a 3 mm sieve and 5 g of an air-dried sample was weighed into nylon bags (45 μm pore size, 8 cm × 16 cm bag size) in triplicate, then incubated for 4, 8, 12, 24, 30, 36, 48, and 72 h in three rumen fistulated cows. After serially removing the bags at each time point, each bag was washed under running tap water until the outlet water appeared clear. Bags were then dried to a constant weight at 55 °C for 48 h and their residues were weighed. Residues were ground through a 1 mm sieve for laboratory analysis. DM, CP, NDF, and ADF were measured as described above.

2.4. Calculations

2.4.1. Gas Production Parameters Calculation for the In Vitro Fermentation

Data of the cumulative gas production at 48 h (GP48) (mL/g) was fitted to an exponential model [18], by using the nonlinear procedure (PROC NLIM) of the SAS program for Windows as follows:
GP t = A / [ 1 + C t B ]
where A is the theoretical maximum of gas production, B is the inflection point on the curve parameter, C is the time at which half of the total gas production is reached, and t is the elapsed time of gas production (h).
For AGPR, the average gas production rate, its formula is as follows:
AGPR = ( A   ×   B ) / ( 4   ×   C )
where A, B, and C are the same as in Equation (1).

2.4.2. The In Situ Digestibility Rate Calculation

The degradation data were fitted to the following exponential equation:
y   = a + b   ( 1 e - ct )
where y is the nutrient disappearance rate in the rumen at time t, while a is the rapidly degradable fraction, b is the potential degradable fraction, and c is the constant rate of degradation of b (%/h).
The effective degradability (ED) of nutrients was calculated by applying the following equation of Orskov et al. [19]:
ED = a + [ b   ×   c c + k ]
where a, b, and c are the same as in Equation (3) and k is the rumen outflow rate. The ED was calculated using a fixed outflow rate of k = 0.07/h, according to Batajoo et al. [20].

2.5. Statistical Analysis

Analyses were performed using the SAS software program (version 9.0, SAS Institute, Cary, NC, USA). Data of the silage chemical composition, fermentation profile, and in vitro digestibility were subjected to one-way analysis of variance (ANOVA), for which the statistical difference between pairs of means was determined by Tukey’s multiple-comparison test. To compare the in situ digestibility means of the CON and LM groups, a two-tailed t-test was used. Differences were considered significant when the p-value was less than 0.05. Below is the linear expression of the ANOVA model:
Y i j = µ + T i +   ε i j
where Yij is the response variable, µ is the overall mean, Ti is the fixed effect of the treatment (different additives; four levels), and εij is the residual error.

3. Results

3.1. Chemical Composition and Fermentation Profile of Silage

There was no significant difference in the CP, NDF, ADF, and EE between the fresh PM and all silage groups (Table 1). Additives also had no significant effect on the silage’s CP, NDF, ADF, and EE content. Ash content was lower in the fresh PM than in the silage groups (p < 0.05), however, there was no difference in the treatment groups in ash content. The WSC content in the fresh PM surpassed that in the CON, LAB, and LM groups (p < 0.05). Compared with the CON group, WSC content was higher for the MOL group (p < 0.05), lower for the LAB group (p < 0.05), and not significantly different for the LM group.
The pH (Table 2) of the CON group was higher than the treatment groups (p < 0.05). The LM group had the lowest pH value (p < 0.05). There was no difference in the NH3-N content between the CON and MOL groups, however, both groups were higher than the LAB and LM groups (p < 0.05). The LM group had the highest LA concentration (p < 0.05), however, LA in the CON and MOL groups showed no difference, and both groups were lower than the LAB group (p < 0.05). The AA content in the CON and MOL groups was significantly higher than in the LAB and LM groups (p < 0.05). The PA content in the LM group was significantly lower than in the MOL group (p < 0.05). The PA in the CON and LAB groups showed no difference when compared with the other groups. Only trace amounts of BA were detected in the CON group; the additive groups had no detectable BA.

3.2. In Vitro Ruminal GP Characteristics, Ammonia-N, and VFA

The in vitro experiment results are shown in Table 3 and Table 4. No significant difference in PM silage IVDMD was found among all the groups. The in vitro ruminal fluid NH3-N content of the LM group was higher than the CON and MOL groups, however, the ruminal fluid pH in the LM group was lower than that in CON and MOL groups (p < 0.05). In vitro ruminal fluid acetic acid, propionic acid, isobutyric acid, valeric acid, isovaleric acid, and total VFA also occurred at similar levels among all four groups. By contrast, the ruminal fluid butyric acid in the CON group was at a lower level than the LAC and LM groups (p < 0.05).
GP48 in the CON group was significantly lower than in the MOL and LM groups (p < 0.05), and showed no difference when compared with the LAB group. The AGPR in the CON group was lower than in the additive treatment groups (p < 0.05). Parameter “C” in the CON group was higher than that in all three treatment groups (p < 0.05), whereas parameter “B” in the CON group was lower (p < 0.05). Values of parameter “A” were similar among all four groups.

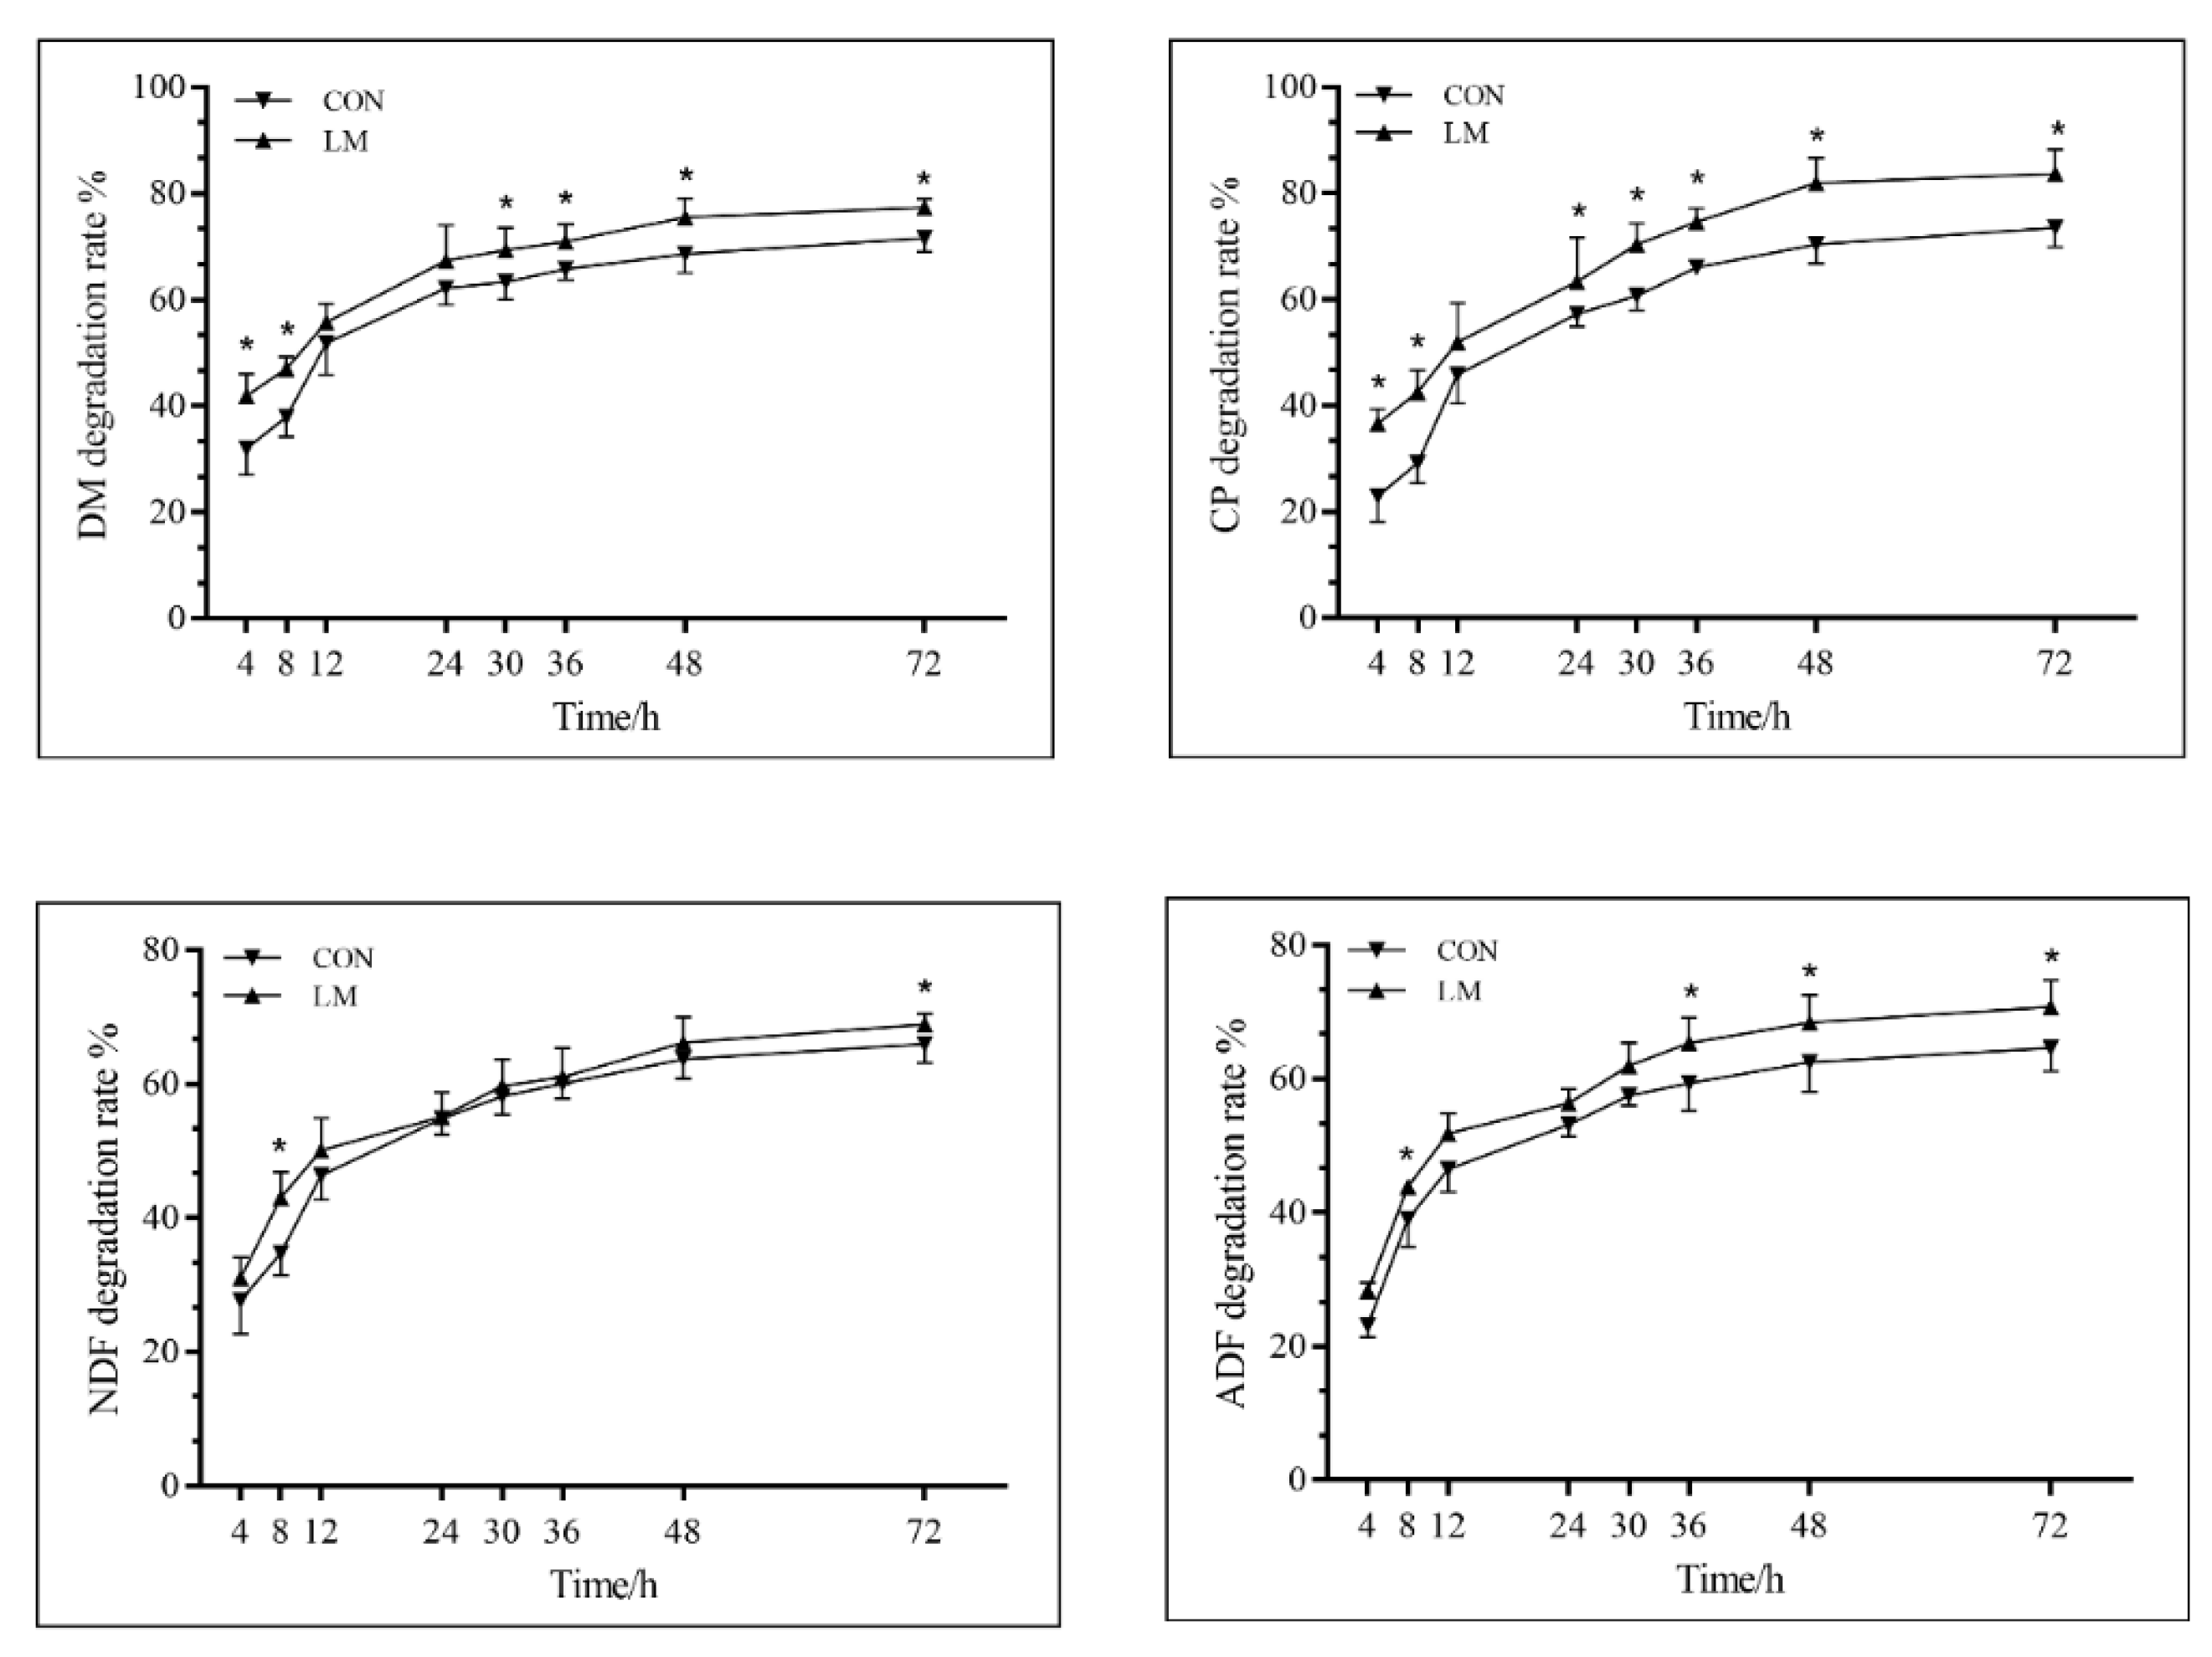
3.3. In Situ Ruminal Degradation Characteristics

Figure 1 shows the real-time degradation of the PM silage. These results indicated the DM, CP and ADF degradation of the PM silage in the LM group happened faster than in the CON group, from 36 h to 72 h of incubation (p < 0.05). Furthermore, the NDF degradation rate in the LM group was higher than in the CON group at 72 h of incubation (p < 0.05). Parameters for DM, CP, NDF, and ADF in the dynamic degradation model of PM silage can be found in Table 5. The rapidly soluble fraction (parameter a) of DM and CP were both higher in the LM group than in the CON group (p < 0.05), whereas the rapid, slow, and constant rate of degradation (i.e., parameters a, b, and c) of NDF and ADF showed no difference between these two groups. Finally, the ED values of DM and ADF in the LM group were higher than those in the CON group (p < 0.05).

4. Discussion

4.1. Chemical Composition and Fermentation Profile of Silage

The crucial factor for successful silage fermentation is WSC. Normally, successful ensiling requires WSC > 5% of DM for lactic acid fermentation. The WSC content of the fresh PM was 3.32%, which might be insufficient for the fermentation process. Molasses increases the amount of substrate that will be consumed by LAB, and increases lactic acid, which is one of the end-products of the WSC fermentation by LAB. The lactic acid can lower the silage pH value more quickly than without its supplementation [6]. After adding molasses, silage in the MOL group showed a lower pH, demonstrating that molasses can provide substances for bacteria that enhance the fermentation process, which is consistent with the findings of Rezaei et al. [21]. The LAB group also featured better fermentation quality than the CON group, as LAB can produce lactic acid which can further decrease the pH of silage [22]. In addition, the LM group had the highest lactic acid content and the lowest pH, indicating a synergetic effect of LAB and its substrate that could facilitate fermentation. BA in silage is a sign of poor fermentation and will decrease the dry matter intake of ruminants [5]. In this study, only the CON group had trace levels of BA detected, suggesting that the involvement of the tested silage additives can alter the PM fermentation profile, and decrease the amount of BA produced. Ammonia-N is produced by the degradation of protein and the diammoniate of amino acids [23]. Silages in this study treated with additives of LAB and LM had lower ammonia-N contents than in the CON group, indicating that less CP was degraded and the PM silage nutritional quality was maintained. However, the MOL group showed a much higher ammonia-N content than the other two additive treated groups, which might be attributed to a degradation of CP that is similar to the CON group. Due to the inconsistent results of the molasses additive effect on the ammonia-N concentration in the silages, there seems to be an interaction between different crops, legumes, grass silage and molasses, which warrants further attention [24,25].

4.2. In Vitro Ruminal GP Characteristics and Ammonia-N and VFA

The IVDMD of a certain feed material largely depends on its carbohydrate composition [26]. Our results showed no difference in IVDMD existed among the four groups of PM silage, indicating that additives could not alter the carbohydrate composition of PM silage, particularly the NDF and ADF content. The LM group had a higher ammonia-N content than the CON group. However, Babaeinasab et al. [7] suggested that silage with molasses or LAB additives had no influence on ammonia-N concentrations during in vitro fermentation. The inconsistency between results of different studies may arise from different kinds of forage silage being used as the fermentation substance, which would have inherently different chemical compositions and IVDMD. In our study, the additives clearly improved GP48 and AGPR. Rezaei [21] showed that silage containing an additive, such as LAB or molasses, can improve its GP48, probably because either additive decreases the cell wall content. Both studies’ findings are consistent with our results for PM silage.

4.3. In Situ Ruminal Degradation Characteristics

Many researchers have demonstrated that silage additives, such as LAB, can improve the feed efficiency of silage by improving the fermentation profile [6]. In this study, compared with other groups, silage from the LM group had a lower ruminal fluid pH than the CON and LAB groups, which may represent a relatively better fermentation quality in the LM group. Therefore, the LM and CON groups were chosen for further in situ digestibility experimentation. The results showed the rapidly soluble fraction and ED of DM were greater for the LM group than the CON group, which is similar to that reported by Abbasi et al. [8]. Furthermore, the CP degradation parameters for the rapidly soluble fraction in the LM group exceeded those of the CON group. A plausible explanation for this is that the LM group’s PM silage contained more soluble true protein, such as in the form of non-ammonia N [27]. It has also been reported that DM digestibility is negative correlated to the content of NDF and ADF [28]. The ruminal degradation kinetics parameters of NDF were inconsistent with the findings of Li et al. [28]. However, the ED of ADF in the LM group exceeded that of the CON group. This may be related to the fact the LM group had a better fermentation profile than the CON group and the specific mechanism needs further study.

5. Conclusions

Both MOL and LAB can help decrease the pH of PM silage. Combining the two additives can better improve the PM silage for the highest LA content and lowest pH. Additionally, LM can enhance PM silage’s in situ DM degradability and the ED of ADF. Therefore, either MOL or LAB or their combination can be used as additives in the process of PM silage-making, which offers a better strategy for improving the quality of the PM silage fed to ruminants. At the same time, there is still need for further research to identify ways to lower the pH of PM silage for better fermentable quality.

Supplementary Materials

The following supporting information can be downloaded at: https://www.mdpi.com/article/10.3390/fermentation8090435/s1, Table S1: Ingredient and chemical composition of the basal diet fed fistulated cows during the in vitro and in situ experiment (DM basis).

Author Contributions

Conceptualization, W.W. and Y.H.; data collection: Q.W., Z.W., D.L. and J.Y.; writing—original draft preparation: W.W. and C.L.; resources, W.W. and Y.H.; writing—review and editing: Z.C., H.Y. and S.L. All authors have read and agreed to the published version of the manuscript.

Funding

This research was funded by the “Beijing Key Research and Development Program (Z191100004019023)”, and the “China Agriculture Research System of MOF and MARA (Dairy Cows) (CARS-36)”.

Institutional Review Board Statement

The in situ experimental procedures were approved by the Ethical Committee of the College of Animal Science and Technology of China Agricultural University.

Informed Consent Statement

Not applicable.

Data Availability Statement

All the data are provided in the main manuscript.

Acknowledgments

We thank the Beijing Key Research and Development Program and the China Agriculture Research System of MOF and MARA (Dairy Cows) for their financial support.

Conflicts of Interest

There are no relevant financial or non-financial competing interests.

References

  1. Peng, X.; Wang, Y.; He, R.; Zhao, M.; Shen, S. Global transcriptomics identification and analysis of transcriptional factors in different tissues of the paper mulberry. BMC Plant Biol. 2014, 14, 194. [Google Scholar] [CrossRef] [PubMed]
  2. Li, G.Y.; Hu, N.; Ding, D.X.; Zheng, J.F.; Liu, Y.L.; Wang, Y.D.; Nie, X.Q. Screening of plant species for phytoremediation of uranium, thorium, barium, nickel, strontium and lead contaminated soils from a uranium mill tailings repository in South China. Bull. Environ. Contam. Toxicol. 2011, 86, 646–652. [Google Scholar] [CrossRef] [PubMed]
  3. Penailillo, J.; Olivares, G.; Moncada, X.; Payacan, C.; Chang, C.S.; Chung, K.F.; Matthews, P.J.; Seelenfreund, A.; Seelenfreund, D. Sex Distribution of Paper Mulberry (Broussonetia papyrifera) in the Pacific. PLoS ONE 2016, 11, e0161148. [Google Scholar] [CrossRef]
  4. Si, B.; Tao, H.; Zhang, X.; Guo, J.; Cui, K.; Tu, Y.; Diao, Q. Effect of Broussonetia papyrifera L. (paper mulberry) silage on dry matter intake, milk composition, antioxidant capacity and milk fatty acid profile in dairy cows. Asian-Australas. J. Anim. Sci. 2018, 31, 1259–1266. [Google Scholar] [CrossRef] [PubMed]
  5. Grant, R.J.; Ferraretto, L.F. Silage review: Silage feeding management: Silage characteristics and dairy cow feeding behavior. J. Dairy Sci. 2018, 101, 4111–4121. [Google Scholar] [CrossRef] [PubMed]
  6. Muck, R.E.; Nadeau, E.M.G.; McAllister, T.A.; Contreras-Govea, F.E.; Santos, M.C.; Kung, L., Jr. Silage review: Recent advances and future uses of silage additives. J. Dairy Sci. 2018, 101, 3980–4000. [Google Scholar] [CrossRef]
  7. Babaeinasab, Y.; Rouzbehan, Y.; Fazaeli, H.; Rezaei, J. Chemical composition, silage fermentation characteristics, and in vitro ruminal fermentation parameters of potato-wheat straw silage treated with molasses and lactic acid bacteria and corn silage. J. Anim. Sci. 2015, 93, 4377–4386. [Google Scholar] [CrossRef]
  8. Abbasi, M.; Rouzbehan, Y.; Rezaei, J.; Jacobsen, S.E. The effect of lactic acid bacteria inoculation, molasses or wilting on the fermentation quality and nutritive value of amaranth (Amaranthus hypochondriaus) silage. J. Anim. Sci. 2018, 96, 3983–3992. [Google Scholar] [CrossRef]
  9. Broderick, G.A.; Kang, J.H. Automated Simultaneous Determination of Ammonia and Total Amino Acids in Ruminal Fluid and In Vitro Media. J. Dairy Sci. 1980, 63, 64–75. [Google Scholar] [CrossRef]
  10. Yuan, X.J.; Wen, A.Y.; Wang, J.; Desta, S.T.; Dong, Z.H.; Shao, T. Effects of four short-chain fatty acids or salts on fermentation characteristics and aerobic stability of alfalfa (Medicago sativa L.) silage. J. Sci. Food Agric. 2018, 98, 328–335. [Google Scholar] [CrossRef]
  11. AOAC. Official Methods of Analysis of AOAC International, 17th ed.; AOAC International: Rockville, MD, USA, 2000. [Google Scholar]
  12. Van Soest, P.J.; Robertson, J.B.; Lewis, B.A. Methods for dietary fiber, neutral detergent fiber, and nonstarch polysaccharides in relation to animal nutrition. J. Dairy Sci. 1991, 74, 3583–3597. [Google Scholar] [CrossRef]
  13. Murphy, R.P. A method for the extraction of plant samples and the determination of total soluble carbohydrates. J. Agric. Food Chem. 1958, 9, 715–717. [Google Scholar] [CrossRef]
  14. Bai, S.; Cao, Z.J.; Cao, B.B.; Yang, H.J.; Li, S.L.; Liu, J.X. Effects of different forage combinations in total mixed rations on in vitro gas production kinetics, ruminal and milk fatty acid profiles of lactating cows. Anim. Sci. J. 2018, 89, 1261–1270. [Google Scholar] [CrossRef]
  15. Menke, K.H.; Stengass, H. Estimation of the energetic feed value obtained from chemical analysis and in vitro gas production using rumen fluid. Anim. Res. Dev. 1988, 28, 7–55. [Google Scholar]
  16. Zhang, D.F.; Yang, H.J. In vitro ruminal methanogenesis of a hay-rich substrate in response to different combination supplements of nitrocompounds; pyromellitic diimide and 2-bromoethanesulphonate. Anim. Feed Sci. Technol. 2011, 163, 20–32. [Google Scholar] [CrossRef]
  17. Mehrez, A.Z.; Orskov, E.R.; Mcdonald, I. Rates of Rumen Fermentation in Relation to Ammonia Concentration. Br. J. Nutr. 1977, 38, 437–443. [Google Scholar] [CrossRef]
  18. Groot, J.C.J.; Cone, J.W.; Williams, B.A.; Debersaques, F.M.A.; Lantinga, E.A. Multiphasic analysis of gas production kinetics for in vitro fermentation of ruminant feeds. Anim. Feed Sci. Technol. 1996, 64, 77–89. [Google Scholar] [CrossRef]
  19. Orskov, E.R.; McDonald, I. Estimation of Protein Degradability in the Rumen from Incubation Measurements Weighted According to Rate of Passage. J. Agric. Sci. 1979, 92, 499–503. [Google Scholar] [CrossRef]
  20. Batajoo, K.K.; Shaver, R.D. Impact of nonfiber carbohydrate on intake, digestion, and milk production by dairy cows. J. Dairy Sci. 1994, 77, 1580–1588. [Google Scholar] [CrossRef]
  21. Rezaei, J.; Rouzbehan, Y.; Fazaeli, H. Nutritive value of fresh and ensiled amaranth (Amaranthus hypochondriacus) treated with different levels of molasses. Anim. Feed Sci. Technol. 2009, 151, 153–160. [Google Scholar] [CrossRef]
  22. Yang, J.; Tan, H.; Cai, Y. Characteristics of lactic acid bacteria isolates and their effect on silage fermentation of fruit residues. J. Dairy Sci. 2016, 99, 5325–5334. [Google Scholar] [CrossRef] [PubMed] [Green Version]
  23. Silva, V.P.; Pereira, O.G.; Leandro, E.S.; Da Silva, T.C.; Ribeiro, K.G.; Mantovani, H.C.; Santos, S.A. Effects of lactic acid bacteria with bacteriocinogenic potential on the fermentation profile and chemical composition of alfalfa silage in tropical conditions. J. Dairy Sci. 2016, 99, 1895–1902. [Google Scholar] [CrossRef]
  24. Xia, C.; Liang, Y.; Bai, S.; He, Y.; Muhammad, A.U.R.; Su, H.; Cao, B. Effects of harvest time and added molasses on nutritional content, ensiling characteristics and in vitro degradation of whole crop wheat. Asian-Australas. J. Anim. Sci. 2018, 31, 354. [Google Scholar] [CrossRef] [PubMed]
  25. Hashemzadeh-Cigari, F.; Khorvash, M.; Ghorbani, G.; Ghasemi, E.; Taghizadeh, A.; Kargar, S.; Yang, W. Interactive effects of molasses by homofermentative and heterofermentative inoculants on fermentation quality, nitrogen fractionation, nutritive value and aerobic stability of wilted alfalfa (Medicago sativa L.) silage. J. Anim. Physiol. Anim. Nutr. 2014, 98, 290–299. [Google Scholar] [CrossRef]
  26. Raffrenato, E.; Fievisohn, R.; Cotanch, K.W.; Grant, R.J.; Chase, L.E.; Van Amburgh, M.E. Effect of lignin linkages with other plant cell wall components on in vitro and in vivo neutral detergent fiber digestibility and rate of digestion of grass forages. J. Dairy Sci. 2017, 100, 8119–8131. [Google Scholar] [CrossRef]
  27. Satter, L.D. Protein supply from undegraded dietary protein. J. Dairy Sci. 1986, 69, 2734–2749. [Google Scholar] [CrossRef]
  28. Li, Q.; Xue, B.; Zhao, Y.; Wu, T.; Liu, H.; Yi, X.; Sun, C.; Wang, Z.; Zou, H.; Yan, T. In situ degradation kinetics of 6 roughages and the intestinal digestibility of the rumen undegradable protein. J. Anim. Sci. 2018, 96, 4835–4844. [Google Scholar] [CrossRef] [PubMed]
Figure 1. The rumen in situ real-time degradation rates of PM silage DM, CP, NDF, and ADF. The * denotes p < 0.05 between the two groups compared; values are expressed as the mean ± SE; DM, dry matter; CP, crude protein; NDF, neutral detergent fiber assayed with a heat stable amylase and expressed inclusive of residual ash; ADF, acid detergent fiber expressed (inclusive of residual ash); CON, no additive group; LM, lactic acid bacteria and molasses group.
Fermentation 08 00435 g001
Table 1. Effects of different additives on the chemical composition of paper mulberry silage.
Groups 1DMChemical Composition 2 (% DM)
CPNDFADFEEASHWSC
Fresh26.76 ± 0.3618.24 ± 1.0335.68 ± 1.4234.12 ± 0.873.45 ± 0.579.86 ± 0.45 b3.32 ± 0.03 a
CON27.35 ± 0.2718.19 ± 1.9739.15 ± 0.7832.46 ± 1.383.85 ± 0.7511.51 ± 0.33 a2.26 ± 0.02 b
LAB27.13 ± 0.3319.03 ± 0.3440.15 ± 0.9233.05 ± 1.094.12 ± 0.0312.23 ± 0.79 a1.68 ± 0.02 c
MOL26.86 ± 0.3818.53 ± 0.1644.37 ± 1.2932.84 ± 2.064.18 ± 0.0212.29 ± 0.15 a3.17 ± 0.03 a
LM26.94 ± 0.2319.78 ± 1.3841.39 ± 2.4933.75 ± 1.583.80 ± 0.2011.63 ± 0.39 a2.56 ± 0.04 b
Values are expressed as the mean ± SE. Different letters indicate significant differences within columns (a < b < c, at p < 0.05); 1 CON, no additive group; LAB, Lactobacillus Plantarum group; MOL, molasses group; LM, LAB and molasses group.; 2 DM, dry matter; CP, crude protein; NDF, neutral detergent fiber assayed with a heat-stable amylase and expressed inclusive of residual ash; ADF, acid detergent fiber expressed (inclusive of residual ash); EE, ether extract; WSC, water-soluble carbohydrate.
Table 2. Effects of different additives on the fermentation profile of paper mulberry silage.
Groups 1pHNH3-N
(% TN)
Organic Acid 2 (% DM)
LAAAPABA
CON5.26 ± 0.06 a7.78 ± 0.13 a6.72 ± 0.98 c3.75 ± 0.21 a1.32 ± 0.13 ab0.0007 ± 0.12
LAB4.44 ± 0.02 c2.07 ± 0.20 b10.21 ± 0.14 b1.48 ± 0.54 b0.90 ± 0.78 abND
MOL4.93 ± 0.05 b7.17 ± 0.57 a7.73 ± 0.54 c3.70 ± 0.23 a1.55 ± 0.26 aND
LM4.19 ± 0.05 d1.49 ± 0.22 b12.0 ± 0.99 a0.91 ± 0.04 b0.48 ± 0.22 bND
Values are expressed as mean ± SE. Different letters indicate significant differences within columns (a < b < c < d, p < 0.05); 1 CON, no additive group; LAB, Lactobacillus Plantarum group; MOL, molasses group; LM, LAB and molasses group.; 2 NH3-N, ammonia nitrate; TN, total nitrate; LA, lactic acid; AA, acetic acid; PA, propionic aid; BA, butyric acid; DM, dry matter; ND, no detection.
Table 3. Effects of paper mulberry silage treated with different additives on the in vitro degradability of DM, ruminal liquid pH, VFAs, and ammonia after 48 h of incubation.
Groups 1CONLABMOLLM
IVDMD (%)75.95 ± 0.8578.66 ± 2.2675.91 ± 0.9575.63 ± 6.32
pH6.97 ± 0.02 a6.97 ± 0.07 a6.88 ± 0.04 ab6.80 ± 0.11 b
NH3-N (mg/dL)12.94 ± 0.20 b13.64 ± 2.08 ab13.52 ± 0.42 b14.34 ± 0.43 a
Acetic acid (mmol/L)47.61 ± 3.1049.06 ± 1.4448.77 ± 2.6448.28 ± 0.66
Propionic acid (mmol/L)19.64 ± 2.1920.40 ± 0.8819.22 ± 0.8919.73 ± 0.24
Butyric acid (mmol/L)7.61 ± 3.13 b9.45 ± 0.37 a8.95 ± 0.41 ab9.18 ± 0.28 a
Isobutyric acid (mmol/L)0.99 ± 0.131.11 ± 0.130.94 ± 0.140.85 ± 0.03
Valeric acid (mmol/L)2.19 ± 0.182.20 ± 0.102.15 ± 0.132.21 ± 0.06
Isovaleric acid (mmol/L)2.72 ± 0.662.12 ± 0.062.00 ± 0.112.06 ± 0.07
TVFA (mmol/L)81.78 ± 6.1884.35 ± 2.7982.02 ± 3.9782.31 ± 1.20
Values are expressed as the mean ± SE. Different letters indicate significant differences within columns (a < b, at p < 0.05); IVDMD, in vitro dry matter digestibility; NH3-N, ammoniacal nitrogen; VFA, volatile fatty acid; TVFA, total volatile fatty acid.; 1 CON, no additive group; LAB, Lactobacillus Plantarum group; MOL, molasses group; LM, LAB and molasses group.
Table 4. Effects of paper mulberry silage treated with different additives on the in vitro gas production, and kinetic parameters after 48 h of incubation.
Groups 1CONLABMOLLM
GP48 (mL/g)76.86 ± 3.31 b82.15 ± 0.59 ab84.16 ± 3.84 a87.05 ± 4.85 a
A80.28 ± 10.2382.95 ± 0.6785.18 ± 12.5986.55 ± 4.82
B1.35 ± 0.08 c1.66 ± 0.10 b1.54 ± 0.06 b1.83 ± 0.06 a
C5.45 ± 0.91 a3.51 ± 0.31 b3.30 ± 0.20 b3.16 ± 0.30 b
AGPR (mL/h)4.22 ± 0.81 b6.06 ± 0.54 a6.56 ± 0.67 a7.05 ± 0.88 a
Values are expressed as the mean ± SE. Different letters indicate significant differences within columns (a < b < c, at p < 0.05); 1 GP48, the cumulative gas production at 48 h; AGPR, the average gas production rate; A, the theoretical maximum gas production; B, the inflection point on the curve parameter; C, the time (h) at which half of the total gas production is reached.; CON, no additive group; LAB, Lactobacillus plantarum group; MOL, molasses group; LM, LAB and molasses group.
Table 5. Ruminal degradation kinetics of DM, CP, NDF, and ADF of paper mulberry silage.
Items 1a (%)b (%)c (%)a + b (%)ED (%)
DMLM32.56 ± 4.89 a47.52 ± 2.08 b6.02 ± 1.3880.08 ± 5.57 a52.51 ± 2.32 a
CON16.64 ± 3.13 b54.09 ± 2.31 a7.87 ± 0.6670.73 ± 1.86 b43.96 ± 3.16 b
CPLM25.26 ± 2.39 a62.55 ± 2.605.40 ± 3.2287.10 ± 3.4248.30 ± 2.66
CON17.57 ± 0.60 b65.87 ± 5.726.23 ± 1.4582.03 ± 4.4045.51 ± 5.26
NDFLM22.55 ± 3.4646.34 ± 3.536.68 ± 3.9868.88 ± 2.7542.67 ± 0.71
CON21.42 ± 2.9045.81 ± 2.845.44 ± 0.9567.22 ± 3.4541.29 ± 2.29
ADFLM14.09 ± 0.4153.34 ± 0.448.97 ± 0.9167.43 ± 0.61 a44.00 ± 0.92 a
CON10.24 ± 2.2452.47 ± 1.607.94 ± 0.3462.72 ± 1.33 b38.13 ± 1.75 b
Values are expressed as the mean ± SE. Different letters indicate significant differences within columns (a < b, at p < 0.05); 1 a, the rapidly soluble fraction; b, the potential degradable fraction; c, the constant rate of degradation of b (%/h); ED, effective degradability; DM, dry matter; CP, crude protein; NDF, neutral detergent fiber assayed with a heat stable amylase and expressed inclusive of residual ash; ADF, acid detergent fiber expressed (inclusive of residual ash); EE, ether extract.; CON, no additive group; LM, LAB and molasses groups.
Publisher’s Note: MDPI stays neutral with regard to jurisdictional claims in published maps and institutional affiliations.

