3.1. Pretreatment
In this study,
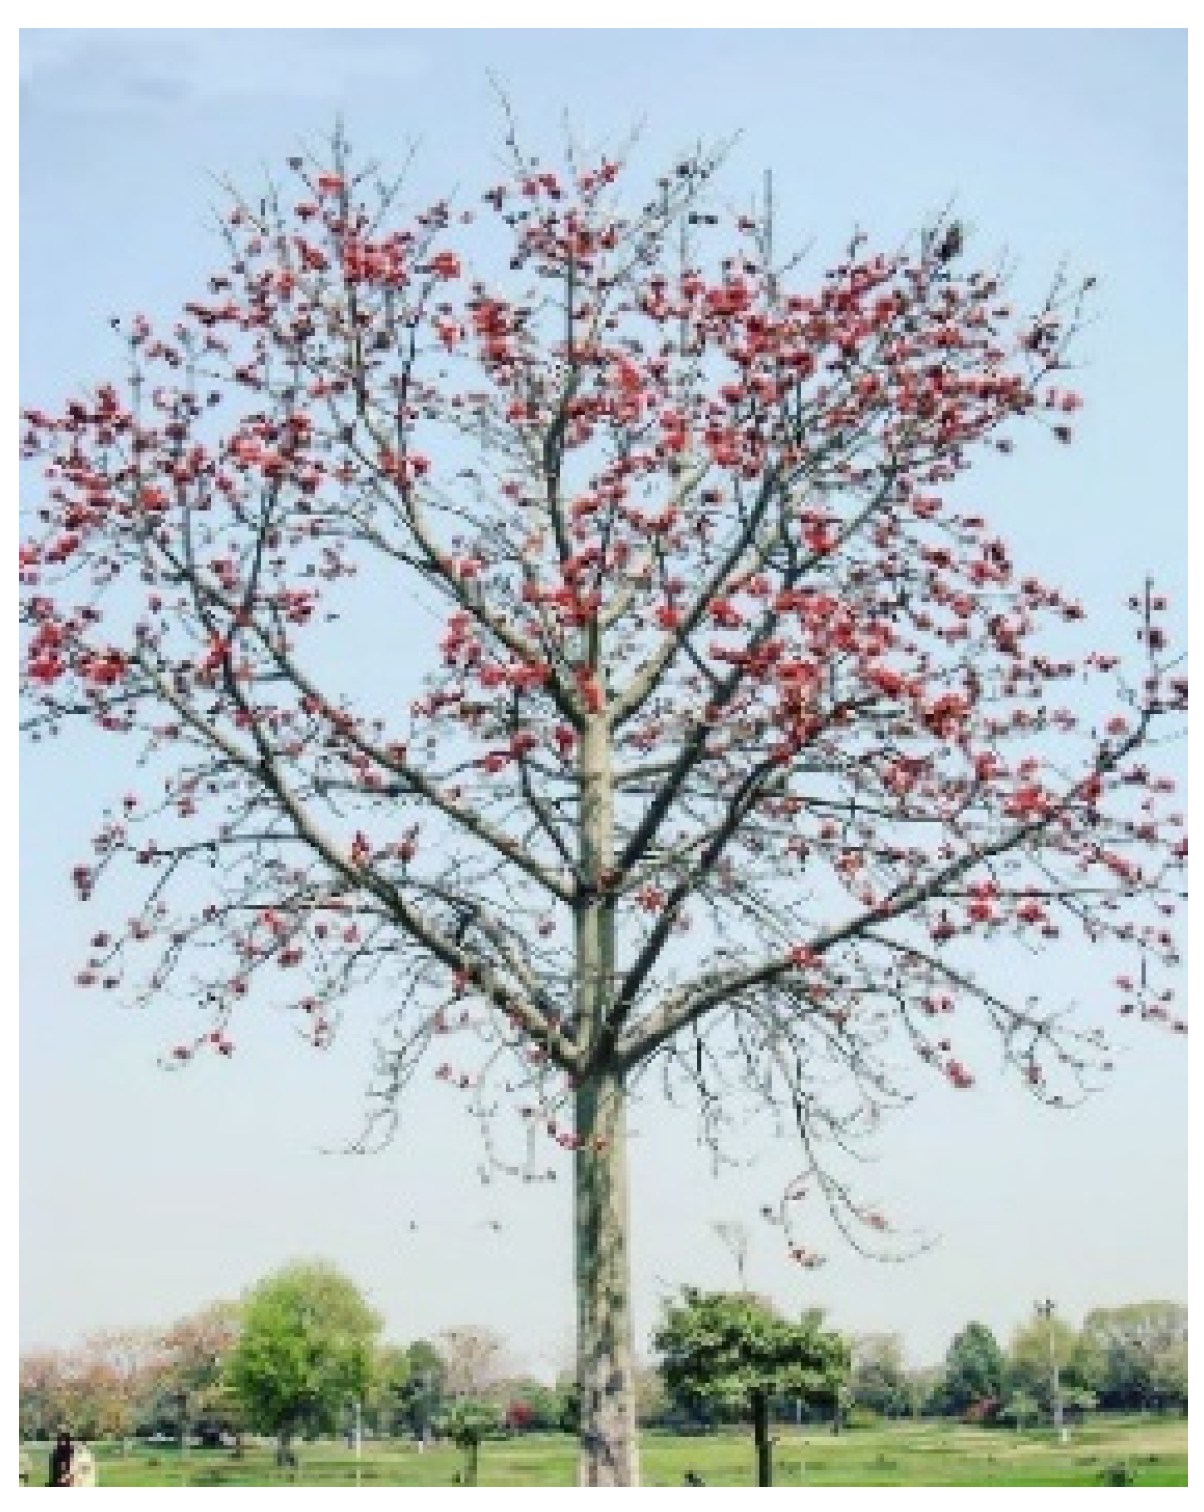
B. ceiba seed pods were pretreated both chemically and thermochemically with different concentrations of NaOH. An analysis of raw seed pods revealed 34% cellulose and 25% lignin. The liberation of TP indicates the degradation of lignin, and the release of RS and TS indicates the hydrolysis of hemicellulose and cellulose contents in the biomass of
B. ceiba. To optimize the pretreatment conditions for maximum lignin breakdown and enhanced cellulose exposure, we applied BBD with three parameters and three levels. Second-order polynomial regression equations (Equations (1)–(8)) were applied to calculate the response (
Table 2 and
Table 3).
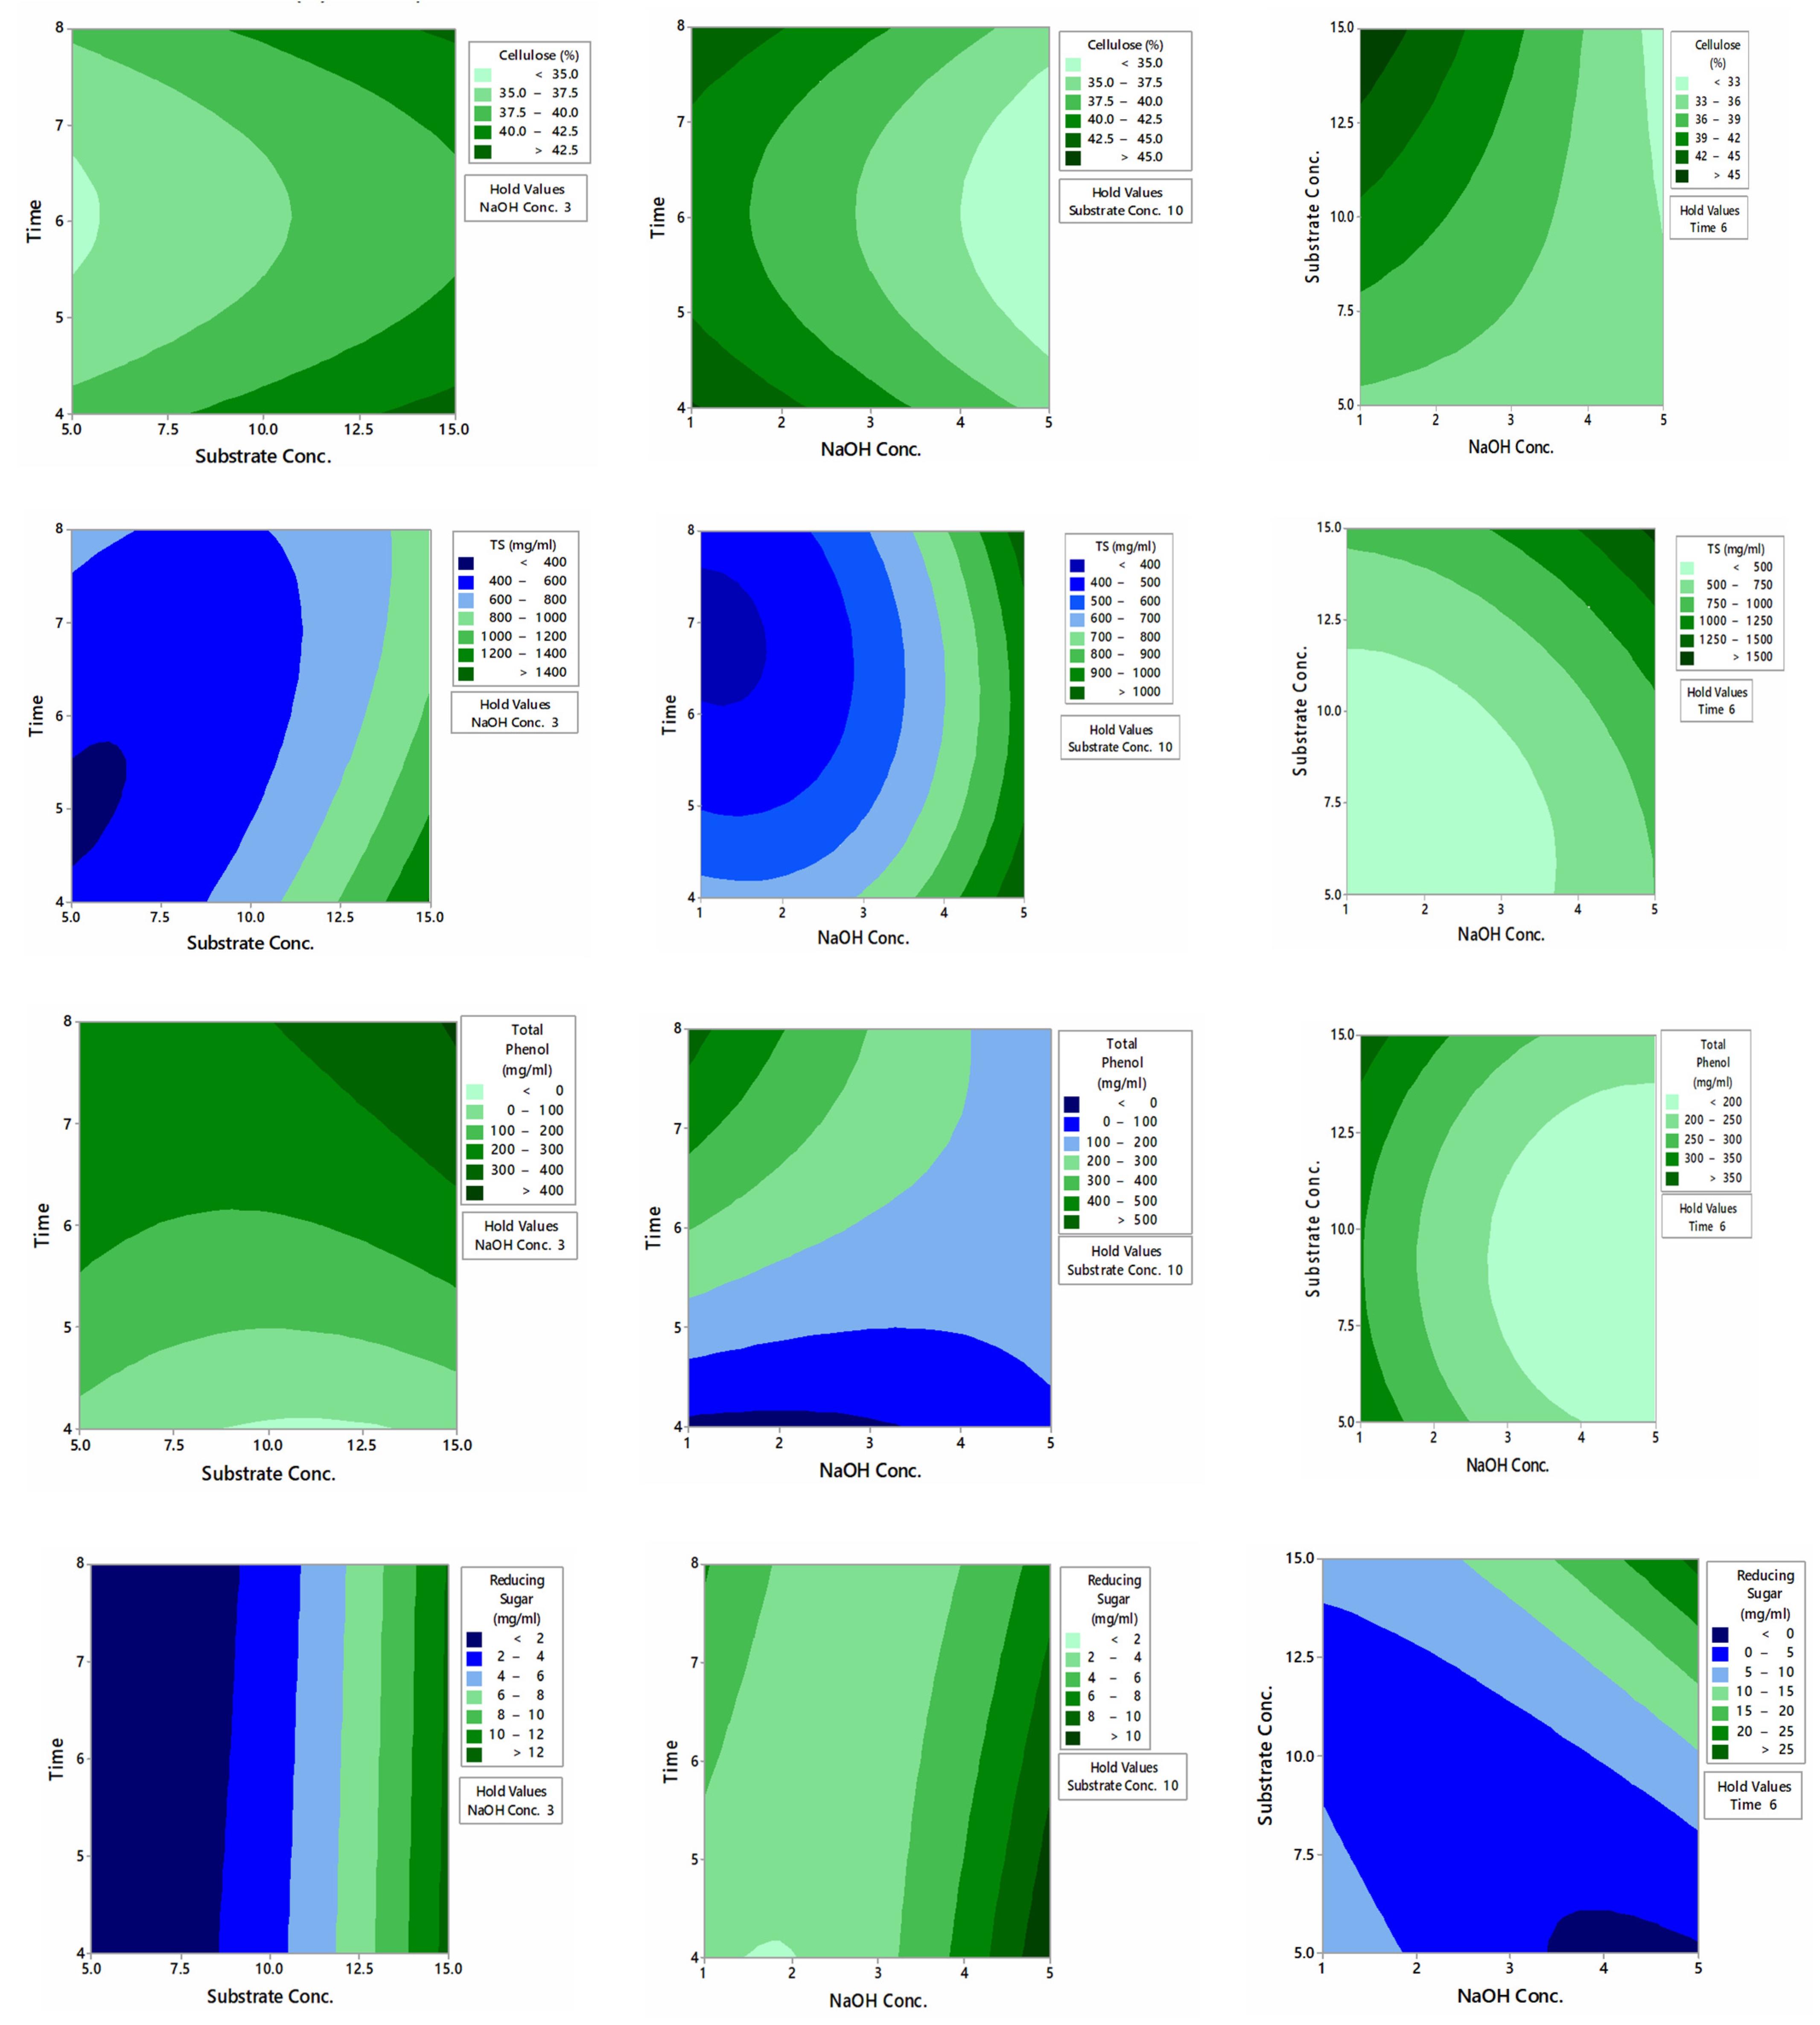
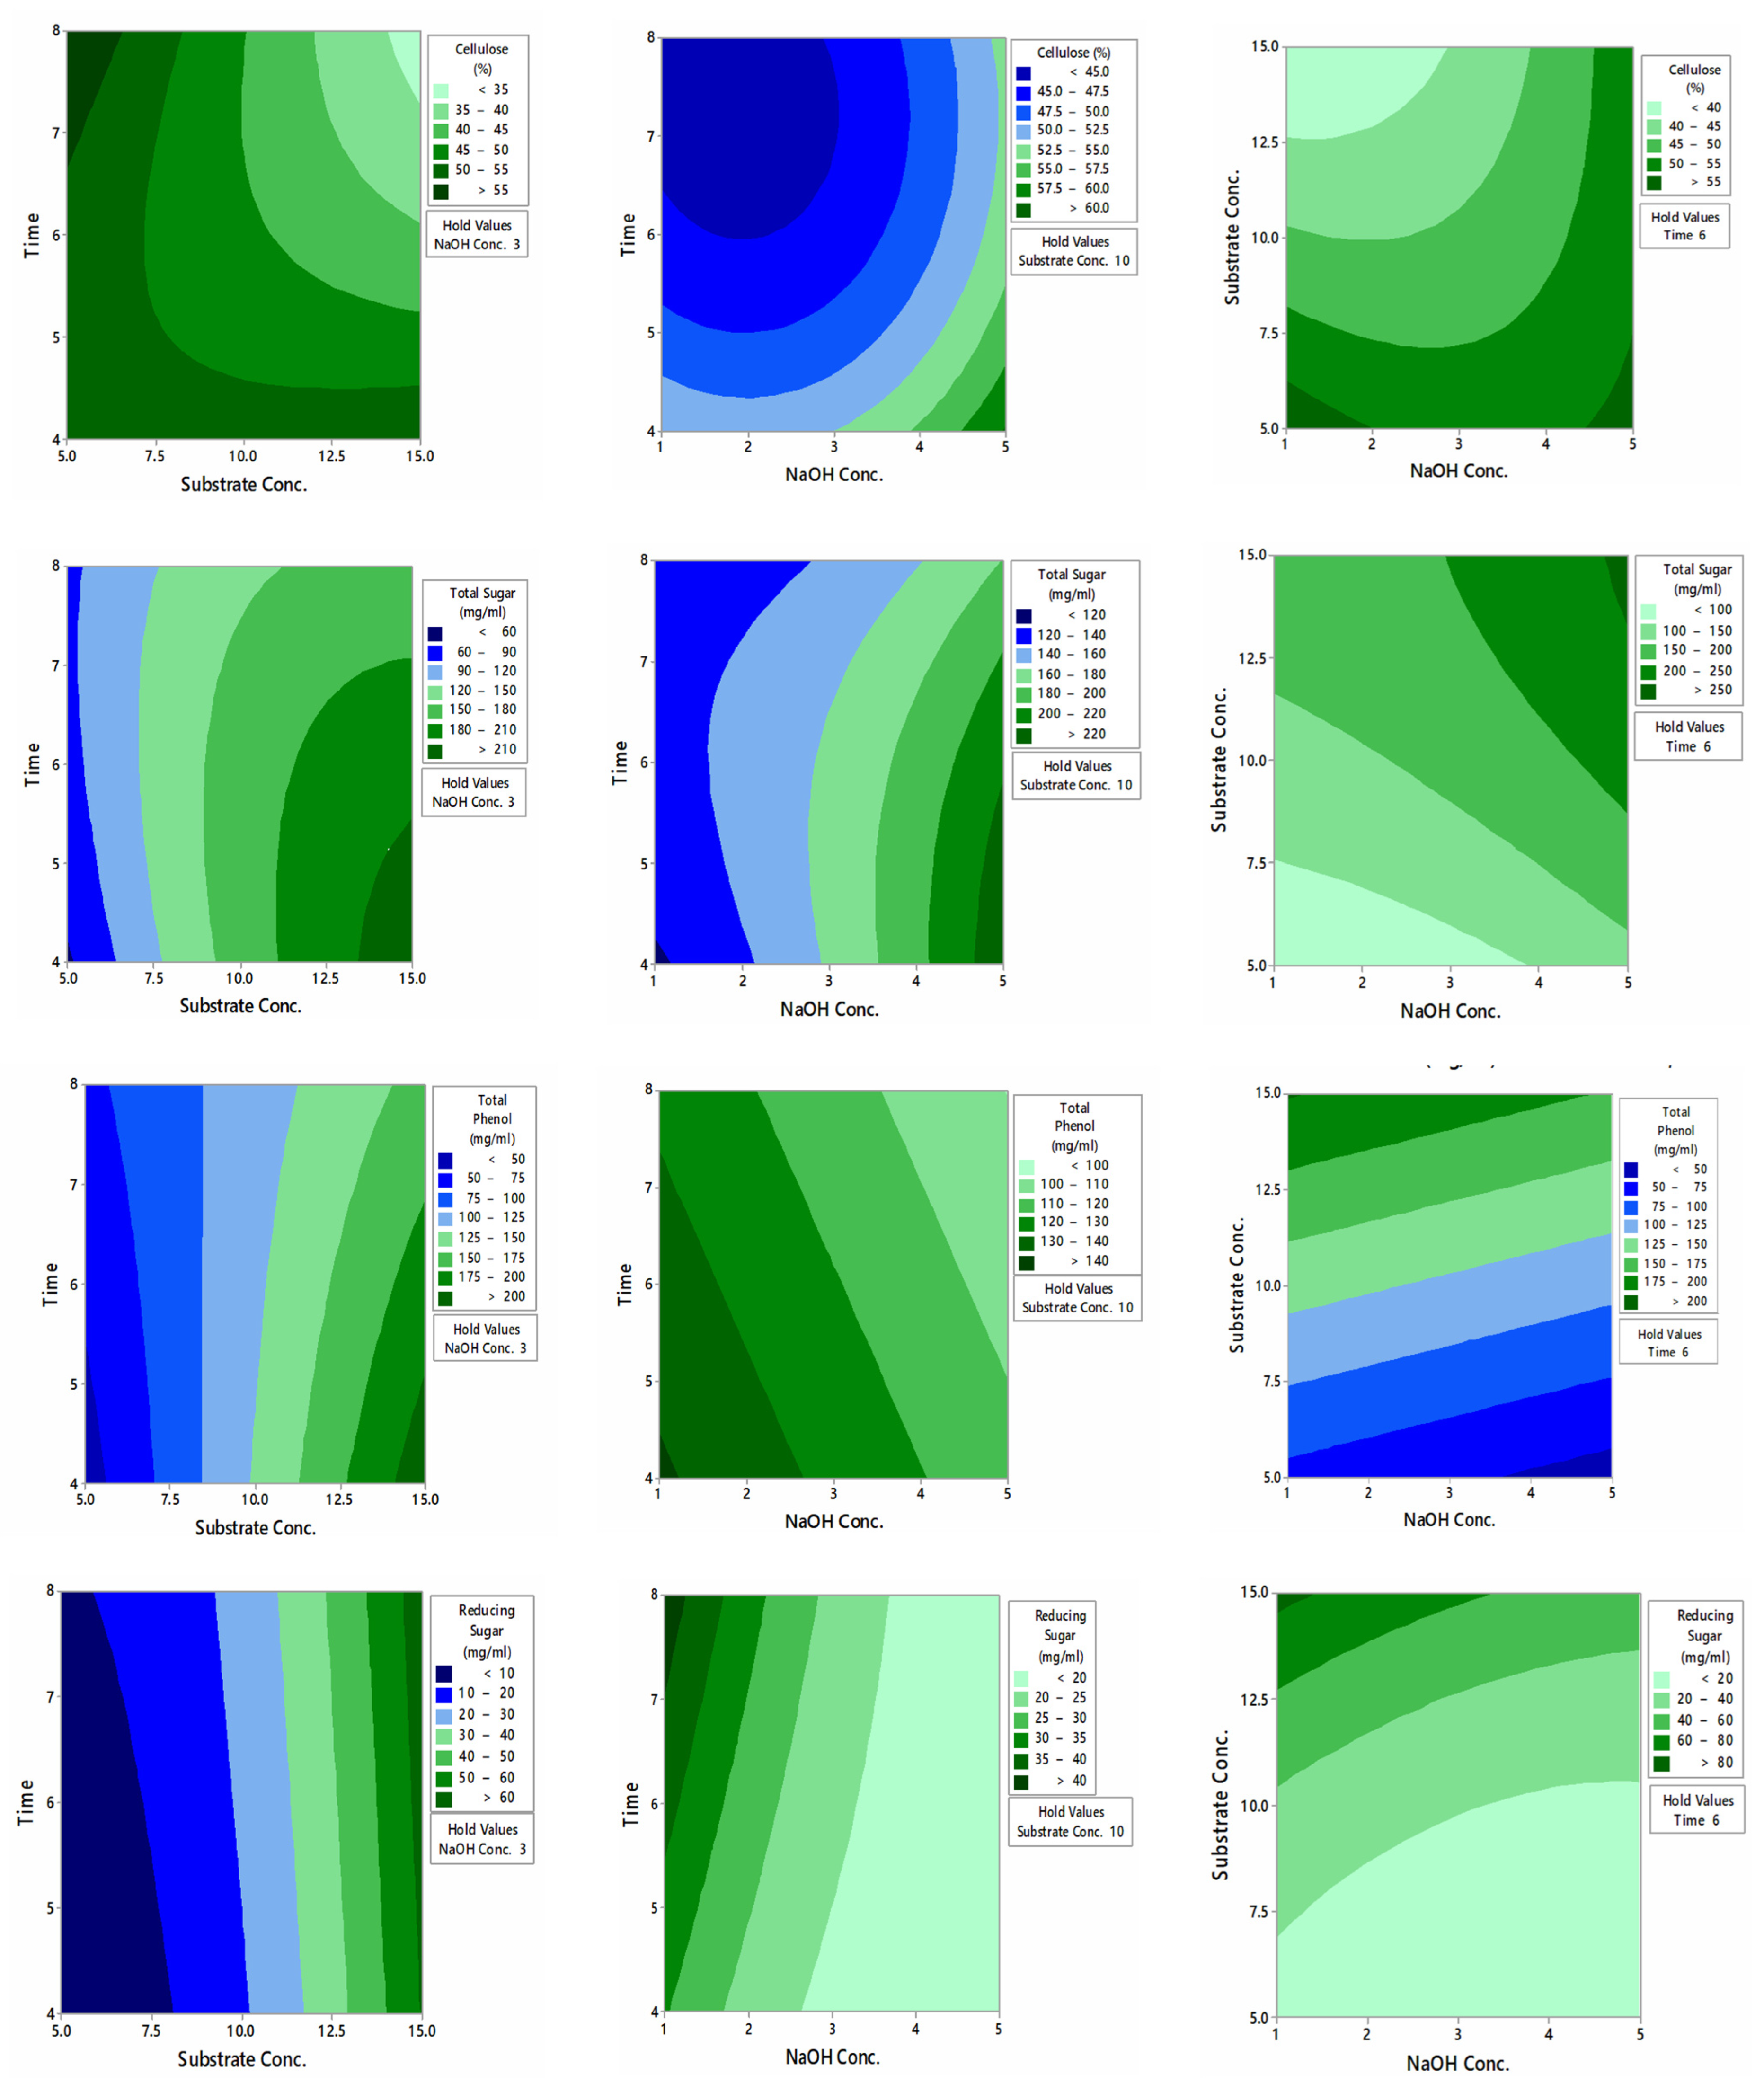
Maximum TP (435.9400 mg/mL) liberated and cellulose (46%) exposed were obtained at 3% (w/v) NaOH concentration and 15% (w/v) substrate loading while the residence time was 8 h, whereas the maximum RS (28.0 mg/mL) and total sugars (1563.4 mg/mL) released at a 5% (w/v) NaOH concentration and 15% (w/v) substrate loading while the soaking time was 6 h. Autoclaving proceeded by NaOH pretreatment was found to be more effectual, releasing maximum TP (246.8 mg/mL) after 4 h soaking time at a 15% substrate concentration, 3% NaOH solution, and reducing sugars up to 87.44 mg/mL at a 1% NaOH solution, 15% substrate concentration, and 6 h residence time. The highest cellulose content exposed (60%) was obtained at a 10% substrate loading, 5% NaOH solution, and 4 h residence time, and TS liberated were 259.57 mg/mL at a 6 h soaking time, 15% substrate concentration, and 5% NaOH solution during thermochemical pretreatment.
Data were analyzed statistically, and regression equations depicted that the results were significant. The thermochemical pretreatment resulted in a greater breakdown of hemicellulose contents and hence liberated more sugars. The Fisher’s F-test values of 31,568.92, 13.05, 28.84, and 38.21 were noticed for TS, cellulose, RS, and TP, respectively, for chemical pretreatment (
Table 4 and
Table 5). The F-test values were found to be 18.09, 101.29, 231.10, and 4398.87 for TP cellulose, RS, and TS, respectively, in the case of thermochemical treatment (
Table 6 and
Table 7). For the chemical treatment, the R
2 values were 100.00%, 87.88%, 98.07%, and 96.65% for TS, cellulose, RS, and TP, respectively. Moreover, the integrity of the model was assisted by adjusted R
2 values (81.14%, 100.00%, 95.51%, and 93.30% for cellulose, TS, RS, and TP, respectively). Thus, the validity of the model was revealed from these values.
Figure 2 and
Figure 3 illustrate contour plots for cellulose, RS, TP, and TS liberated during different pretreatments. These plots depict different ranges of responses by keeping one variable constant and varying the other two variables.
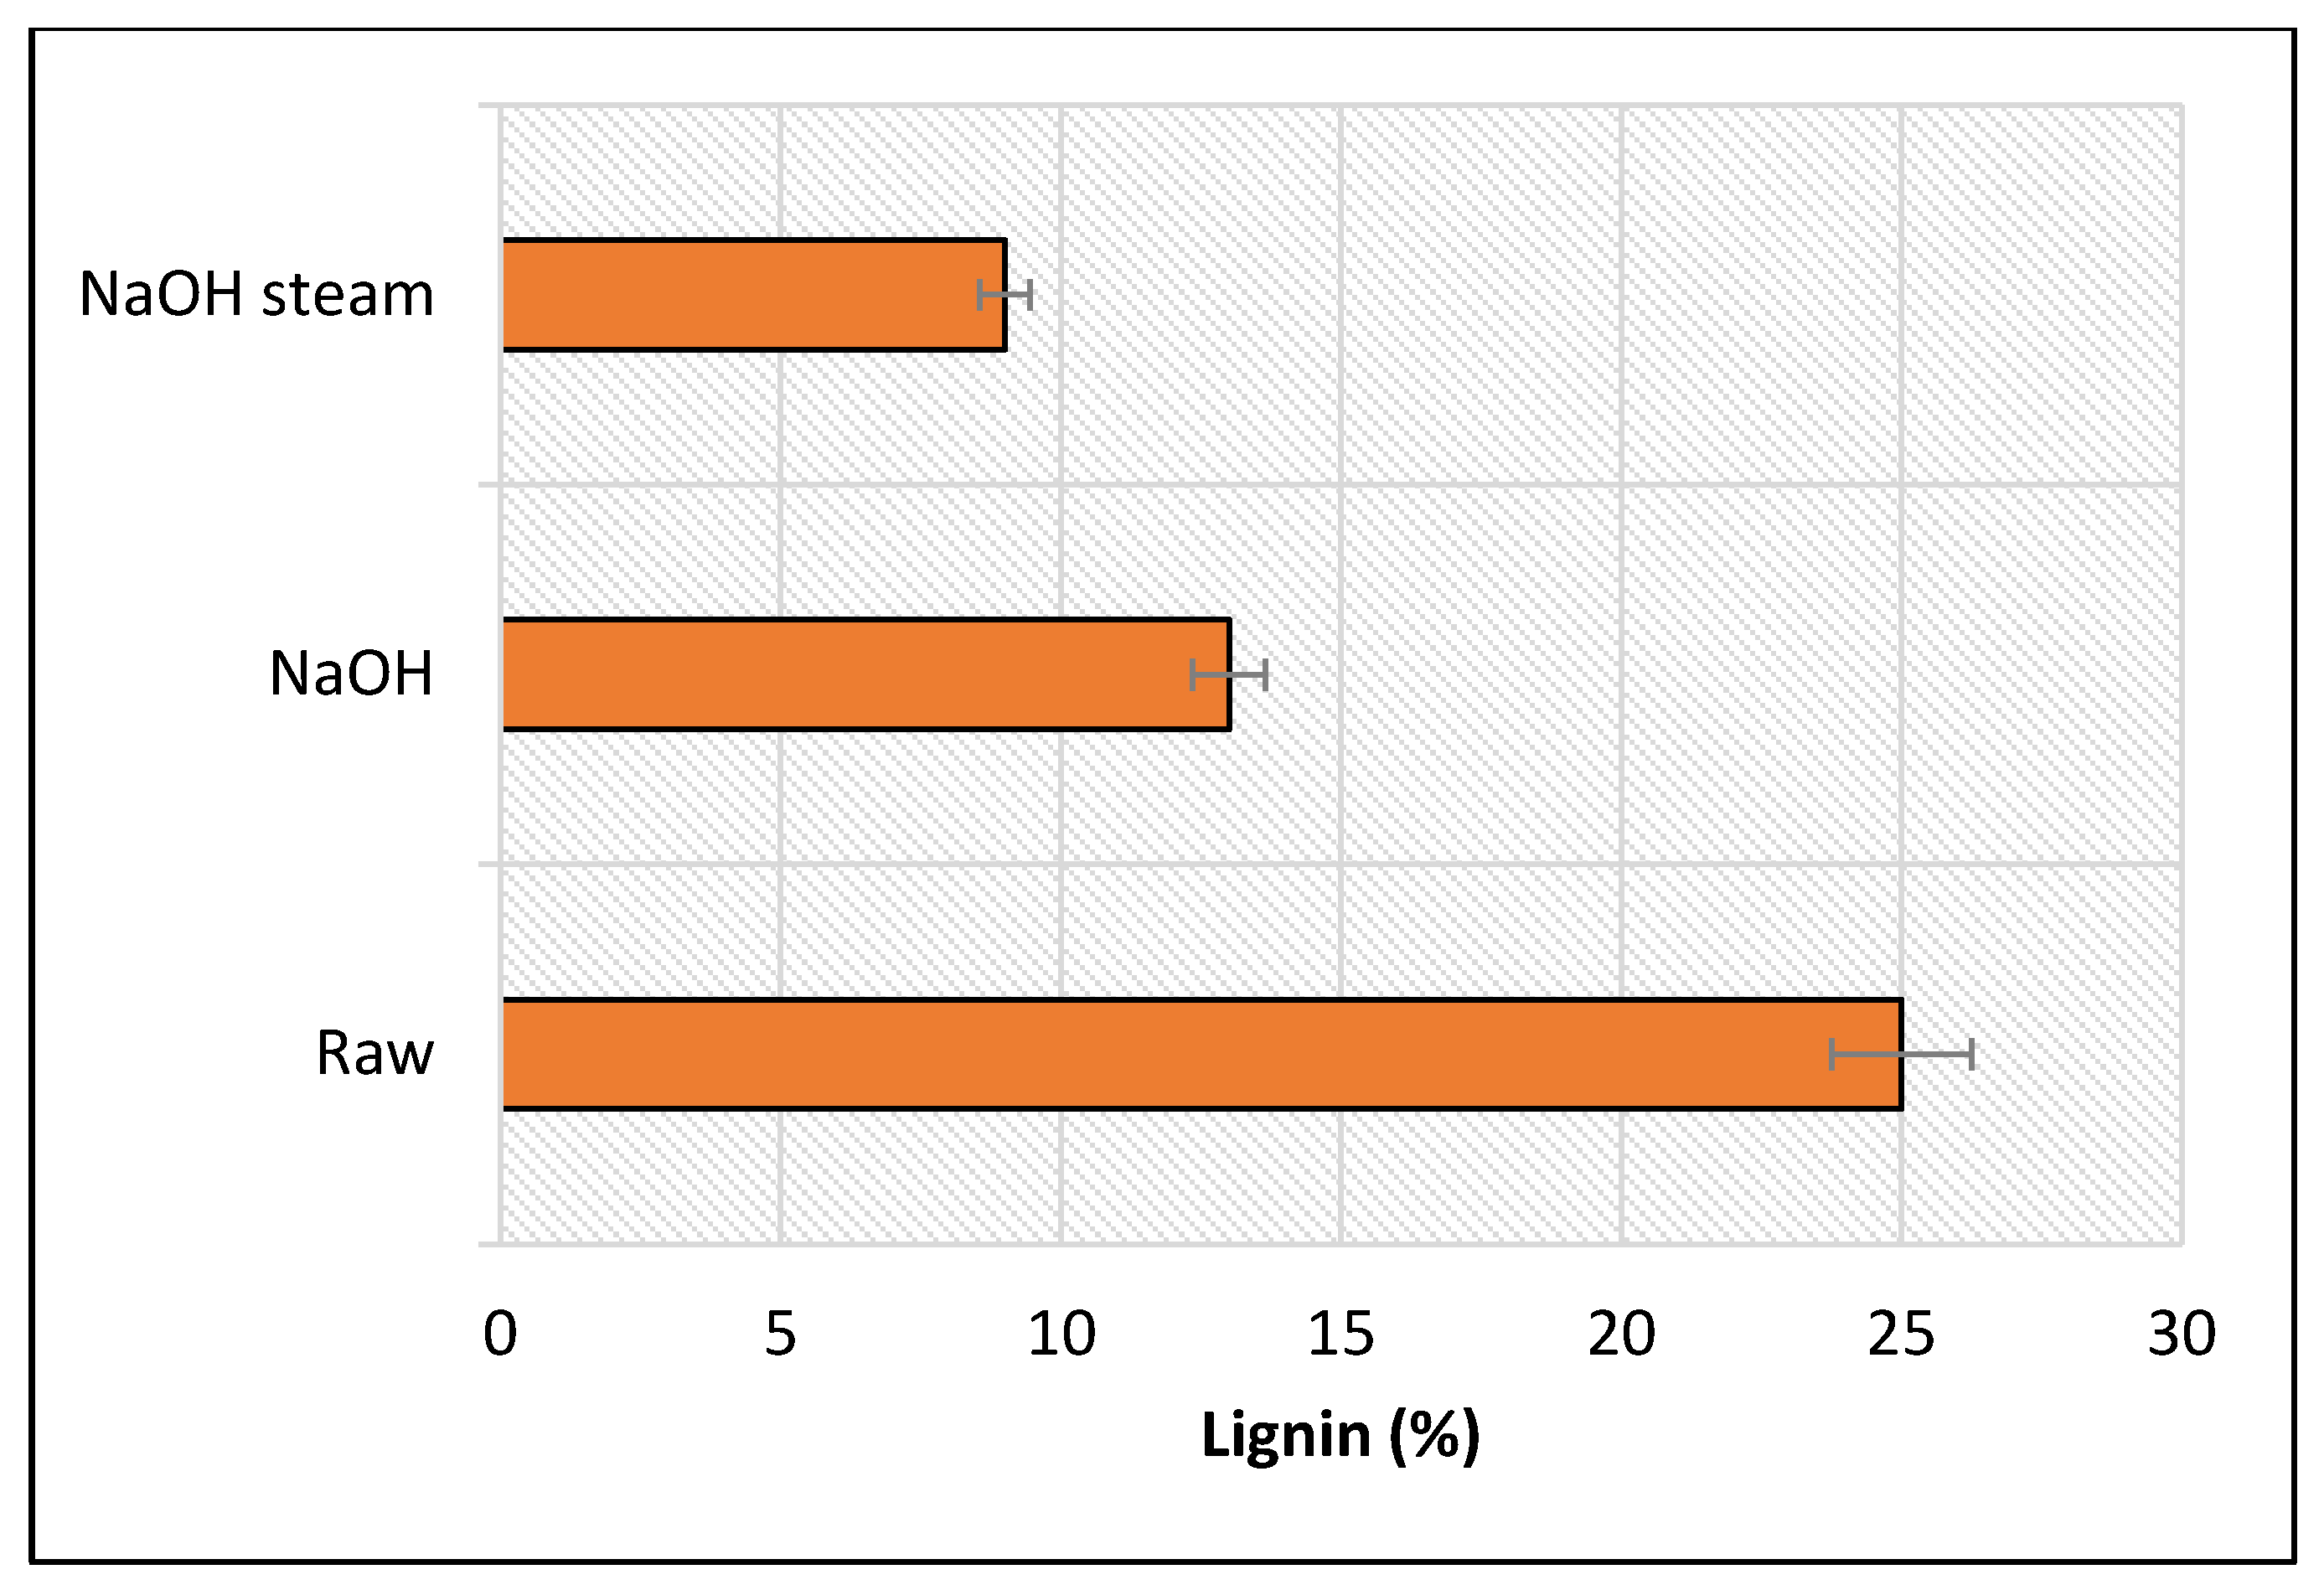
Samples with the maximum cellulose content were analyzed for lignin content. It was found that the sample from the chemical treatment had 15% lignin, while the sample from the thermochemical treatment had 9% lignin, whereas the untreated sample had 25% lignin content (
Figure 4).
Pretreatment of lignocellulosic biomass is required to make saccharifying enzyme accessible to cellulose for hydrolysis to yield high sugar, as lignin is a barrier protecting cellulose against enzyme attack [
30]. Hence, pretreatment prior to saccharification is a mandatory step to minimize the lignin content and enhance the surface area for better enzyme action. In this study, we found that NaOH pretreatment followed by steam was more effective in the delignification of seed pods of
B. ceiba, revealing 60% cellulose and 9% lignin. Cellulose content increased from 34% to 60% due to a reduction in lignin content (from 25% to 9%). Similarly, total sugar, phenol, and reducing sugars liberated were also greater in thermochemical pretreatment compared to chemical treatment alone. Asghar et al. [
32] reported maximum cellulose exposure (60.6%) at 2.5% NaOH after 24 h of soaking in the cotton stalk, whereas the maximum cellulose (73.19%) was obtained at 121 °C after a 1 h soaking time with 2.5% NaOH, and we found 60% cellulose content in seed pods at thermochemical conditions. Ghazanfar and coworkers [
2], using another alkali, found the maximum release of RS (50.06 mg/mL) and TP (394.04 mg/mL) at a 15% substrate concentration, 8 h residence time, and 3% KOH concentration at 121 °C and reported maximum TS (206.65 mg/mL) liberated and cellulose exposed (64%) at the same temperature with a 10% substrate loading and 5% KOH concentration for a 8 h soaking time. Their findings also collaborated with our results, as they obtained maximum cellulose (46%), RS (9.0075 mg/mL), TP (300.3901 mg/mL), and TS (146.1480 mg/mL) at a 15% substrate concentration, using 3% KOH solution, and an 8 h soaking time at room temperature.
Another study by Asghar and fellows [
33] used BBD to optimize pretreatment conditions and found that
Saccharum spontaneum offered maximum cellulose (52.5%) after 24 h of residence time with 2.5% NaOH. In the thermochemical pretreatment,
S. spontaneum was soaked in NaOH solution for 2 h followed by autoclaving for different durations (15–60 min) at 121 °C, suggesting 60 min duration as best for maximum cellulose exposure up to 81.2%. Nadeem et al. [
34] also found results similar to our findings in that physicochemical treatment resulted in a greater breakdown of hemicellulose and lignin and hence liberated more sugars and phenolic contents. They soaked powdered bagasse for 1 h in a NaOH solution of 2.5% and then autoclaved for 45 min at 126 °C and achieved 9% lignin and 74% cellulose content, whereas untreated substrate had 35% cellulose content and 25% lignin. The results of Sarbishei and coworkers [
35] were opposite to our results because they noted a decline in cellulosic contents (from 44% to 27.6%) of tobacco product waste after 10% NaOH pretreatment because of the hydrolysis of carbohydrates by alkali. A recent study by Gunam et al. [
36] found maximum cellulose of 65.46% from pretreatment of corn straw with 4% NaOH.
Regression equations for NaOH pretreatment:
Regression equations for NaOH steam pretreatment:
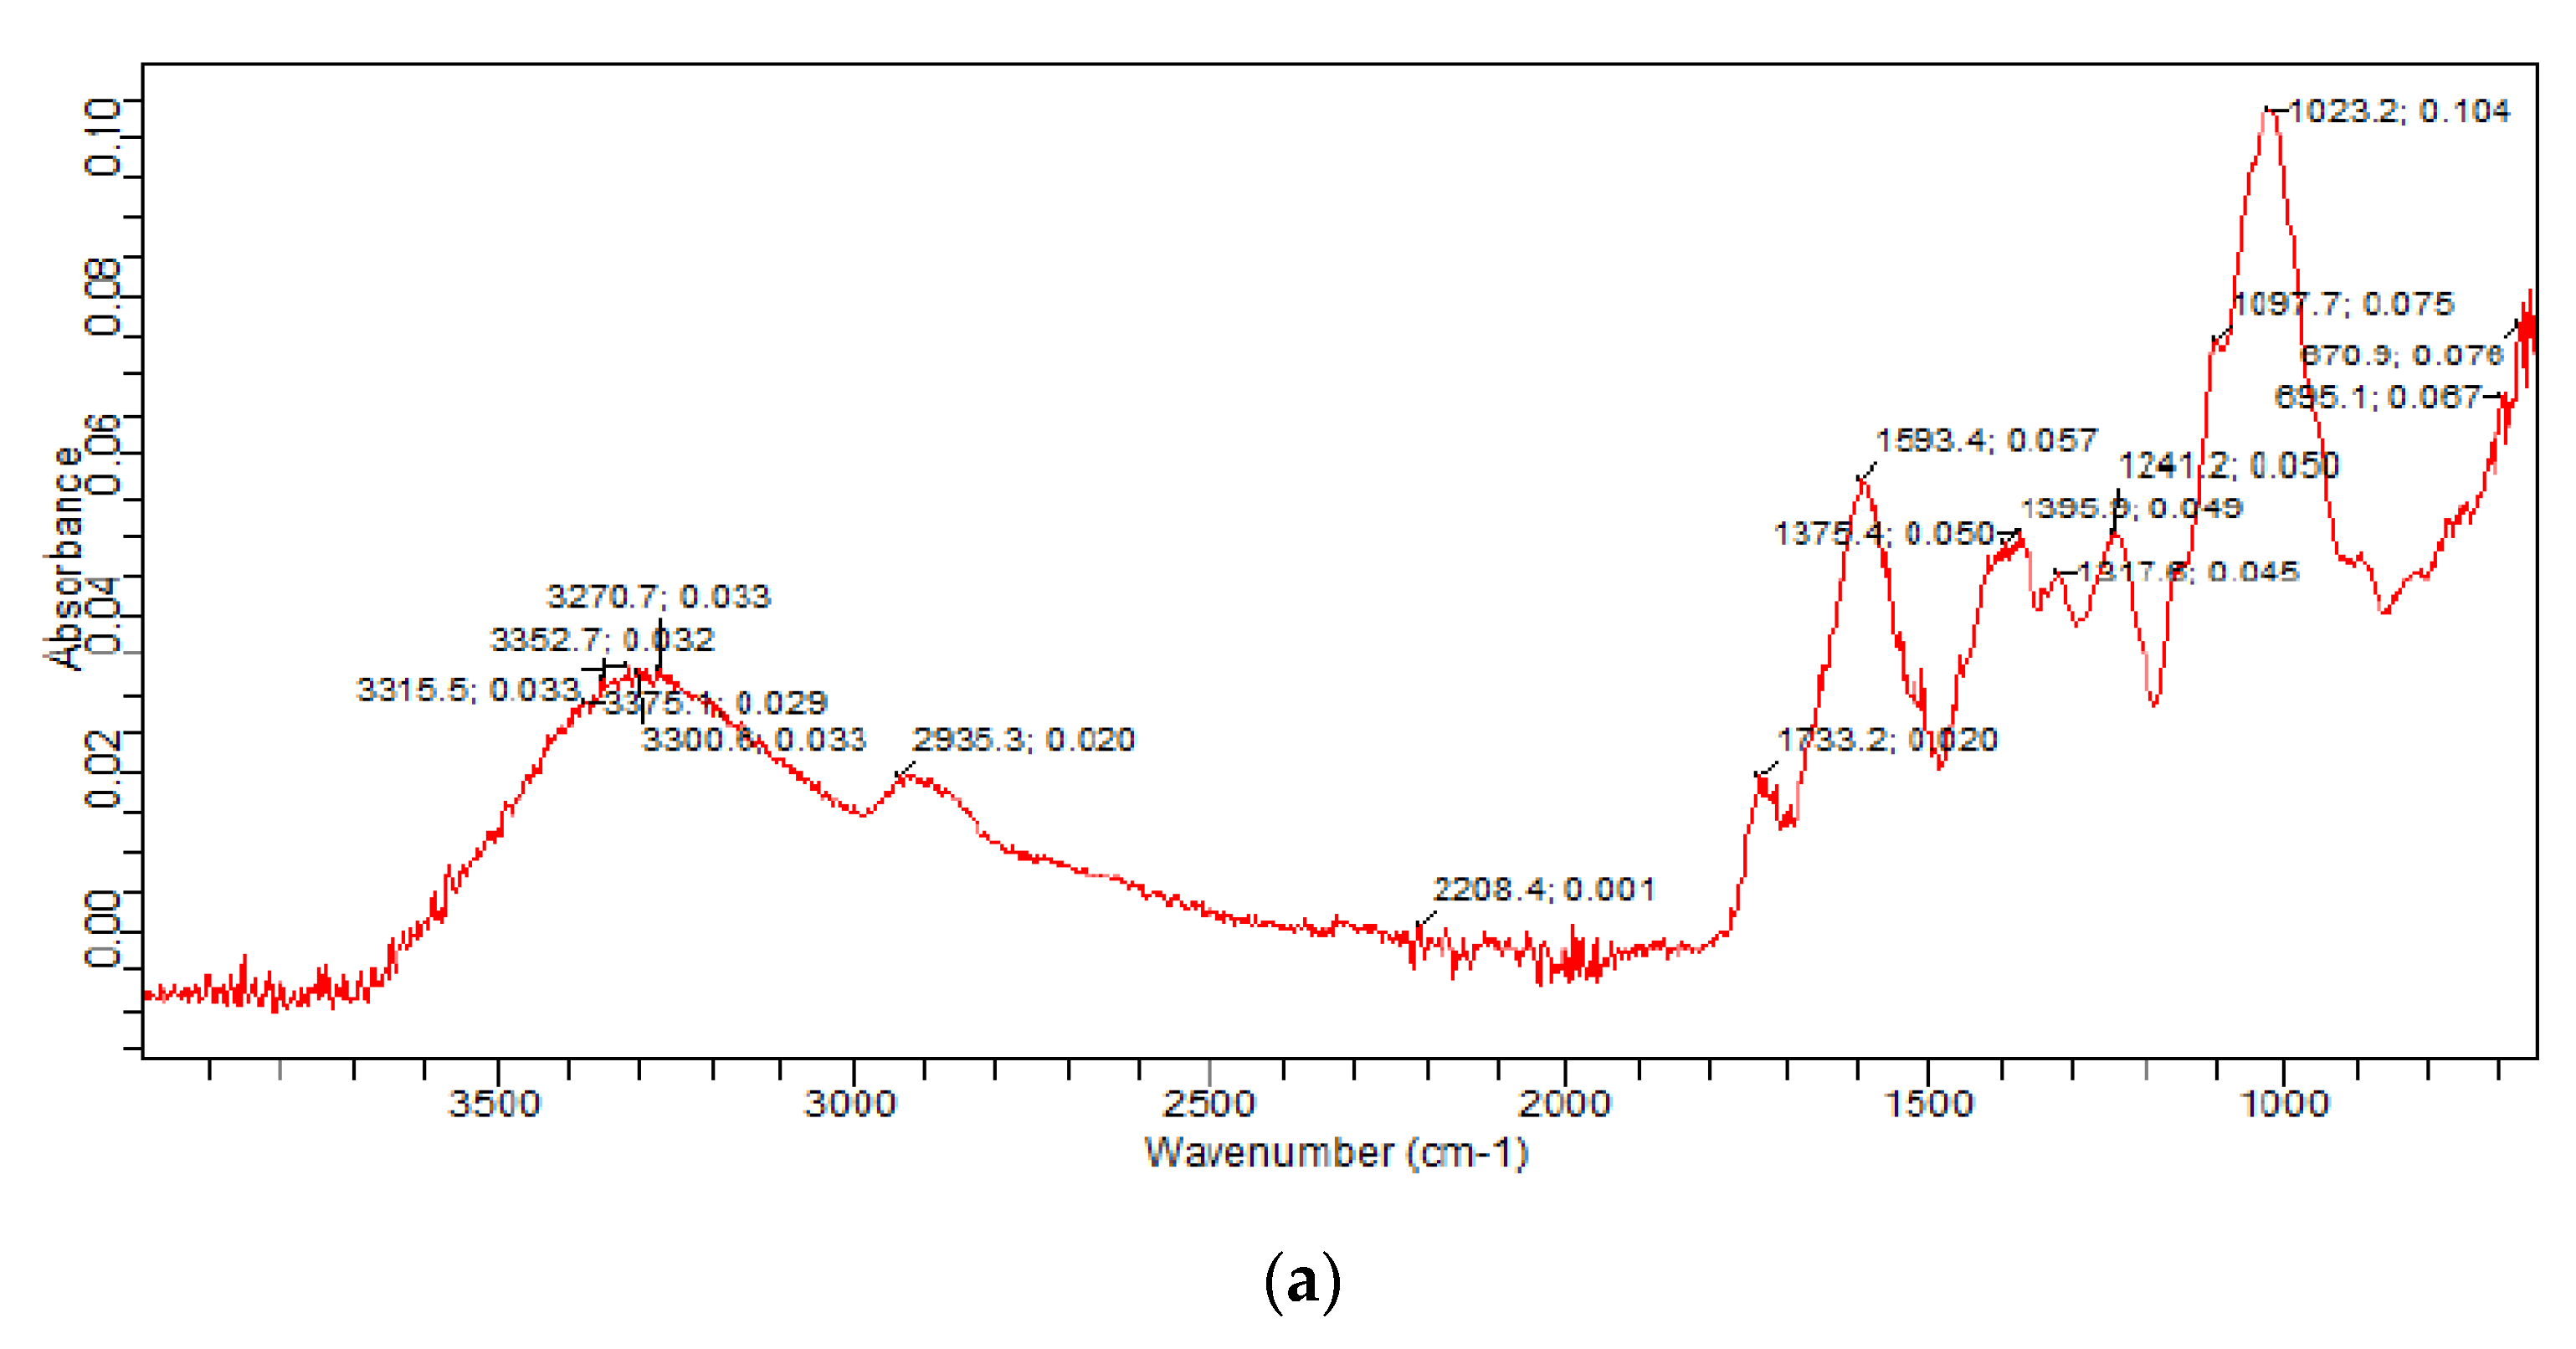
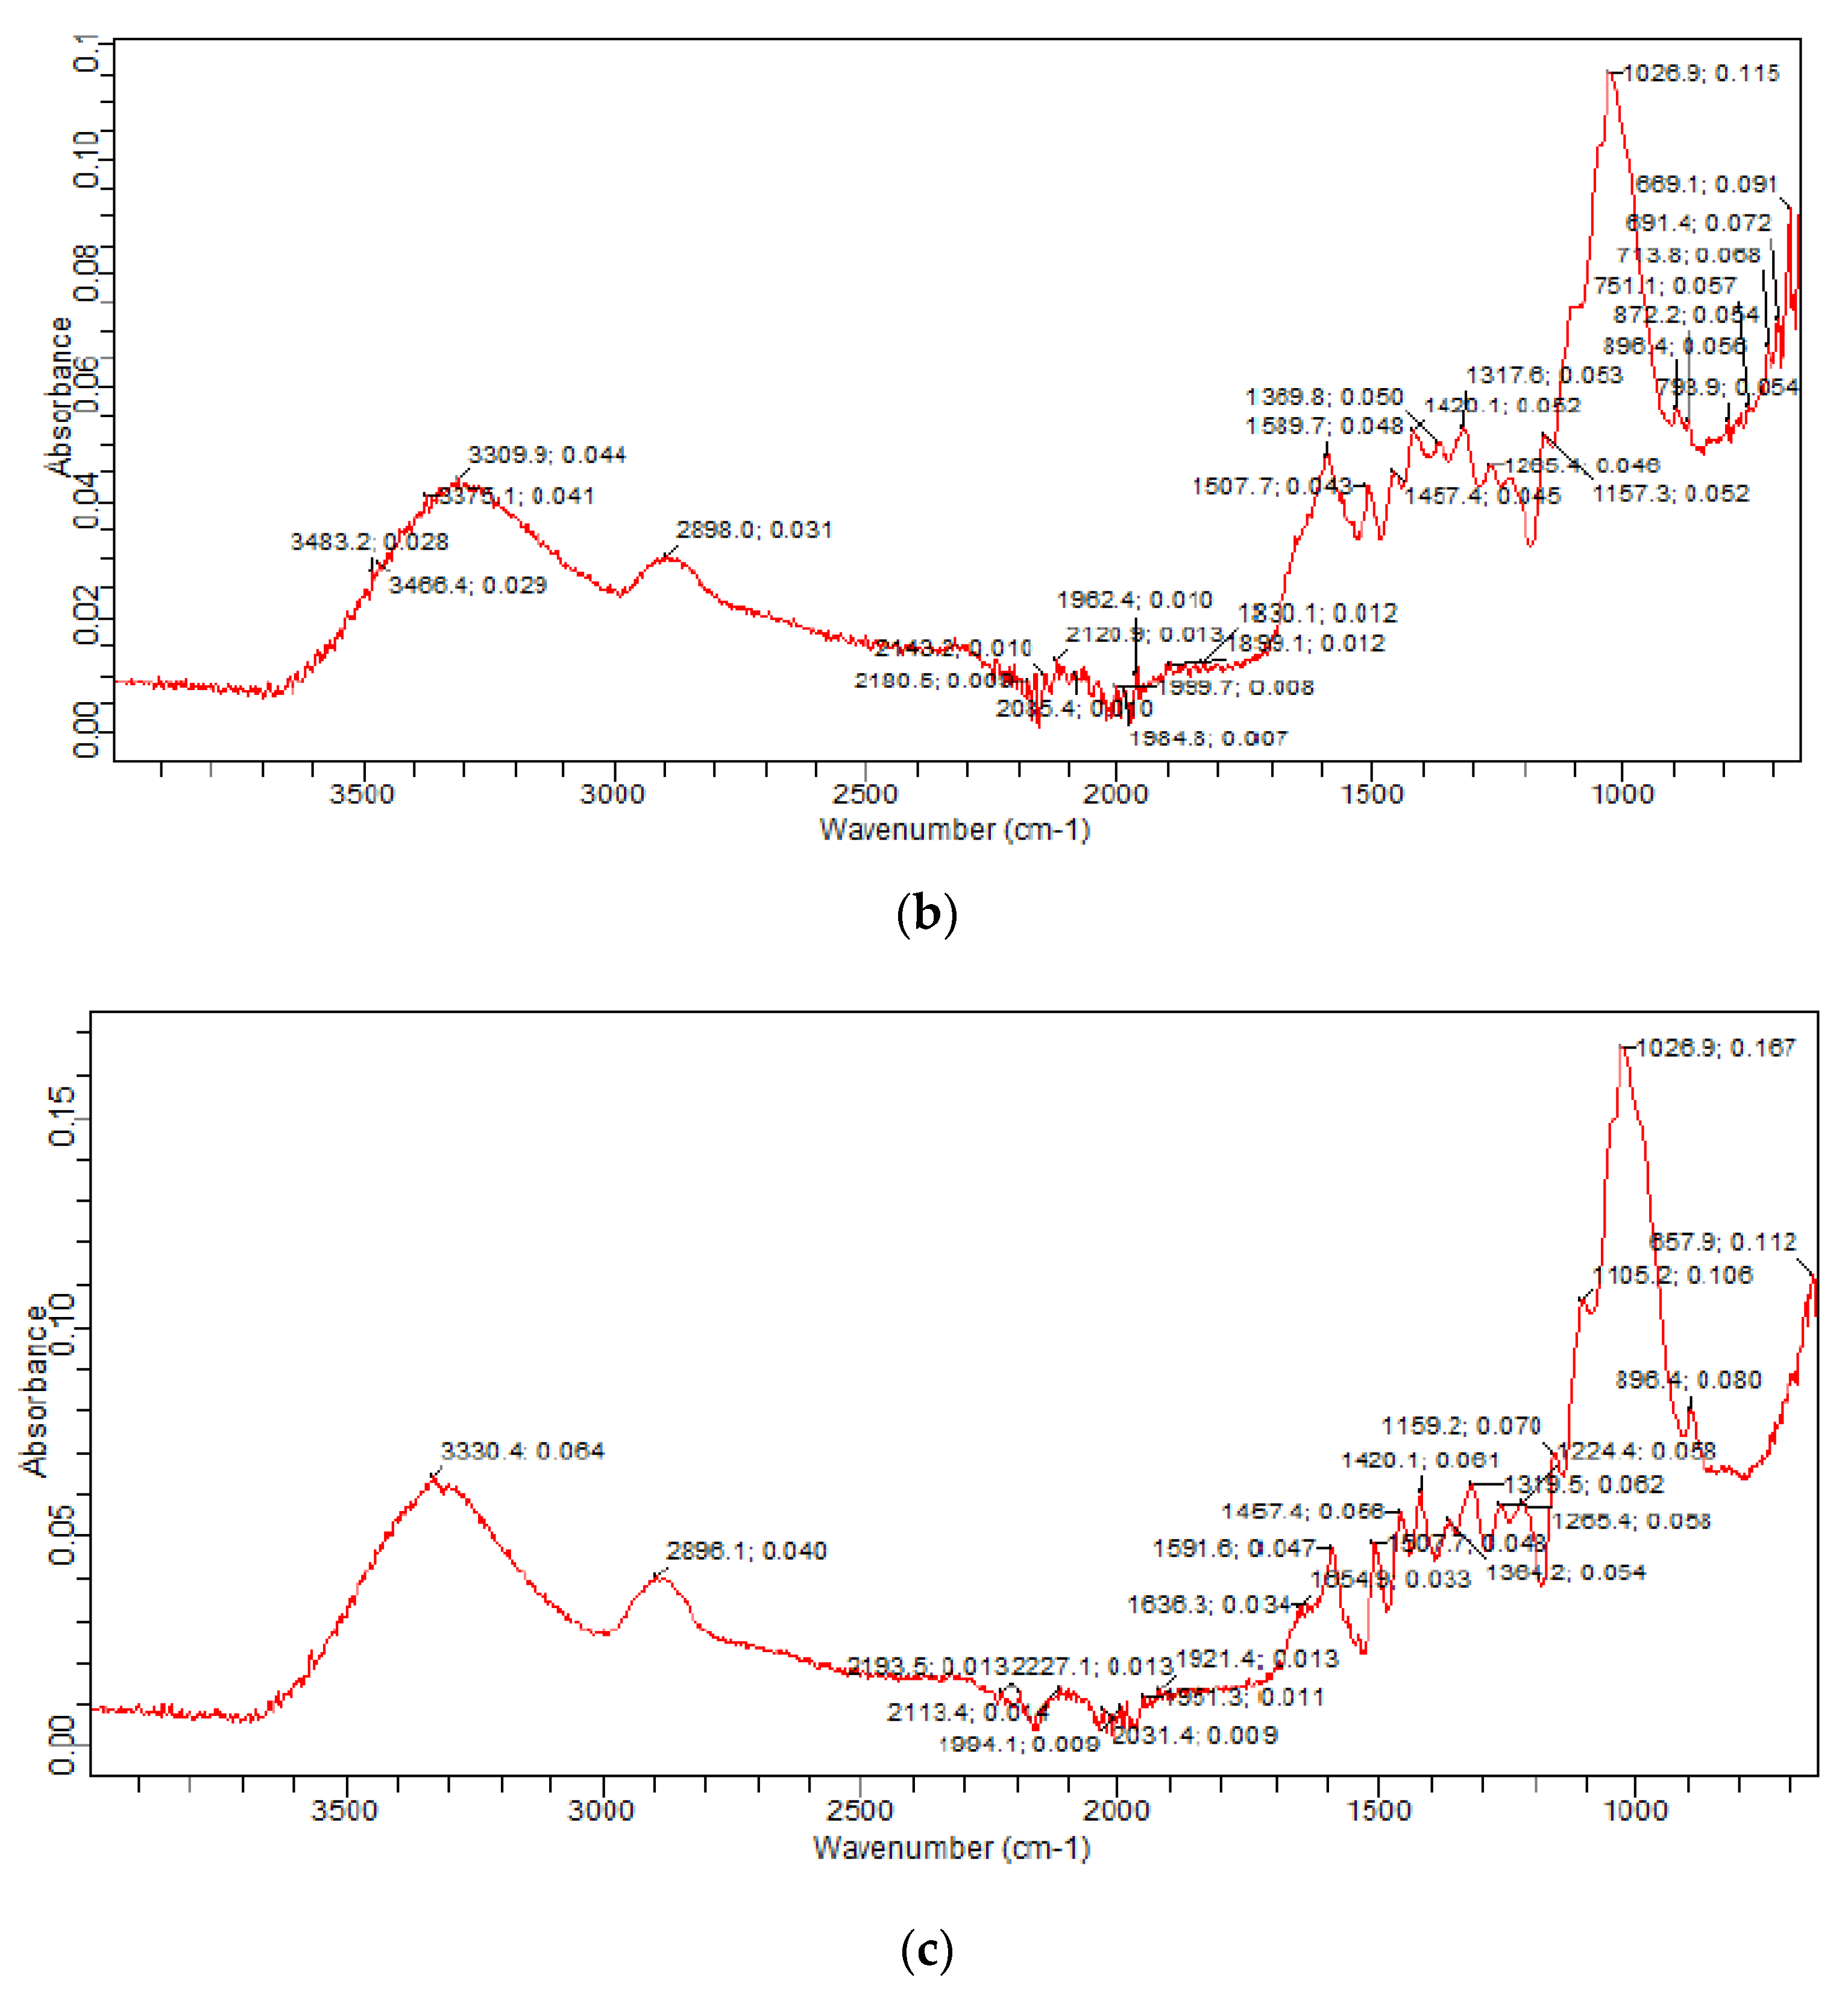
3.2. FTIR
FTIR analysis pointed out chemical changes in pretreated seed pods compared to those untreated (
Figure 5). The change in a peak from 3300.6 cm
−1 to 3330.4 cm
−1 showed –OH band stretching. The intensity of –OH increased, which showed the influence of NaOH on
B. ceiba. The absorption band between 3200 and 3600 cm
−1 is usually assigned to the O–H stretching vibrations of alcohols, carboxylic acids, and hydroperoxides [
5]. In this study, the peak changes from 1023.2 cm
−1 to 1026.9 cm
−1 in samples are related to C–O and C–H deformations that show cellulose breakdown. The peak in untreated
B. ceiba at 1593.4 denoted lignin ring stretches, but these bands were stretched and decreased in chemical and thermochemical pretreatment, respectively, representing the breakdown of lignin due to pretreatment. The peak at 896.4 cm
−1 in both treated samples represented vibrations at β-glucosidic bonds in C–O–C in hemicelluloses and celluloses.
FTIR analysis suggested that NaOH pretreatment efficiently alters the linkages in biomass. The peak 3334 cm
−1 depicts the absorption of –OH of alcoholic hydroxyl [
37]. Another study by Irfan et al. [
38] reported a peak shift from 3336 cm
−1 (raw) to 3315.26 cm
−1 (pretreated). This change indicated –OH band extension in the pretreated substrate. The peak at 1315 cm
−1 depicted hemicellulose in the untreated sample. CH
2 stretching in cellulose is indicated by the peaks from 1370 to 1430 cm
−1. The peaks at 1500 cm
−1 are related to the extension in the C=C bond from the lignin’s aromatic ring. The peak at 1030 cm
−1 and 1034 cm
−1 found in the untreated and pretreated substrate is associated with C–C–O, C=O, and C–O of cellulose. The peak at 890 cm
−1 showed C–O–C vibrations at β-glucosidic bonds in cellulose. Zhang et al. [
39] labeled the band at 1032 cm
−1 with polysaccharides. The reduction in the crystallinity of cellulose might be characterized by the breakdown of structural hydrogen bonding of cellulose chains and the partial conversion of crystalline parts to amorphous ones. The decreased band intensity around 3350 cm
−1 could be linked with the slackening of the intra- and inter-molecular O–H bond of cellulose, proposing that the extremely ordered cellulosic system was converted to a more amorphous form.
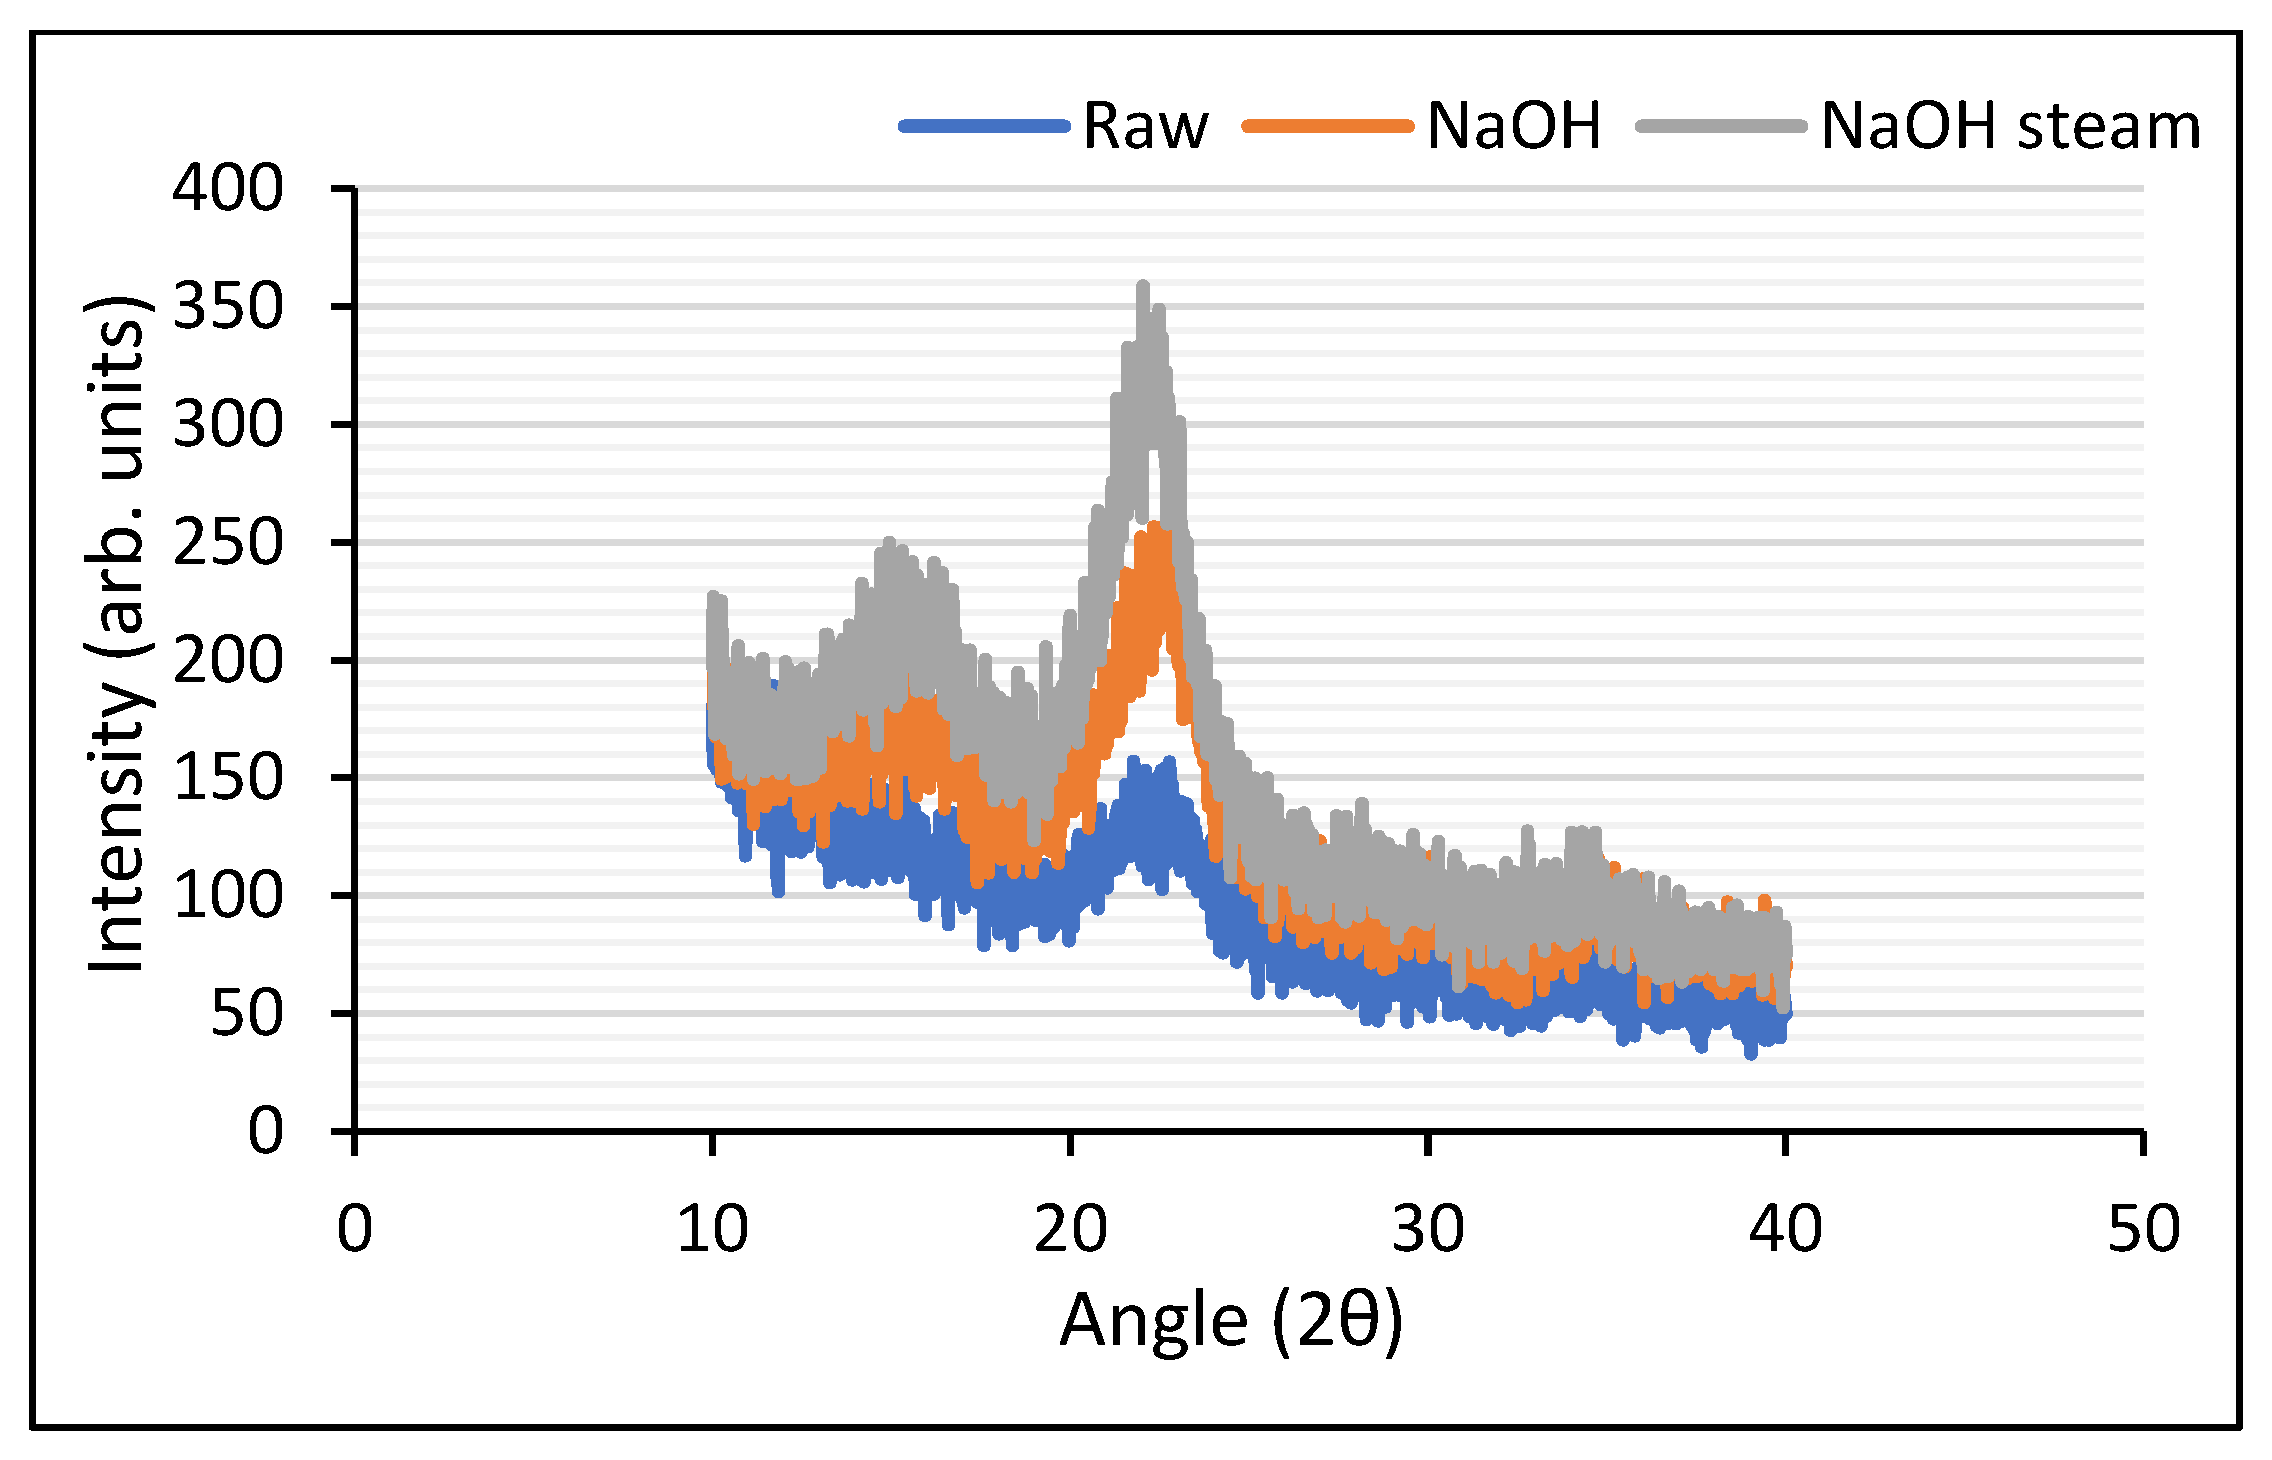
3.3. XRD
Figure 6 revealed the XRD spectra of raw and pretreated (both chemical and thermochemical) samples. The crystallinity index (CI) demonstrated the crystalline structure of the cellulose. The CI of the untreated substrate was 34.5%, which improved in NaOH
-treated (51.2%), and NaOH + steam-treated seed pods (51.1%). The increase in CI showed the removal of amorphous components, such as hemicellulose and lignin, from the biomass. Earlier, it was described that the concentrations of the peak were linked with the crystallinity, which increases with pretreatment and is associated with the decline in the surface area. Increasing CI depicted cellulose exposure.
XRD revealed that the CI of pretreated samples was improved compared to the raw samples, which indicated the removal of hemicellulose and lignin from the crystalline part of the biomass, cellulose [
40]. Our results were in accordance with earlier studies describing increased CI after different types of pretreatments using various agricultural wastes [
40,
41,
42,
43]. A recent XRD study by Gunam et al. [
36] revealed changes in the crystallinity degree of NaOH-pretreated corn straw. Research by Singh and coworkers [
44] reported that the CI (36.96%) of untreated jute biomass declined to 23.61% and 18.42% after 2% NaOH and 2% H
2SO
4 treatment, respectively. This decrease in CI may be due to the degradation of intra- and inter-hydrogen bonding in the crystalline cellulose resulting in an altered crystal structure. Awoyale and Lokhat [
5] observed peaks of reduced intensities in the pretreated biomass samples, a representation of incomplete breakdown of the cellulose with pretreatment.
3.5. SEM
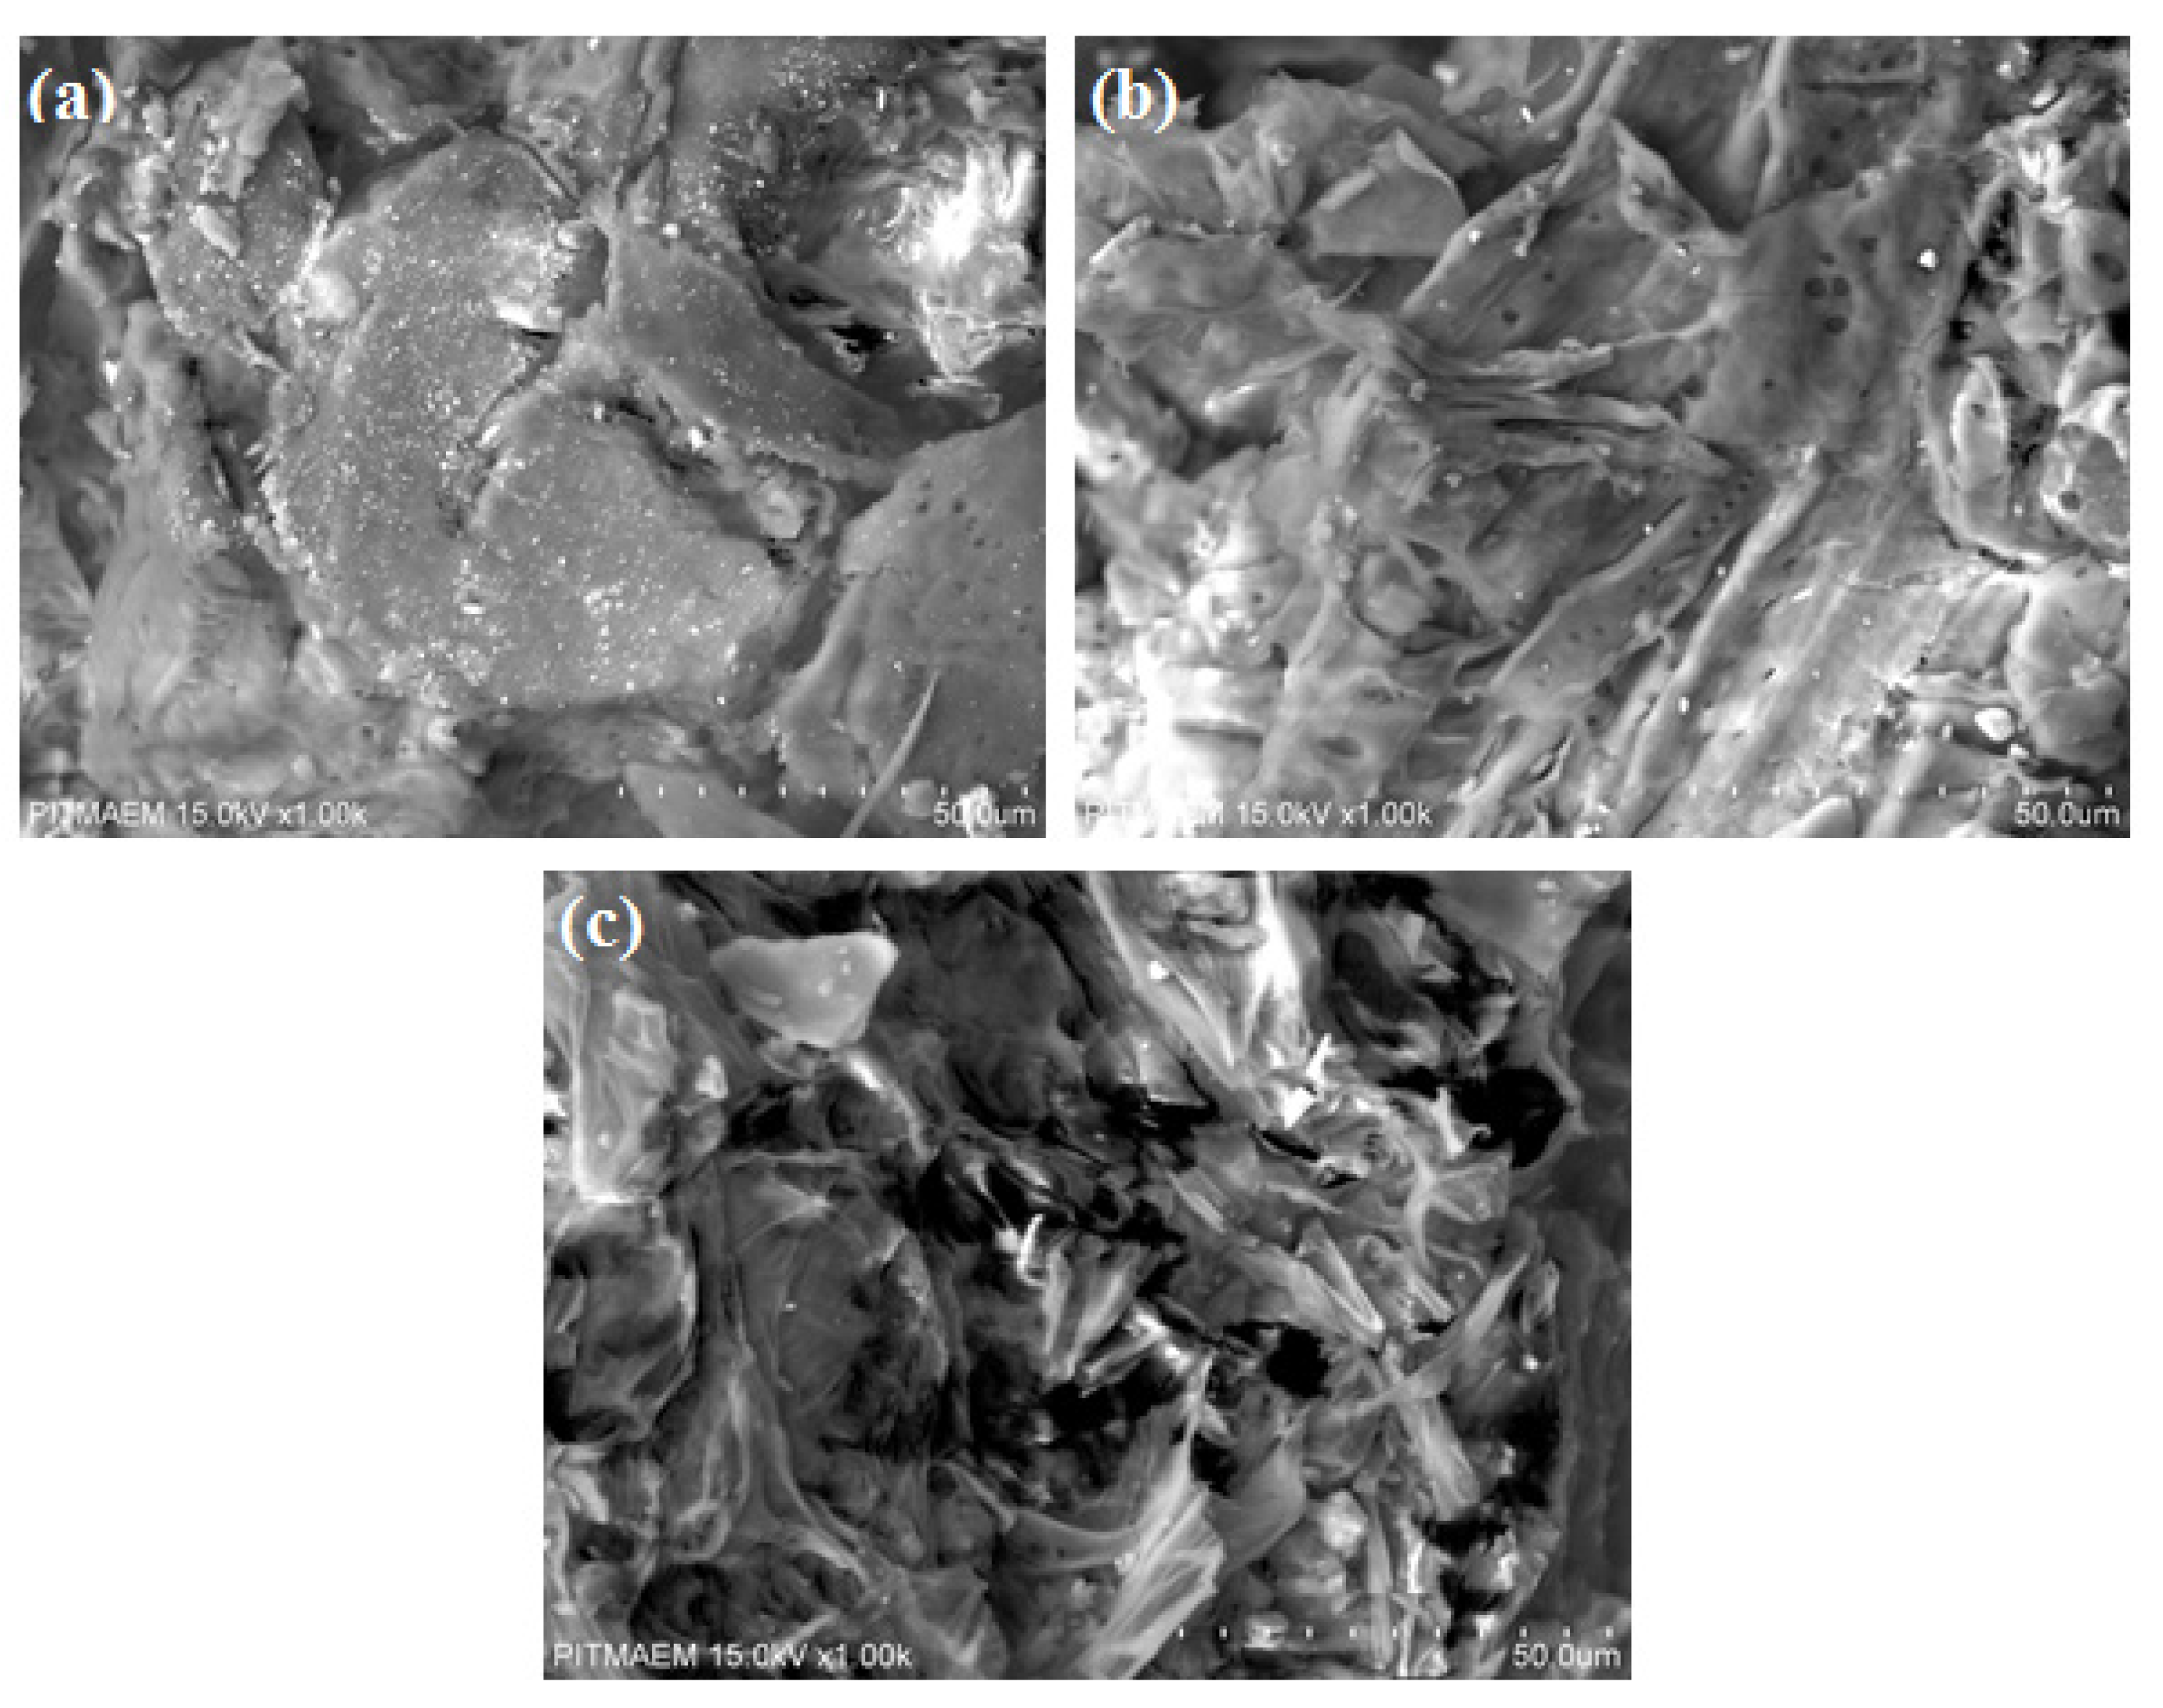
The structural modifications that appeared after pretreatment were observed by SEM images. Micrographs verified the surface characteristics and structural changes in seed pods of
B. ceiba caused by pretreatment. The NaOH reaction damaged the surface of
B. ceiba, generating some irregular cracks and pores. SEM images revealed a significant difference between the surface structures of pretreated and untreated
B. ceiba (
Figure 8). The raw sample exhibited a complex order and dense structure, while both the treated specimens revealed a greater degree of porosity. The number and size of pores confirmed the effectiveness of NaOH + steam pretreatment in delignification.
Thus, pretreatment could efficiently lessen the crystallinity of the
B. ceiba, as reported earlier for corn leaf and cattail’s narrow leaf by Donghai et al. [
46] and Ruangmee and Sangwichien [
47]. This shows that alkali pretreatment can remove a significant percentage of lignin and hemicellulose. Jabasingh and Nachiyar [
48] also detected such variations in bagasse. Awoyale and Lokhat [
5] reported that the micrographs of the alkali-treated lignocellulosic substrate demonstrate more fragmentation and degradation, indicating the efficacy of alkali pretreatment over the other pretreatment processes performed in the research. Kusmiyati et al. [
49] observed uneven surfaces with pores in treated palm tree stem waste through SEM. Sindhu et al. [
50] also observed differences in the surface structure of native and pretreated bamboo substrates.
3.6. Hydrolysis and Fermentation
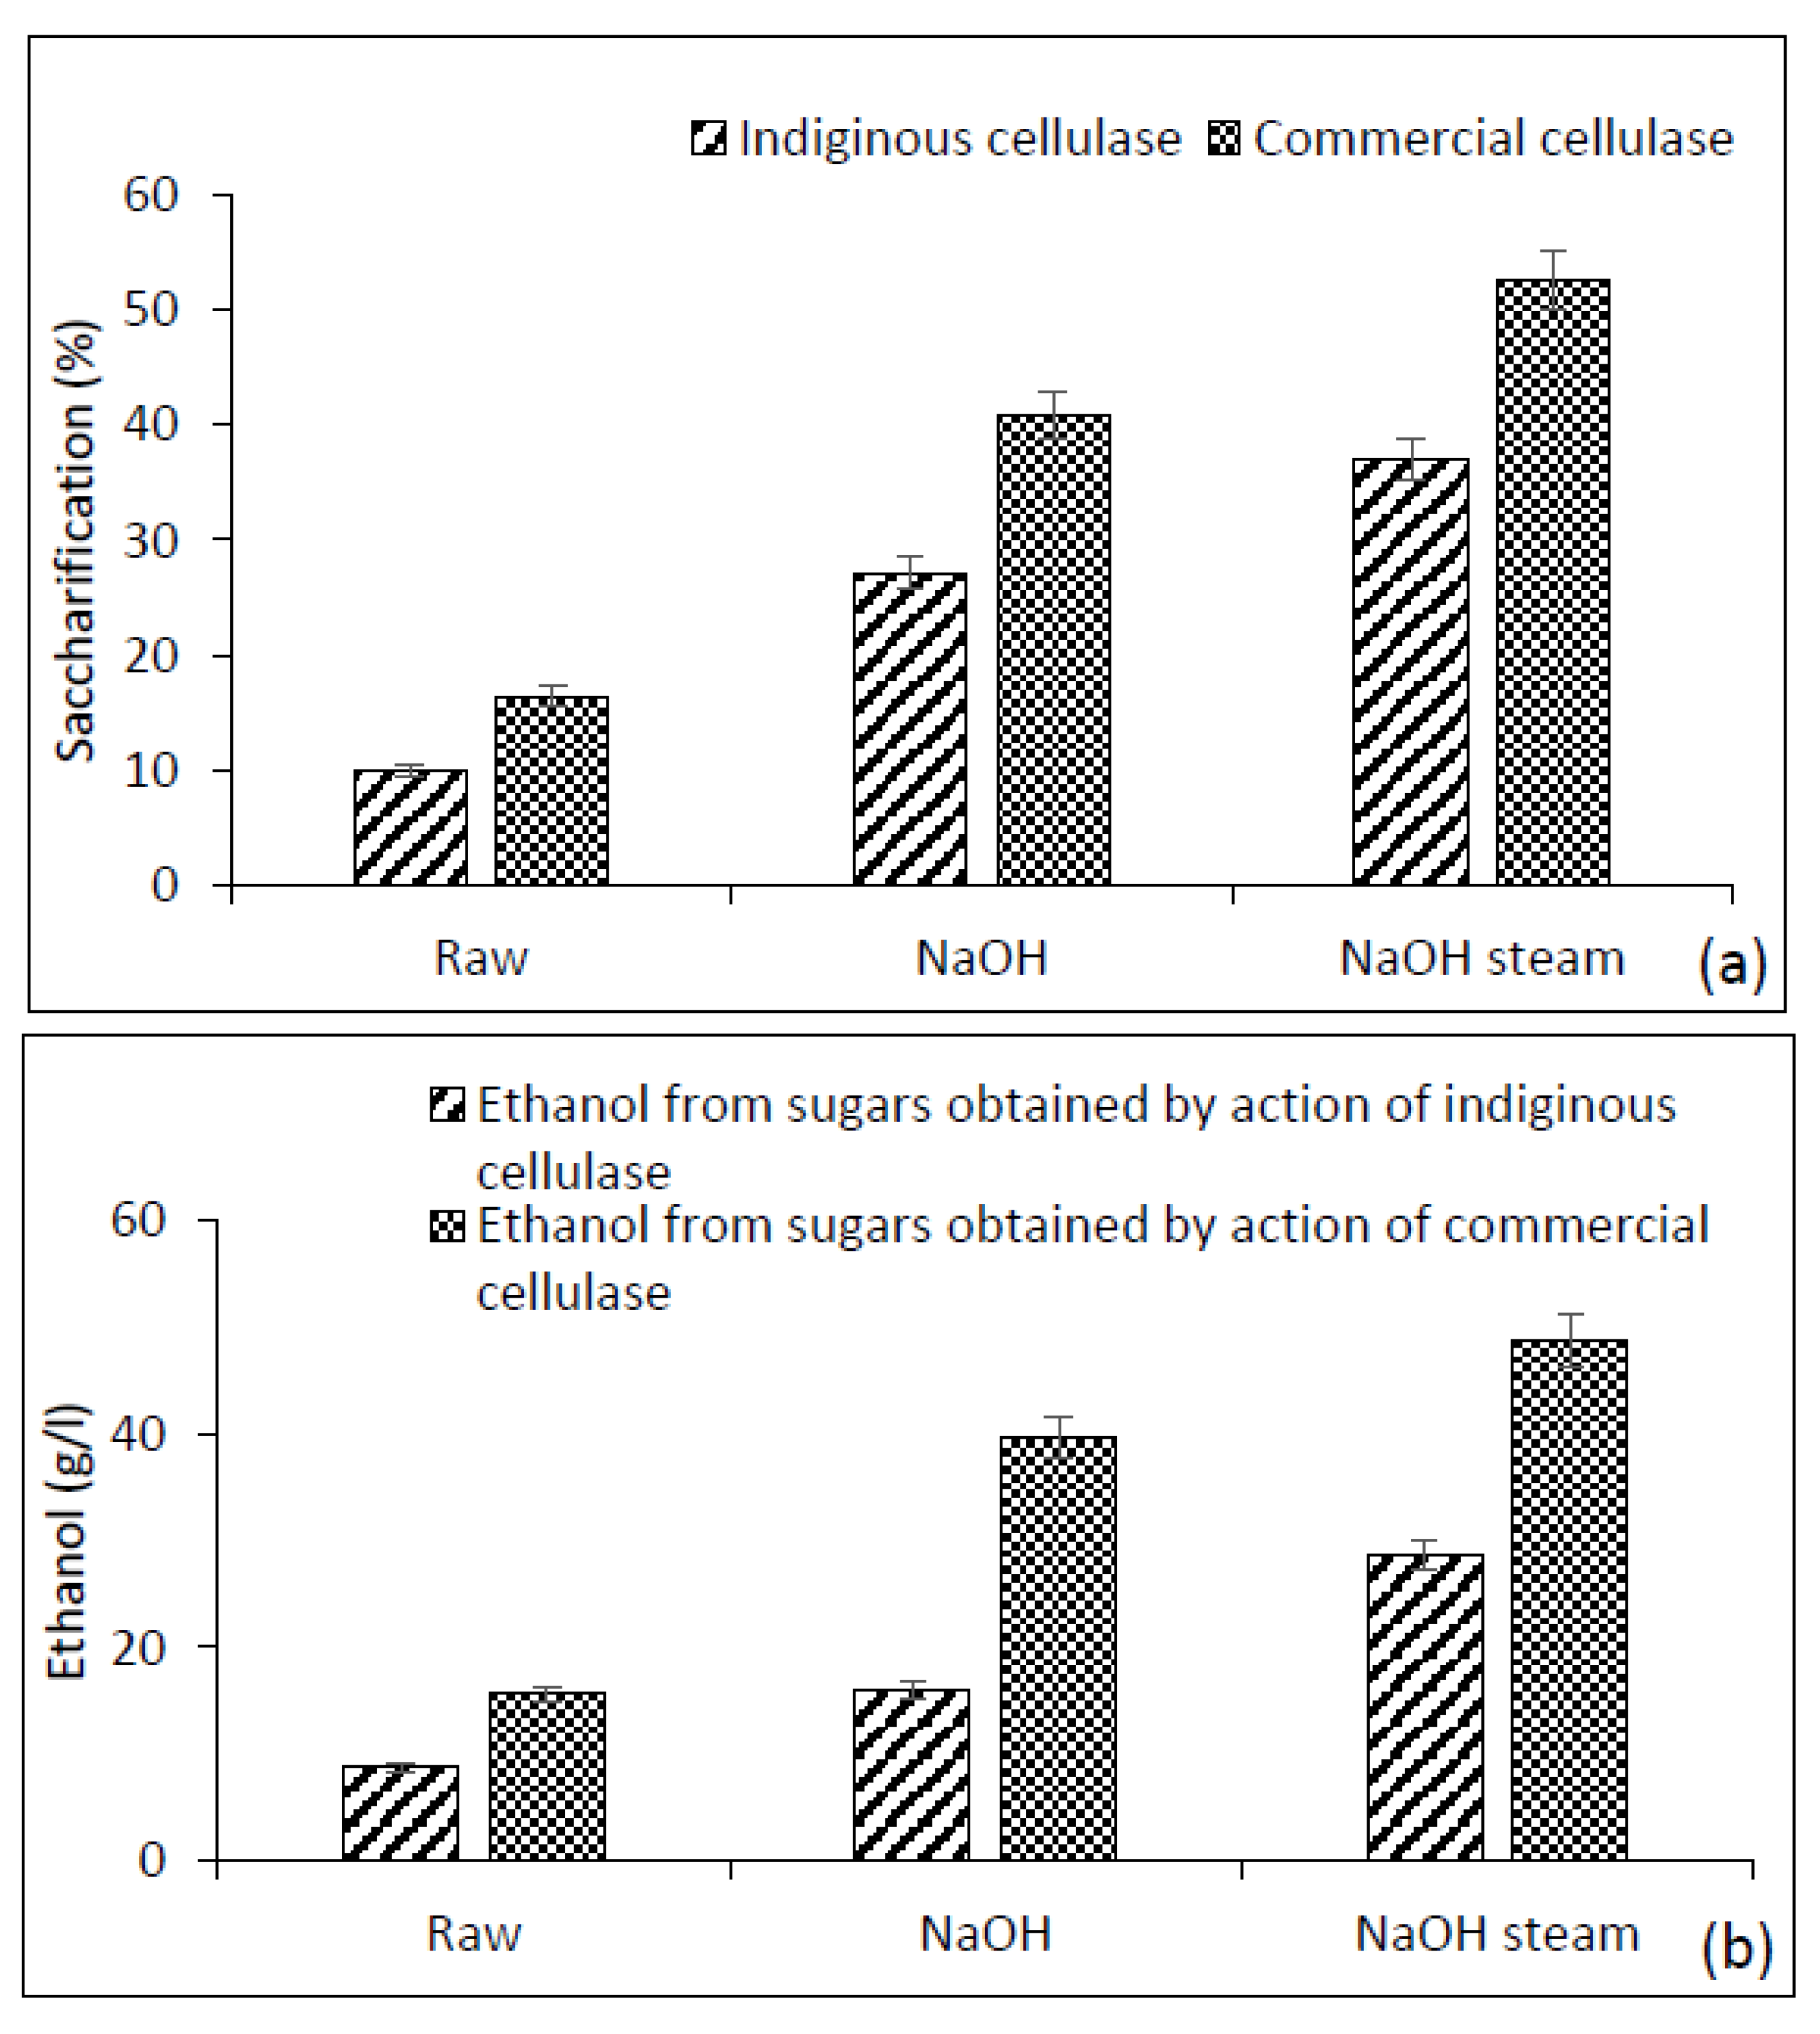
Samples with maximum cellulose contents were used for saccharification and production of ethanol via SHF and SSF. In SHF, substrates with maximum cellulose content from both treatments were saccharified by using indigenously produced cellulase as well as commercial cellulase. Sugars obtained from these saccharifications were then fermented by using
Saccharomyces cerevisiae. During SSF, the pretreated biomass was added with indigenously produced enzyme to form the maximum sugars needed for the production of ethanol and then incorporated with yeast culture. Similar SSF was repeated with commercial cellulase. The results of SHF with commercial cellulase showed maximum saccharification after 24 h in NaOH + steam-pretreated substrate (52.6%), followed by NaOH-treated (40.8%) and untreated substrates (16.4%). Maximum saccharification of 37% with indigenously produced cellulase was recorded in NaOH + steam-pretreated seed pods. The fermentation of these hydrolysates resulted in the production of ethanol. Hydrolysates obtained with indigenous cellulase offered maximum bioethanol titer (g/L) of 28.7 in NaOH + steam-treated, 16.01 in NaOH, and 8.73 in untreated
B. ceiba after 96 h of fermentation. Sugars obtained with commercial cellulase presented a maximum ethanol yield of 48.8 g/L in NaOH + steam-treated, 39.63 g/L in NaOH-treated, and 15.6 g/L in untreated biomass (
Figure 9).
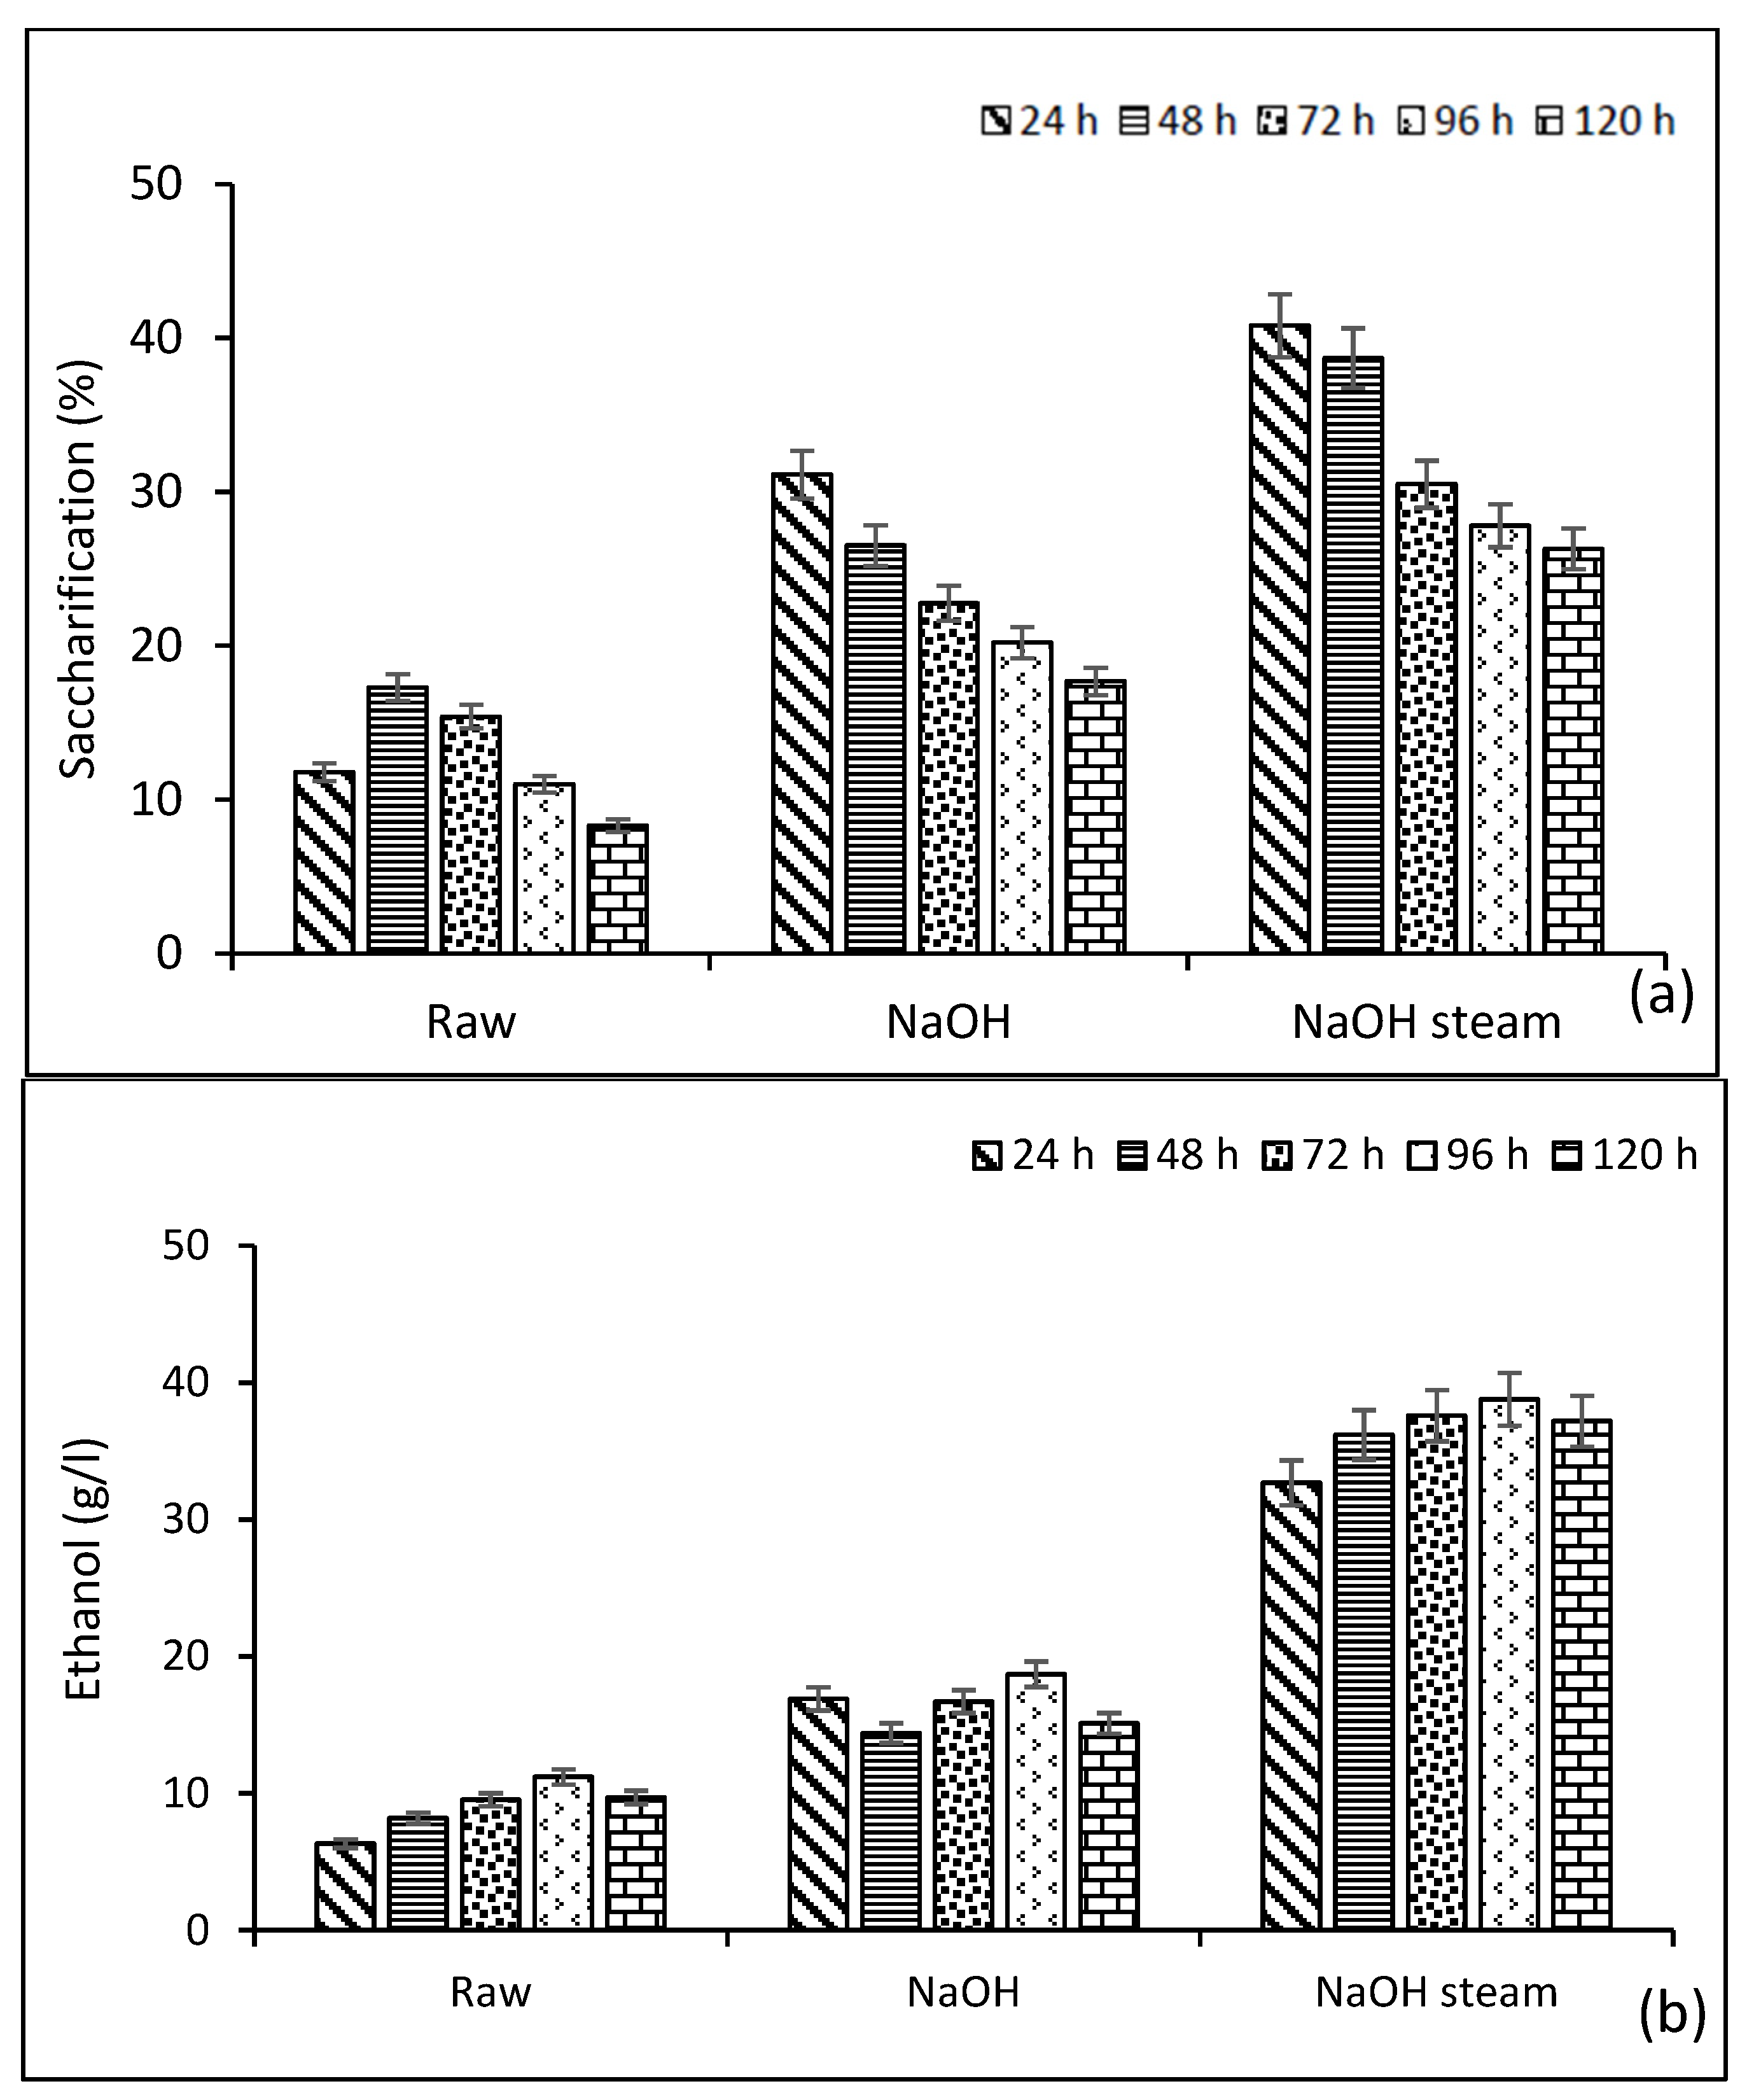
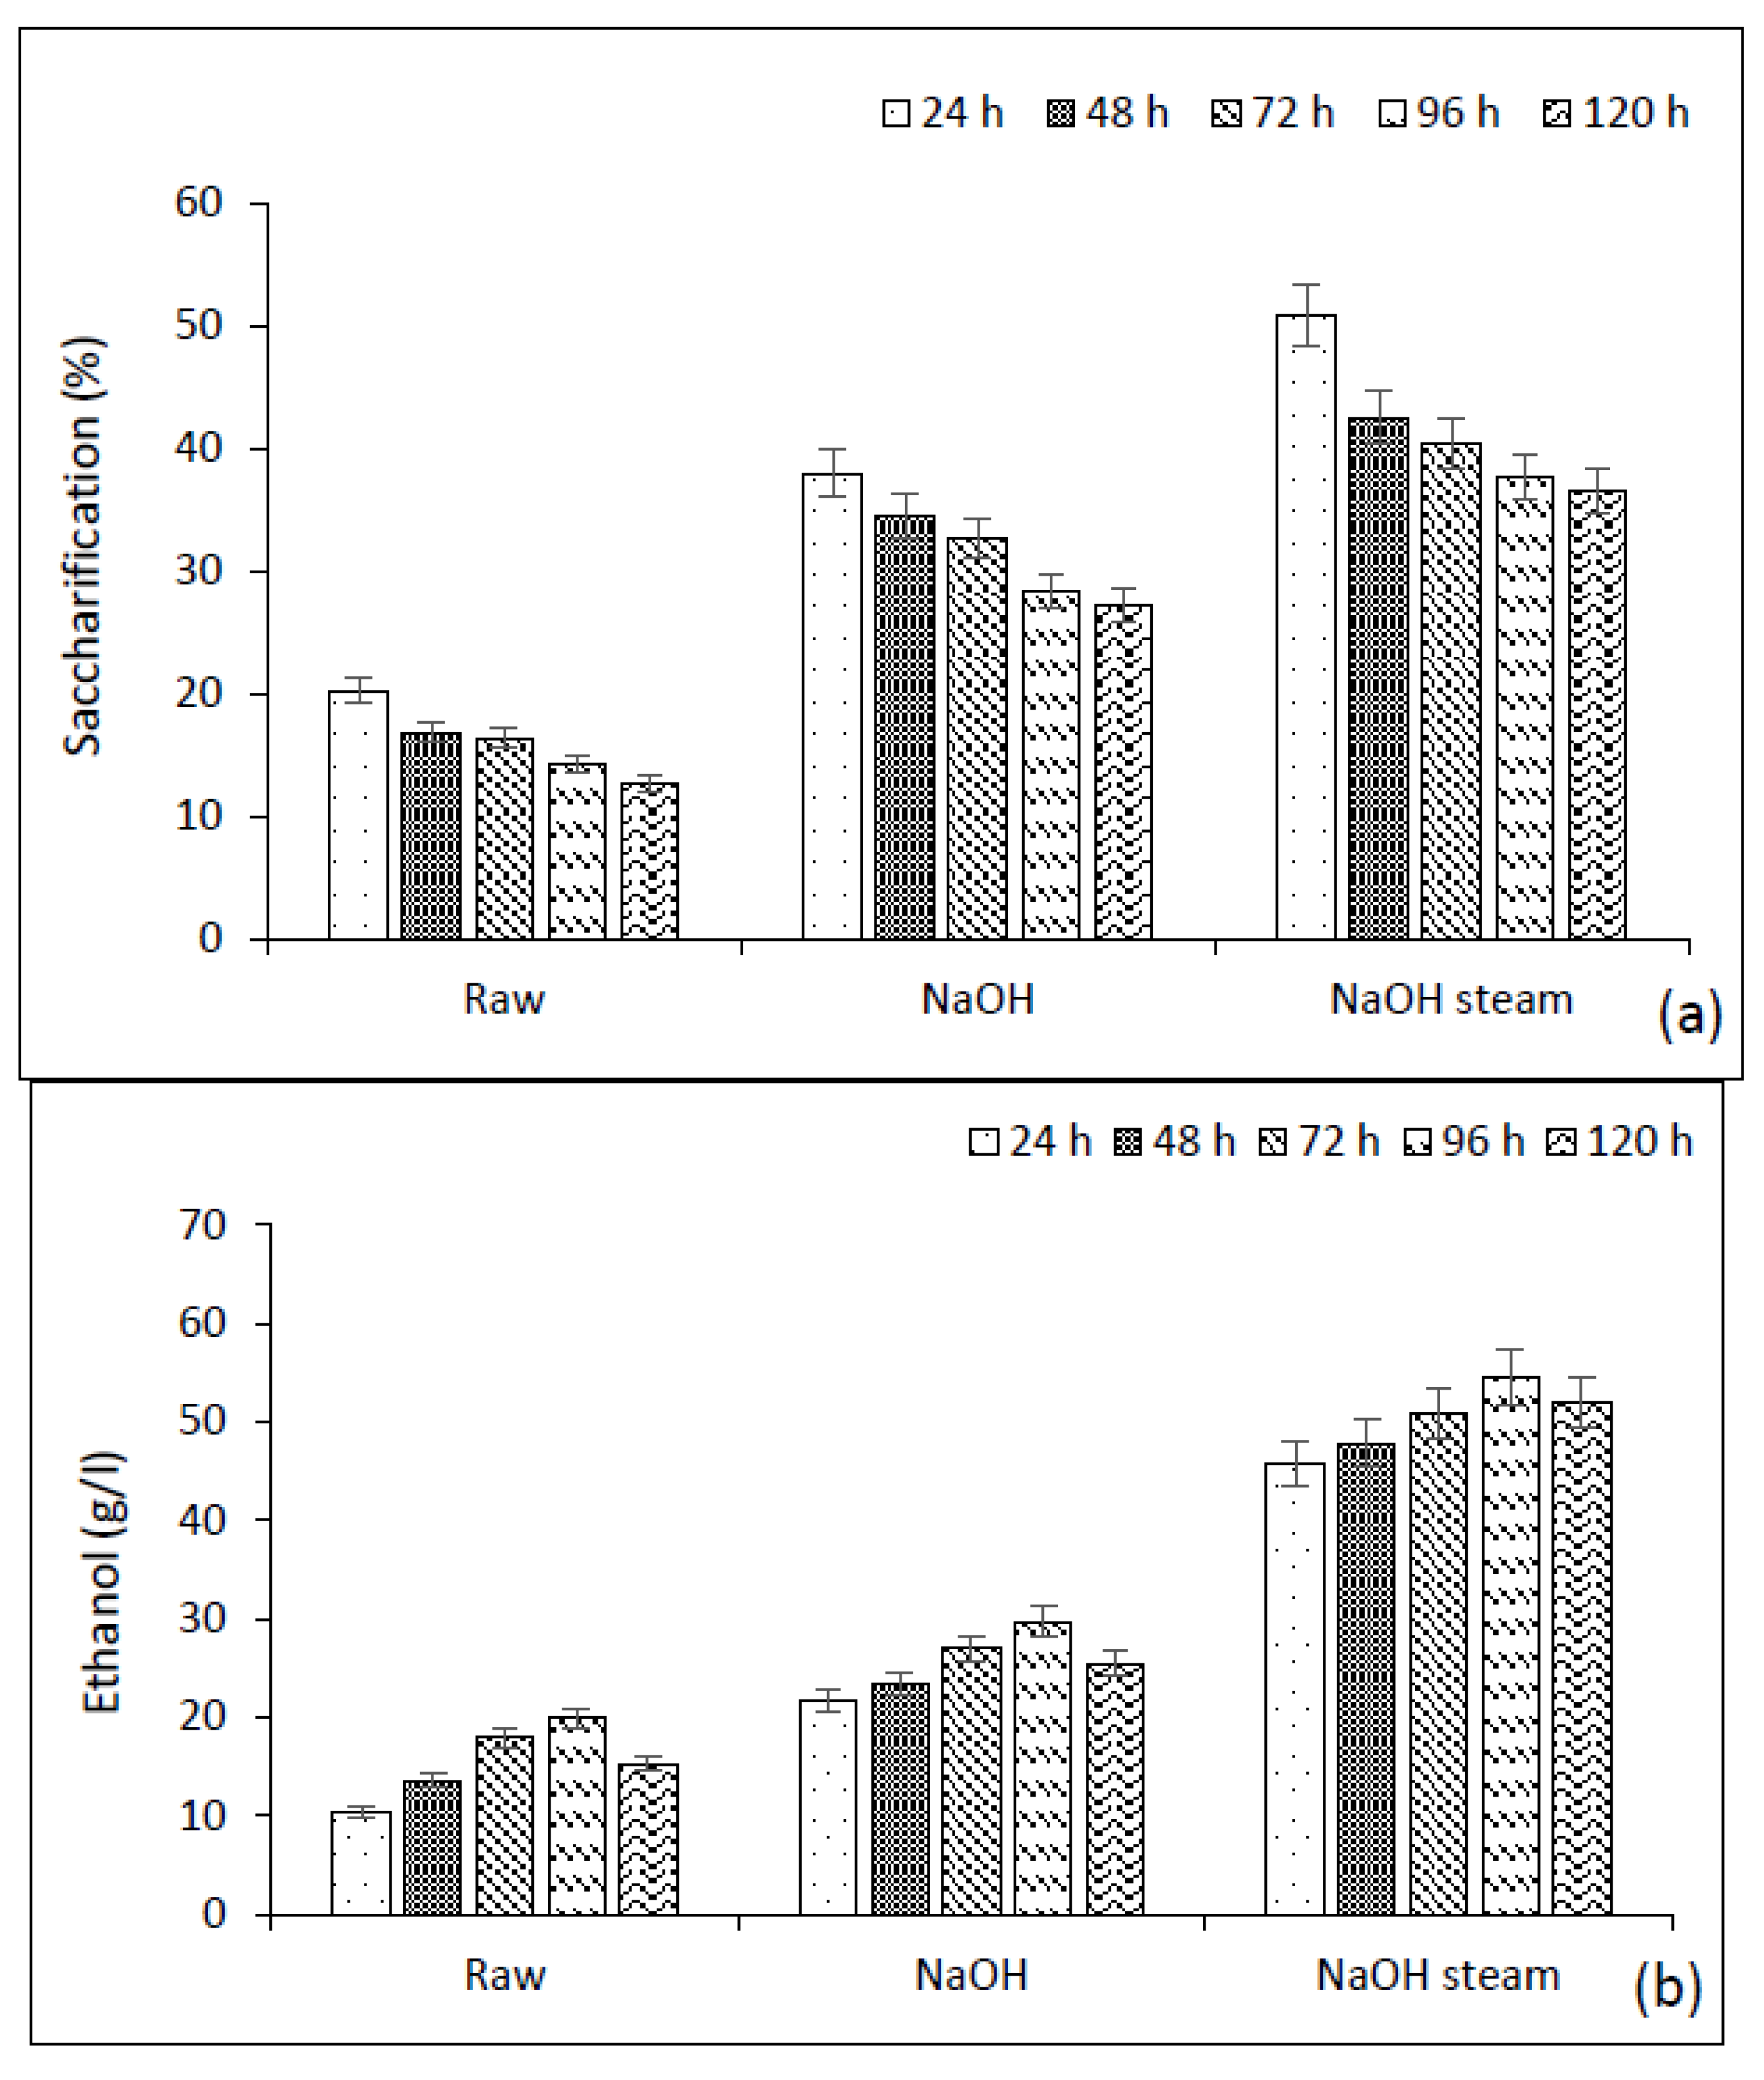
The results of SSF showed a decrease in sugar every 24 h; this could be due to the sugar consumption by yeast and subsequent ethanol production increase every 24 h due to fermentation. After adding indigenously produced cellulase and 1%
S. cerevisiae, maximum saccharification in untreated lignocellulosic biomass (17.3%) was observed after 48 h of inoculation, while chemically and thermochemically pretreated substrates showed maximum saccharification (31.12% and 40.8%, respectively) after 24 h. Maximum ethanol production was observed at 11.2 g/L, 18.7 g/L, and 38.8 g/L in raw, chemically treated, and thermochemically pretreated substrates, respectively, after 96 h of fermentation (
Figure 10). Sugars obtained with commercial cellulase offered the highest ethanol production in SSF. Maximum saccharification (50.9%) in SSF was seen with commercial cellulase in NaOH + steam-treated seed pods, which subsequently resulted in the highest ethanol (54.51 g/L) production after 96 h of fermentation. Maximum bioethanol yield in NaOH-treated (29.76 g/L) and raw seed pods (19.87 g/L) was also obtained after 96 h fermentation (
Figure 11).
We used two different approaches, e.g., SHF and SSF, for saccharification and fermentation of the pretreated substrate. In this study, the highest fermentable sugars in terms of saccharification, 50.9% (after 24 h), and the highest bioethanol yield, 54.51 g/L (after 96 h), were obtained from SSF with the commercial enzyme and
S. cerevisiae. SSF with indigenous cellulase gave a relatively low yield. In the case of SHF, results with commercial cellulase were better than that of indigenous cellulase, but the overall yield was less than SSF. The results of Sukhang et al. [
51] and Vintila et al. [
52] corroborated our findings that the SSF contributed to higher ethanol production from lignocellulosic biomass than that of SHF. A study by Triwahyuni [
53] noticed a notable ethanol titer from SHF of oil palm empty fruit bunch. Hydrolysis for 96 h produced 75.48% glucose, which subsequently yielded 78.95% ethanol. Ballesteros et al. [
54] found the highest ethanol yield in SSF after 72 h of fermentation. The reason for the good yield of ethanol in SSF could be the direct conversion of produced sugars into ethanol, thus evading any feedback inhibition. Barron et al. [
55] employed other strains of yeast for ethanol production and found that
Kluveromyces marxianus produced 10 g/L ethanol after a 60 h fermentation period, and
Pachysolen trannophylus produced 11.8 g/L ethanol from the hydrolysate of wheat straw.
Tan and Lee [
56] noticed a better yield of bioethanol in SSF (90.9%) compared to SHF (55.9%). SSF of seaweed biomass by means of
S. cerevisiae had several advantages over SHF, as the earlier approach is a simple single-step process that can save time, costs, and energy while achieving a high bioethanol titer. A study found a maximum ethanol yield of 85.71% at 30 °C with 2% wheat straw and 30 FPU of enzyme loading in SSF Ruiz et al. [
57]. Findings of research on bioethanol production from rice husk also supported our results that SSF was better than SHF in yielding a good ethanol titer [
58]. Ahmad et al. [
59] showed that sweet sorghum and sago biomasses yielded maximum ethanol at the end of 72 h of fermentation. Peace and others [
60] used wood shavings for bioethanol production. They noticed that
S. cerevisiae was able to convert 60.97% brix in wood extract into bioethanol at optimized conditions of 15.66 g wood concentration, 4.47% NaOH concentration, 0.85 inoculum size, 72 h incubation time, and a 40 °C incubation temperature. The ethanol titer obtained was 1.68–2.25%. As various studies have used different plant biomasses in order to produce bioethanol, this study suggested seed pods of
B. ceiba as a potential renewable source of green energy to be used on a pilot scale.


 ,
, 


