Article

Development of Cistanche deserticola Fermented Juice and Its Repair Effect on Ethanol-Induced WRL68 Cell Damage

Institute of College of Life Science and Technology, Xinjiang University, Urumqi 830000, China
*
Author to whom correspondence should be addressed.
Fermentation 2022, 8(4), 178; https://doi.org/10.3390/fermentation8040178
Submission received: 19 March 2022 / Revised: 31 March 2022 / Accepted: 8 April 2022 / Published: 10 April 2022
(This article belongs to the Section Fermentation for Food and Beverages)

Abstract

:
Cistanche deserticola is a valuable Chinese herb, but traditional dry processing causes the loss of active substances. This study developed Cistanche deserticola fermented juice (CFJ) using lactic acid bacteria and optimized the fermentation process to achieve the maximum active substance content and taste. More interestingly, superoxide dismutase (SOD) activity was increased during fermentation, and CFJ exerted a reparative effect on ethanol-induced cell damage. SOD activity reached 603.26 U/mL when the ratios in the total inoculum volume of Lactobacillus reuteri, Lactococcus pentosus, Streptococcus thermophilus, Bifidobacterium animalis, Lactobacillus casei, and Lactobacillus acidophilus were 31.74%, 15.71%, 17.45%, 11.65%, 9.56%, and 13.89%, respectively. Further, the optimal fermentation conditions for CFJ were determined using a response surface methodology. More importantly, CFJ promoted the proliferation of WRL68 cells, and CFJ exerted an obvious reparative effect on ethanol-treated cells, in which the cell survival rate increased to 120.35 ± 0.77% (p < 0.05). The underlying mechanism might have been that CFJ reduced the MDA content in damaged cells from 1.36 nmol/mg prot to 0.88 nmol/mg prot and increased GSH-Px and SOD activities by 48% and 72%, respectively. This study provides a theoretical basis and reference data for the fermentation of C. deserticola and its hepatoprotective activity.

1. Introduction

Cistanche deserticola (C. deserticola) is known as “desert ginseng” [1] and is a traditional Chinese medicine peculiar to the desert area of northwest China. C. deserticola has excellent medicinal functions and nourishing effects, and pharmacological studies have revealed that Cistanche has antioxidant [2], antifatigue [3], and hepatoprotective [4] functions, enhancing sexual function and modulating the gut microbiome [5]. However, the traditional methods of C. deserticola processing are mainly drying, salting, or soaking in alcohol [6], which take a long time and are affected by other factors, leading to the unstable quality of the herbal medicine and incomplete utilization of its active ingredients [7]. Therefore, a new product must be developed to improve the value of the product. Many studies have discovered the value of fermenting food as a cheap preservation method that improves nutritional quality and enhances sensory characteristics [8].
Fermented plant juice is generated by various microorganisms, such as yeast, lactic acid bacteria (LAB), and acetic acid bacteria, to prepare a juice or other physical form rich in a variety of nutrient bioactive substances, such as enzymes, polyphenols, and mineral organic acids [9]. Studies have shown that fermented juices are richer in flavor [10] and more balanced nutritionally. Yang et al. [11] fermented a beverage containing apples, pears and carrots using two strains of Lactobacillus plantarum as raw material, and Srijita et al. [12] added bacteria to sea buckthorn juice for fermentation. Meanwhile, compared with single strain fermentation, mixed strain fermentation has a more complex metabolic mechanism and generates more abundant fermentation products. Due to the different characteristics and adaptabilities of individual strains, dominant bacteria must be selected for mixed bacterial fermentation.
In this paper, C. deserticola was used as a raw fermentation material to develop C. deserticola fermented juice (CFJ) with several lactic acid bacteria and yeast. First, six strains with a high acid production capacity, SOD production capacity, and high sensory evaluation were selected by conducting a single-factor test, and the proportion of inoculum was determined by performing a uniform design test. Then, the fermentation process was optimized using SOD as an indicator based on the preliminary experiment. Furthermore, different concentrations of CFJ were used to repair cells treated with alcohol and the cell survival rate was calculated. Then, superoxide dismutase (SOD) activity, glutathione peroxidase (GSH-Px) activity, and malondialdehyde (MDA) contents were detected to study the mechanism by which Cistanche fermented juice repairs alcoholic liver injury.

2. Materials and Methods

2.1. Materials

The stems of C. deserticola were collected from Ziniquanzi town, Changji Prefecture, Xinjiang. Lactobacillus fermentum, Streptococcus thermophilus, Saccharomyces cerevisiae, Lactobacillus casei, Lactobacillus pentosus, Bifidobacterium animalis, Kluyveromyces marxianus, Lactobacillus reuteri, Saccharomyces boulardii, Lactobacillus acidophilus, Lactobacillus bulgaricus, Weissella kandleri, Lactobacillus rhamnosus, Torulaspora delbrueckii, and Lactobacillus paracasei were obtained from the China Microbial Culture Preservation Center (Beijing, China). All the strains were activated twice and incubated at 37 °C for 24 h before use. Hepatic WRL68 cells were obtained from Xinjiang University Yifu Building Laboratory. Pectinase, cellulase, hemicellulase, and echinacoside standards were purchased from Shanghai Yuanye Biotechnology Co., Ltd. Dulbecco’s modified Eagle’s medium (DMEM), fetal bovine serum (FBS), and phosphate buffer solution (PBS) were purchased from Biological Industries Company (Israel). Trypsin-EDTA (0.05%) and dimethyl sulfoxide (DMSO) were purchased from HyClone Corporation (USA). Assay kits, including superoxide dismutase (SOD), glutathione peroxidase (GSH-Px), and malondialdehyde (MDA), were purchased from the Nanjing Jiancheng Bioengineering Institute.

2.2. Preparation of C. deserticola Juice and Inoculum

C. deserticola was washed with distilled water to remove dust and surface impurities. Afterward, C. deserticola was mixed with distilled water at a ratio of 1:9 (w/v) and boiled for 30 min. Then, the juice was cooled to 55 °C and ground into a homogenate with a beating machine. Next, 0.4% (w/v) pectinase, 0.2% (w/v) cellulase, and 0.2% (w/v) hemicellulase were added to induce enzymatic hydrolysis at 55 °C for 3 h. After enzymolysis, the juice was pasteurized in a water bath at 70 °C for 20 min and cooled to room temperature. A certain volume of the strain suspension was added to the homogenate. Finally, the juice was fermented at 37 °C for 24 h.

2.3. Selection of Fermentation Strains and Determination of the Proportions of Strains

Fifteen strains were used to ferment Cistanche homogenates individually. The monoculture inoculum was maintained at a bacterial concentration of 2 × 10⁶ CFU/mL, and the total soluble solid (TSS) content was adjusted to 10° Brix. Then, fermentation was performed in a 37 °C incubator for 20 h. After fermentation, the pH, superoxide dismutase (SOD) activity, Cistanche phenylethanoid glycoside (CPhGs) content, and sensory score were determined, and the dominant strains were selected considering the aspects of SOD and acid production capacity, high CPhGs content, and high sensory score.
The optimization test used a uniform design table U16: sixteen levels of six dominant strains in the total inoculum volume were set as factors, the uniform design table is shown in Table 1, the SOD value was used as the response value, and SPSS 26.0 software was used to conduct a quadratic polynomial stepwise regression analysis to obtain the regression equation, with the maximum SOD activity as the target, then solve it using the programming solver functions in Excel. Finally, the percentages of the six strains in the inoculum were optimized.

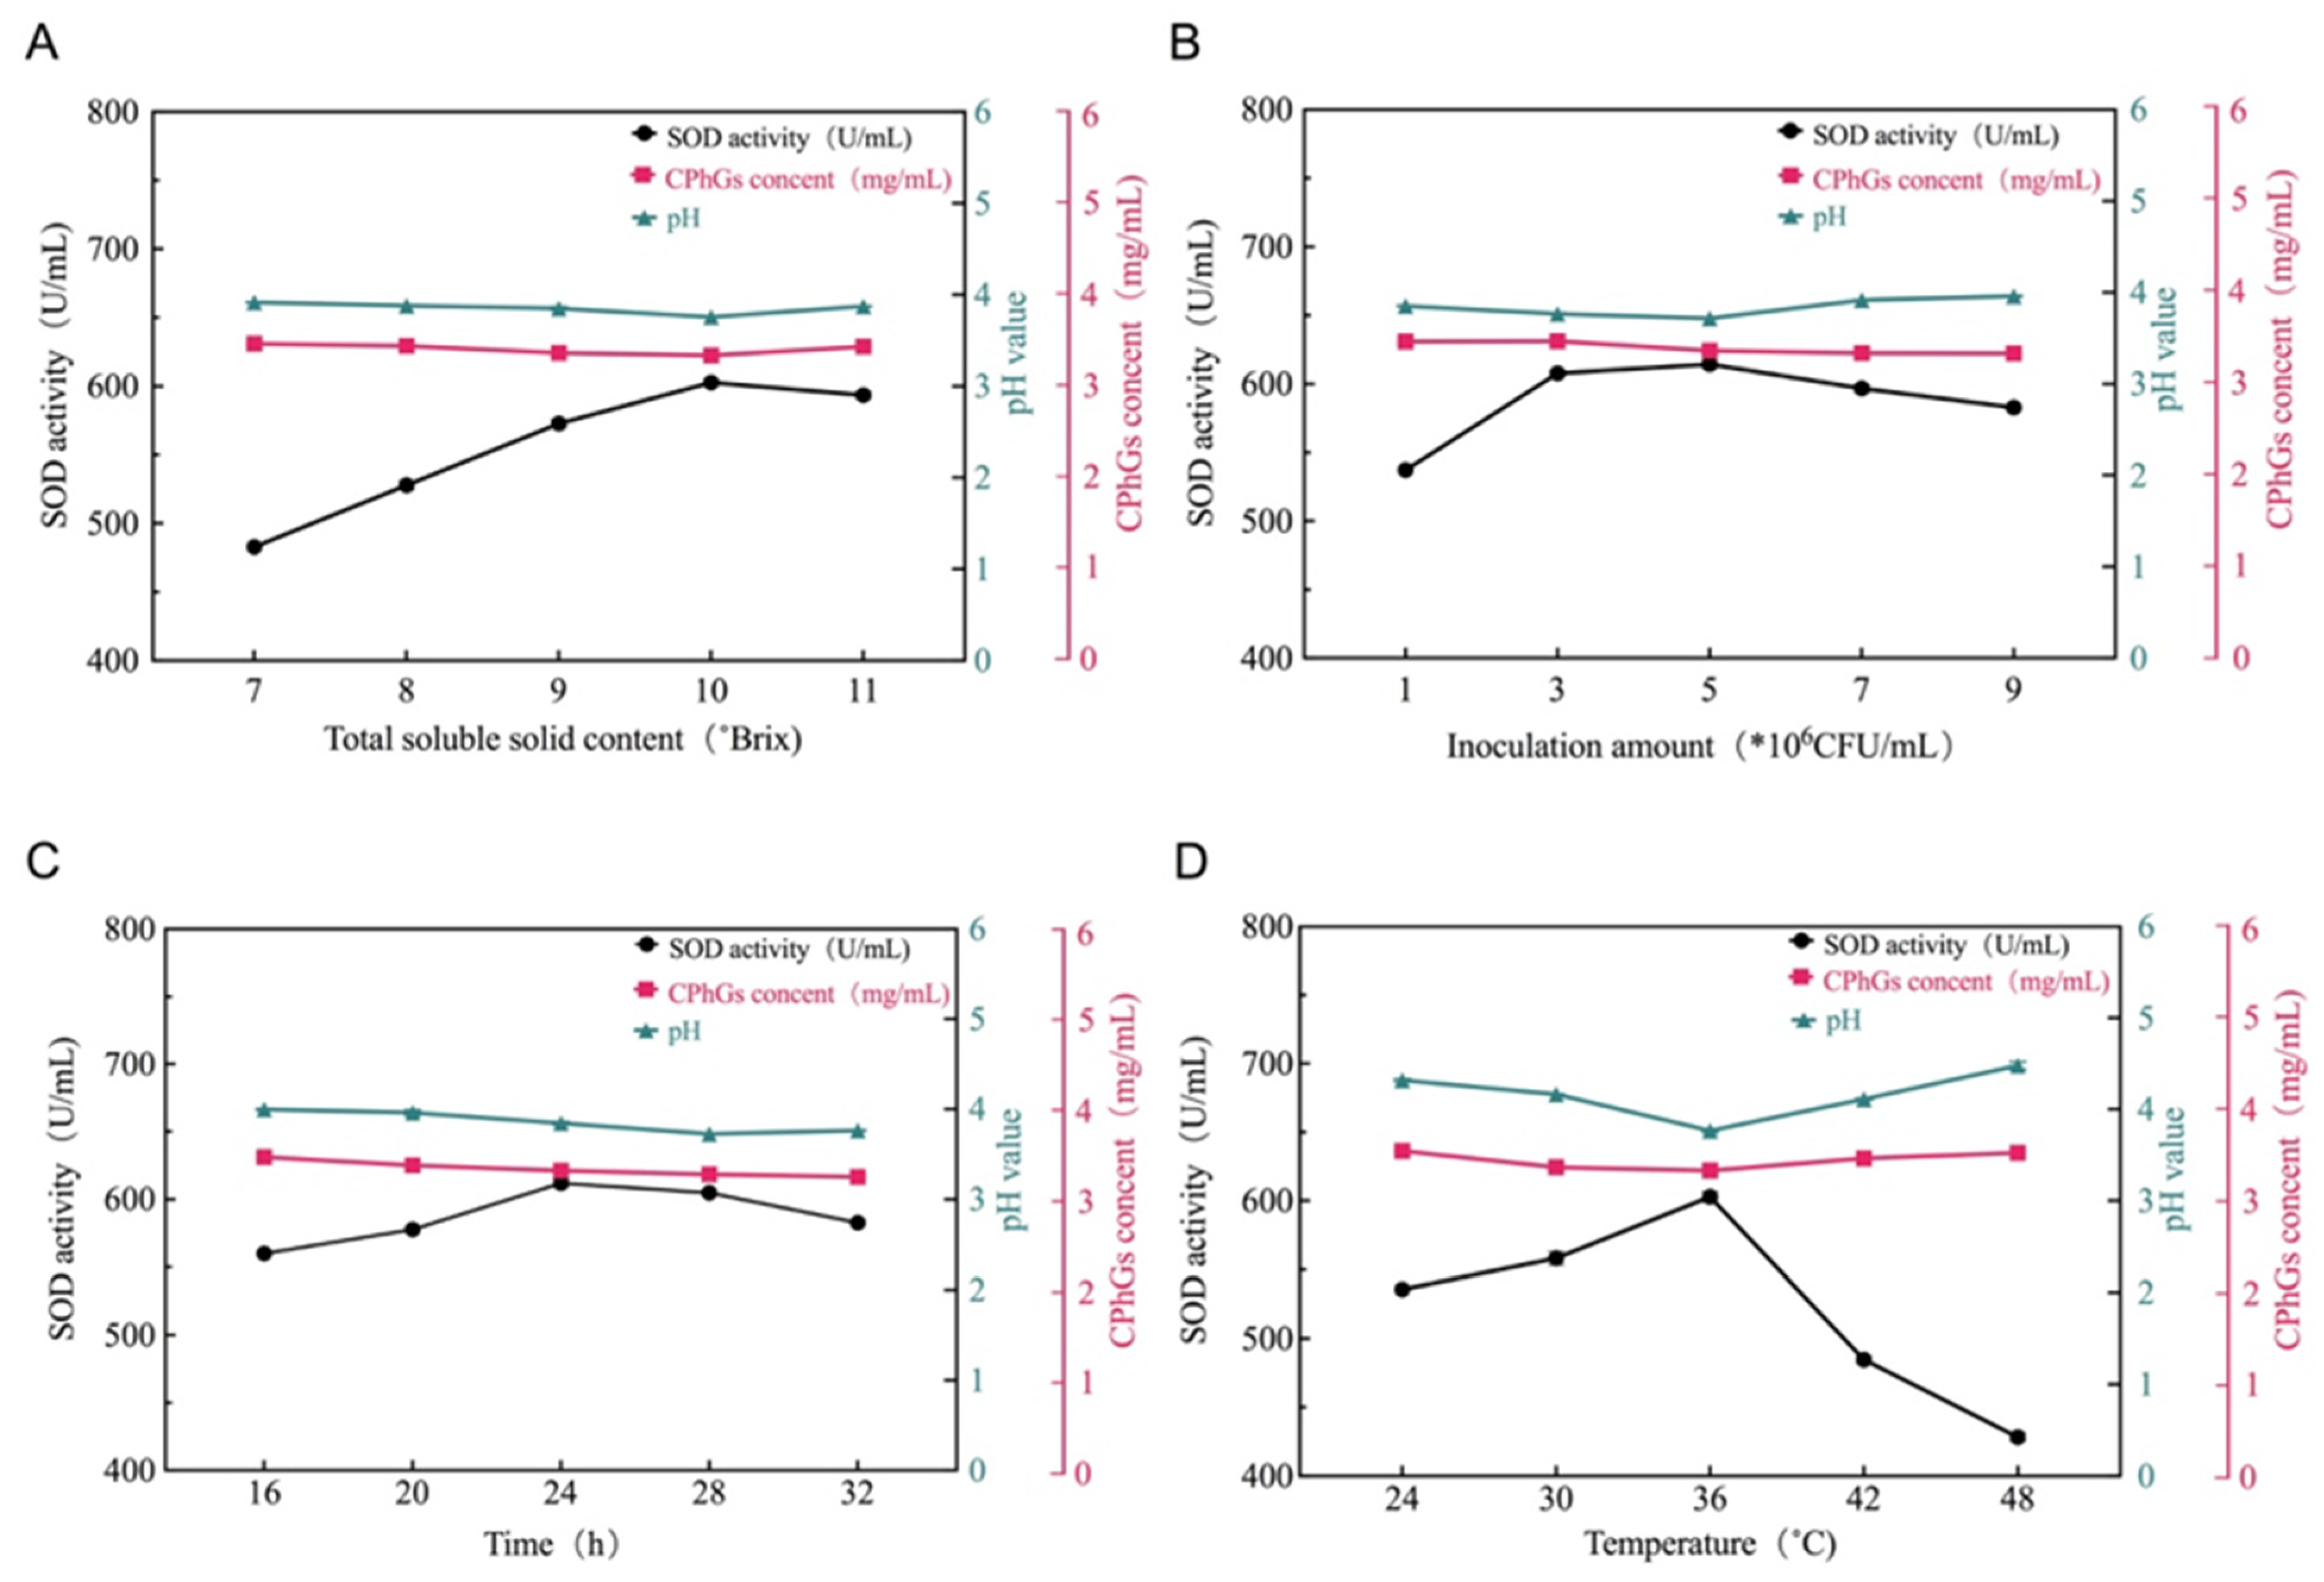
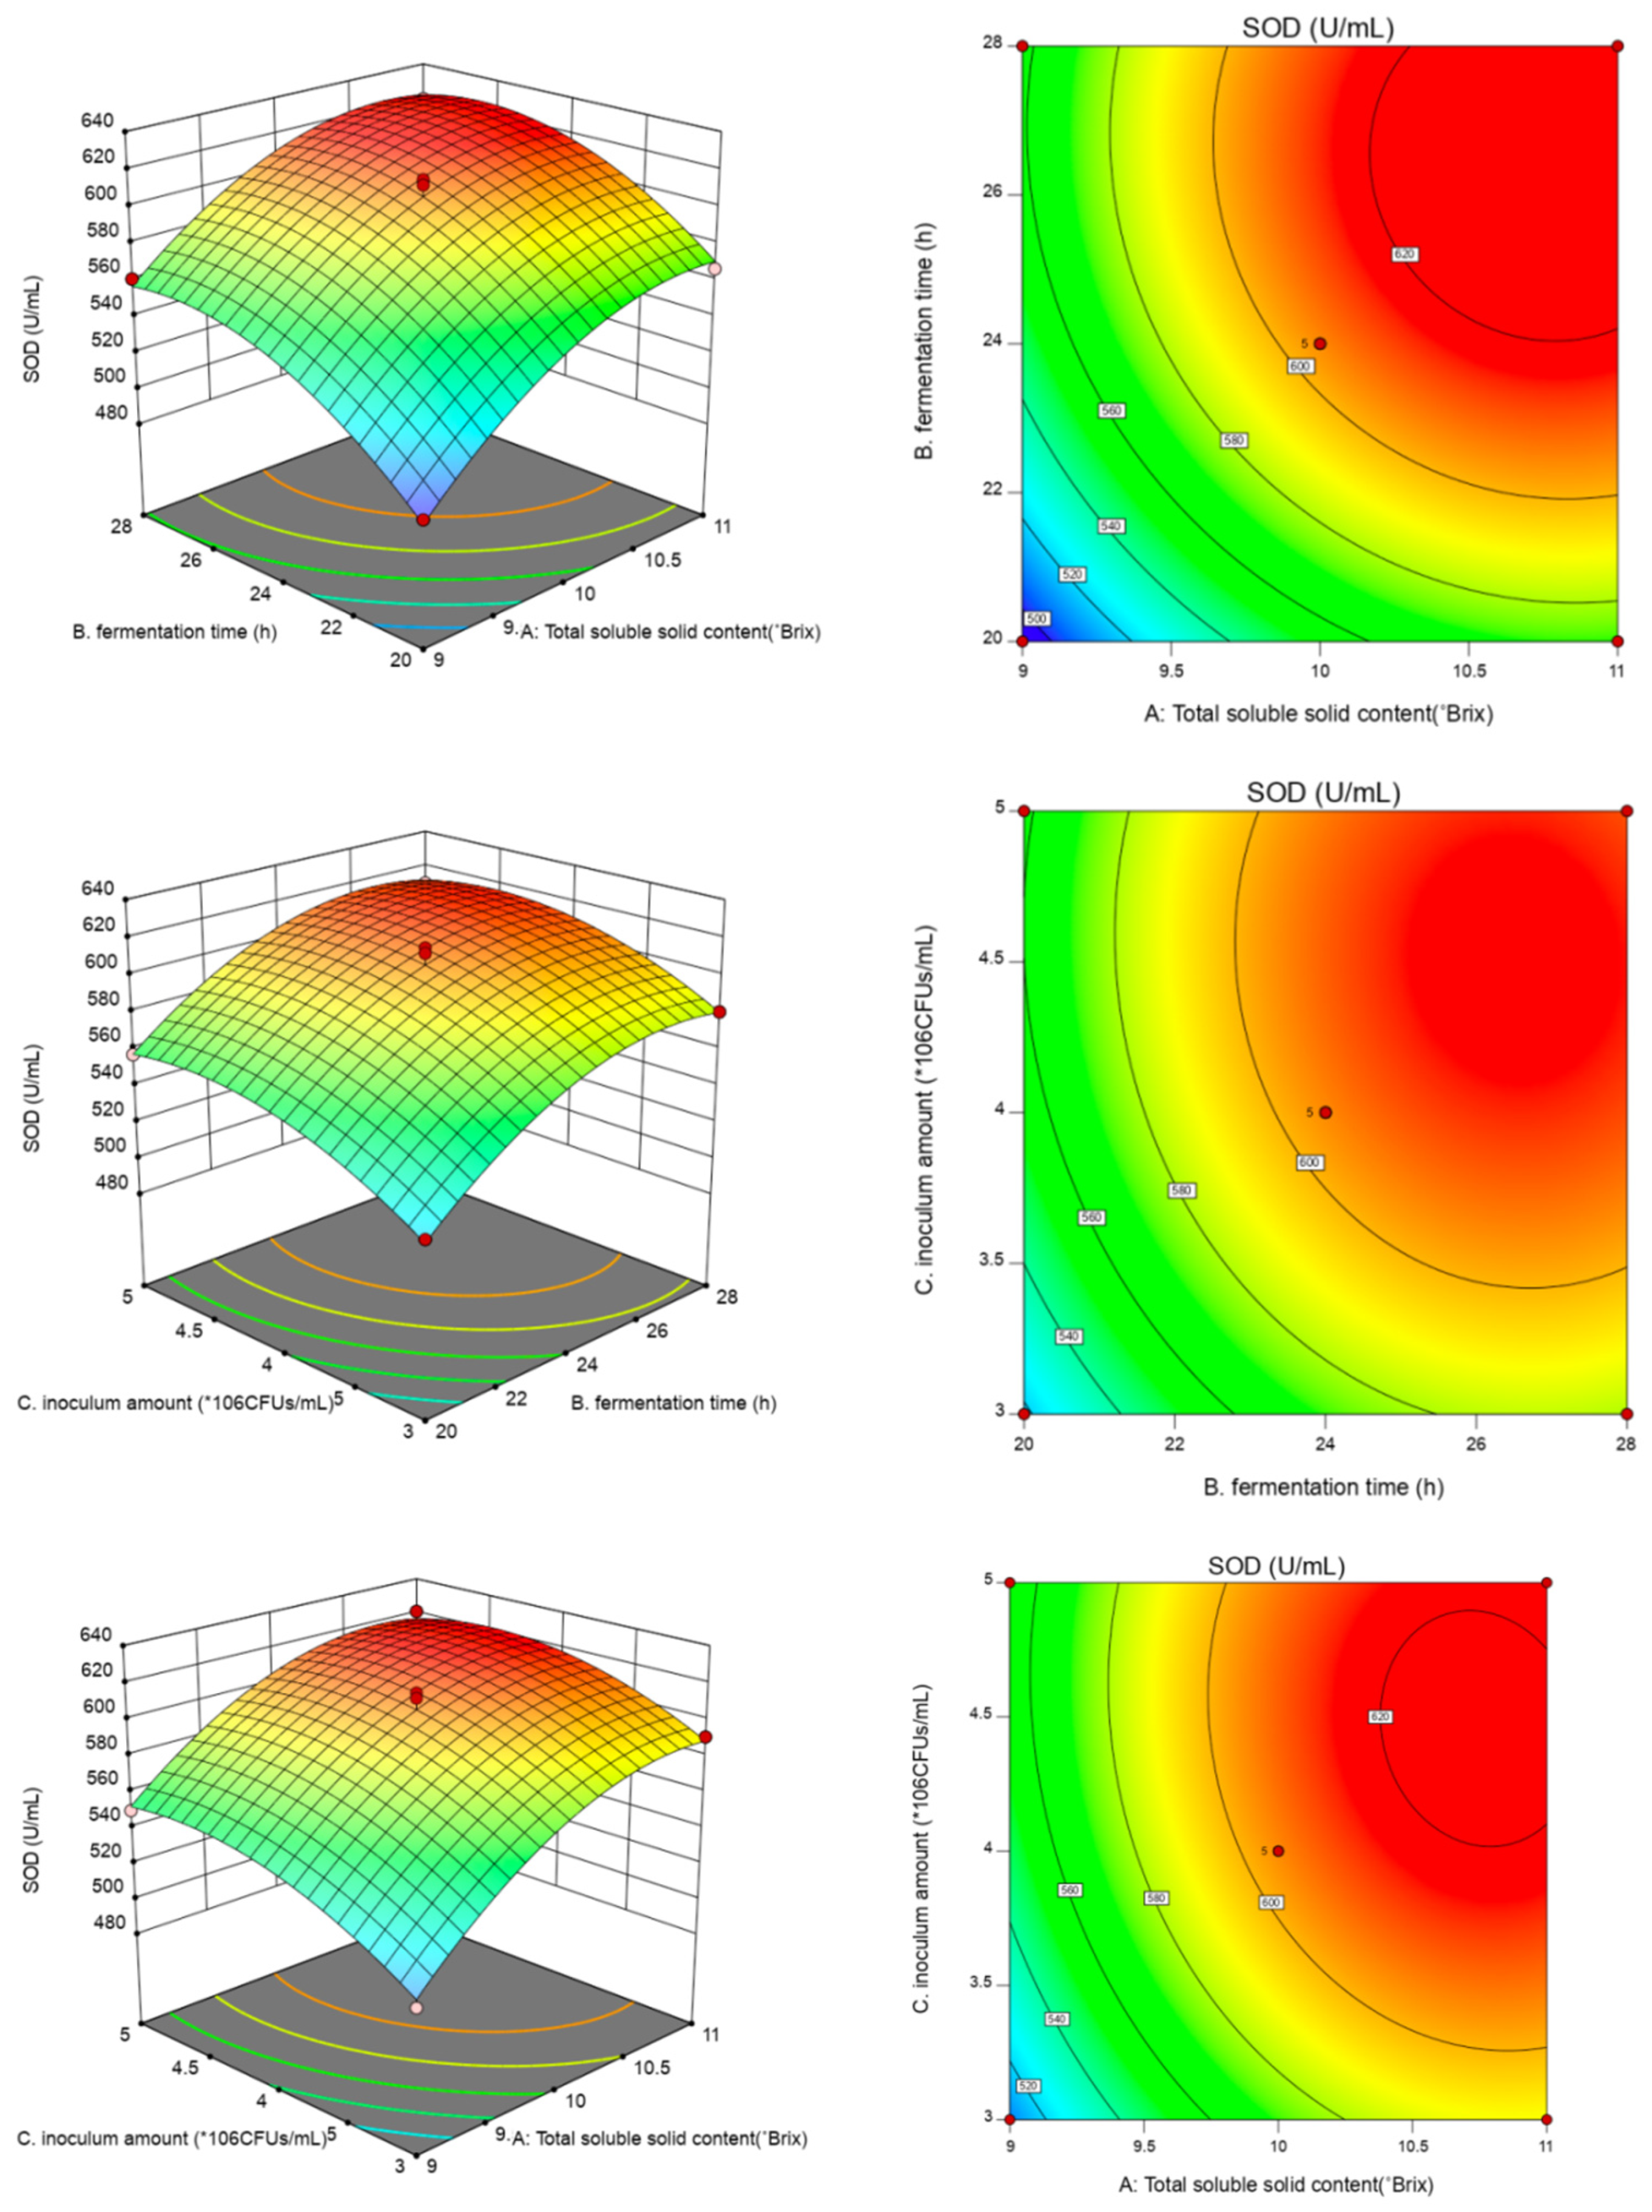
2.4. Optimization of the CFJ Fermentation Process Using the Response Surface Method

After the fermentation strains and ratios were determined, the pH, SOD value and CPhGs content detected after fermentation were used as indicators to investigate the effects of the soluble solid content (7, 8, 9, 10, and 11° Brix), inoculum volume (1, 3, 5, 7, and 9 × 10⁶ CFU/mL), fermentation temperature (24, 30, 36, 42, and 48 °C), and fermentation time (16, 20, 24, 28, and 32 h) on the CFJ.
Based on the single-factor test, a Box–Behnken test was designed with the soluble solid content (A), fermentation time (B), and inoculum amount (C) as independent variables and SOD activity (Y) as the response value. The table of factors and levels of the Box–Behnken test design is shown in Table 2.

2.5. Measurement of Physicochemical Indicators

The pH value was measured with a pH meter. Superoxide dismutase (SOD) activity was determined according to the instructions provided with the Nanjing Jiancheng kit. The total phenylethanoid glycoside (CPhGs) content was measured using the method reported by Zhang [13], with slight modifications, and the total phenylethanoid content was calculated from the standard curve equation. The sensory evaluation was performed using the methods reported by Wei et al. [14], combined with liquid fermented juice sensory characteristics. Ten people who had received sensory evaluation training rated the appearance, color, smell, taste, and texture of CFJ.

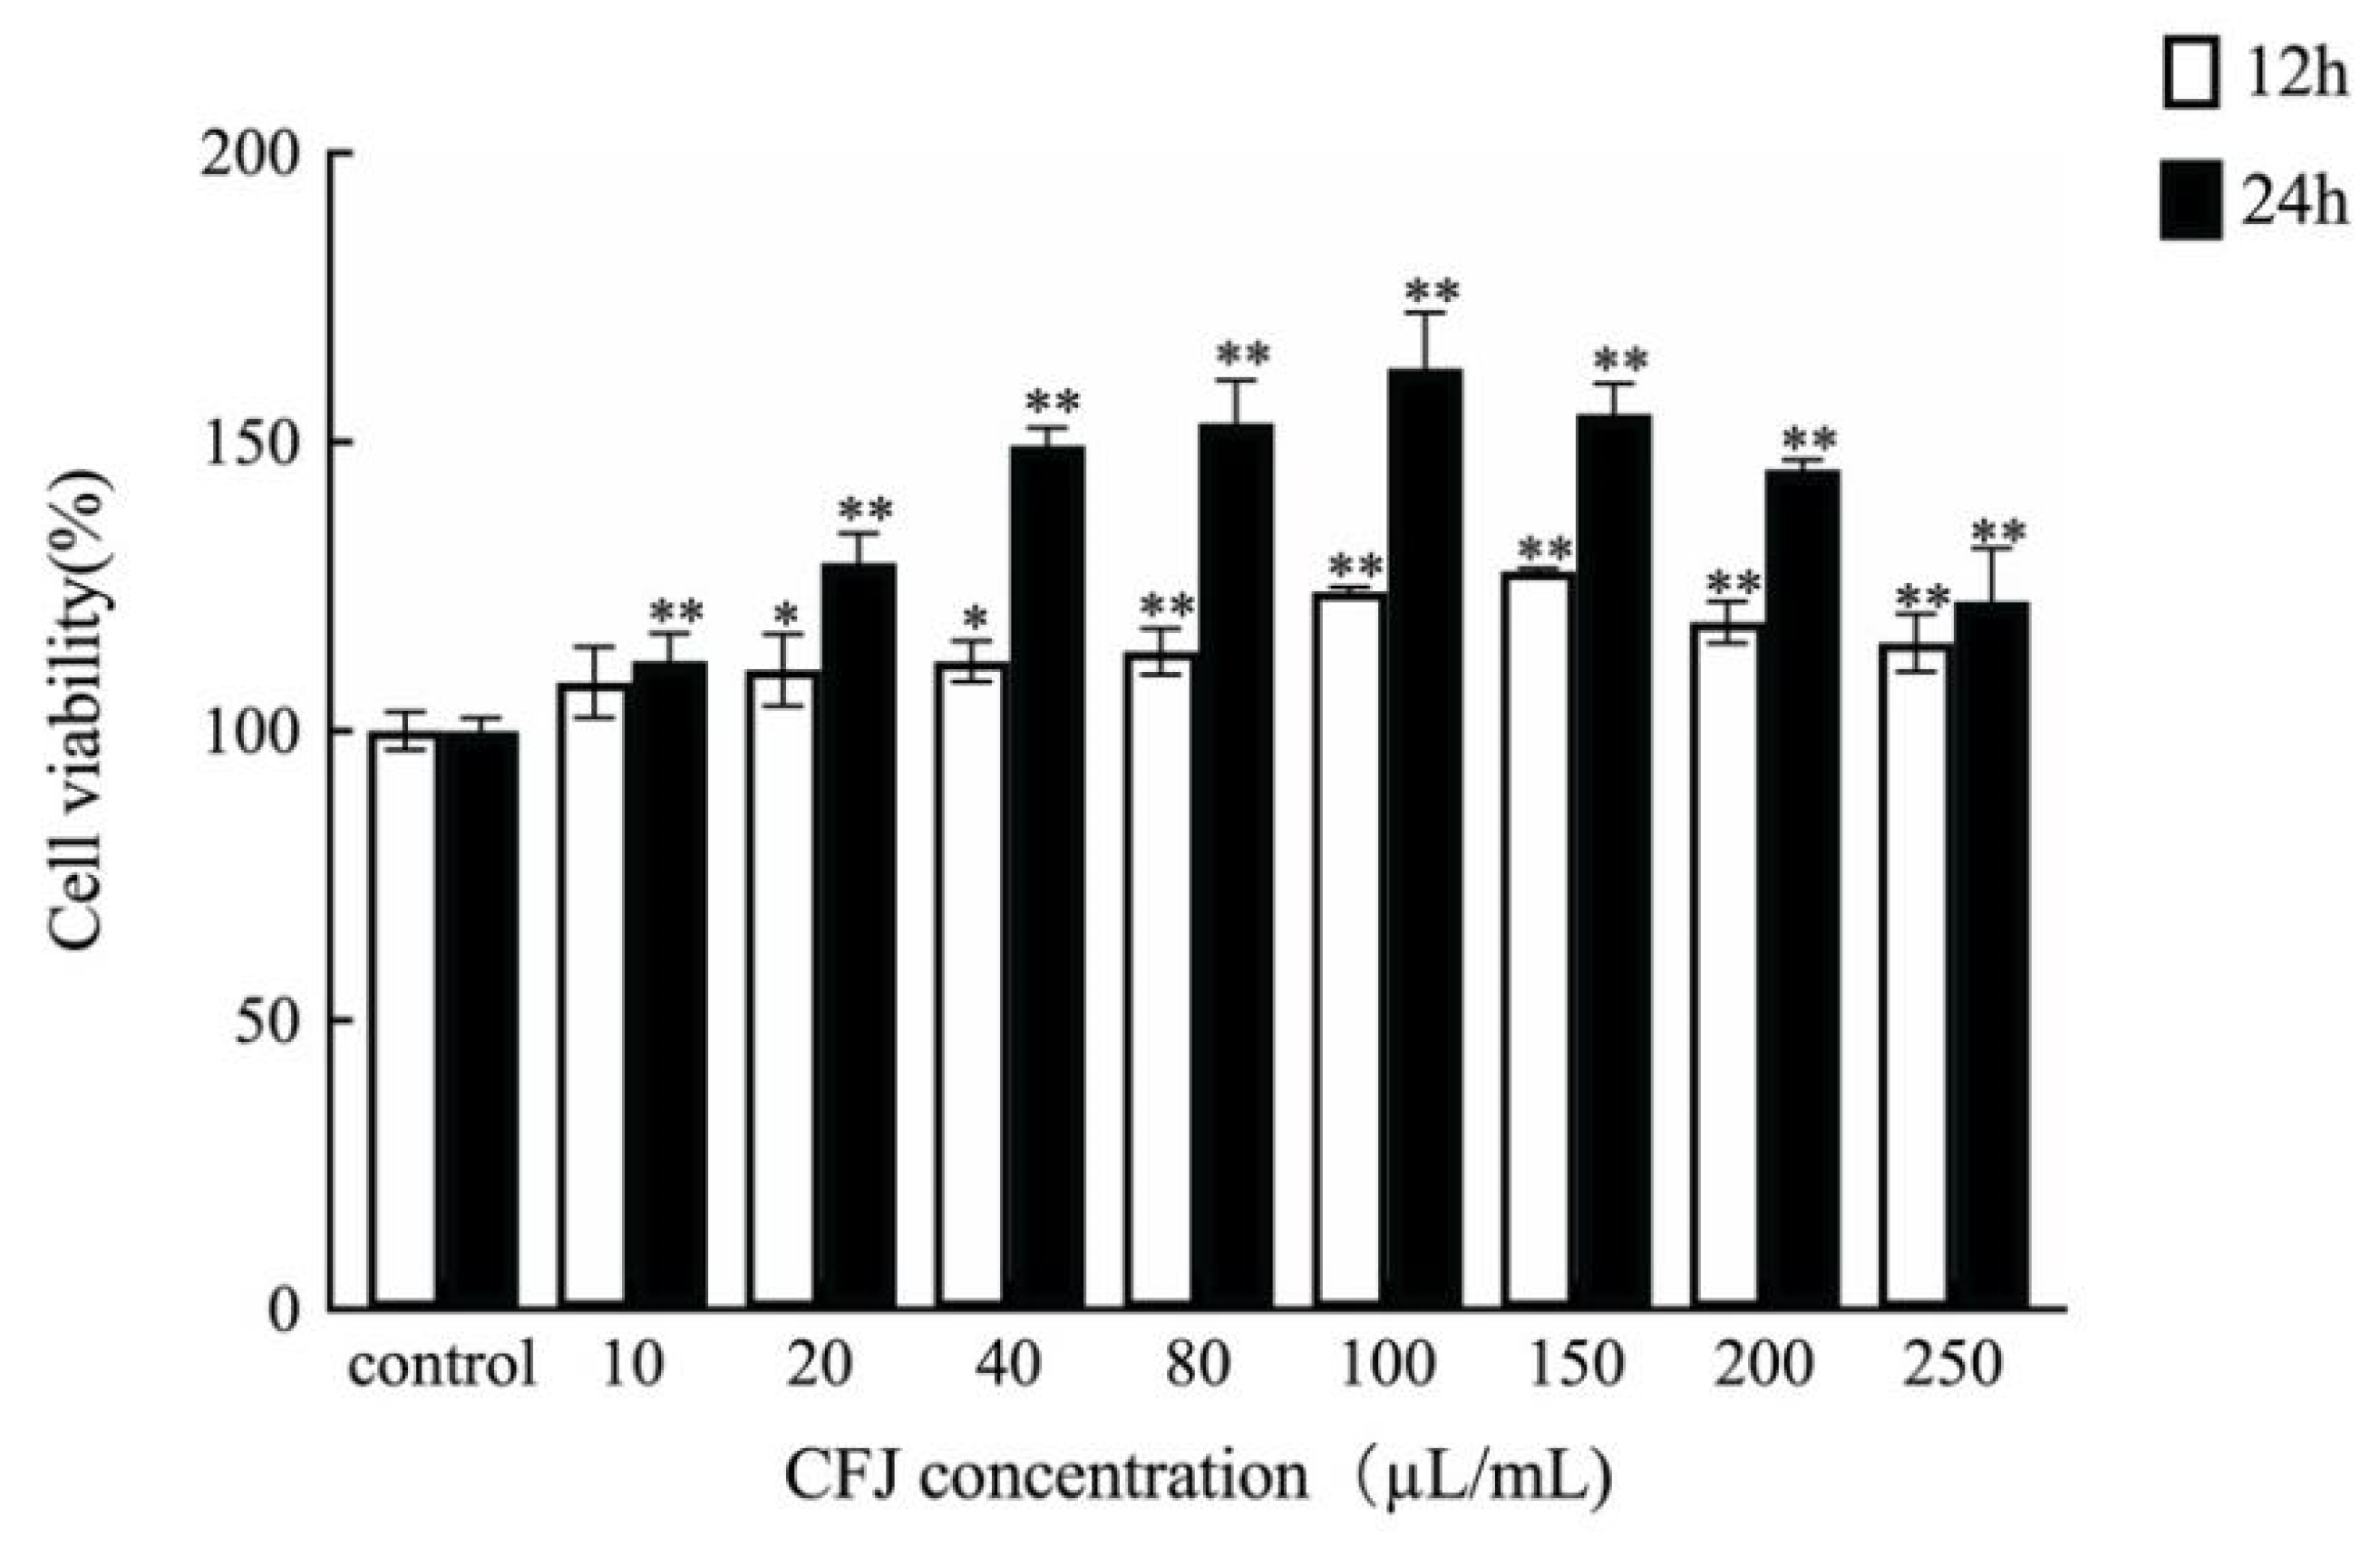
2.6. Assay of CFJ Cytotoxicity toward WRL68 Cells

WRL68 cells were inoculated in 96-well plates (1 × 10⁵ cells/mL, 100 µL per well) and incubated for 24 h. Afterward, 100 µL of PBS buffer was added to each well for the blank group, 100 µL of the medium was added to each well for the control group, medium containing different concentrations (10–250 µL/mL) of CFJ was added to the experimental group, and the culture was continued for 12 h and 24 h. Six parallel experiments were repeated. Then, cell viability was determined as described by Guo et al. [15] with slight modifications. The absorbance (A) was measured at 490 nm using a microplate reader, and cell viability was calculated using the following formula:
Cell viability (%) = (Asample − Ablank)/(Acontrol − Ablank) × 100%
where Asample is the absorbance of the experimental group, Acontrol is the absorbance of the control group without the sample, and Ablank is the absorbance of the culture medium without the sample and seeded cells.

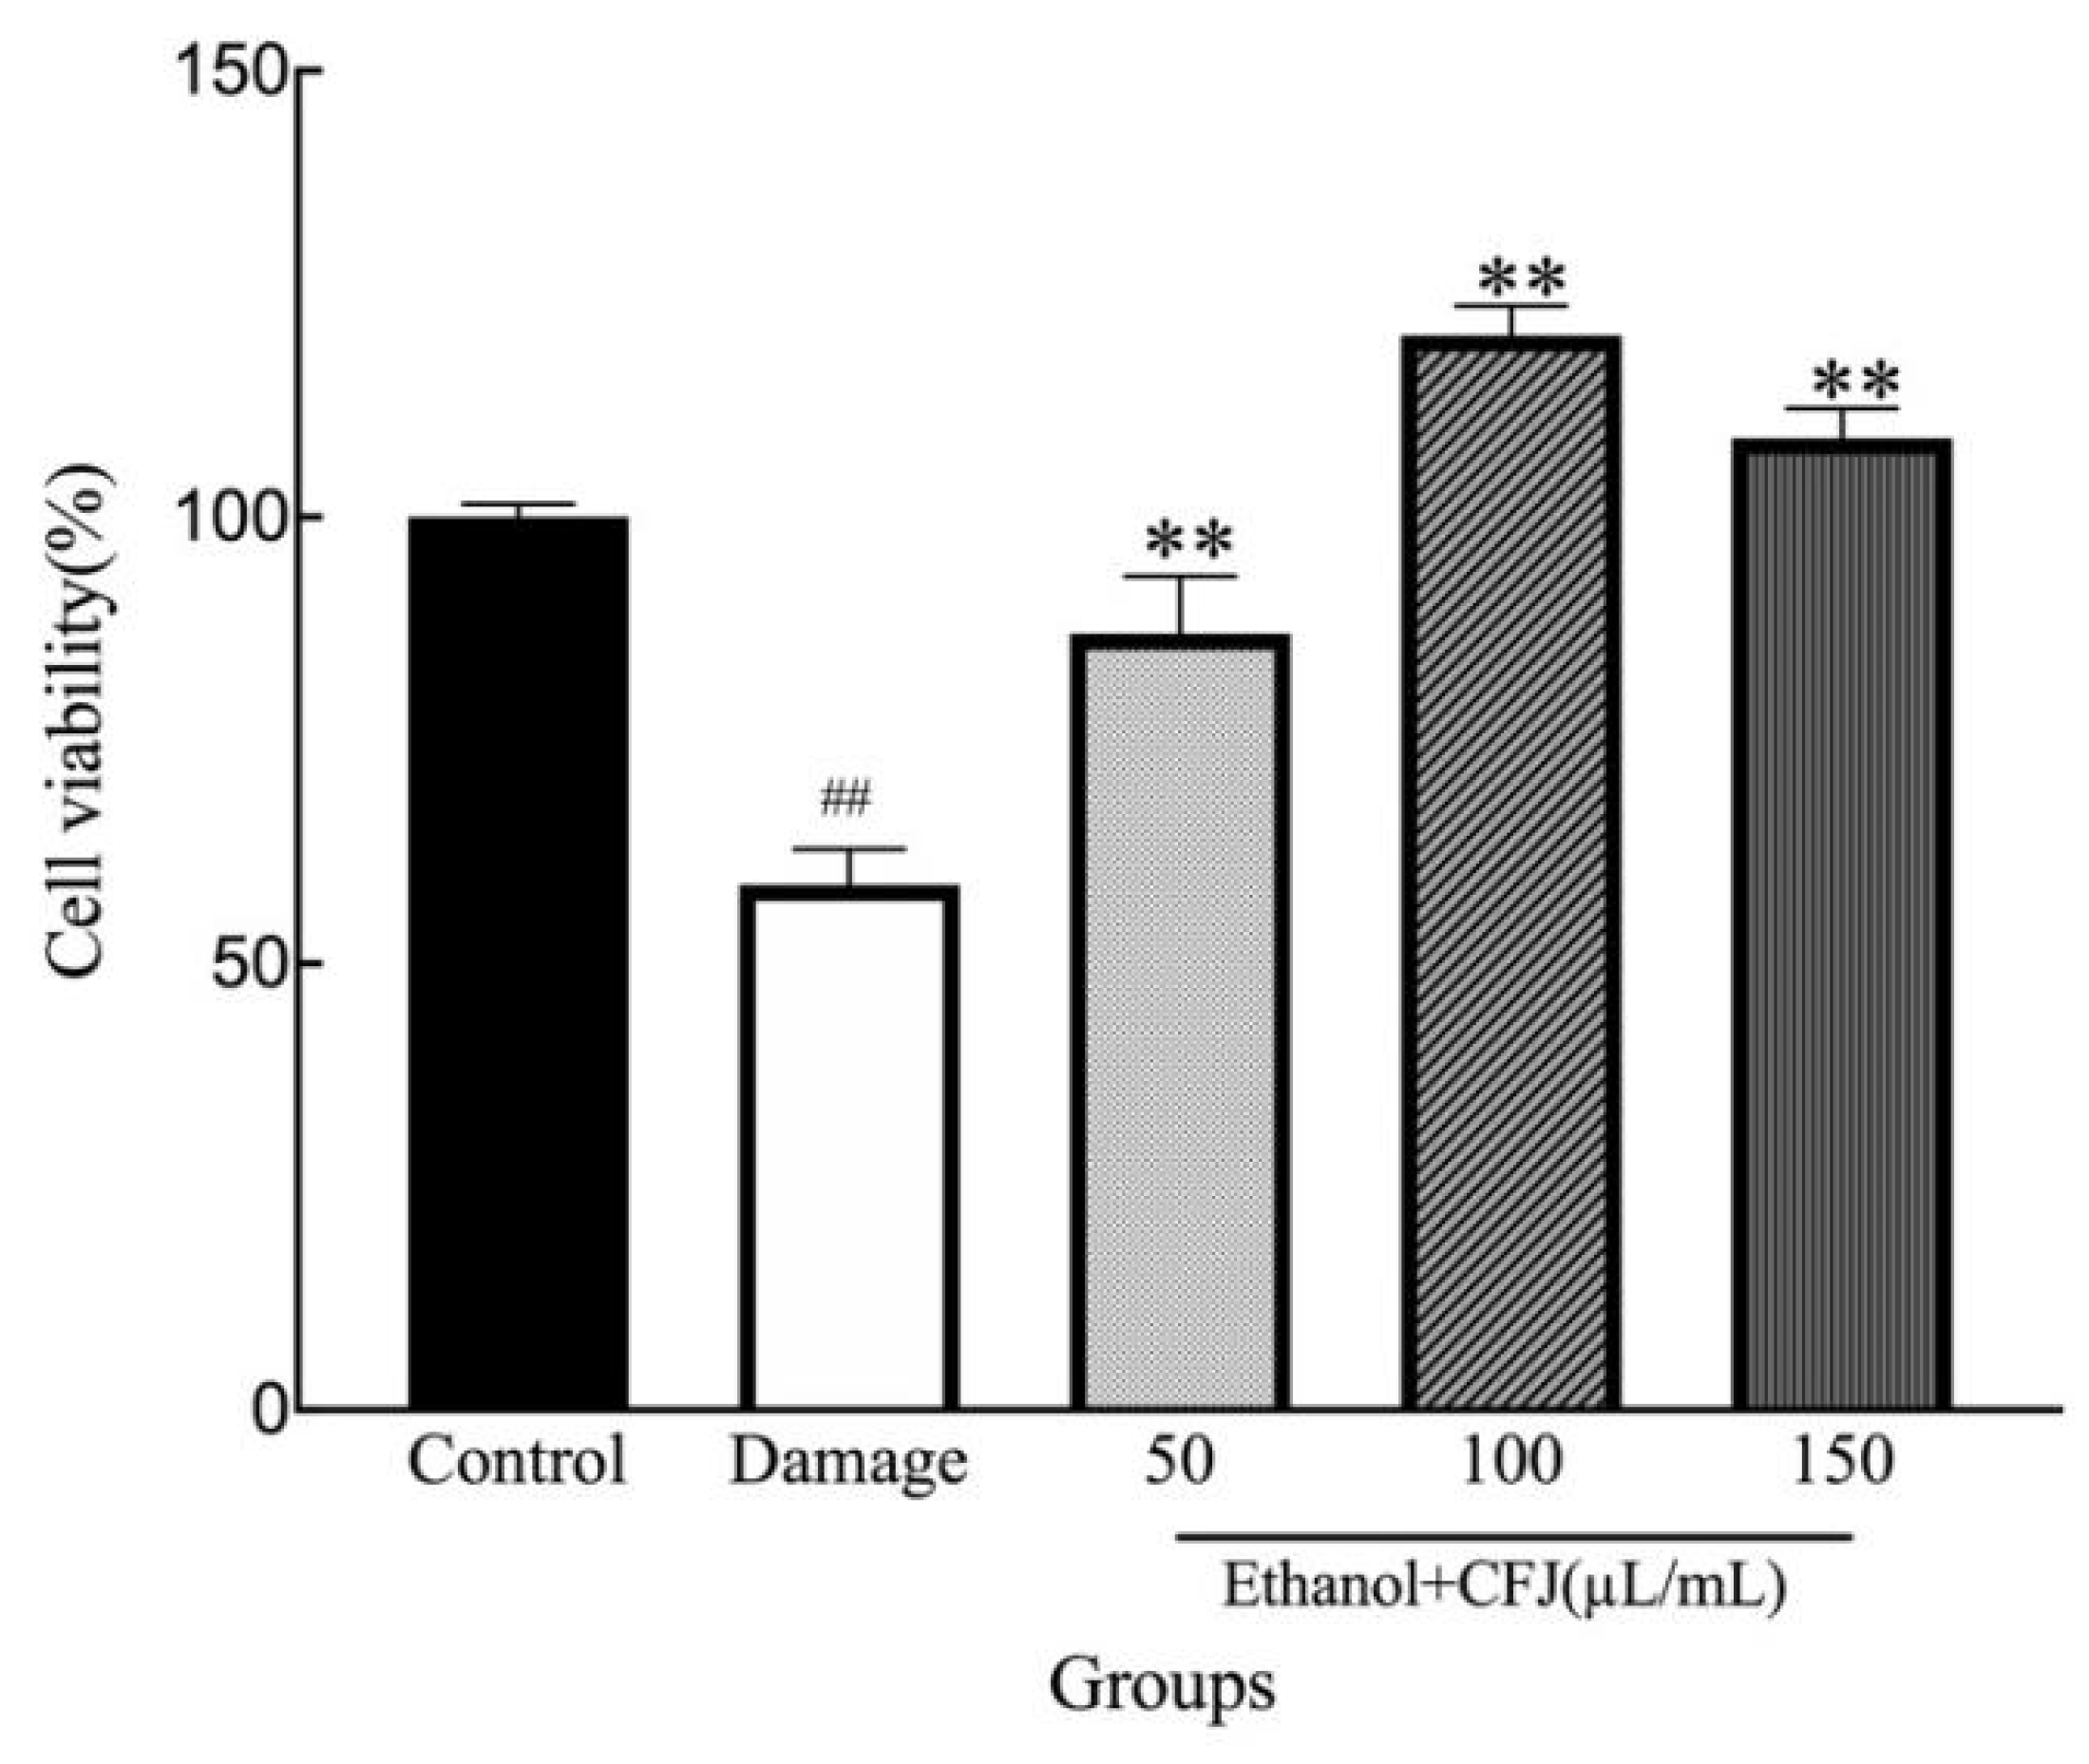
2.7. Effect of CFJ on Repairing Ethanol-Induced WRL68 Cell Damage

WRL68 cells in the logarithmic growth phase were inoculated in 96-well plates (1 × 10⁵ cells/mL, 100 µL per well) and incubated for 24 h. The experiment was divided into a blank group, a control group, a damaged group, and an experimental group. After the cells were plated, 100 µL of PBS buffer was added to each well of the blank group, 100 µL of the medium was added to each well of the control group, and 100 µL of medium containing 400 mmol/L ethanol was added to each well of the damaged group and the experimental group. After 24 h of culture, fresh medium was added to the cells in the control group and the damaged group. Medium containing different concentrations of CFJ was added to the experimental group. Six parallel experiments were repeated. After 24 h of incubation, the cell survival rate was determined using the method described in Section 2.6.

2.8. Detection of Biochemical Indices

Cells in the logarithmic growth stage were inoculated in 6-well plates (1 × 10⁶ cells/mL, 2.5 mL per well) and incubated for 24 h. Then, the cells were treated using the method described in Section 2.7. Three parallel experiments were repeated. After the culture, the cells were collected by incubating them with 0.05% trypsin-EDTA and prepared as homogenates in cold PBS with an ultrasonic cell crusher. The supernatants of cell lysates were collected to determine the intracellular MDA, SOD, and GSH-Px activities.

2.9. Statistical Analysis

The data are presented as the means ± standard deviations or average values and were analyzed using SPSS 24 software. The statistical significance of differences between groups was analyzed using ANOVA (* p < 0.05, ** p < 0.01). All figures were drawn using Prism 9 software.

3. Results

3.1. Selection of Fermentation Strains and Determination of the Proportions of Strains

The products obtained after mixed fermentation contained more metabolites due to the mutualistic symbiotic relationship between microbes. Studies have shown that the flavor [16] and nutritional [17] and storage qualities [18] of products generated by compound strains are better than those generated by single strains. Therefore, this study selected the dominant strains from 15 strains for subsequent mixed fermentation. The results are shown in Table 3. After fermentation, SOD activity increased in all groups, and pH and CPhGs content decreased.
The production of organic acids during fermentation reduced the pH value. CFJ fermented by P. pentosaceus and L. reuteri displayed the greatest decreases in pH value of 3.78 ± 0.01 and 3.79 ± 0.03, respectively, and the SOD activity reached 495.48 ± 4.79 U/mL and 503.63 ± 2.48 U/mL, respectively. The explanations for these differences may include the growth rate of the strain, differences in the optimal growth environment for different strains and differences in the utilization of carbon sources, which affects the ability of bacteria to produce organic acids. Meanwhile, SOD is produced during the fermentation of fruit juices by lactic acid bacteria [19]. Many studies have been conducted on breeding LAB with high SOD production, which may be related to the properties of lactic acid bacteria and their ability to adapt.
In addition to pH, the contents of active substances were measured as an index to evaluate CFJ, and the CPhGs content of CFJ fermented by L. casei and S. thermophilus reached 3.47 ± 0.03 mg/mL and 3.45 ± 0.02 mg/mL, respectively. FeiZhou et al. [20] showed that phenylethanol glycoside components are more susceptible to degradation in high pH environments. However, from the data in Table 3, the CPhGs content did not correlate negatively with pH value, which may be attributed to the production of phenylalanine during fermentation, while CPhGs are synthesized via the metabolic regulatory pathway of phenylethanoic acid [21]. The interaction between these two processes may be responsible for the difference in CPhGs content and they decreased to different degrees after fermentation.
Meanwhile, sensory evaluation is also a key factor affecting consumers’ decisions to purchase products. The sensory evaluation scores of the CFJ generated by B. animalis and L. acidophilus fermentation were 94.00 ± 0.77 and 92.20 ± 0.98, respectively. The potential explanations for these differences are as follows: juices fermented by strains have a characteristic sour taste, while a different organic acid composition renders the taste of each juice unique, and the volatile compound compositions of CFJ fermented by different strains are also different.
Therefore, from the perspective of better SOD and acid production abilities, high CPhGs contents and high sensory quality, P. pentosaceus, L. reuteri, L. casei, S. thermophilus, B. animalis, and L. acidophilus were selected as the dominant strains.
Mixed fermentation may compensate for defects in the other strains for cooperative fermentation. Li et al. [22] found that mixed fermentation may increase the activity of SOD and that the SOD activities produced by different proportions of mixed bacteria are different; therefore, the SOD activity of CFJ might be improved by determining the ratio of strains in the mixed fermentation. In this study, a uniform design test was conducted to determine the ratios between different strains. The uniform design results are shown in Table 4. The SOD activity of CFJ was significantly increased after fermentation with mixed bacteria; therefore, the quadratic polynomial stepwise regression equation was established with SOD activity as the response value, as follows:
Y = 838.6655 − 2.0121X1 + 0.4139X1X5 + 0.1170X2X3 − 0.1773X2X5 − 0.4025X4X5 − 26.9149X6 + 0.6187X62
p = 0.0097 < 0.01 in the regression equation, proving that the equation predicted the optimal conditions more accurately. In summary, the optimal ratios in the total inoculum volume for CFJ were predicted to be 31.74% for L. reuteri, 15.71% for L. pentosus, 17.45% for S. thermophilus, 11.65% for B. animalis, 9.56% for L. casei, and 13.89% for L. acidophilus, as the SOD activity reached 606.52 U/mL. Based on the predicted optimal conditions, the SOD activity of CFJ was 603.26 U/mL.

3.2. Response Surface Experimental Results and Analysis of Variance

Fermentation conditions must be optimized to obtain the best activity of the efficient substance. As shown in Figure 1 no significant difference in pH or CPhGs content was observed under the different fermentation conditions. Thus, SOD activity was used as the main indicator for the single-factor experiment.
As shown in Figure 1A, when the content of TSS was less than 10° Brix, fermentation was incomplete, and SOD activity was not high; in contrast, the fermentation of lactic acid bacteria was not sufficient and the SOD activity decreased. A potential explanation for this finding is that sugars in the fermentation broth promote the growth and reproduction of lactic acid bacteria. When the soluble solid content was 10° Brix, the maximum SOD activity was 602.71 U/mL, the CPhGs content was 3.34 mg/mL, and the pH was 3.76. Therefore, the optimum TSS content is 10° Brix. As shown in Figure 1B, when the inoculation amount was less than 3 × 10⁶ CFU/mL, the CFJ easily polluted miscellaneous bacteria and formed an environment that was not conducive to the multiplication and growth of bacteria. Subsequently, the bacteria could not make full use of the carbon source and other nutrients and SOD activity did not reach the maximum value. If the amount of inoculum exceeds 5 × 10⁶ CFU/mL, this may lead to excessive fermentation and change the pH of CFJ, thus affecting SOD activity. Therefore, the optimal range of the inoculum amount was 3 × 10⁶ − 5 × 10⁶ CFU/mL. As shown in Figure 1C, when the fermentation time was too short, the growth and reproduction of lactic acid bacteria were not sufficient, the accumulation of metabolites was insufficient, and SOD activity was low. If the time was too long, lactic acid bacteria growth and nutrients required for reproduction were insufficient, the number of dead bacteria increased, and metabolic waste accumulated in the fermentation liquid, resulting in decreased SOD activity. Therefore, after a comprehensive consideration of the results, the optimal fermentation time was 24 h. As shown in Figure 1D, a fermentation temperature that was too high or too low was not conducive to the growth of lactic acid bacteria, resulting in less acid production and decreased SOD activity. Therefore, the optimum fermentation temperature was 36 °C.
Based on the preliminary experiments, the fermentation temperature was set to 36 °C, and three factors (soluble solid content (A), fermentation time (B), and inoculum amount (C)) were identified as factors responsible for SOD activity. The Box–Behnken test design and results are shown in Table 5. The values of the regression coefficients were calculated, and the response variable and the test variables were related by the following second-order polynomial equation:
Y = 605.52 + 35.96A + 29.12B + 17.78C − 3.52AB − 3.94AC − 2.15 BC − 22.72A2 − 22.36B2 − 16.23C2
The statistical significance of the regression model was checked based on the F-test and p-value, and the analysis of variance (ANOVA) for the response surface quadratic model is shown in Table 6. The regression model selected here was highly significant (p < 0.01), and the lack of fit was not significant (p > 0.05), indicating that the unknown factors interfered only slightly with the experimental results and that the model was appropriately chosen. Meanwhile, the model regression coefficient R2 was 0.9256, and the corrected coefficient of determination R2Adj was 0.9707, indicating that this equation fit well with the actual situation, and thus this model can be used to predict and analyze the process of CFJ fermentation.
In this table, the linear coefficients (A, B and C) and a quadratic term coefficient (A2, B2 and C2) were significant (p < 0.01) (Figure 2). The coefficients for the other terms were not significant (p > 0.05). After the analysis, the optimal fermentation conditions were determined to be 10.71° Brix, 26.30 h, and 4.42 × 10⁶ CFU/mL inoculum. The maximum SOD activity predicted by the model was 630.43 U/mL. The model was validated with the following modified optimal conditions: the total soluble solid content was 10.7° Brix, the fermentation time was 26 h, and the inoculum amount was 4.42 × 10⁶ CFU/mL. The mean SOD activity of 629.31 ± 1.57 U/mL (n = 3) obtained in the real experiments validated the RSM model, which indicated that the model was adequate for the fermentation process. The optimized conditions were used in the subsequent experiments.

3.3. Cytotoxicity of CFJ and the Reparative Effect of CFJ on Alcohol-Induced WRL68 Cell Damage

The purpose of this paper was to study the reparative effect of CFJ on cell damage. Before the experiment, the cytotoxicity of CFJ was investigated to determine whether this preparation could be applied in the experiment. Concentrations of 10–250 µL/mL CFJ were selected to treat the cells for 12 h and 24 h, respectively. As shown in Figure 3, different concentrations of CFJ had no obvious toxic effect on the cells; in contrast, they all exerted a certain effect on cell proliferation. When the concentration of CFJ was 100 µL/mL, the survival rate of cells increased 1.6 times after 24 h. In the subsequent repair experiment, CFJ at 50–150 µL/mL was selected as the experimental concentration and 24 h was selected as the culture time.
The hepatoprotective activity of CFJ was studied in vitro by assessing the effect on WRL68 cell survival rates. The results of the cell-based experiment indicated that CFJ has potential hepatoprotective activity. The results are shown in Figure 4. The survival rate of the model group was 58.82%. When the CFJ concentration was 50–150 µL/mL, WRL68 cell survival rates were noticeably improved compared with the model group (p < 0.01). However, the cell survival rates did not show a concentration dependence. In contrast, as the concentration of CFJ reached 150 µL/mL, the WRL68 cell survival rate decreased from 120.35% to 108.86%. The potential explanation is that a low concentration of CFJ promotes the survival of WRL68 cells, but when the concentration is sufficiently high to influence the microenvironment of the cell, cell survival rates are reduced. In conclusion, when the concentration of CFJ was 50–150 µL/mL, significant differences were observed compared with the model group, and CFJ exerted a certain repair effect.

3.4. Effects of CFJ on SOD and GSH-Px Activities and MDA Contents

The levels of liver superoxide dismutase (SOD), glutathione peroxidase (GSH-Px), and malondialdehyde (MDA) were measured to quantify oxidative liver injury. MDA is the main product of the intracellular lipid oxidation reaction, and the MDA content in cells reflects the degree of intracellular lipid peroxidation. GSH-Px is an intracellular peroxidase that may clear lipids that undergo oxidative reactions in cells [23]. SOD is the primary line of defense of the body against oxidative reactions in cells, which quickly eliminates oxygen free radicals and protects the body from damage [24].
As shown in Table 7, SOD and GSH-Px activities were significantly reduced, and the MDA content was significantly increased in the model control group compared to the control group. Compared to the model control group, cells treated with 50–150 µL/mL CFJ exhibited increased SOD and GSH-Px activities and reduced MDA contents. When the concentration of CFJ reached 100 µL/mL, SOD and GSH-Px activities increased from 8.37 ± 0.45 U/mg prot and 23.34 ± 0.38 U/mg prot in the model group to 14.37 ± 0.45 U/mg prot and 34.57 ± 0.61 U/mg prot, while MDA contents decreased from 1.36 ± 0.36 nmol/mg prot to 0.88 ± 0.04 nmol/mg prot.
When cells are damaged, GSH-Px and SOD in the cells maintain redox homeostasis by clearing oxidized lipids and oxygen free radicals, thus achieving cell repair. After ethanol-induced damage, GSH-Px and SOD activities in cells were significantly decreased, while MDA contents were significantly increased, indicating that ethanol altered redox homeostasis in cells, resulting in cell damage. After treatment with CFJ, GSH-Px and SOD activities in WRL68 cells were significantly restored, and MDA contents were significantly decreased, indicating that CFJ repaired the damage caused by ethanol. Based on these results, CFJ repaired ethanol-induced cell damage by increasing SOD and GSH-PX activities and decreasing MDA contents.

4. Discussion and Conclusions

In this paper, Cistanche deserticola, a special raw material from Xinjiang, China, was used as the main raw material. After pretreatment, 15 strains were used for separate fermentation, and six strains were selected as the dominant strains for subsequent mixed fermentation, resulting in high SOD activity, rich nutrients, and good antioxidant performance. Then, a uniform design experiment was used to determine the proportions of the six strains in the mixed fermentation: 31.74% for Lactobacillus reuteri, 15.71% for Lactococcus pentosus, 17.45% for Streptococcus thermophilus, 11.65% for Bifidobacterium animalis, 9.56% for Lactobacillus casei, and 13.89% for Lactobacillus acidophilus. A response surface methodology (RSM) not only depicts the relationship between the response and the independent variables but also considers the interaction effects of the variables [25]. In this paper, the optimal fermentation conditions for CFJ determined using response surface methodology were as follows: the TSS content was 10.71 °Brix, fermentation time was 26.30 h, and the inoculum amount was 4.42 × 10⁶ CFU/mL.
Many studies have assessed the hepatoprotective effect of Cistanche, but few studies have determined the hepatoprotective effect after processing Cistanche into products. In this paper, the MTT method was used to detect the effects of CFJ on the survival rates of ethanol-damaged WRL68 cells. CFJ promoted the proliferation of WRL68 cells, and CFJ exerted an obvious effect in repairing ethanol-treated cells, for which the cell survival rate increased to 120.35 ± 0.77% (p < 0.05). The potential underlying mechanism was that CFJ reduced the MDA content in damaged cells from 1.36 nmol/mg prot to 0.88 nmol/mg prot and increased GSH-Px and SOD activities by 48% and 72%, respectively. This study provides a theoretical basis and reference data for future clinical applications and developments in the fields of liver injury and prevention of liver cancer.
In this paper, a preliminary study was conducted on the development of Cistanche fermented juice and its activity in repairing alcohol-injured hepatocytes in vitro. Due to the complexity of the fermentation process and the limitations of in vitro experiments, the following issues still require further study:
(1) The potential microbial flora and the structure–activity relationship of metabolites in the fermentation process;
(2) Research and development of a new compound, CFJ, to make it available as a prominently placed fermented juice product and so better serve the local economic situation;
(3) Investigate the reparative effect of CFJ on alcoholic liver injury by performing animal experiments.

Author Contributions

Conceptualization, Z.Y. and L.W.; methodology, Z.Y. and L.W.; software, Z.Y.; data curation, Z.Y.; writing—original draft preparation, Z.Y.; writing—review and editing, L.W.; visualization, Z.Y.; supervision, L.W.; project administration, L.W.; funding acquisition, L.W. All authors have read and agreed to the published version of the manuscript.

Funding

This research was funded by the Xinjiang Autonomous Region Graduate Innovation Project (XJ2021G088).

Institutional Review Board Statement

Not applicable.

Informed Consent Statement

Not applicable.

Data Availability Statement

Data is contained within the article.

Acknowledgments

The authors are also indebted to the anonymous reviewers for their constructive comments and suggestions for the improvement of this manuscript.

Conflicts of Interest

The authors declare no conflict of interest.

References

  1. Guo, Y.; Cui, Q.; Ren, S.; Hao, D.; Morikawa, T.; Wang, D.; Liu, X.; Pan, Y. The hepatoprotective efficacy and biological mechanisms of three phenylethanoid glycosides from cistanches herba and their metabolites based on intestinal bacteria and network pharmacology. J. Nat. Med. 2021, 75, 784–797. [Google Scholar] [CrossRef] [PubMed]
  2. Guo, Y.; Cao, L.; Zhao, Q.; Zhang, L.; Chen, J.; Liu, B.; Zhao, B. Preliminary characterizations, antioxidant and hepatoprotective activity of polysaccharide from Cistanche deserticola. Int. J. Biol. Macromol. 2016, 93, 678–685. [Google Scholar] [CrossRef] [PubMed]
  3. Li, M.; Tian, X.; Li, X.; Mao, T.; Liu, T. Anti-fatigue activity of gardenia yellow pigment and Cistanche phenylethanol glycosides mixture in hypoxia. Food Biosci. 2021, 40, 100902. [Google Scholar] [CrossRef]
  4. Morikawa, T.; Pan, Y.; Ninomiya, K.; Imura, K.; Matsuda, H.; Yoshikawa, M.; Yuan, D.; Muraoka, O. Acylated phenylethanoid oligoglycosides with hepatoprotective activity from the desert plant Cistanche tubulosa. Bioorg. Med. Chem. 2010, 18, 1882–1890. [Google Scholar] [CrossRef]
  5. Bao, X.; Bai, D.; Liu, X.; Wang, Y.; Zeng, L.; Wei, C.; Jin, W. Effects of the Cistanche tubulosa Aqueous Extract on the Gut Microbiota of Mice with Intestinal Disorders. Evid.-Based Complement. Altern. Med. 2021, 2021, 1–11. [Google Scholar] [CrossRef]
  6. Ma, D.; Li, Y.; Yang, X.; Dai, H.; Zhang, L.; Fan, Q. Research progress of harvesting processing and concoction method of Cistanche origin. China Pharm. 2019, 30, 839–841. [Google Scholar]
  7. Wang, L.; Guo, Y.; He, B.; Zhang, Q. Effect of drying method on content Retention of effective components in Herba Cistanches. Resour. Dev. Mark. 2017, 33, 477–480. [Google Scholar]
  8. Marsh, A.J.; Hill, C.; Ross, R.P.; Cotter, P.D. Fermented beverages with health-promoting potential: Past and future perspectives. Trends Food Sci. Technol. 2014, 38, 113–124. [Google Scholar] [CrossRef] [Green Version]
  9. Feng, Y.; Zhang, M.; Mujumdar, A.S.; Gao, Z. Recent research process of fermented plant extract: A review. Trends Food Sci. Technol. 2017, 65, 40–48. [Google Scholar] [CrossRef]
  10. Cheng, Y.; Li, P.; Hu, B.; Xu, L.; Liu, S.; Yu, H.; Guo, Y.; Xie, Y.; Yao, W.; Qian, H. Correlation analysis reveals the intensified fermentation via lactobacillus plantarum improved the flavor of fermented noni juice. Food Biosci. 2021, 43, 101234. [Google Scholar] [CrossRef]
  11. Yang, X.; Zhou, J.; Fan, L.; Qin, Z.; Chen, Q.; Zhao, L. Antioxidant properties of a vegetable-fruit beverage fermented with two Lactobacillus plantarum. Food Sci. Biotechnol. 2018, 27, 1719–1726. [Google Scholar] [CrossRef] [PubMed]
  12. Srijita, S.; Didier, M.; Gargi, D. Principal component analysis for clustering probiotic-fortified beverage matrices efficient in elimination of Shigella sp. Fermentation 2018, 4, 34. [Google Scholar] [CrossRef] [Green Version]
  13. Zhang, L.; Du, N.; Wang, Q. Determination of Phenylethanoid Glycosides in Total Cistanchis Glycoside Capsule by UV Spectrophotometry. J. Xinjiang Med. Univ. 2002, 25, 407–408. [Google Scholar]
  14. Yang, J.B.; Huang, J.L. Optimization of Preparation Process of Sugarcane Lactobacillus Beverage. Food Res. Dev. 2020, 41, 75–78. [Google Scholar]
  15. Dong, X.; Zhang, X.; Zhao, W.; Nie, C.; Song, Y. Protective roles of hop proanthocyanidins on alcohol-induced sh-sy5y cell damage. J. Am. Soc. Brew. Chem. 2019, 78, 1–9. [Google Scholar] [CrossRef]
  16. Hashemi, S.; Jafarpour, D. Fermentation of bergamot juice with lactobacillus plantarum strains in pure and mixed fermentations: Chemical composition, antioxidant activity and sensorial properties. LWT-Food Sci. Technol. 2020, 131, 109803. [Google Scholar] [CrossRef]
  17. Tada, S.; Katakura, Y.; Ninomiya, K.; Shioya, S. Fed-batch coculture of lactobacillus kefiranofaciens with saccharomyces cerevisiae for effective production of kefiran. J. Biosci. Bioeng. 2007, 103, 557–562. [Google Scholar] [CrossRef]
  18. Zhang, C.; Quek, S.Y.; Fu, N.; Su, Y.; Chen, X.D. Storage stability and in vitro digestion of microencapsulated powder containing fermented noni juice and probiotics. Food Biosci. 2020, 37, 100740. [Google Scholar] [CrossRef]
  19. Espirito-Santo, A.P.; Carlin, F.; Renard, C.M.G.C. Apple, grape or orange juice: Which one offers the best substrate for lactobacilli growth?—A screening study on bacteria viability, superoxide dismutase activity, folates production and hedonic characteristics. Food Res. Int. 2015, 78, 352–360. [Google Scholar] [CrossRef] [Green Version]
  20. Zhou, F. Mechanism of the Influence of Bioavailability of Cinnamon Phenylethanol Glycosides and Its Improvement Based on Nanocarriers; Zhejiang University: Zhenjiang, China, 2018. [Google Scholar]
  21. Xie, J.; Liu, Y.; Ke, J. Research progress on the synthesis of phenylethanol glycosides. Chin. Tradit. Herb. Drugs 2019, 50, 5109–5116. [Google Scholar]
  22. Li, J.; Wen, L.; Luo, X.; Feng, C.; Li, X. Study on the change of SOD activity in three—Stage fermentation and natural fermentation. Light Ind. Sci. Technol. 2016, 32, 4–5,33. [Google Scholar]
  23. Liu, C.H.; Jin, Z.D.; Han, B.R. Antioxidant activity of polysaccharide fup-1 from fritillaria ussuriensis maxim in d-galactose-induced aging mouse model. Food Sci. 2011, 32, 285–288. [Google Scholar]
  24. Guo, Z.; Fan, N.; Tian, H.; Teng, F.; Li, M.; Li, Y.; Wang, Z.; Jiang, L. Protective effects of flavonoids from millet bran on H2O2-induced oxidative stress injury in HepG2 cells. Food Sci. 2020, 41, 159–165. [Google Scholar]
  25. Zhao, X.; Liu, J.; Hu, Y.; Fan, Y.; Wang, D.; Yuan, J.; Xu, L.; Cui, L.; Jing, Z. Optimization on condition of glycyrrhetinic acid liposome by RSM and the research of its immunological activity. Int. J. Biol. Macromol. 2012, 51, 299–304. [Google Scholar] [CrossRef]
Figure 1. Subfigures (AD) shows the influence of fermentation temperature, time, inoculation amount, and total soluble solid content on the SOD activity, pH value, and CPhGs content of CFJ.
Fermentation 08 00178 g001
Figure 2. The influence of the interaction of factors on the SOD activity of CFJ.
Fermentation 08 00178 g002
Figure 3. Effects of different concentrations of CFJ on cell survival rates compared with the control group (* p < 0.05, ** p < 0.01).
Fermentation 08 00178 g003
Figure 4. The effects of CFJ on the survival rates of ethanol-damaged WRL68 cells compared with the control group (## p < 0.01) and with the damaged group (** p < 0.01).
Fermentation 08 00178 g004
Table 1. Uniform design table for the experiment.
No.L. reuteri
X1 (%)
P. pentosaceus
X2 (%)
S. thermophilus
X3 (%)
B. animalis
X4 (%)
L. casei
X5 (%)
L. acidophilus
X6 (%)
118139211328
2191715141026
32021424724
421251017422
522121627120
623165201518
7242011181316
825241723914
92611616629
1027151226327
1128191819025
1229237121423
13301013221121
1431141915819
153218825517
1633221418215
Table 2. Factors and levels of the experiment.
FactorsLevels
−101
A. Total soluble solid content (° Brix)91011
B. Fermentation time (h)202428
C. Inoculum amount (×106 CFU/mL)345
Table 3. Physicochemical properties of CFJ fermented by fifteen strains.
No.StrainspHSOD Activity (U/mL)CPhGs (mg/mL)Sensory Evaluation (Score)
Decoction of cistanche5.32 ± 0.00 a401.26 ± 0.00 h3.73 ± 0.00 a/
1L. fermentum4.11 ± 0.01 i462.42 ± 2.07 c3.13 ± 0.01 e88.70 ± 1.19 d
2S. thermophilus4.19 ± 0.02 h414.60 ± 2.78 fg3.45 ± 0.02 b86.60 ± 1.36 e
3S. cerevisiae4.13 ± 0.01 i443.66 ± 1.21 d3.18 ± 0.01 d88.20 ± 1.25 de
4L. casei4.58 ± 0.04 f426.44 ± 3.63 e3.47 ± 0.03 b87.20 ± 1.60 e
5P.pentosaceus3.78 ± 0.01 k495.48 ± 4.79 ab3.16 ± 0.04 de89.40 ± 1.02 d
6B. animalis3.89 ± 0.03 jk491.03 ± 2.00 b3.22 ± 0.01 d92.20 ± 0.98 b
7K. marxianus4.59 ± 0.04 f437.83 ± 3.30 de3.30 ± 0.03 c84.30 ± 0.90 f
8L. reuteri3.79 ± 0.03 k503.63 ± 2.48 a3.14 ± 0.00 e86.10 ± 1.58 e
9S. cerevisiae boulardii5.28 ± 0.02 b410.11 ± 2.55 g3.35 ± 0.01 c82.00 ± 1.48 g
10L. acidophilus4.35 ± 0.01 g454.27 ± 2.76 c3.02 ± 0.02 f94.00 ± 0.77 a
11L. bulgaricus3.96 ± 0.02 j486.87 ± 4.32 b3.13 ± 0.01 e91.10 ± 0.94 c
12W. kandleri4.79 ± 0.00 e420.36 ± 2.28 ef3.36 ± 0.04 c86.20 ± 0.98 e
13L. rhamnosus4.91 ± 0.02 d441.39 ± 8.66 d3.11 ± 0.03 ef84.10 ± 1.14 f
14T. delbrueckii5.06 ± 0.02 c416.93 ± 3.01 f3.35 ± 0.04 c88.50 ± 1.28 de
15L. paracasei4.95 ± 0.02 d439.13 ± 3.42 d3.20 ± 0.02 d84.30 ± 1.79 f
Data are expressed as means ± SDs. Different letters next to data in the same column indicate significant differences between data (p < 0.05).
Table 4. Results of uniform design experiments.
No.L. reuteri
X1 (%)
P. pentosaceus
X2 (%)
S. thermophilus
X3 (%)
B. animalis
X4 (%)
L. casei
X5 (%)
L. acidophilus
X6 (%)
SOD Activity
(U/mL)
118139211328503.84
2191715141026525.28
32021424724482.40
421251017422544.96
522121627120514.56
623165201518498.56
7242011181316528.14
825241723914557.44
92611616629550.48
1027151226327536.00
1128191819025525.28
1229237121423549.95
13301013221121520.07
1431141915819561.15
153218825517504.73
1633221418215546.99
Table 5. The experiments and results of response surface optimization of the CFJ fermentation process.
No.Levels of Independent FactorsResponse
A. Total Soluble Solid Content (° Brix)B. Time (h)C. Inoculation Amount
(×106 CFU/mL)
SOD Activity (U/mL)
111204566.76
210203590.89
310205596.41
49245619.58
510244614.75
610285550.15
79243611.84
89284609.83
910244580.67
109204604.33
1110244600.29
1211284561.18
1311245519.76
1411243557.50
1510283504.60
1610244494.29
1710244620.68
Table 6. Analysis of variance to CFJ of SOD activity.
SourceSum of SquaresdfMean SquareF-Valuep-Value
Model25,787.6892865.3059.87<0.0001**
A TSS content10,345.19110,345.19216.17<0.0001**
B. Fermentation time6782.4016782.40141.72<0.0001**
C. Inoculation amount2529.0612529.0652.850.0002**
AB49.56149.561.040.3427
AC62.12162.121.300.2921
BC18.40118.400.38460.5548
2172.8812172.8845.400.0003**
2104.5112104.5143.970.0003**
1108.6911108.6923.170.0019**
Residual335.00747.86
Lack of Fit98.15332.720.55260.6732Not significant
Pure Error236.85459.21
Cor Total26,122.6816
R2 = 0.9256, R2Adj = 0.9707. ** p < 0.01.
Table 7. Effects of CFJ on SOD activity, GSH-PX activity, and MDA contents in damaged cells.
GroupsSOD
(U/mg Prot)
MDA
(nmol/mg Prot)
GSH-Px
(U/mg Prot)
Control group15.26 ± 0.270.69 ± 0.0538.69 ± 0.64
Damaged group8.37 ± 0.45 ##1.36 ± 0.06 ##23.34 ± 0.38 ##
Low dose (50 µL/mL CFJ)10.32 ± 0.39 *1.03 ± 0.03 *28.08 ± 0.10 **
Medium dose (100 µL/mL CFJ)14.37 ± 0.45 **0.88 ± 0.04 *34.57 ± 0.61 **
High dose (150 µL/mL CFJ)12.19 ± 0.37 **0.96 ± 0.04 *32.55 ± 0.73 **
Compared with the control group (## p < 0.01). Compared with the damaged group (* p < 0.05 and ** p < 0.01).
Publisher’s Note: MDPI stays neutral with regard to jurisdictional claims in published maps and institutional affiliations.

