Article

Multi-Objective Statistical Optimization of Pectinolytic Enzymes Production by an Aspergillus sp. on Dehydrated Coffee Residues in Solid-State Fermentation

by
Jimmy Núñez Pérez
1,
Brayan Santiago Chávez Arias
1,
Juan Carlos de la Vega Quintero
1,
Santiago Zárate Baca
2 and
José Manuel Pais-Chanfrau
1,*
1
Carrera de Agroindustrias, FICAYA, Universidad Técnica del Norte (UTN), Ave. 17 de Julio 5-21 & José María de Córdova, Ibarra 100115, Ecuador
2
Carrera de Ingeniería en Biotecnología, FICAYA, Universidad Técnica del Norte (UTN), Ave. 17 de Julio 5-21 & José María de Córdova, Ibarra 100115, Ecuador
*
Author to whom correspondence should be addressed.
Fermentation 2022, 8(4), 170; https://doi.org/10.3390/fermentation8040170
Submission received: 15 February 2022 / Revised: 6 March 2022 / Accepted: 7 March 2022 / Published: 8 April 2022
(This article belongs to the Section Industrial Fermentation)

Abstract

:
Pectinolytic enzymes are a group of enzymes widely used in the food industry. They can be obtained through a wide range of by-products and agricultural and agro-industrial waste by the action of fungi, such as Aspergillus spp., by solid-state fermentation (SSF). A wild strain of an Aspergillus sp. isolated in the Universidad Técnica del Norte (UTN) was used to obtain pectinolytic enzymes from dehydrated coffee waste (pulp and husk) derived from coffee cherries cultivated in the Ecuadorian Andean regions. It was possible to find a condition in which the production of pectinases (expressed as Enzymatic Activity (EA)) and the concentration of spores (S) were simultaneously maximized, using the response surface methodology, in a 3-level factorial design, by SSF in simple tray-type bioreactors. After the analysis and optimization of quadratic models, three confirmatory experiments were performed in the unique optimal condition recommended (35 °C and 79% relative humidity), obtaining 29.9 IU/g and 2.64 × 10⁶ #Sp./g for EA and S, respectively; these values coincided with those predicted by the quadratic models, demonstrating their validity. The values obtained in this study are similar to those previously obtained by other authors.

Graphical Abstract

1. Introduction

Coffee is one of the most popular and, therefore, most commercialized beverages globally and is an essential commercial and traditional crop in Ecuador. Coffee production in Ecuador between 2014 and 2020 oscillated between 4 and 8 kton per year, placing Ecuador in the fifth place in South America, behind Venezuela, Peru, Colombia, and Brazil. The last two, together with Vietnam, are the top three world producers of this popular drink [1].
In traditional coffee production on farms in the Ecuadorian highlands, however, non-negligible amounts of waste are produced during the coffee processing stages, consisting of its husk and pulp. It is considered that about 40 wt.% of the fresh coffee cherry is composed of the wet residues of the husk and the pulp of the coffee and contains tannins, polyphenols, caffeine, and other organic compounds that, in large volumes, can be locally harmful to ecosystems and therefore must be appropriately managed [2,3].
Different authors have proposed other solutions for this problem [2,4,5,6], from the anaerobic co-digestion of coffee processing waste with various animal excreta to accelerate the decomposition of dangerous organic compounds [7] to solid-state fermentation (SSF) with multiple fungi that can transform these organic compounds and, in turn, allows the production of different valuable products, such as edible mushrooms, biofuels, and enzymes of industrial interest, thus valuing coffee residuals [8,9].
Among other fungi, strains of Aspergillus spp. are one of the most used microorganisms in SSF [10], apparently due to their ability to grow in the presence of low water activity and on a relatively wide variety of different substrates [11]. The latter is undoubtedly due to the fungus’s capacity to produce and release extracellularly a wide range of hydrolytic enzymes such as cellulolytic and lignocellulolytic enzymes, peptidases, amylases, etc. [12].
Pectinolytic enzymes (pectinases) are a group of hydrolytic enzymes capable of breaking the chains of pectin and its derivatives and are widely used in the food industry to clarify juices and wines [13,14].
Pectinases are among the most widely used enzymes in the food industry, totaling about a quarter of the enzymes currently marketed [15].
Among their most frequent applications are the clarification of juices and beverages, the pro extraction, clarification, and purification of oils or other bioactive substances, the treatment of residuals, and the reduction of viscosity caused by the presence of polysaccharides such as pectin in natural liquid products [16].
Fungi and yeasts are natural producers of pectinases [17,18]. Among them are Aspergillus spp., which have the quality of expressing this and other enzymes in submerged fermentation (SmF) and in solid-state fermentation (SSF) [19]. However, although SmF is more widely studied and widespread [20], the abundant bioavailability of substrates provided by agriculture and agribusiness has led many researchers to focus their R&D efforts on establishing industrial processes based on SSF [21].
Different Aspergillus spp. can also produce and secrete pectinases using various agricultural and agro-industrial pectin-rich residues [22,23,24]. The pulp and husk of coffee also contain a significant amount of pectin (15–25%, according to different authors) and, therefore, could be suitable substrates to obtain pectinase [25,26].
On the other hand, the response surface methodology (RSM) is a statistical optimization tool that, through mathematical models, seeks to experimentally relate one or several dependent variables or responses to controlled independent variables, within the space of a defined design [27]. The RSM seeks to find the values of the independent variables that tend to maximize or minimize the dependent variables or responses and has been successfully used in the optimization and development of various agro-industrial processes [28].
This work aimed to determine the optimal conditions to produce the spores of a strain of an Aspergillus sp. using RSM, allowing the highest yield of pectinolytic enzymes.

2. Materials and Methods

2.1. Microorganism

A strain of an Aspergillus sp. isolated in the Biotechnology laboratories of the North-Technical University (Universidad Técnica del Norte, Ibarra, Ecuador (www.utn.edu.ec, accessed on 5 March 2022) was used. The maintenance of the fungus strain was carried out according to a methodology described elsewhere [29]. In brief, every two weeks, colonies of the Aspergillus sp. were seeded in a solid sporulation medium containing (per liter): cassava flour (40 g), KH2PO4 (2 g), (NH4)2SO4 (1 g), CaCl2 (1 g), CO(NH2)2 (1 g), and agar (15 g). The pH was adjusted to 5.6.
In collaboration with researchers from other universities, ongoing studies are in progress for the phylogenetic characterization of the isolated strain.

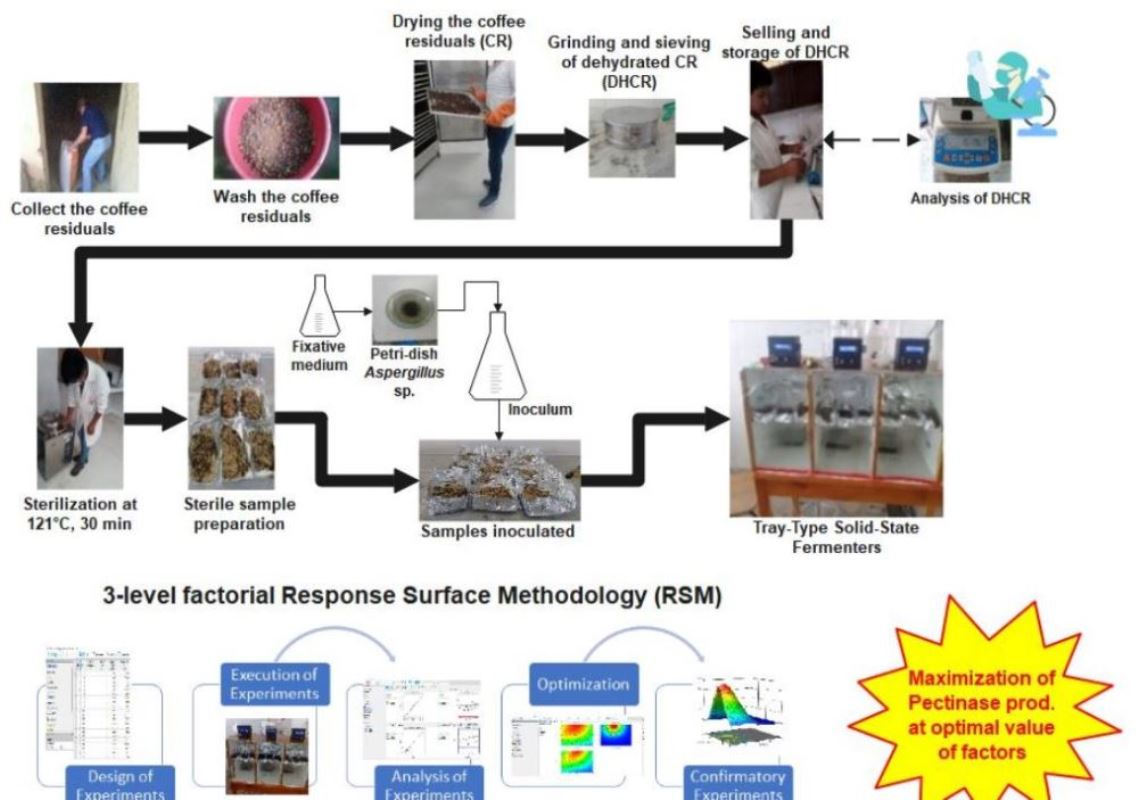
2.2. Raw Material and Inoculum Preparation

The coffee waste (pulp and husk) was obtained from the Agro-Artisan Association of Coffee Growers “Río Intag” in Imbabura, Ecuador. The material was collected in polyethylene bags, sealed, and transported to the University lab facilities where the experiments were carried out.
In our laboratory, we visually inspected the coffee residues and removed the remains of leaves, stems, and other impurities, and the material was washed with abundant tap water for several minutes. After draining, the material was placed for 12 h in a tray dryer Memmert SM 400 (Memmert GmbH + Co. KG, Buechenbach D-91186, Germany) at 60 °C to facilitate the subsequent milling and sieving, carried out in an Oster blender 004655-013-000 (Oster, Mexico City, Mexico) and on a #30 mesh sieve to obtain particles of 2 mm, approximately.
Finally, the coffee waste (pulp and husk), dried and sifted, was subjected to different analyses (moisture and content of reducing sugars and ash) before being placed in 200 g polyethylene bags, which were sealed and stored in polystyrene boxes in the dark, in a dry place at room temperature, until use in the experiments.
All analyses were performed according to well-established and accepted methods. Reducing sugars (according to AOAC Method 985.29–1986(2003): total dietary fiber in foods. Enzymatic-gravimetric method), pH (AOAC method 22.061–1980: Glass Electrode Method—Official Final Action), ash (AOAC method 925.51–2002: Ash in Canned Vegetables), and moisture and dry matter (ISO 6540:2021: Maize—Determination of moisture content (on milled grains and on whole grains)) were determined.
The inoculum was prepared from an Aspergillus sp. preserved at −20 °C and, after reaching room temperature, propagated in TSA medium. After seeding, the Petri dishes were weighed and incubated between 23 and 25 °C for 5 days, after which the plates were weighed each day until each plate weight increased by >1 g, approximately (usually, this is reached between 7 and 10 days), and were suitable to be used as inoculum. At this point, 30 mL of a fixative medium (consisting of 5.29% (m/v) sucrose, 2.69% (m/v) pectin, and 0.88% (m/v) yeast extract) was taken and poured onto the plate under laminar flow to drag the spores and hyphae of the Aspergillus sp. to the fixative medium. Typically, we reached values >103 spores/mL in the fixative medium. The fixative medium with the inoculum was further mixed with 90 mL of sterile distilled water before inoculating its content into 75 g of the wet substrate (gws) consisting of dehydrated (DH) and sterile (at 121 °C for 30 min) coffee residues to reach up to 65% of moisture content in each treatment. The inoculated substrate was placed in trays after spreading the material evenly so that the depth of the substrate in each tray was between 1 and 1.5 cm, a fair value, as reported by other authors, to facilitate gas and heat exchange and guarantee the growth of the fungus under static conditions [30,31].

2.3. Spore Count and Pectinolytic Activity Analysis

According to the established standard protocol, the number of spores of the Aspergillus sp. (#sp) present in the supernatants of each sample was counted using a Neubauer chamber [32].
The pectinolytic activity in the samples was determined using the 3,5-dinitro-salicylic acid (DNS) method [33]. One international enzyme unit (IU) of the pectinolytic enzyme can be defined as the amount of enzyme that catalyzes pectin’s hydrolysis that releases one µmole of reducing sugars per minute (µmole/min) under the assay conditions [34]. The amount of reducing sugars liberated was quantified using glucose as a standard. The relation obtained was C (µmol/mL) = 8.0929 × Abs (r2 = 0.9953), with absorbance values at 540 nm between 0 and 0.5.
We mixed 5 g of wet samples with 50 mL of sterile distilled water. After mixing for a few seconds, 1 mL of supernatant was subjected to spore counting and let rest for 1 h; after that, it was filtered and centrifuged twice before being mixed 1:1 with a solution containing 1% pectin (250 µL samples + 250 µL soln. 1% pectin). Then, the mixture was incubated at 45 °C for 30 min. Later, 500 µL of DNS reagent was added to stop the enzymatic reaction, and the mixture was heated again for another 5 min. Finally, it was left to cool to room temperature and diluted (if necessary) until its absorbance at 540 nm dropped below 0.5. The reducing sugar content and the enzymatic activity units were determined.

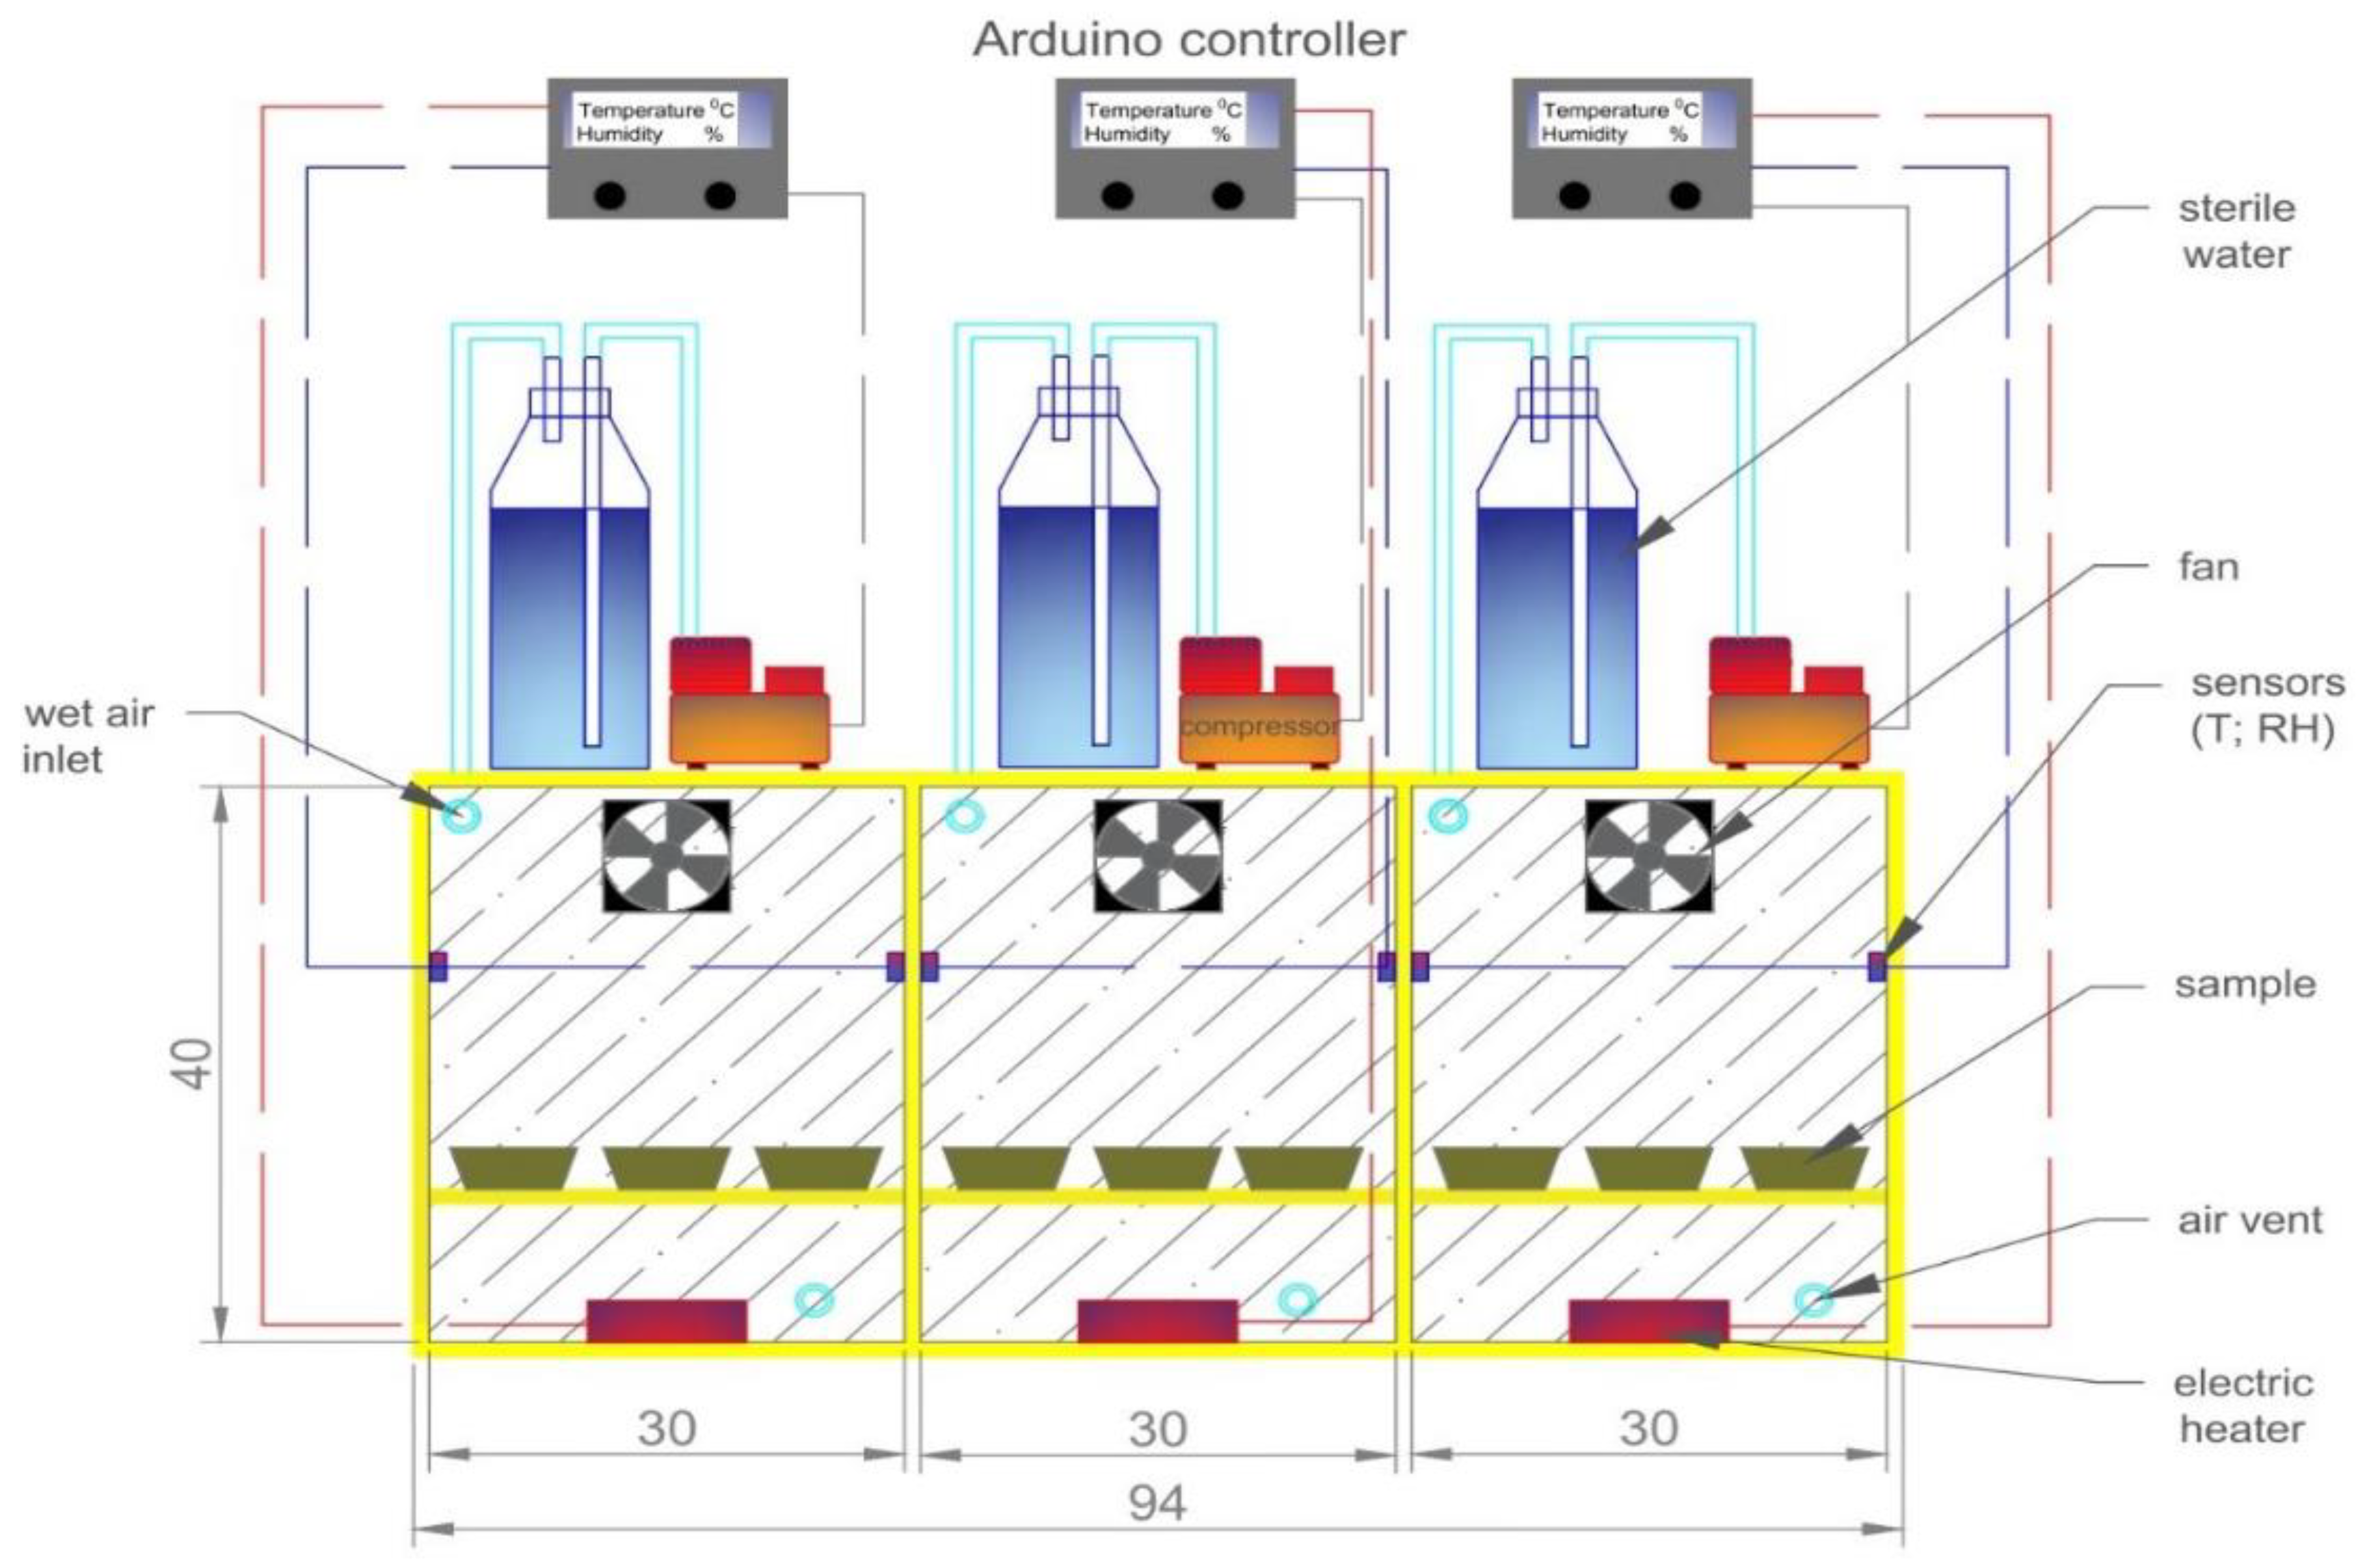
2.4. Experimental Setup and Design

The SSF experiments were carried out in tray-type bioreactors, in three similar devices made of wood, with dimensions of 30 × 33 × 40 cm (width × depth × height) and a glass on the front side. Each bioreactor had temperature and relative humidity sensors (DHT11) coupled to an Arduino controller that allowed the precise setting of the temperature and relative humidity (RH) of each treatment, with precision of ±1 °C and ±2%, respectively (Figure 1). The system were coupled to three compressors and fans to provide wet, water-saturated, and homogeneous aeration inside the box in case the relative humidity inside the enclosure fell below the predetermined value. An electric heater allowed maintaining the temperature inside each bioreactor around the predetermined value in each treatment.
A randomized design considering three values of temperature (25, 35 and 45 °C) and RH (40, 60 and 80%) was chosen for nine (32) different treatments, using the response surface methodology (RSM). The software Design-Expert release 13.09.0 (Stat-Ease, Inc., Minneapolis, MN, USA) was employed to manage and analyze the experiments.
The experimental results of the 3-level factorial design of the RSM were fit with a second-order polynomial equation by multiple regression techniques.
Y i = β 0 + i = 1 2 β i X i + i = 1 2 β i i X i 2 + i < j = 2 2 β i j X i X j + ε i
where Y i is the predicted response (alone or transformed), β0 is the model intercept coefficient, β i , β i i and β i j are regression coefficients of the linear, quadratic, and interactive terms, respectively, X i is the factor under study (temperature and RH content), and ε i is the error.
Three independent interactions in the experiment were examined using optimized conditions representing the maximum points of spore counts and the IU of pectinolytic enzymes activity per gram of substrate, to validate the modelling results.
Each treatment of 75 g wet wt. of substrate was carried out in triplicate. Every 72 h, the content of the sample was homogenized, and a small amount amounting to 5 g was taken and mixed with 50 mL of sterile distilled water. Then, the mixture was vigorously homogenized for a few seconds, and the supernatant was decanted to proceed to spore count and to the determination of the enzymatic activity. The responses evaluated by RSM were the maximum values of the number of spores and the enzymatic activity per gram of wet substrate.

3. Results

3.1. Characterization of Dehydrated Coffee Pulp Residues

According to previous reports, fresh coffee pulp has a high water content, reaching values of 80 wt.%, approximately [25], which promotes its long-term deterioration due to microbial action. For this reason, to guarantee its storage and use for more extended periods, it is necessary to dehydrate the coffee residues.
Samples of dehydrated (DH) coffee residues (husk and pulp) after washing, drying, grinding, sieving, and packing (Figure 1) were analyzed to determine the content of reducing sugars, moisture, acidity, and ashes, according to established and accepted methodologies (Table 1).
The values of reducing sugars, pH, and dry matter of the samples were similar to those obtained by other authors [35,36,37].
Other studies aimed at broadening the chemical-physical determinations of other bioactive substances and determining the conditions and the maximum storage period for dry coffee residues before the loss of their valuable properties, allowing their use as a substrate for the solid-state fermentation are in progress; the extraction of chemicals such as pectin [26], antioxidants [38,39], caffeine [40], etc., is also ongoing.

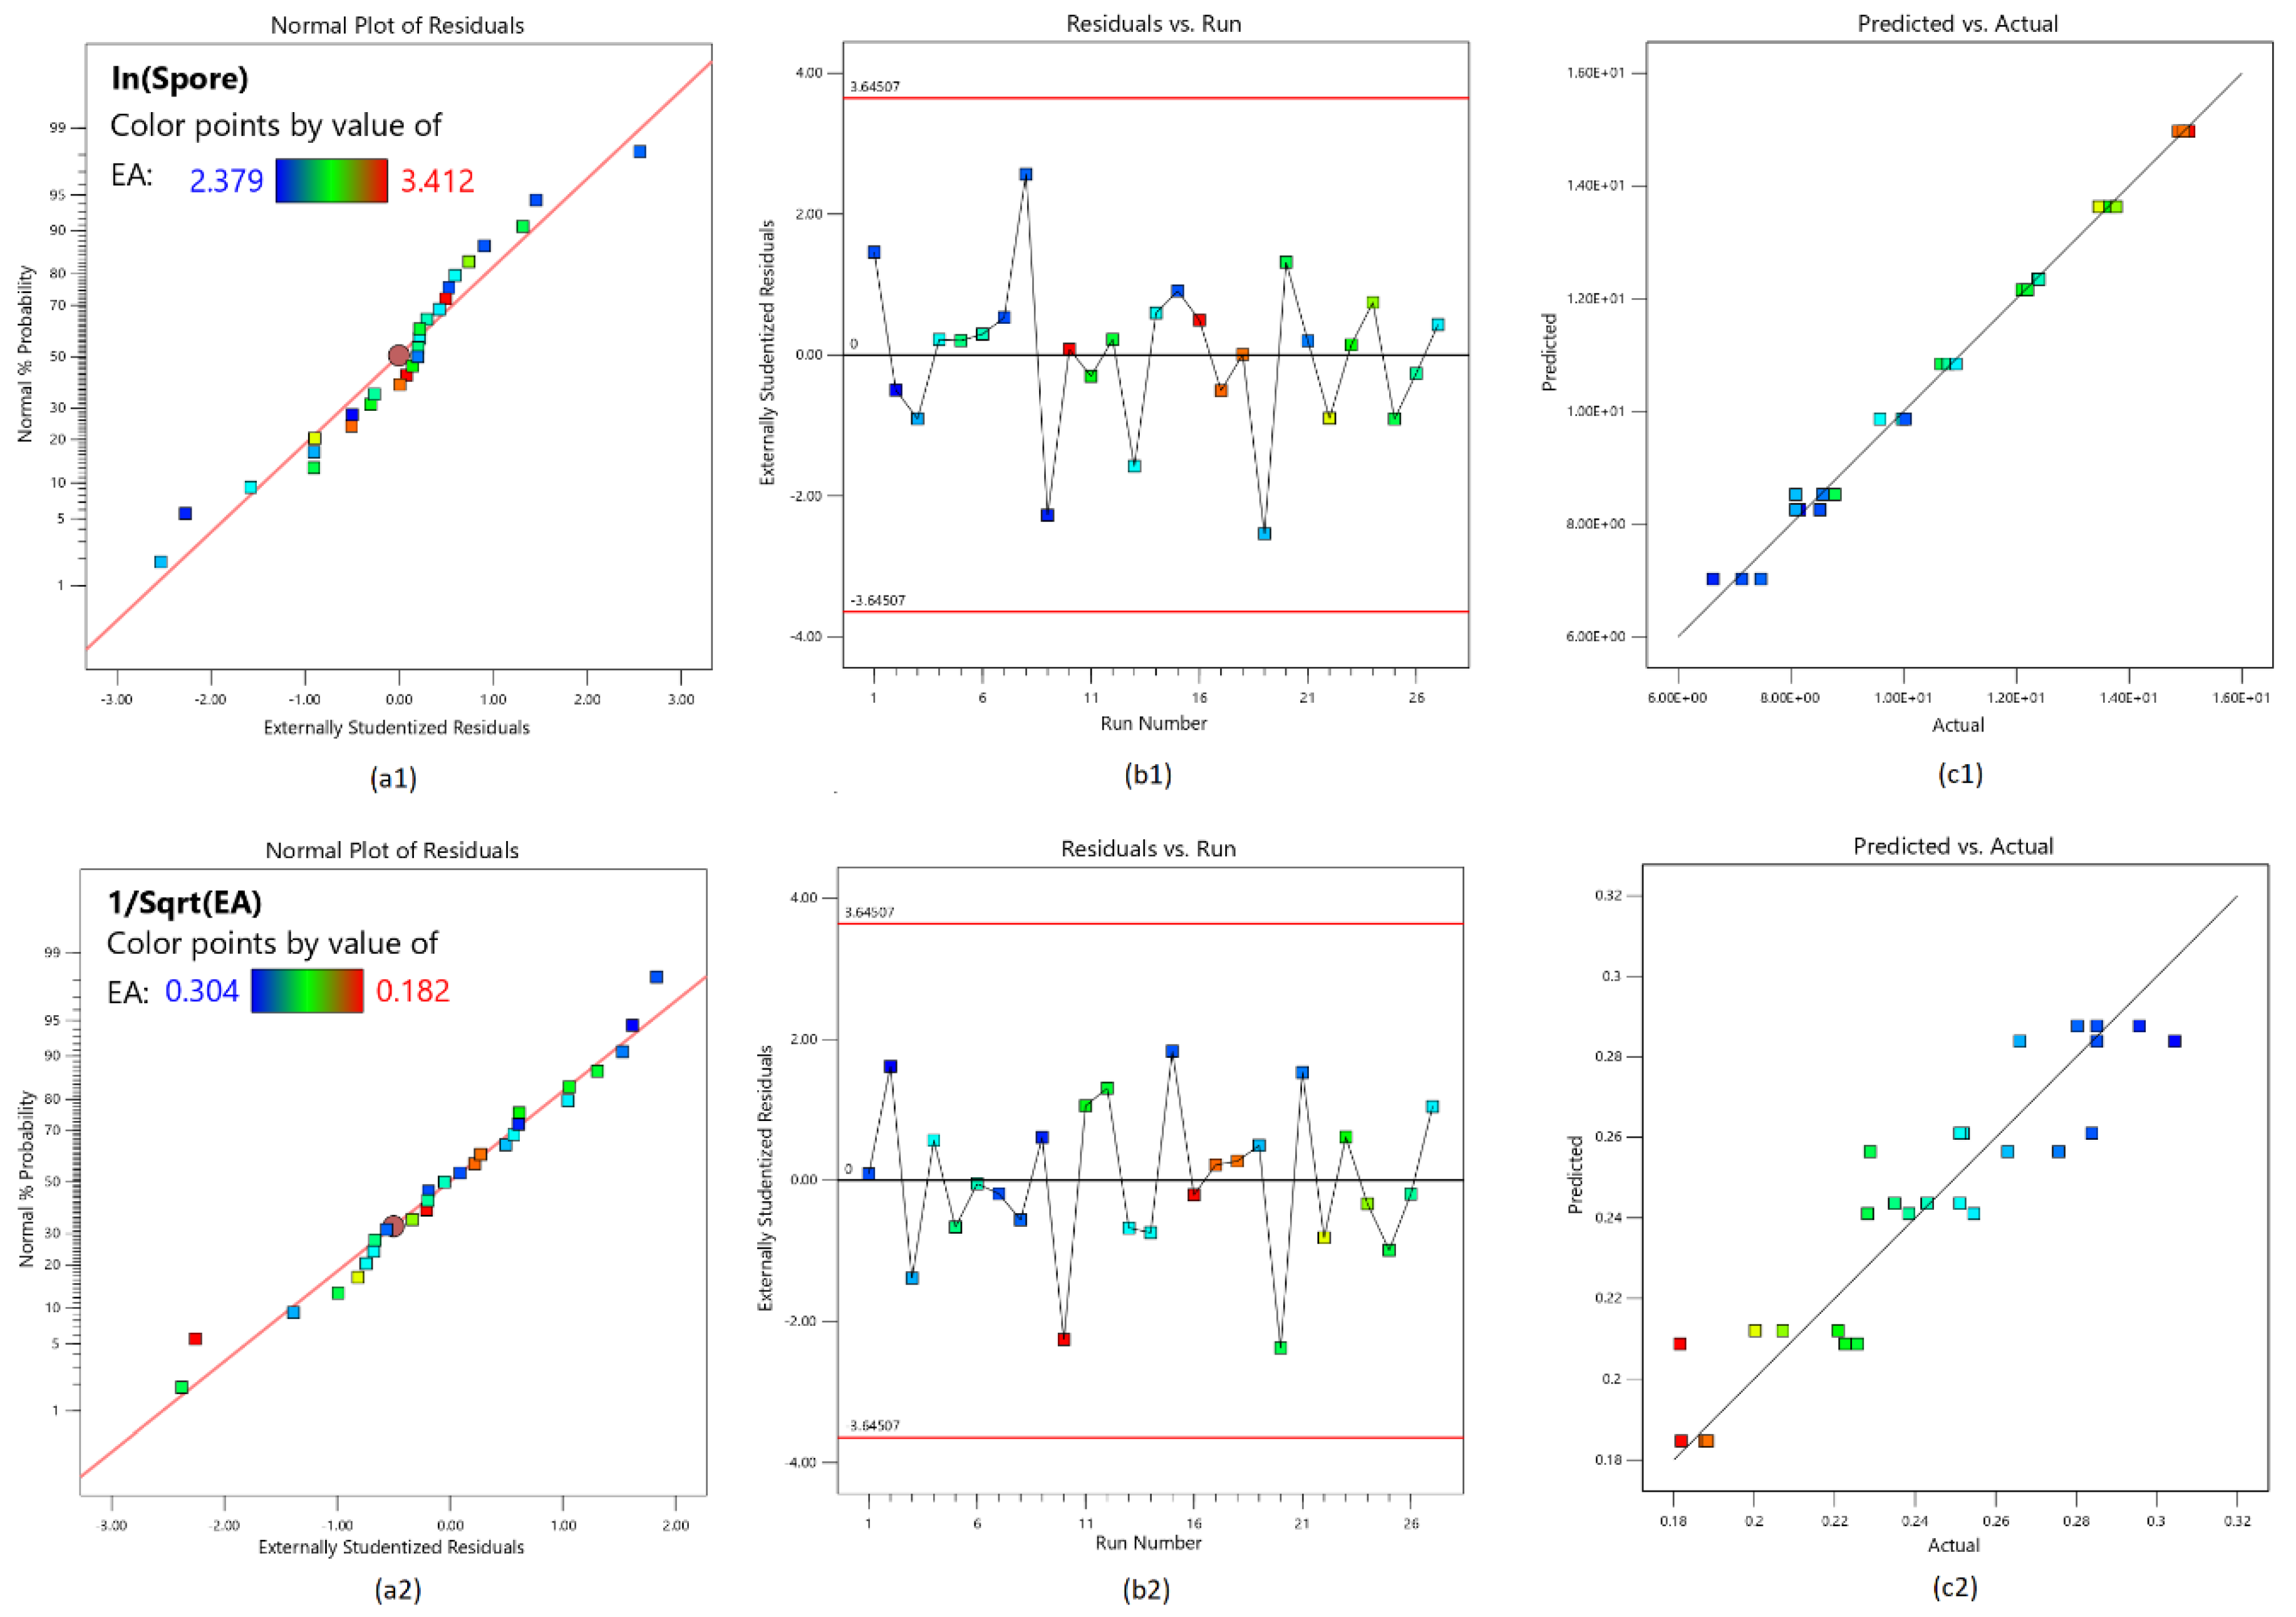
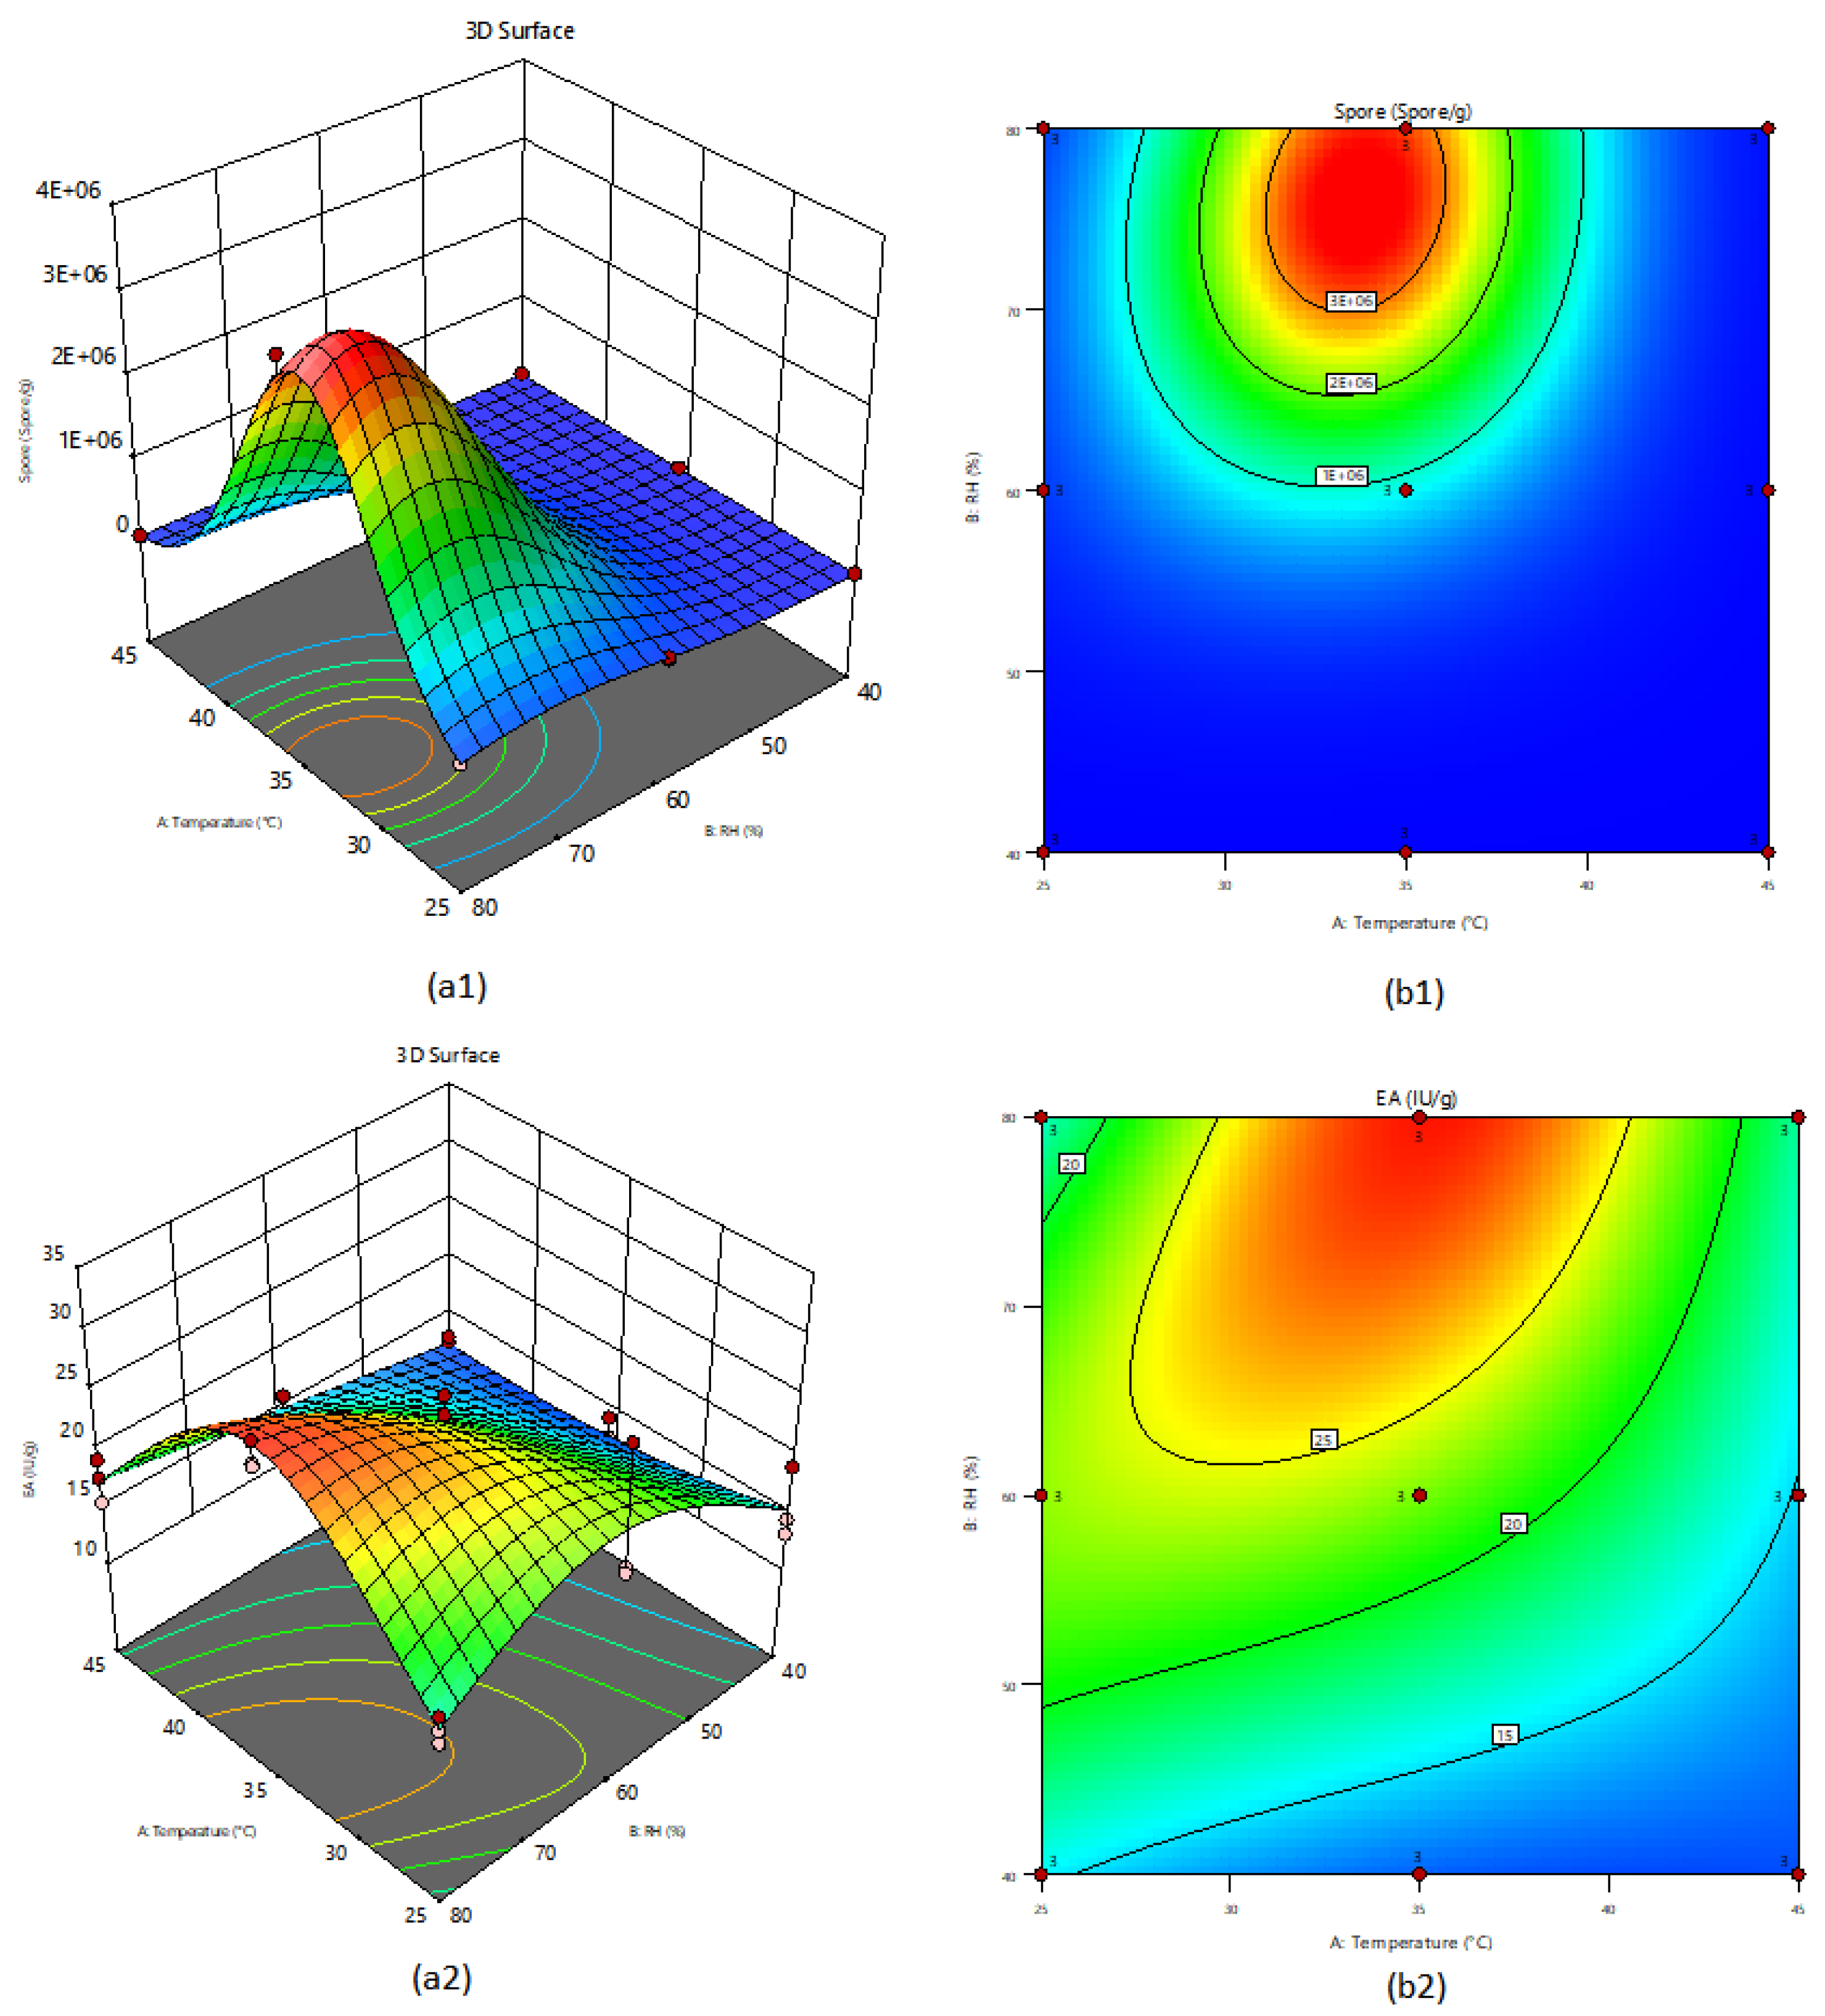
3.2. Three-Level Experiments Using the RSM to Maximize the Production of Pectinolytic Enzymes and the Concentration of Spores of the Aspergillus sp. on Dehydrated Coffee Residues by SSF

Coded and actual factors and the experimental responses obtained for each condition regarding the number of spores and the enzymatic activity in international units per gram of moist substrate (gws), as well as the corresponding values of each factor, obtained according to the quadratic models of the transformed responses of S and EA (Equations (2) and (3)), are shown in Table 2.
When seeking to fit the experimental data directly to a second-degree polynomial for S and EA, it was observed that when performing the analysis of the residuals (modular difference between the actual response and the one provided by the quadratic model), the residuals showed non-normal behaviors and high variance, which could indicate the need to transform the response variable. The Design-Expert software implements the Box and Cox procedure [41] that suggests what type of transformation is the most convenient for the response variables to improve the quality of their fit models. The most suitable transformations were the logarithmic transformation of S ( ln S ) and the transformation of EA through the inverse of its square root ( 1 / E A ) (result not shown).
The transformed response regression equations suggested and obtained from Design-Expert software summarized the relationship between the responses (S, spore count and EA, international units of pectinolytic enzymes activity per gws) and the coded factors (A, temperature and B, relative humidity content).
ln S = 13.63 1.15 · A + 3.36 · B 0.0483 · A B 2.62 · A 2 2.02 · B 2 1.45 · A 2 B + 0.396 · A B 2 + 0.6914 · A 2 B 2
1 / E A = 0.2120 + 0.0262 · A 0.0496 · B 0.0084 · A B + 0.0229 · A 2 + 0.0223 · B 2 + 0.0347 · A 2 B 0.0190 · A B 2
Subsequently, the quadratic models obtained for the transformed responses of S and EA underwent analysis of variance (ANOVA) and regression to corroborate the relevance of the coefficients that appear in each model and determine if these models adequately fit the experimental data (Table 3). The models’ F-value of 401.00 and 16.74 for S and EA, respectively, indicated that both models were significant, with in both cases, only a 0.01% chance that the two large F-values could occur due to noise.
Additionally, the residuals (modular value of the difference between the actual value of the response and the value suggested from the model) appeared to be normally distributed (Figure 2(a1,a2)) and randomly distributed values around their central value (Figure 2(b1,b2)). As a result, a good correspondence between the actual values and the values predicted by the second-order models (Figure 2(c1,c2)) was obtained, and these models could be used to navigate the design space.
In Table 3, p-values < 0.05 indicate that the model terms are significant, and p-values > 0.10 indicate that the model terms are not substantial and could be removed. In this case, those required to support the hierarchy were not counted, as it occurred with the coefficient accomplishing the assignment AB in both models. For the transformed S model: A, B, A2, B2, A2B, AB2, A2B2 and for the transformed EA model: A, B, A2, B2, A2B, AB2 were significant model terms.
Regarding the regression analysis of the models (in Table 3, below ANOVA), the predicted R2 of 0.9874 and the predicted R2 of 0.7129 for the transformed S and EA models, respectively, were in reasonable agreement with its corresponding Adjusted R2 of 0.9919 and Adjusted R2 of 0.8091; i.e., the difference was less than 0.2. Adequate Precision measures the signal-to-noise ratio. A ratio >4 is desirable. Therefore, the ratios of 59.563 and 11.996 for the transformed S and EA models, respectively, indicated an adequate signal.
The graphic representation of the quadratic models of the transformed responses represented by Equations (2) and (3) for spore count and enzyme activity, respectively, showed that there was a range where the highest values were reached (Figure 3). Coincidentally, this range was similar for both models and was approximately between 31 and 37 °C and 70 and 80%, respectively, for temperature and RH.
Once the robustness of the quadratic models was demonstrated, and their ability to find the maximum values in the range of factor values was verified, we proceeded to find the values of the factors that corresponded, simultaneously, to the maximum responses for spore count of the Aspergillus sp. and pectinolytic enzyme’s activity present in the SSF culture. However, it was decided to give further importance (5, +++++) to the maximization of EA than to that of S count (3, +++).
Single optimal values were suggested, under the conditions of 35 °C temperature and 79% RH, corresponding to 3.44·106 #sp./gws, 29.83 IU/gws of EA, and desirability of 0.981 (Figure 4).
Subsequently, we validated the models, under those conditions of temperature (35 °C) and RH (79%) that maximized the desirability function.

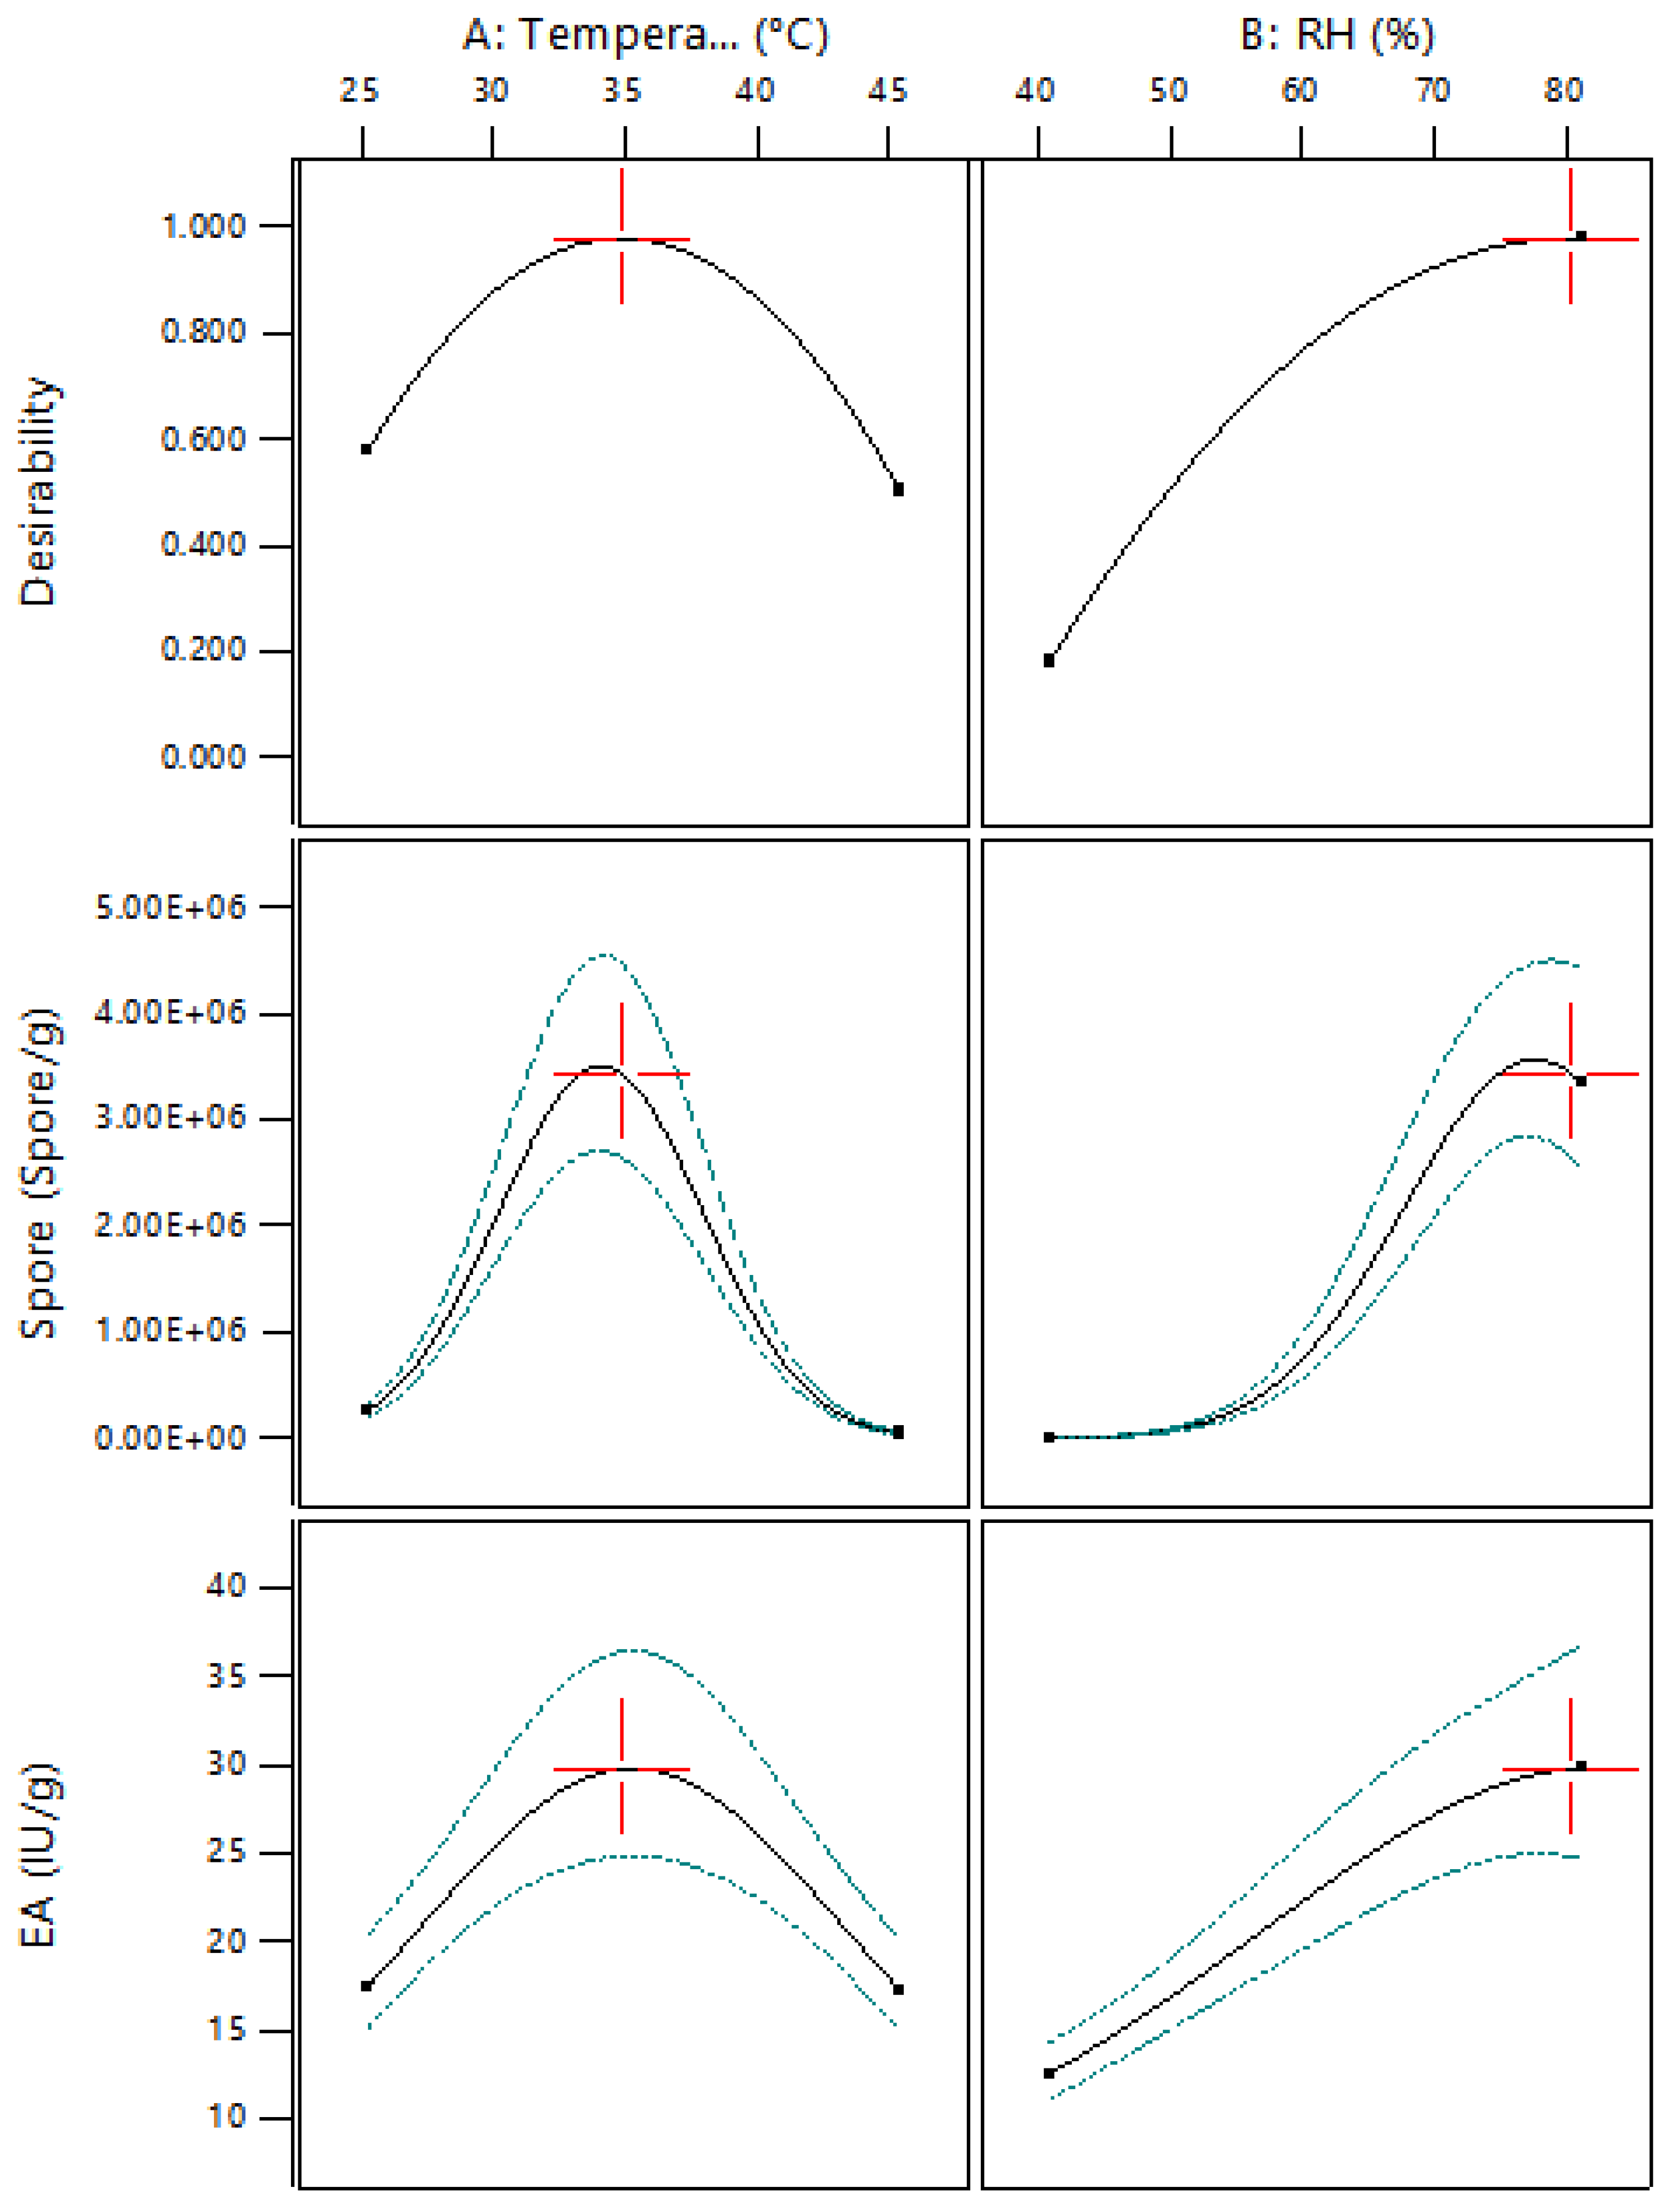
3.3. Validation of the Model

Three additional confirmatory experiments conducted at 35 °C and 79% of RH were performed that simultaneously maximized the number of spores and the enzyme activity per gws of the substrate, with unequal levels of importance.
The experiments allowed corroborating the validity and robustness of the models obtained (Equations (2) and (3)), with the average values of the responses falling within the ranges predicted by the quadratic models (Table 4).

4. Discussion

Aspergillus it is a fungus perfectly adapted to various ecosystems thanks to its well-stocked enzymatic machinery that allows it to use the available plant biomass. Possibly, although it must be confirmed with complementary studies, the secretion of pectinolytic enzymes is associated, or partially associated, with the growth of the fungus. In fact, a Pearson correlation coefficient of 0.7529 was obtained between untransformed S and AE (raising to a value of −0.8729 for transformed S and AE), indicating a possible correlation between S and EA.
Therefore, the presence of pectinolytic enzymes could stimulate the sporulation processes of the fungus or vice versa.
However, the combinations can be extensive, from analyzing the solitary responses for S and AE separately to combining the responses of both models, with different levels of importance for each case.
Maximizing the S response alone should be operated at a temperature of 33.6 ± 0.4 °C and an RH of 76.2 ± 1.2%, while maximizing the EA solely at a temperature of 35.2 ± 0.2 °C and an RH of 80%.
When both responses are combined, in a so-called desirability function, which assumes values between 0 and 1, the possibilities and the relative importance adopted for each response separately in the desirability function could be many. The Design-Expert software establishes five levels of importance for each response; therefore, since the responses were two, there would be 52 = 25 possible combinations. Due to the closeness of the maximum areas of each response and the implicit error of each model, it would not be helpful to evaluate as many possible combinations.
For these reasons, it was decided to explore only one of these combinations in the present work, assigning to EA a level of importance of 5 (+++++) and to S a level of importance of 3 (+++); in this way, we obtained a value of the desirability function (D) of 0.981. Moreover, a temperature of 35 °C and an RH of 79% were predicted for these conditions. If the levels of importance were inverted, assigning a value of 3 to EA and a value of 5 to S, the optimal conditions, according to the models, would be 34 °C and 78% RH, with a value of D = 0.988, very close to the previous one. The differences between the values of temperature and RH in both combinations were less than the precision of the instruments; therefore, in practice, the responses could not be different from each other.
Some examples of the use of Aspergillus spp. in SSF processes, with their pectinase production levels and the characteristics of the said processes, are shown in Table 5.
When comparing some of the results previously reported with those obtained in this work (Table 5), higher values are observed in cases where an airflow is supplied to the SSF processes, which seem related to the influence the aeration rate has on the production of pectinases [46]. In another case, superior results were achieved after randomizing mutagenesis and extensive and tedious selection processes with the purpose of finding pectinase-hyperproducing strains [42].
Aeration seems to be related to the increased growth rate of the obligate aerobic Aspergillus sp. It appears to be associated with the production of pectinolytic enzymes, which, as the results suggest, is associated (completed or partially) with the Aspergillus sp. growth. In future experiments, the possibility of controlling the flow of air supplied to the system will be implemented in the installation to establish the relationship between the speed of aeration and the production of pectinolytic enzymes.

5. Conclusions

In Ecuador, between 1600 and 3200 tons husk and pulp wet coffee residues are generated. Valuing these wastes would has a meaningful, beneficial impact on agroecosystems and generates income for the Ecuadorian economy. However, fresh coffee residues have high humidity (>80%), which favors their rapid microbial degradation and limits their storage and use as a starting raw material for obtaining other products.
The study shown here demonstrates, in the first place, the advantages of dehydrating coffee residues, which would allow their storage and use for more extended periods. Secondly, the usefulness of coffee DH residues to produce pectinolytic enzymes was demonstrated using a local strain of Aspergillus sp. in solid-state culture in the simplest existing SSF bioreactor, a tray-type bioreactor, where relative humidity and temperature were controlled.
Statistical optimization and proper design of response surface experiments made it possible to find the best conditions to produce these enzymes in SSF tray-type bioreactors.

Author Contributions

Conceptualization, J.N.P.; methodology, J.N.P. and B.S.C.A.; software, J.M.P.-C.; validation, B.S.C.A., J.C.d.l.V.Q. and S.Z.B.; formal analysis, J.N.P. and B.S.C.A.; investigation, J.N.P. and B.S.C.A.; resources, B.S.C.A. and S.Z.B.; data curation, B.S.C.A., J.C.d.l.V.Q. and S.Z.B.; writing—original draft preparation, J.N.P. and J.M.P.-C.; writing—review and editing, J.M.P.-C.; visualization, J.N.P. and J.M.P.-C.; supervision, J.N.P.; project administration, J.N.P. and B.S.C.A.; funding acquisition, B.S.C.A. All authors have read and agreed to the published version of the manuscript.

Funding

This research received no external funding.

Institutional Review Board Statement

Not applicable.

Informed Consent Statement

Not applicable.

Data Availability Statement

Not applicable.

Acknowledgments

The authors of the work wish to express their gratitude to Maria Cristina Echeverria, Head of the Biotechnology Engineering Career at the UTN, and MSc Rosario del Carmen Espín Valladares, Head of the Agroindustry Career at the UTN, for allowing us to use the laboratories, and to the dean Bolívar Batallas and vice-dean Hernan Cadena of the FICAYA, for the support given to this research.

Conflicts of Interest

The authors declare no conflict of interest. All authors confirm the data are accurate and agreed to publish them in the Journal.

References

  1. Food and Agriculture Organization of the United Nations. Markets and Trade Coffee. Available online: https://www.fao.org/markets-and-trade/en/ (accessed on 6 March 2022).
  2. Padmapriya, R.; Tharian, J.A.; Thirunalasundari, T. Coffee waste management-An overview. Int. J. Curr. Sci. 2013, 33, 9–16. [Google Scholar]
  3. Mendoza Martinez, C.L.; Alves Rocha, E.P.; de Cassia Oliveira Carneiro, A.; Borges Gomes, F.J.; Ribas Batalha, L.A.; Vakkilainen, E.; Cardoso, M. Characterization of residual biomasses from the coffee production chain and assessment the potential for energy purposes. Biomass Bioenergy 2019, 120, 68–76. [Google Scholar] [CrossRef]
  4. Roussos, S.; Aquihuatl, M.A.; Trejo-Hernández, M.R.; Perraud, I.G.; Favela, E.; Ramakrishna, M.; Raimbault, M.; Viniegra-González, G. Biotechnological management of coffee pulp-isolation, screening, characterization, selection of caffeine-degrading fungi and natural microflora present in coffee pulp and husk. Appl. Microbiol. Biotechnol. 1995, 42, 756–762. [Google Scholar] [CrossRef]
  5. Kumar, S.S.; Swapna, T.S.; Sabu, A. Coffee Husk: A Potential Agro-Industrial Residue for Bioprocess. In Waste to Wealth; Reeta Rani, S., Rashmi Avinash, A., R. Praveen, K., Rajeev, K., Eds.; Springer: Singapore, 2018; pp. 97–109. ISBN 978-981-10-7430-1. [Google Scholar]
  6. Figueroa, G.A.; Homann, T.; Rawel, H.M. Coffee Production Wastes: Potentials and Perspectives. Austin Food Sci. 2016, 1, 10–14. [Google Scholar]
  7. Pérez-Sariñana, B.Y.; Saldaña-Trinidad, S. Chemistry and Biotransformation of Coffee By-Products to Biofuels. In The Question of Caffeine; Jolanta Natalia, L., Magdalena, L., Eds.; IntechOpen Ltd.: London, UK, 2017; pp. 143–161. [Google Scholar]
  8. Londoño-Hernandez, L.; Ruiz, H.A.; Cristina Ramírez, T.; Ascacio, J.A.; Rodríguez-Herrera, R.; Aguilar, C.N. Fungal detoxification of coffee pulp by solid-state fermentation. Biocatal. Agric. Biotechnol. 2020, 23, 101467. [Google Scholar] [CrossRef]
  9. Murthy, P.S.; Madhava Naidu, M. Sustainable management of coffee industry by-products and value addition—A review. Resour. Conserv. Recycl. 2012, 66, 45–58. [Google Scholar] [CrossRef]
  10. Santiago, A.M.; Conrado, L.S.; Mélo, B.C.A.; Sousa, C.A.B.; Oliveira, P.L.; Lima, F.C.S. Solid state fermentation: Fundamentals and application. In Transport Phenomena and Drying of Solids and Particulate Materials; Delgado, J.M.P.Q., Barbosa de Lima, A.G., Eds.; Springer: Cham, Switzerland, 2014; Volume 48, pp. 117–139. [Google Scholar]
  11. Lima, M.A.S.; De Oliveira, M.D.C.F.; Pimenta, A.T.Á.; Uchôa, P.K.S. Aspergillus niger: A hundred years of contribution to the natural products chemistry. J. Braz. Chem. Soc. 2019, 30, 2029–2059. [Google Scholar] [CrossRef]
  12. Ntana, F.; Mortensen, U.H.; Sarazin, C.; Figge, R. Aspergillus: A powerful protein production platform. Catalysts 2020, 10, 1064. [Google Scholar] [CrossRef]
  13. Uzuner, S.; Cekmecelioglu, D. Enzymes in the beverage industry. In Enzymes in Food Biotechnology: Production, Applications, and Future Prospects; Kuddus, M., Ed.; Academic Press: London, UK, 2018; pp. 29–43. ISBN 978-0-12-813280-7. [Google Scholar]
  14. Tapre, A.R.; Jain, R.K. Pectinases: Enzymes for fruit processing industry. Int. Food Res. J. 2014, 21, 447–453. [Google Scholar]
  15. Amin, F.; Bhatti, H.N.; Bilal, M. Recent advances in the production strategies of microbial pectinases—A review. Int. J. Biol. Macromol. 2019, 122, 1017–1026. [Google Scholar] [CrossRef]
  16. Cavalieri de Alencar Guimarães, N.; Glienke, N.N.; Silva Galeano, R.M.; Ruller, R.; Zanoelo, F.F.; Masui, D.C.; Giannesi, G.C. Polygalacturonase from Aspergillus japonicus (PGAj): Enzyme production using low-cost carbon source, biochemical properties and application in clarification of fruit juices. Biocatal. Agric. Biotechnol. 2022, 39, 102233. [Google Scholar] [CrossRef]
  17. Jacob, N. Pectinolytic enzymes. In Biotechnology for Agro-Industrial Residues Utilisation: Utilisation of Agro-Residues; nee’ Nigam, P.S., Pandey, A., Eds.; Springer: Dordrecht, The Netjerlands, 2009; pp. 383–396. ISBN 978-1-4020-9941-0. [Google Scholar]
  18. Jayani, R.S.; Saxena, S.; Gupta, R. Microbial pectinolytic enzymes: A review. Process. Biochem. 2005, 40, 2931–2944. [Google Scholar] [CrossRef]
  19. Li, P.J.; Xia, J.-l.; Shan, Y.; Nie, Z.Y. Comparative study of multi-enzyme production from typical agro-industrial residues and ultrasound-assisted extraction of crude enzyme in fermentation with Aspergillus japonicus PJ01. Bioprocess Biosyst. Eng. 2015, 38, 2013–2022. [Google Scholar] [CrossRef] [PubMed]
  20. Kapoor, M.; Panwar, D.; Kaira, G.S. Bioprocesses for Enzyme Production Using Agro-Industrial Wastes: Technical Challenges and Commercialization Potential. In Agro-Industrial Wastes as Feedstock for Enzyme Production: Apply and Exploit the Emerging and Valuable Use Options of Waste Biomass; Singh, D.G., Kaur, S., Eds.; Academic Press: London, UK, 2016; pp. 61–93. ISBN 978-0-12-802392-1. [Google Scholar]
  21. Ojeda-Hernández, D.D.; Cosío-Cuadros, R.; Sandoval, G.; Rodríguez-González, J.A.; Mateos-Díaz, J.C. Solid-state fermentation as an economic production method of lipases. In Lipases and Phospholipases (Methods in Molecular Biology); Sandoval, G., Ed.; Humana Press: New York, NY, USA, 2018; Volume 1835, pp. 217–228. ISBN 978-1-4939-8671-2. [Google Scholar]
  22. Ortiz, G.E.; Ponce-Mora, M.C.; Noseda, D.G.; Cazabat, G.; Saravalli, C.; López, M.C.; Gil, G.P.; Blasco, M.; Albertó, E.O. Pectinase production by Aspergillus giganteus in solid-state fermentation: Optimization, scale-up, biochemical characterization and its application in olive-oil extraction. J. Ind. Microbiol. Biotechnol. 2017, 44, 197–211. [Google Scholar] [CrossRef] [PubMed]
  23. De Gregorio, A.; Mandalari, G.; Arena, N.; Nucita, F.; Tripodo, M.M.; Lo Curto, R.B. SCP and crude pectinase production by slurry-state fermentation of lemon pulps. Bioresour. Technol. 2002, 83, 89–94. [Google Scholar] [CrossRef]
  24. Heerd, D.; Yegin, S.; Tari, C.; Fernandez-Lahore, M. Pectinase enzyme-complex production by Aspergillus spp. in solid-state fermentation: A comparative study. Food Bioprod. Process. 2012, 90, 102–110. [Google Scholar] [CrossRef]
  25. Reichembach, L.H.; de Oliveira Petkowicz, C.L. Extraction and characterization of a pectin from coffee (Coffea arabica L.) pulp with gelling properties. Carbohydr. Polym. 2020, 245, 116473. [Google Scholar] [CrossRef] [PubMed]
  26. Manasa, V.; Padmanabhan, A.; Anu Appaiah, K.A. Utilization of coffee pulp waste for rapid recovery of pectin and polyphenols for sustainable material recycle. Waste Manag. 2021, 120, 762–771. [Google Scholar] [CrossRef]
  27. Sonawane, A.; Pathak, S.S.; Pradhan, R.C. Optimization of a Process for the Enzymatic Extraction of Nutrient Enriched Bael Fruit Juice Using Artificial Neural Network (ANN) and Response Surface Methodology (RSM). Int. J. Fruit Sci. 2020, 20, S1845–S1861. [Google Scholar] [CrossRef]
  28. Pais-Chanfrau, J.M.; Núñez-Pérez, J.; del Carmen Espin-Valladares, R.; Vinicio Lara-Fiallos, M.; Enrique Trujillo-Toledo, L. Uses of the Response Surface Methodology for the Optimization of Agro-Industrial Processes. In Response Surface Methodology in Engineering Science; Palanikumar Kayaroganam, Ed.; Intech: London, UK, 2021; pp. 1–21. ISBN 978-1-83968-918-5. [Google Scholar]
  29. Trejo-Hernández, M.R.; Oriol, E.; López-Canales, A.; Roussos, S.; Viniegra-González, G.; Raimbault, M. Producción de pectinasas de Aspergillus niger por fermentación sólida sobre soporte. Micol. Neotrop. Apl. 1991, 4, 49–62. [Google Scholar]
  30. Subhosh Chandra, M.G.; Rajasekhar Reddy, B. Exoglucanase production by Aspergillus niger grown on wheat bran: Exoglucanase by A. niger in SSF. Ann. Microbiol. 2013, 63, 871–877. [Google Scholar] [CrossRef]
  31. Singh, B.; Satyanarayana, T. Phytase production by a thermophilic mould Sporotrichum thermophile in solid state fermentation and its potential applications. Bioresour. Technol. 2008, 99, 2824–2830. [Google Scholar] [CrossRef] [PubMed]
  32. Dhurba, G.; Ezhil, K. Manual Cell Counting with Neubauer Chamber. Available online: https://laboratoryinfo.com/manual-cell-counting-neubauer-chamber/ (accessed on 6 March 2022).
  33. Miller, G.L. Use of Dinitrosalicylic Acid Reagent for Determination of Reducing Sugar. Anal. Chem. 1959, 31, 426–428. [Google Scholar] [CrossRef]
  34. Prajapati, J.; Dudhagara, P.; Patel, K. Production of thermal and acid-stable pectinase from Bacillus subtilis strain BK-3: Optimization, characterization, and application for fruit juice clarification. Biocatal. Agric. Biotechnol. 2021, 35, 102063. [Google Scholar] [CrossRef]
  35. Rodríguez Frómeta, R.A.; Sánchez, J.L.; Ros García, J.M. Evaluation of coffee pulp as substrate for polygalacturonase production in solid state fermentation. Emirates J. Food Agric. 2020, 32, 117–124. [Google Scholar] [CrossRef]
  36. Klingel, T.; Kremer, J.I.; Gottstein, V.; De Rezende, T.R.; Schwarz, S.; Lachenmeier, D.W. A review of coffee by-products including leaf, flower, cherry, husk, silver skin, and spent grounds as novel foods within the European Union. Foods 2020, 9, 665. [Google Scholar] [CrossRef]
  37. Oliveira, G.; Passos, C.P.; Ferreira, P.; Coimbra, M.A.; Gonçalves, I. Coffee by-products and their suitability for developing active food packaging materials. Foods 2021, 10, 683. [Google Scholar] [CrossRef]
  38. Do, P.M.N.; Hoang, Q.T.T.; Le, A.T.H. Optimization of conditions of extraction process from coffee cherry pulp (cascara) and application to drinking water products with antioxidant activity. Vietnam J. Sci. Technol. 2019, 57, 26–32. [Google Scholar] [CrossRef] [Green Version]
  39. Aristizábal-Marulanda, V.; Chacón-Perez, Y.; Cardona Alzate, C.A. The biorefinery concept for the industrial valorization of coffee processing by-products. In Handbook of Coffee Processing By-Products: Sustainable Applications; Galanakis, C.M., Ed.; Academic Press: London, UK, 2017; pp. 63–92. ISBN 978-0-12-811290-8. [Google Scholar]
  40. Zengin, G.; Sinan, K.I.; Mahomoodally, M.F.; Angeloni, S.; Mustafa, A.M.; Vittori, S.; Maggi, F.; Caprioli, G. Chemical composition, antioxidant and enzyme inhibitory properties of different extracts obtained from spent coffee ground and coffee silverskin. Foods 2020, 9, 713. [Google Scholar] [CrossRef]
  41. Box, G.E.P.; Cox, D.R. An Analysis of Transformations. J. R. Stat. Soc. Ser. B 1964, 26, 211–246. [Google Scholar] [CrossRef]
  42. Antier, P.; Minjares, A.; Roussos, S.; Raimbault, M.; Viniegra-Gonzalez, G. Pectinase-hyperproducing mutants of Aspergillus niger C28B25 for solid-state fermentation of coffee pulp. Enzyme Microb. Technol. 1993, 15, 254–260. [Google Scholar] [CrossRef]
  43. Patil, S.R.; Dayanand, A. Optimization of process for the production of fungal pectinases from deseeded sunflower head in submerged and solid-state conditions. Bioresour. Technol. 2006, 97, 2340–2344. [Google Scholar] [CrossRef] [PubMed]
  44. Sethi, B.K.; Nanda, P.K.; Sahoo, S. Enhanced production of pectinase by Aspergillus terreus NCFT 4269.10 using banana peels as substrate. 3 Biotech 2016, 6, 36. [Google Scholar] [CrossRef] [PubMed] [Green Version]
  45. Mahmoodi, M.; Najafpour, G.D.; Mohammadi, M. Bioconversion of agroindustrial wastes to pectinases enzyme via solid state fermentation in trays and rotating drum bioreactors. Biocatal. Agric. Biotechnol. 2019, 21, 101280. [Google Scholar] [CrossRef]
  46. Rodríguez-Fernández, D.E.; Rodríguez-León, J.A.; de Carvalho, J.C.; Sturm, W.; Soccol, C.R. The behavior of kinetic parameters in production of pectinase and xylanase by solid-state fermentation. Bioresour. Technol. 2011, 102, 10657–10662. [Google Scholar] [CrossRef] [PubMed] [Green Version]
Figure 1. Diagram of the experimental installation, composed of three tray-type SSF bioreactors, with temperature and relative humidity controls.
Fermentation 08 00170 g001
Figure 2. Analysis of the quadratic models of the transformed responses for spore count (upper part, a1,c1) and enzymatic activity (lower part, a2,c2) per gws. (a1,a2) Normality of the residuals for the models shown in Equations (2) and (3), respectively. (b1,b2) Student’s t external distribution of the residuals. (c1,c2) Correspondence between the real values of the responses with the values obtained with the models shown in Equations (2) and (3), respectively.
Fermentation 08 00170 g002
Figure 3. 3D and contour plots for the quadratic models of the transformed responses expressed by Equations (2) and (3) for spore count (upper) and Enzymatic Activity (lower), respectively. (a1,a2) 3D plots for spore count and enzyme activity, respectively. (b1,b2) Contour plots for spore count and enzyme activity, respectively.
Fermentation 08 00170 g003
Figure 4. Graphics of a single suggested value of the desirability function for the simultaneous maximization of enzyme activity (importance of 5) and spore count (importance of 3) per gws.
Fermentation 08 00170 g004
Table 1. Physical-chemical analysis of dehydrated samples of coffee residues.
Value 1Standard 2
Reducing sugars, wt.%4.0 ± 0.2AOAC Method 985.29 (NTE INEN 1707)
pH4.39 ± 0.14AOAC method 22.061 (NTE INEN 0381)
Ash9.69 ± 0.23AOAC method 925.51 (NTE INEN 0774)
Moisture, %8.83 ± 1.34ISO 6540 (NTE INEN 1513)
Dry matter, %91.17 ± 1.34ISO 6540 (NTE INEN 1513)
1 Average ± standard deviation (n = 3). 2 The corresponding Ecuadorian technical standard (NTE) is shown in parentheses.
Table 2. Coded and actual factors and responses consisting in spore count (#sp.) and enzymatic activity in international units (IU) per gram of the wet substrate (gws) obtained from experiments of 3-level factorial RSM.
RunCoded FactorsActual FactorsActualModel
A: Temp.B: RHTemp.,
°C
RH,
%
S,
#sp./gws
EA,
IU/gws
S,
#sp./gws
EA,
IU/gws
10−135405.00 × 10312.303.83 × 10312.41
20−135403.50 × 10310.793.83 × 10312.41
30−135403.25 × 10314.143.83 × 10312.41
4−1+125802.40 × 10515.862.41 × 10516.87
5−1+125802.39 × 10518.132.41 × 10516.87
6−1+125802.44 × 10516.942.41 × 10516.87
7+1−145401.25 × 10312.301.17 × 10312.08
8+1−145401.75 × 10312.731.17 × 10312.08
9+1−145400.75 × 10311.441.17 × 10312.08
10−1025601.93 × 10530.321.91 × 10522.96
11−1025601.80 × 10520.181.91 × 10522.96
12−1025601.99 × 10519.641.91 × 10522.96
13+1045601.45 × 10415.751.91 × 10414.67
14+1045602.15 × 10415.861.91 × 10414.67
15+1045602.28 × 10412.411.91 × 10414.67
160+135803.48 × 10630.213.17 × 10629.31
170+135802.88 × 10628.383.17 × 10629.31
180+135803.18 × 10628.163.17 × 10629.31
19−1−125403.25 × 10314.464.80 × 10315.20
20−1−125406.50 × 10319.104.80 × 10315.20
21−1−125405.25 × 10313.164.80 × 10315.20
220035607.03 × 10524.938.31 × 10522.25
230035608.54 × 10520.508.31 × 10522.25
240035609.55 × 10523.318.31 × 10522.25
25+1+145804.28 × 10419.214.85 × 10417.20
26+1+145804.85 × 10417.594.85 × 10417.20
27+1+145805.58 × 10415.434.85 × 10417.20
Table 3. Variance and regression analysis for 3-level factorial RSM of the transformed responses of spore count (upper) and international unit of pectinolytic enzymes (lower) activity per gram of wet substrate (gws).
ANOVA for Quadratic Model of Transformed Spore Count (#sp./gws)
SourceSum of SquaresdfMean SquareF-Valuep-Value
Model169.19821.15401<0.0001
A-Temperature7.8917.89149.57<0.0001
B-RH67.65167.651282.66<0.0001
AB0.02810.0280.53110.4755
A213.73113.73260.31<0.0001
B28.1418.14154.35<0.0001
A2B8.418.4159.23<0.0001
AB20.627310.627311.890.0029
A2B20.637310.637312.080.0027
Pure Error0.9493180.0527
Cor Total170.1426
Std. Dev.0.2296 R20.9944
Mean10.85 Adjusted R20.9919
C.V. %2.12 Predicted R20.9874
Adeq. Precision59.5632
ANOVA for Quadratic Model of Transformed EA (IU/gws)
SourceSum of SquaresdfMean SquareF-valuep-value
Model0.029170.004216.74<0.0001
A-Temperature0.004110.004116.540.0007
B-RH0.014710.014759.36<0.0001
AB0.000910.00093.450.0790
A20.003110.003112.630.0021
B20.003010.003012.050.0026
A2B0.004810.004819.400.0003
AB20.001410.00145.820.0261
Residual0.0047190.0002
Lack of Fit0.000010.00000.17050.6845
Pure Error0.0047180.0003
Cor Total0.033826
Std. Dev.0.0158 R20.8605
Mean0.2421 Adjusted R20.8091
C.V. %6.51 Predicted R20.7129
Adeq. Precision11.9954
Table 4. Results of the three confirmatory experiments to validate the models of the desirability function and the quadratic models for the transformed responses of number of spores and AE per gws.
Pred. MeanPred. Median 1Std Dev.95% PI lowData Mean 295% PI high
S3.35 × 1063.27 × 1060.78 × 1062.23 × 1063.64 × 1064.78 × 106
EA29.8429.205.0622.5329.8539.35
1 For transformed responses, the predicted mean and median might differ on the original scale. 2 For transformed responses, the data mean was calculated on the transformed scale.
Table 5. Some SSF processes leading to pectinase production by Aspergillus spp. and their characteristics.
FungiSubstrateCulture ConditionsPectinase (IU/gds)Ref.
Aspergillus niger C28B25
(Irradiate mutant)
Coffee pulp (sieving w/mesh 30)Packed-bed glass cylinder SSF at 25 °C, 20 g w/moisture 60%, aeration rate: 60 mL min−1 saturated, for 72 h228.0 U/g 1[42]
Aspergillus niger
DMF 45
Deseeded sunflower headSSF at 34 °C and pH 5.0, inoculum 107 sp./g, 500 µm size, 65% moisture34.2[43]
Aspergillus terreus (NCFT 4269.10)Banana peel
(Musa paradisiaca L.)
SSF at 30 ± 1 °C for 96 h36.1 ± 6.2
(6500 ± 1116 U/g) 2
[44]
Aspergillus giganteus
(NRRL10)
A mix of wheat bran: orange peel: lemon peel (66:17:17)Tray-type SSF at 28 °C, pH 4.8 for 60 h, aeration rate: 20 L min−1 kgds−1197 (PGase)
101 (PMGase)
[22]
Aspergillus nigerorange pomace peel + 40 g gds−1 bagasseTray-type SSF at 30 °C, moisture 60%, for 96 h49 (exo-PGase)
14 (endo-PGase)
[45]
Aspergillus sp.DH coffee residualsTray-type SSF at 35 °C and 79% RH, 2 mm particles size85.3 ± 14.5
(29.9 ± 5.1) 3
This work
1 In this report, one unit (U) of pectinase activity was defined as the amount of enzyme which reduced the initial viscosity by 50% in 10 min. 2 Original values were reported, where the Enzymatic Unit is expressed by the amount of product released in µg/min instead of µmol/min. 3 See the original value in Table 4 but on a wet substrate base (gws). A 65% (m/m) of moisture content at the end was assumed to calculate the pectinases activity on dry substrate (gds).
Publisher’s Note: MDPI stays neutral with regard to jurisdictional claims in published maps and institutional affiliations.

