Article

Pilot-Scale Anaerobic Treatment of Printing and Dyeing Wastewater and Performance Prediction Based on Support Vector Regression

1
College of Environmental Sciences and Engineering, Dalian Maritime University, Dalian 116026, China
2
School of Communication, Fujian Normal University, Fuzhou 350117, China
*
Authors to whom correspondence should be addressed.
Fermentation 2022, 8(3), 99; https://doi.org/10.3390/fermentation8030099
Submission received: 31 December 2021 / Revised: 25 February 2022 / Accepted: 25 February 2022 / Published: 26 February 2022
(This article belongs to the Special Issue Recent Trends in Biogenic Gas, Waste and Wastewater Fermentation)

Abstract

:
Printing and dyeing wastewater is characterized with complex water quality and poor biodegradability. In this study, a pilot-scale anaerobic baffled reactor (ABR) with packing was verified to effectively degrade the complex organic pollutants in the wastewater through the hydrolysis and acidification of anaerobic microorganisms. At a hydraulic retention time (HRT) of 12 h and an organic loading rate (OLR) of 2.0–2.5 kg COD/(m3·d), the ABR stabilized the fluctuation range of pH and achieved an average colority removal rate of 10.5%, which provided favorable conditions for subsequent aerobic treatment. During the early operation period, the reactor increased the alkalinity of the wastewater; after 97 days of operation, the volatile fatty acid (VFA) content in the wastewater decreased. To demonstrate the suitability of the support vector regression (SVR) technology in predicting the performance of the reactor, two SVR algorithms with three kernel functions were employed to relate the chemical oxygen demand (COD) removal rate to its influencing factors, and the predictions of both the training and validation groups agreed with the measurements. The results obtained from this study can contribute to the design and optimal operation of the anaerobic treatment project of the industrial wastewater treatment plant.

1. Introduction

Printing and dyeing wastewater is a type of industrial wastewater that is very difficult to treat, characterized by high colority, complex composition and poor biodegradability [1]. Technologies including physical-chemical methods, biological methods and the combination of these methods have been applied for its treatment [2]. Due to cost competitivity, the anaerobic technology has maintained attention from scientists and engineers, which can degrade refractory macromolecular organic pollutants, such as colorant anthraquinone and azo dyes, into small molecular ones, so as to improve the biodegradability of wastewater [3]. Among a few types of anaerobic reactors, such as expanded granular sludge bed (EGSB) reactor [4], up-flow anaerobic sludge blanket (UASB) reactor [5], anaerobic membrane bioreactor (AnMBR) [6], recirculating fixed-bed bioreactor (RFBB) [7] and strengthened circulation anaerobic (SCA) reactor [8], anaerobic baffled reactor (ABR) has been widely investigated [9].
An ABR is divided into several compartments by vertical baffles to make wastewater flow up and down alternately. Due to the stirring effect of the gas produced by fermentation and the function of upflow, a well-mixing flow state forms in each compartment, while the whole reactor shows the plug flow regime, which brings the wastewater at different treatment stages into contact with the sludge in each compartment to experience different anaerobic digestion reactions [10,11]. It is generally believed that the anaerobic microorganisms in the front compartments of ABR are mainly hydrogen and acid producing bacteria, and the acids produced are then used by methanogens in the latter compartments [12]. Through the biomass communal synergism, the pollutants are stepwise degraded. At the same time, the baffles of ABR play a role in intercepting sludge and ensure a high amount of sludge in the reactor, and this structure is also conducive to resist hydraulic, organic and toxic shocks [13]. Researchers have continued to improve the ABR process for the printing and dyeing wastewater treatment. For instance, some integrated ABR with microbial fuel cells, which promoted the degradation of azo dyes and improved the removal of chemical oxygen demand (COD) [8,14]; some equipped ABR with packing to improve the reactor performance by promoting the formation of biofilm to reduce biomass loss, controlling sludge bulking and enhancing environmental tolerance [10,15].
To establish the relationship between the treatment performance of the anaerobic system and its influencing factors based on the measured data is of great significance to guide the process design and operation of a wastewater treatment plant. As the anaerobic digestion system is a complex nonlinear biological treatment system, it is difficult to use mechanism models that need to determine a large number of parameters to simulate and predict its actual performance, and the data-driven fitting modeling is more applicable because of its flexibility [16]. Artificial neural network technology has been widely used in the modeling of wastewater treatment systems, but it is highly dependent on the sample size and easy to fall into the local optimal solution in the training process, which has poor prediction stability [17]. In recent years, the support vector regression (SVR) technology has been applied in the area of wastewater treatment, which is based on the algorithm of support vector machine (SVM). SVM is a statistical learning method based on structural risk minimization proposed by Vapnik et al. [18], which can effectively process small sample data and obtain the global optimal solution, and has strong generalization ability. The basic idea of SVM is to map the samples in the input space to high-dimensional feature space by kernel function, and then obtain the optimal classification surface that linearly separates the samples in the high-dimensional characteristic space, so as to solve the highly nonlinear regression problem in the original sample space. Among the software packages for SVR, LibSVM is an easy-to-use, fast and effective one that provides compiled executable files that can be used in Windows systems with the cross validation function [19]. Liu et al. established an SVR model with LibSVM to predict the COD removal of a submerged anaerobic membrane bioreactor processing low-load domestic sewage, and achieved a high level of accuracy and fitness [20]. However, the suitability of SVR on the performance prediction of anaerobic reactor processing refractory industrial wastewater needs to be further examined.
In this study, an ABR equipped with packing was constructed to treat the printing and dyeing wastewater from the coagulation sedimentation tank of a real wastewater treatment plant. The main objectives of this work include: (i) to reveal the comprehensive performance of the ABR during the startup and normal operation; (ii) to verify the effectiveness of the enhanced anaerobic baffled technology on degrading the printing and dyeing industrial pollutants; and (iii) to develop mathematical tools to predict the reactor performance. The new element of this work includes the application of different support vector regression algorithms with different kernel functions in relating the reactor performance with its influencing factors. Referring to the analytical result of Qi et al. [21], the related factors including flow rate, organic loading rate (OLR), water temperature and influent suspended solids (SS) were taken as feature variables to estimate the COD removal rate. The results obtained may provide scientific evidence for the design and operation of the anaerobic technology for refractory industrial wastewater treatment.

2. Materials and Methods

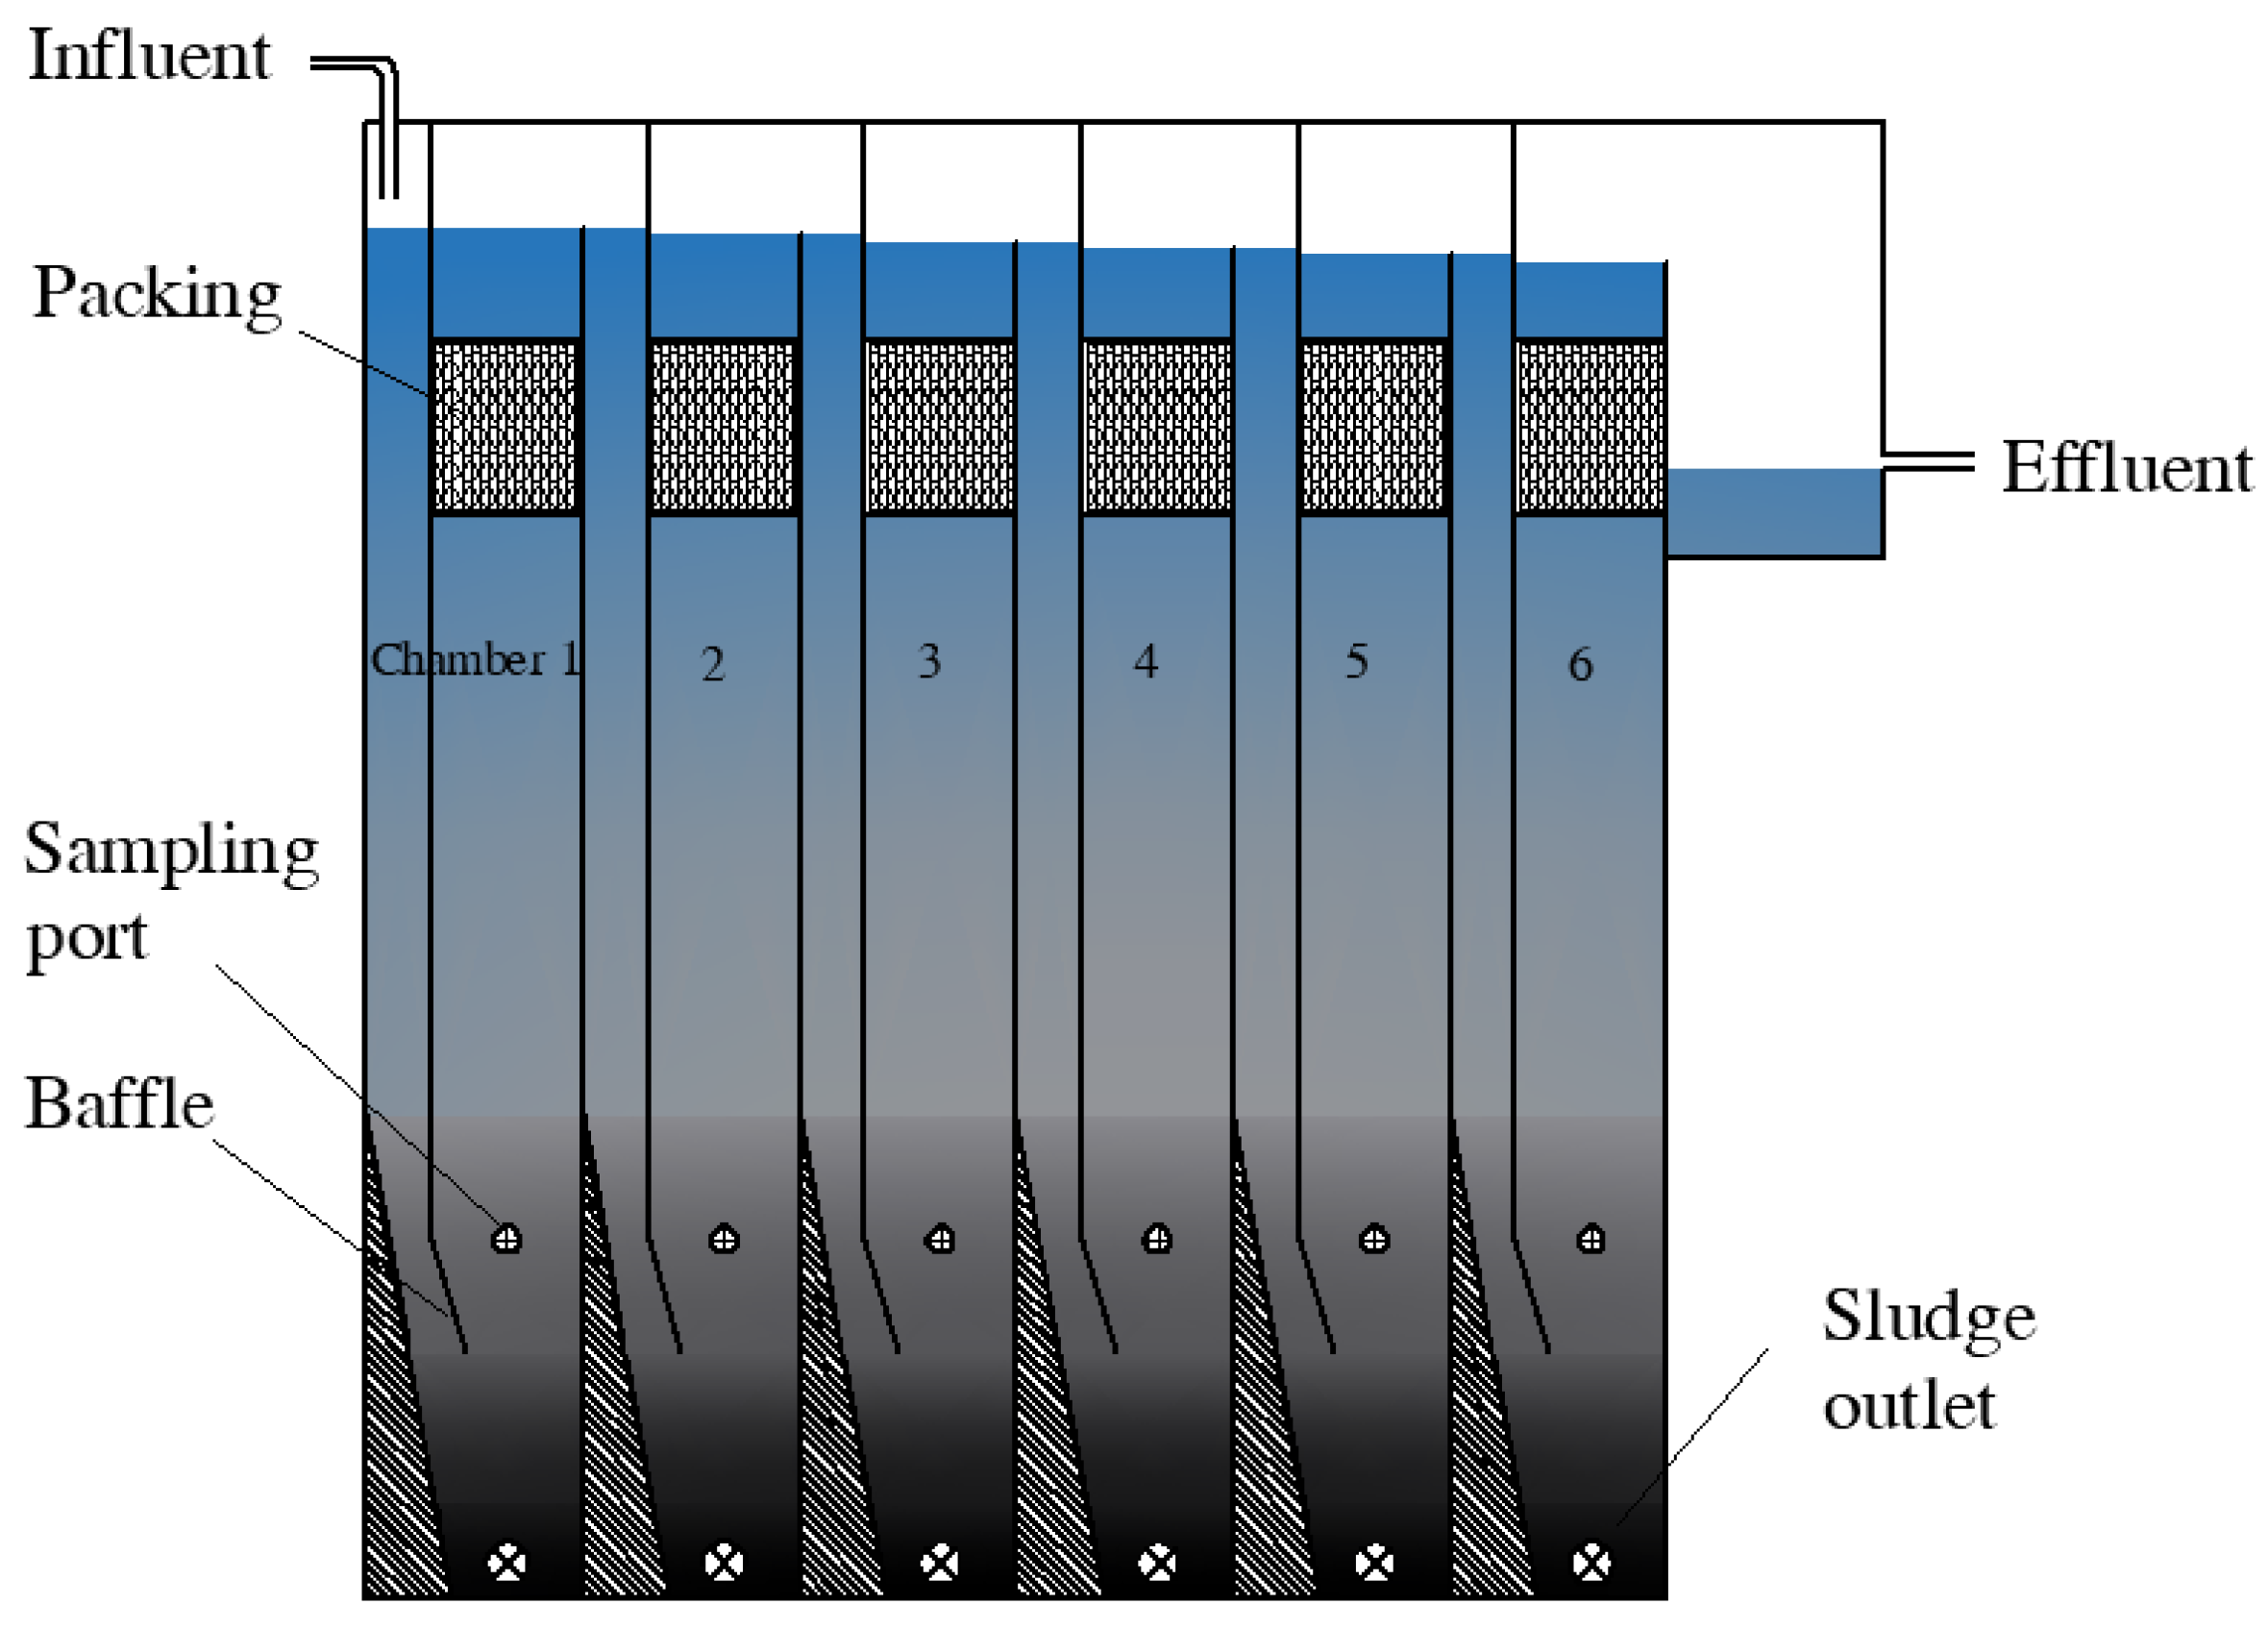
2.1. Environmental Setup

To investigate the anaerobic fermentation process of printing and dyeing wastewater, an ABR was designed and constructed in this study, with total length, height and effective volume of 3.5 m, 3.6 m and 18 m3, respectively, shown in Figure 1. The reactor was divided into six equal-volume chambers by vertical plates, and the plane size of each chamber was 1.5 m × 0.5 m, consisting of a downflow chamber and an upflow chamber with a width ratio of 1:7.5. The wastewater entered the downflow chamber first, and then flowed into the upflow chamber through the inclined plate at the bottom, so that the water could be well mixed with the sludge; when the wastewater reached the top edge of the vertical plate, it would then overflow into the next chamber by gravity. The ABR was equipped with a peripheral foam insulation layer to maintain temperature, with an open top of each chamber for water sampling; the middle and lower part of each chamber was equipped with a sampling port for sludge-water mixture, and the bottom with a sludge discharge outlet.
In order to effectively intercept sludge and ensure sufficient microbial biomass in the reactor, the upper part of each chamber was equipped with a type of packing that was composed of multiple groups of symmetrical packing plates and fixed frames. The corrugated filler plates with positive concave and reverse concave were arranged in a cross manner and bonded at the junction. The mixed liquid flowed upward from the gap between the cross plates. Due to the cross turbulence of the flow, the organic pollutants in the wastewater could fully contact and react with the biofilm fixed on the plate, so as to be degraded more effectively.

2.2. Experimental Procedure

The wastewater used in this study was the effluent from the coagulation sedimentation tank of a wastewater treatment plant in southern China. More than 90% of the treated wastewater of this plant comes from printing and dyeing plants, and the rest is domestic sewage. The activated sludge from the sludge storage tank of the plant was inoculated into each chamber of ABR at the startup. The influent water flowed into the ABR by gravity, and the influent water flow was changed by adjusting the valve. The reactor was operated for 130 days, with a startup flow rate of 7.2 m3/d, that is, a hydraulic retention time (HRT) of 60 h, which was gradually reduced to 12 h by increasing the flow rate. The influent water quality is listed in Table 1. The OLR of the reactor gradually increased from about 0.45 kg of COD/(m3·d) at the startup to 2.0–2.5 kg of COD/(m3·d), respectively, at the stable operation stage. During the operation, water temperature in the reactor rose naturally with the warming of the weather from about 10 °C to about 35 °C.

2.3. Analysis of Water Quality and Sludge Activity

2.3.1. Analysis of Water Quality

In order to assess the performance of the anaerobic reactor, the wastewater samples of the influent and effluent were collected and analyzed during the operation period. The test water quality index included: water temperature, pH, COD, SS, colority, alkalinity (calculated by calcium carbonate) and volatile fatty acid (VFA). The analytical methods with the corresponding standard followed for the water quality indexes are summarized in Table 2.
The relative contents of five types of dye substances (acid blue, acid orange, Direct Blue 106, Naphthol AS-E and Sudan Red 1) in the wastewater were analyzed by a Thermo Finnigan Surveyor liquid chromatograph (LC)-Thermo Finnigan LCQ Deca XP MAX mass spectrometer (MS) system. The operating conditions were: sheath gas flow rate: 343 arb, auxiliary gas flow rate: 0 arb, electrospray voltage: −5 kV, capillary temperature: 270 °C, capillary voltage: −15 V, lens compensation voltage: −30 V.

2.3.2. Analysis of Sludge Activity

To assess the activity of the anaerobic microorganisms, the sludge-water mixture from the bottom of compartments 1, 3 and 5 of the ABR were sampled and analyzed. The indexes mixed liquid suspended solids (MLSS) and mixed liquid volatile suspended solids (MLVSS) were measured according to the US standard methods [22], and the sludge activity (SA) is calculated by Equation (1):
SA = MLVSS/MLSS.

2.4. Support Vector Regression (SVR)

2.4.1. Principle of SVR Algorithm

For a training set { ( x i , y i ) } i = 1 n , where xi denotes the feature vector, yi denotes the response vector and n is the number of training data points, the purpose of SVR is to find a function f(x) to forecast the response with an error ε, which can be expressed as Equation (2):
f ( x ) = w T Φ ( x ) + b
where w and b are the weight vector and the bias, respectively, and Φ ( x ) is a non-linear transformation to a high dimensional space. w and b can be estimated by solving the standard SVR function:
min w , b , ξ , ξ * 1 2 w T w + c i = 1 n ( ξ i + ξ i * )
subject to w T Φ ( x ) + b y i ϵ + ξ i and y i w T Φ ( x ) b ϵ + ξ i * , where c is a constant that regulates the model complexity and training error, and ξ i and ξ i * are the non-negative slack variables. Then Equation (1) can be transformed to Equation (4),
f ( x ) = i = 1 n ( α i + α i * ) K ( x i , x j ) + b
where α i and α i * are the Lagrange multipliers, and K ( x i , x j ) is the kernel function in the feature space to replace the scalar product. The commonly used types of kernel functions include linear kernel function: K ( x i , x j ) = ( x i , x j ) ; polynomial kernel function: K ( x i , x j ) = ( γ ( x i , x j ) + C ) d , where γ   > 0, C is a constant and d is the polynomial degree; Gaussian radial basis function (RBF) kernel function: K ( x i , x j ) = e γ x i x j 2 , where γ   > 0; and sigmoid kernel function: K ( x i , x j ) = tanh ( γ ( x i , x j ) + C ) , where γ   > 0 and C is a constant. For non-linear kernel functions, the parameter γ determines the amplitude of the kernel [23].
In addition to the above so-called ε-SVR algorithm by Equation (3), there is another type of regression, named as ν-SVR, in which a parameter ν is used to control the number of support vectors [24], which solves Equation (5):
min w , b , ξ , ξ * , ϵ 1 2 w T w + c ( ν ϵ + 1 n i = 1 n ( ξ i + ξ i * ) )

2.4.2. Application of SVR with LibSVM

In this study, Matlab R2018a software (MathWorks Inc., USA) was used to compile and configure the downloaded and decompressed LibSVM library [25]. According to the grey correlation analysis results of Qi et al. [21], the COD removal rate was closely related to the flow rate, OLR, water temperature and influent SS. To establish the regression model in this study, the COD removal rate was taken as the response, and flow rate, OLR, water temperature and influent SS as the feature variables. During the operation of the reactor, a group of data was measured every 2–3 days, and there were 57 groups of data obtained in 130 days, of which the first 80% (46 groups) was used as the training set and the last 20% (11 groups) as the validation set.
In order to eliminate the difference of variation range among variables, the ‘mapminmax’ function was used to normalize the response and the feature variables in Matlab. SVR type was set as ε-SVR or ν-SVR, and the kernel function types used included linear, RBF and sigmoid kernel function. The polynomial kernel function was not used because of its huge number of iterations. In the mode of 5-fold cross validation and non-shrinking heuristics, the grid search method was used to find the optimal c and γ in the nonlinear kernel functions (this parameter does not exist in the linear SVR model); the ‘svmtrain’ function was used to train the SVR model with the training set data; the ‘svmpredict’ function was used to validate the model with the test data; and then the ‘mapminmax’ function was used for reverse normalization. Finally, the time series of both the predicted and the measured COD removal rate were plotted in the same figure for comparison.

2.4.3. Performance Evaluation of SVR

To evaluate the performance of the SVR model, indexes of root mean square error (RMSE) and absolute fraction of variance (R2) were used [26], which can be calculated by Equations (6) and (7):
R M S E = i = 1 n ( y i y i ) 2 n
R 2 = i = 1 n ( y i y ¯ ) ( y i y ¯ ) i = 1 n ( y i y ¯ ) 2 i = 1 n ( y i y ¯ ) 2
where y i and y i are the actual values (measurements) and regressed values (predictions), and y ¯ and y ¯ are the average of the actual values and regressed values. RMSE is used to measure the deviation between the predictions and the measurements, while R 2 reflects the correlation closeness between them.

3. Results and Discussion

3.1. Performance of the ABR

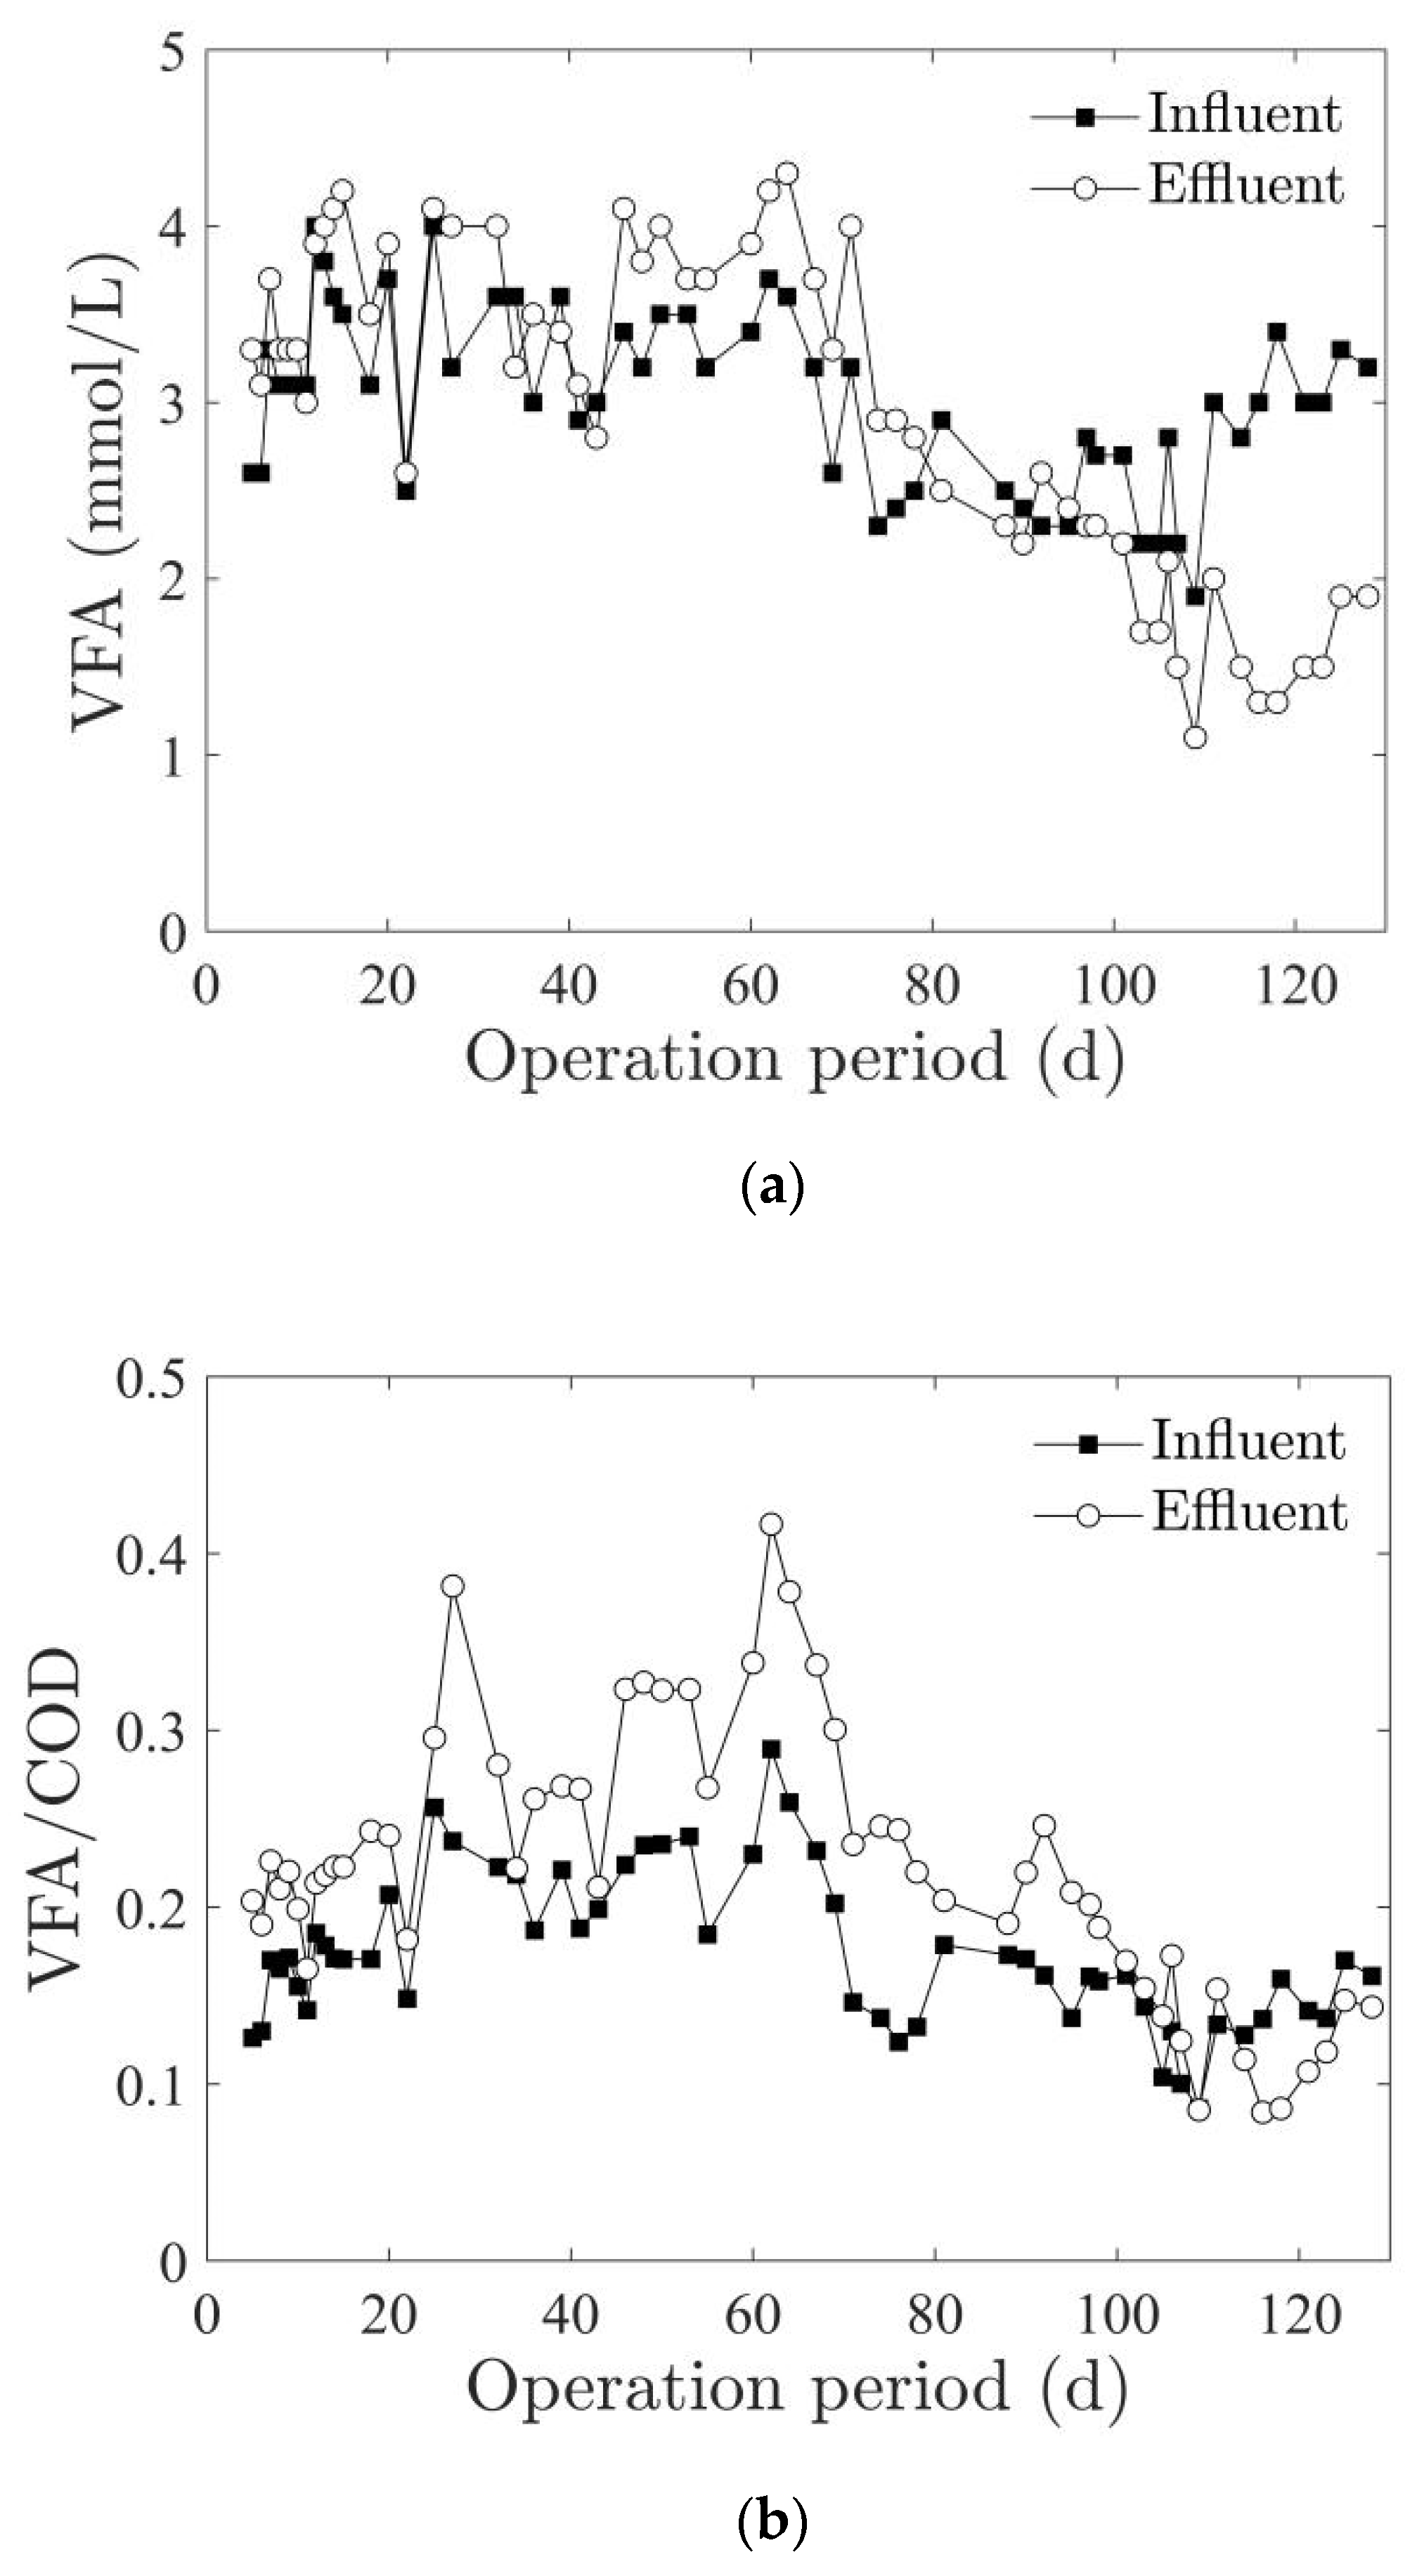
3.1.1. Variation of VFA Content in the Wastewater

VFA is the intermediate metabolite of anaerobic methane fermentation [27]. In anaerobic wastewater treatment, detecting the content of VFA can timely reflect the stability of reactor operation [28]. Due to the multi-compartment structure of ABR, the nutrients in front compartments are rich and sufficient. Acidogenic bacteria can use organic matter to produce more VFA, which can be used by methanogens in subsequent compartments to produce methane through interspecies hydrogen transfer or direct interspecies electron transfer [29]. In anaerobic reactions, the variation of VFA depends on the change of production and consumption in the whole process, that is, effluent VFA = influent VFA + VFA generated in the reactor-VFA degraded in the reactor. The influent and effluent VFA concentration and ratio of VFA to COD in mass concentration during the 130-day operation of the ABR is shown in Figure 2a,b, respectively. In the first 43 days after the startup, the variation range of influent VFA was about 2.5–4.0 mmol/L, with an average value of about 3.3 mmol/L; the variation range of effluent VFA was 2.6–4.2 mmol/L, with an average value of about 3.5 mmol/L, slightly higher than that of influent. This result shows that only a small amount of VFA was accumulated in the reactor because the newly inoculated activated sludge had not adapted to the wastewater at the initial stage of startup, and the acid production effect was not significant. With the gradual activation of acidogenic bacteria, the production and accumulation of VFA in the reactor was accelerated. During the 46–78 days of ABR operation, the average VFA was increased from 3.1 mmol/L in the influent to 3.6 mmol/L in the effluent. For the 100 days operation since the start-up, the ratio of VFA to COD changed from 0.12–0.29 in the influent to 0.17–0.42 in the effluent, with an average increase of 0.06. The variation range of the ratio was lower than those achieved by a sequencing batch reactor (SBR) at a much longer HRT of 5 days [30], as well as an anaerobic membrane bioreactor (AnMBR) treating low strength wastewater [31]. When the reactor ran to days 97–130, the influent VFA range of ABR became 1.9–3.4 mmol/L, with an average value of about 2.8 mmol/L, and the effluent VFA range was 1.1–2.3 mmol/L, with an average of about 1.7 mmol/L, a decrease of 1.73 mmol/L. The ratio of VFA to COD after day 111 also displayed an average decrease of 0.03 from the influent to the effluent. This remarkable reduction was because methanogens in the ABR had played a leading role and consumed more and more VFA, such as the acetic acid [27].

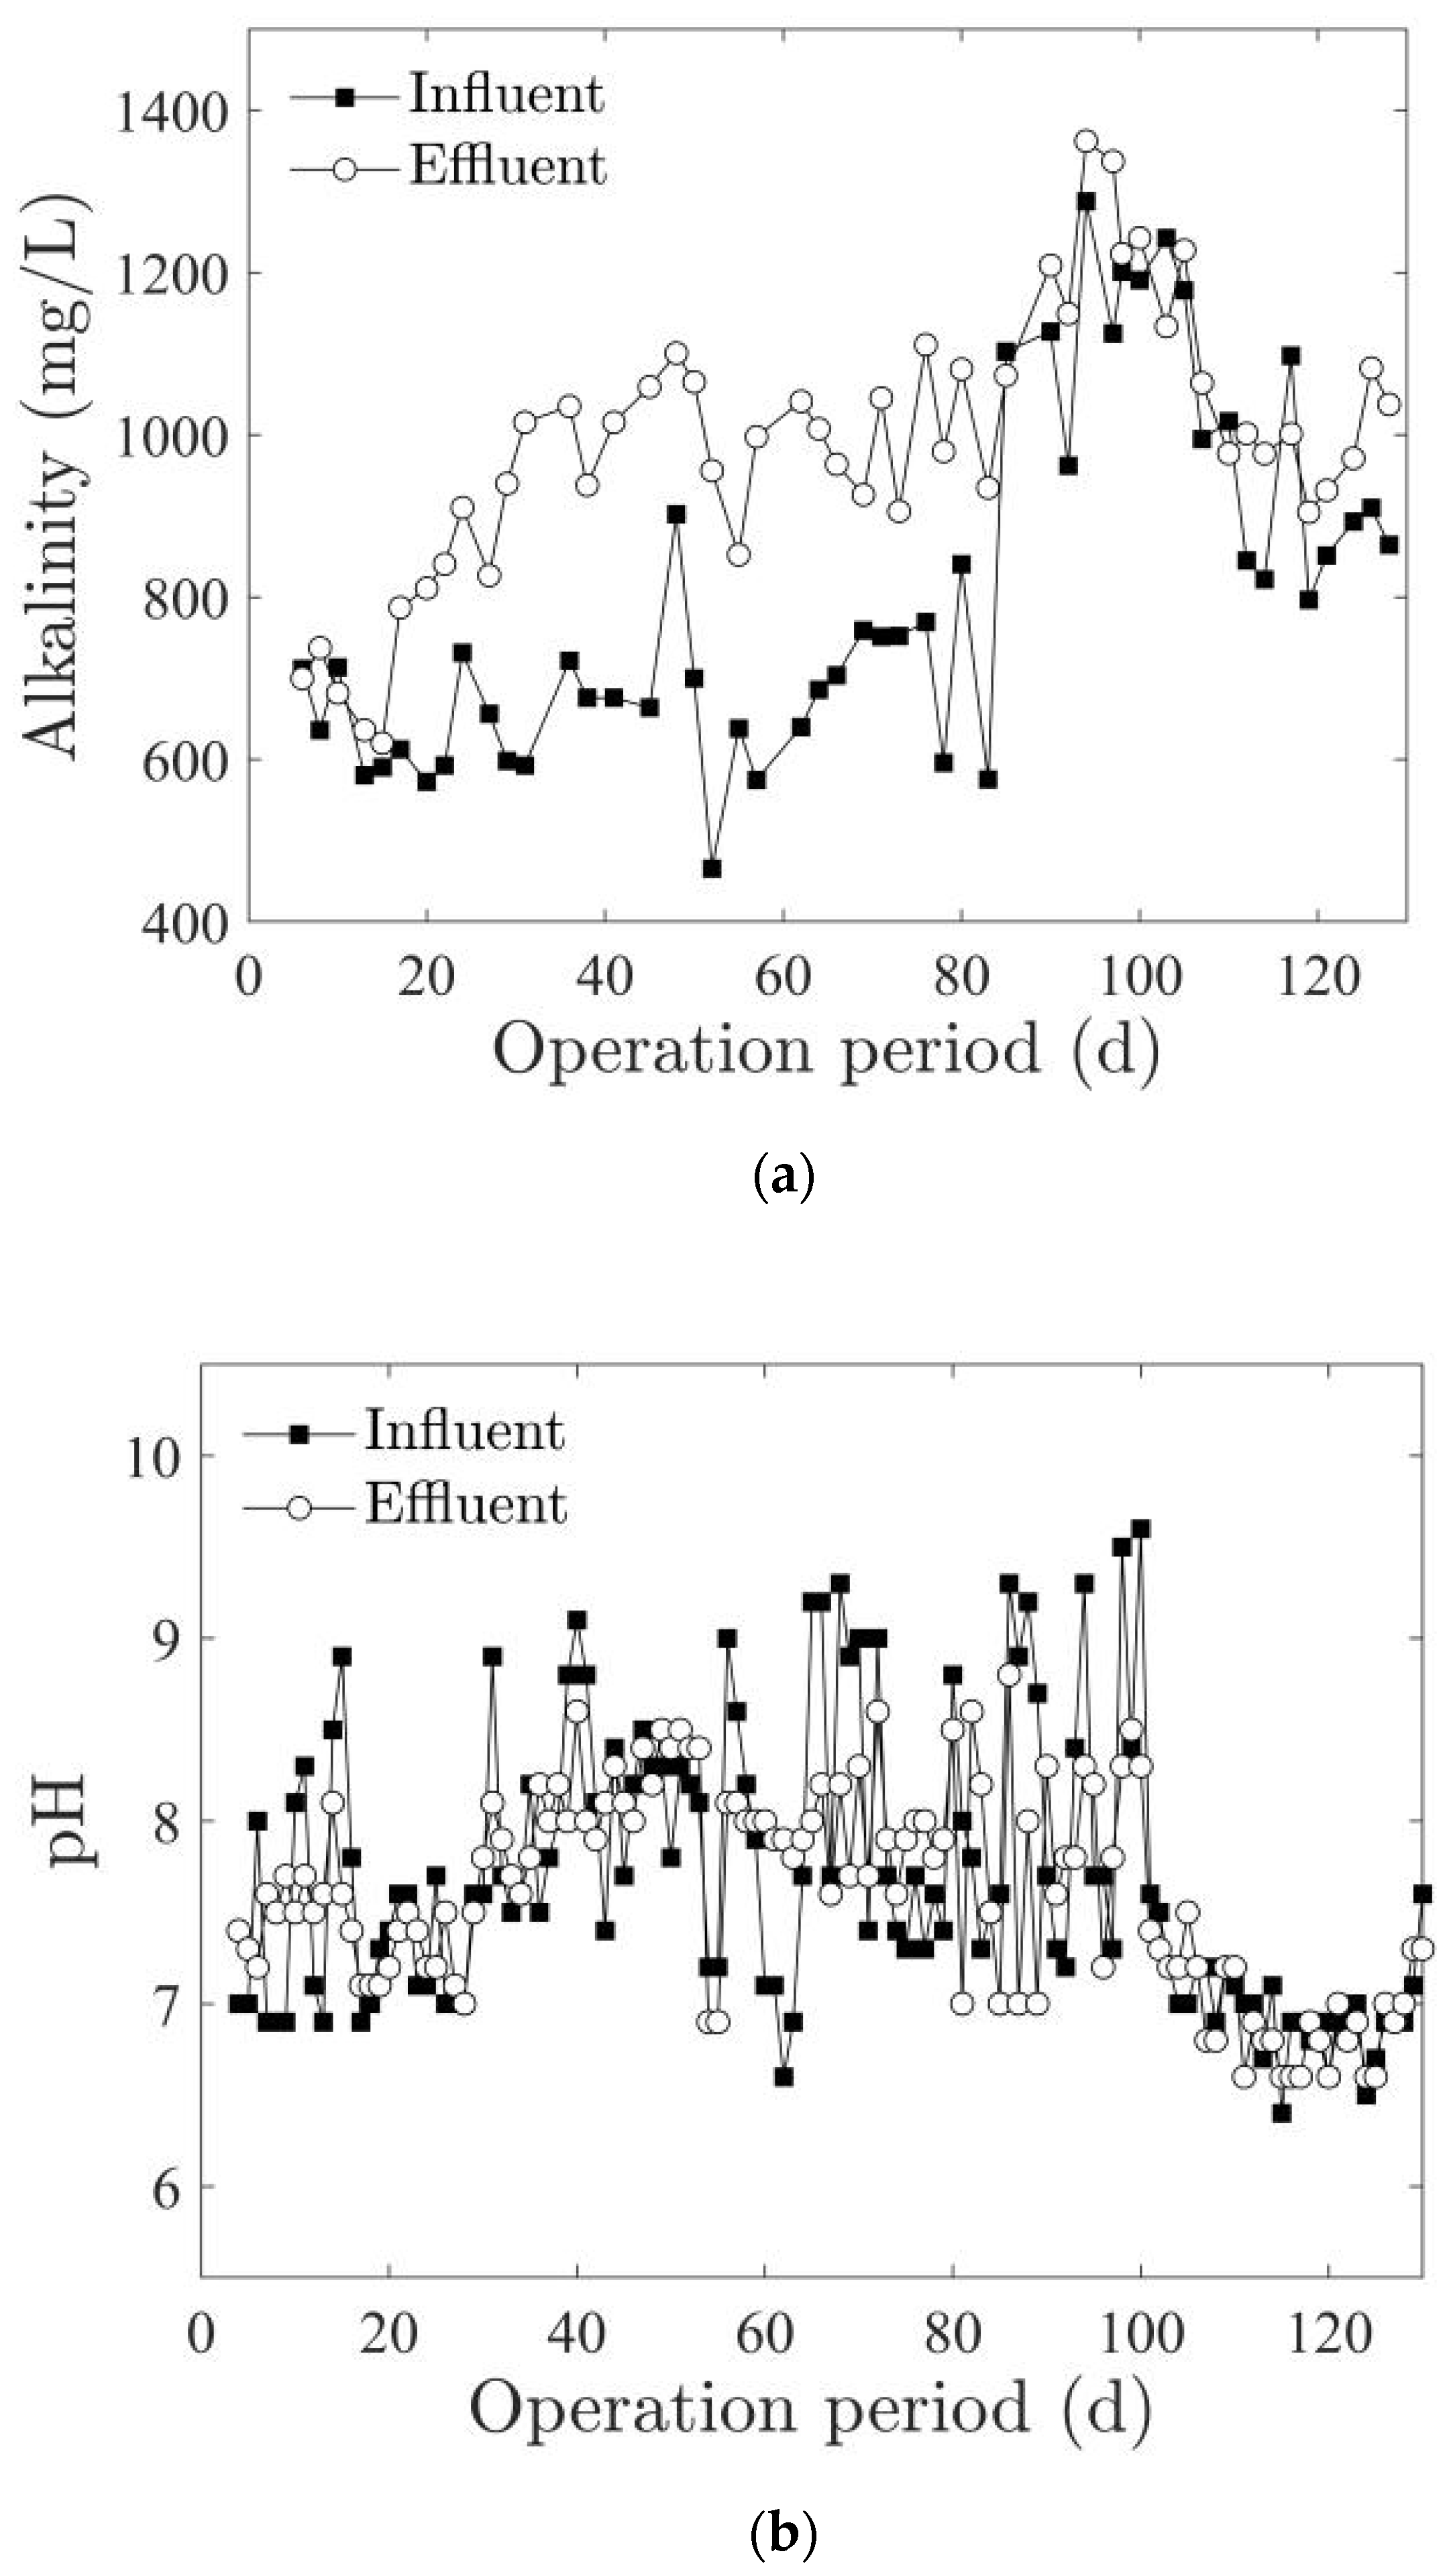
3.1.2. Variation of Alkalinity and pH of the Wastewater

Alkalinity in an anaerobic system mainly comes from bicarbonate, which can reflect the reactor operation performance and is used to evaluate the buffer capacity of the system; an appropriate alkalinity avoids sharp decline of pH value in the reactor caused by the massively generated VFA [32]. The change of influent and effluent alkalinity during the ABR operation period is shown in Figure 3a. It can be seen that the range of influent alkalinity from day 1 to 83 was 466–902 mg/L, with an average value of 667 mg/L; the effluent alkalinity ranged from 620–1111 mg/L, with an average of 920 mg/L. This rise was because in the anaerobic reaction system, the sulfate reducing bacteria used organic matter and hydrogen as part of energy and electron donors to reduce the sulfate in the wastewater to sulfur ions, which significantly increased the alkalinity [33]; in addition, the nitrogen-containing organic compounds, such as proteins were biodegraded to ammonia and amines, which also improved the alkalinity. After day 85, the difference between influent and effluent alkalinity became insignificant, mainly due to the weakening of sulfate reduction activity compared with previous days [21].
pH is another important parameter to maintain the stable operation of reactor, which changes the activity of microorganisms by affecting the activity of enzymes [34]. The suitable pH for acidogenic bacteria is 5.5–8.5, while that for methanogens is 6.5–8.2 [35]. When the pH of an anaerobic reactor drops below 5.0, methanogens cannot metabolize normally and acid production will also be inhibited. Even if the pH is returned to neutral, it is difficult to restore the normal operation of the reactor; moreover, the alkaline environment also helps to promote the production of VFA [36], so the anaerobic system should remain slightly alkaline or neutral [37]. The change of influent and effluent alkalinity during the ABR operation is shown in Figure 3b. During the whole operation period, the variation range of influent pH was 6.4–9.6, while that of effluent pH was 6.6–8.8. Because some conjugate acid-base pairs existed in the anaerobic system, such as NH4+/NH3, H2CO3/HCO3, HCO3/CO32−, etc., the reactor behaved as an acid-base buffer. Therefore, the ABR could narrow the fluctuation range of wastewater pH, so as to provide a relatively stable pH environment for subsequent aerobic biological treatment. It should be noted that after the reactor ran to day 99, the influent pH became significantly lower than that in the early stage. At this time, the effluent VFA concentration became significantly lower than that in the influent (see Figure 2), but the effluent pH range did not change significantly compared with that in the influent, indicating that the reactor maintained a good state of acid-base balance.

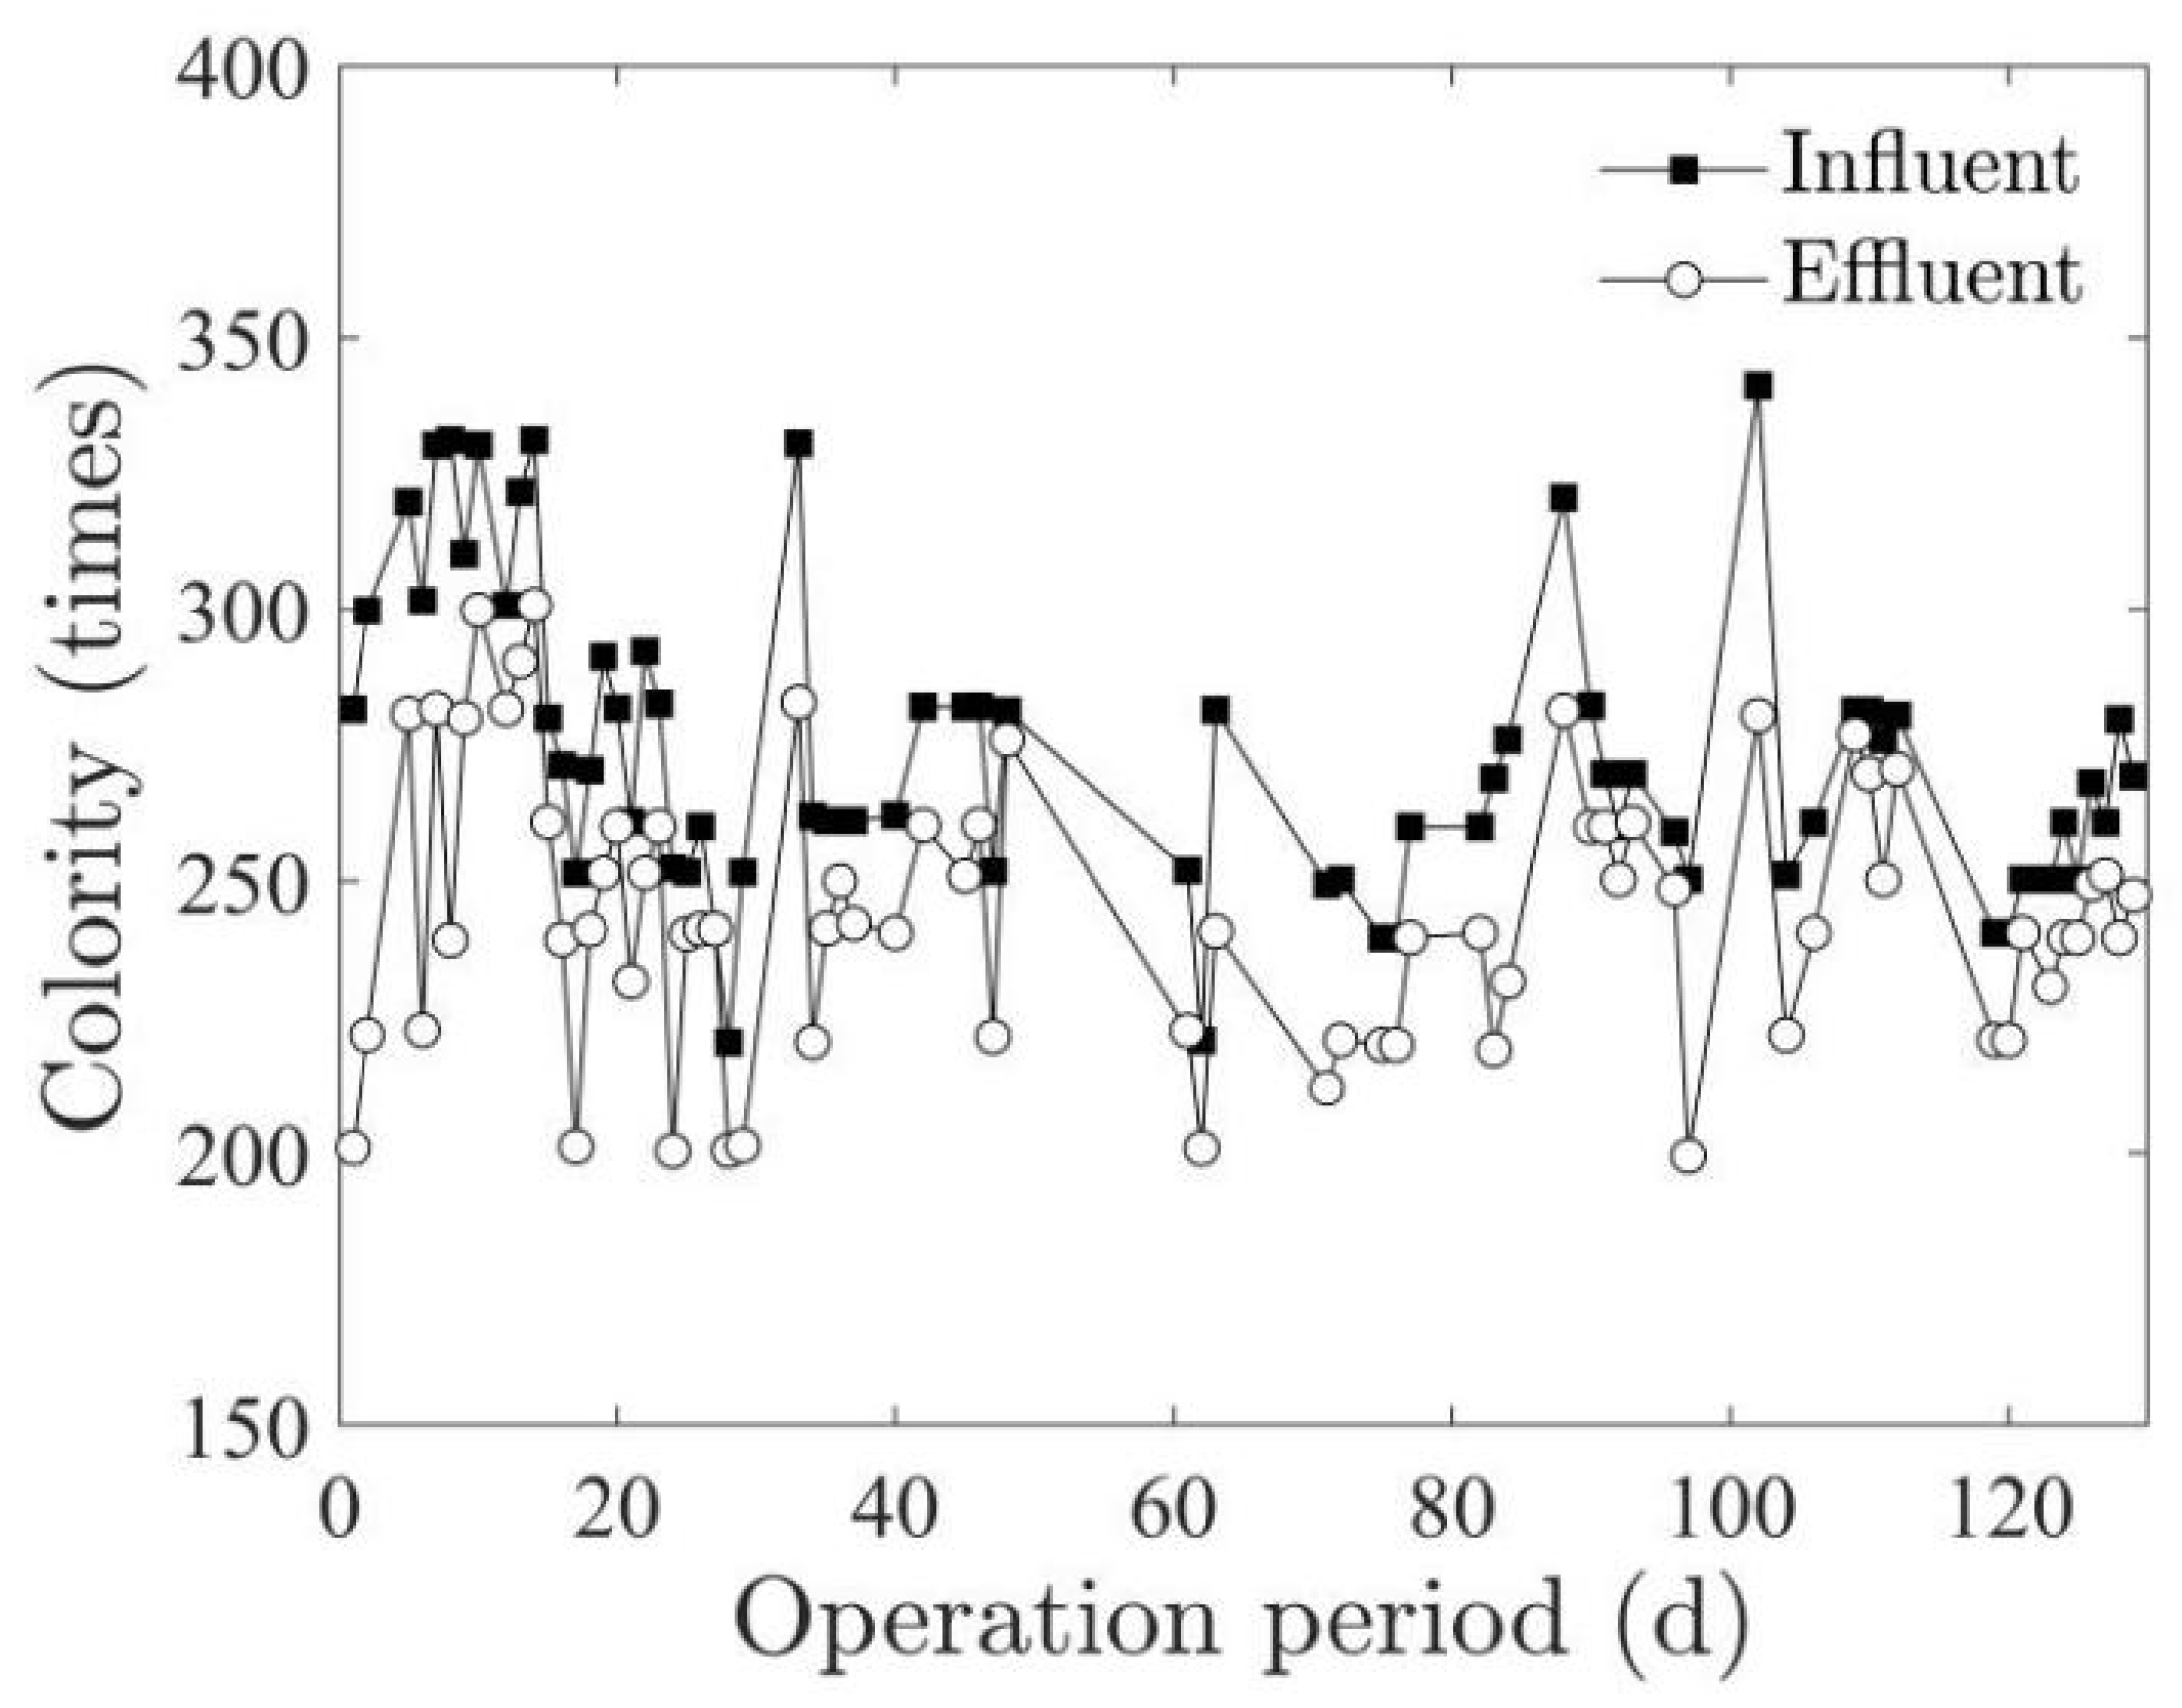
3.1.3. Variation of Colority of the Wastewater

The colority of printing and dyeing wastewater mainly comes from the dye molecules dissolved in it. Through a series of oxidation, reduction and hydrolysis activities, microbial enzymes can destroy the unsaturated bonds and chromogenic groups of dye molecules, degrade some dye substances and realize wastewater decolorization [38], while some dyes are decolorized via adsorption onto microbial granules [39]. Under anaerobic conditions, azo dye decolorization takes place through nonspecific extracellular reactions, in which other organic compounds coexisting in the wastewater act as the main source of electron donor for breaking down the azo bonds [40]. Figure 4 shows the variation of influent and effluent color during the ABR operation. The influent color range was 220–341 times with an average value of 273 times, while the effluent color range was 200–301 times, with an average of 244 times. The average decolorization rate was 10.5%, lower than that reported by Huang et al. [10] (56%). In order to further analyze the decolorization of anaerobic treatment, five dye substances (acid blue, acid orange, Direct Blue 106, naphthol AS-E and Sudan Red 1) in the influent and effluent water of the ABR on day 90 were determined by LC-MS. It can be found that the reactor showed different removal capacities for different dyes. The tryptophan AS-E and azo dye acid blue detected in the influent had not been detected in the effluent, indicating a strong removal capacity of the reactor for these two organic dyes; the removal rate of azo dyes acid orange and direct Blue 106 was 23.2% and 10.9%, respectively, but there was little removal of azo dye Sudan Red 1, probably due to its water-insolubility [41]. Nevertheless, during the actual operation of the full-scale wastewater treatment plant, the colority of the effluent from the subsequent aerobic process can meet the standard, so the low colority removal rate in the anaerobic section is not a serious problem.

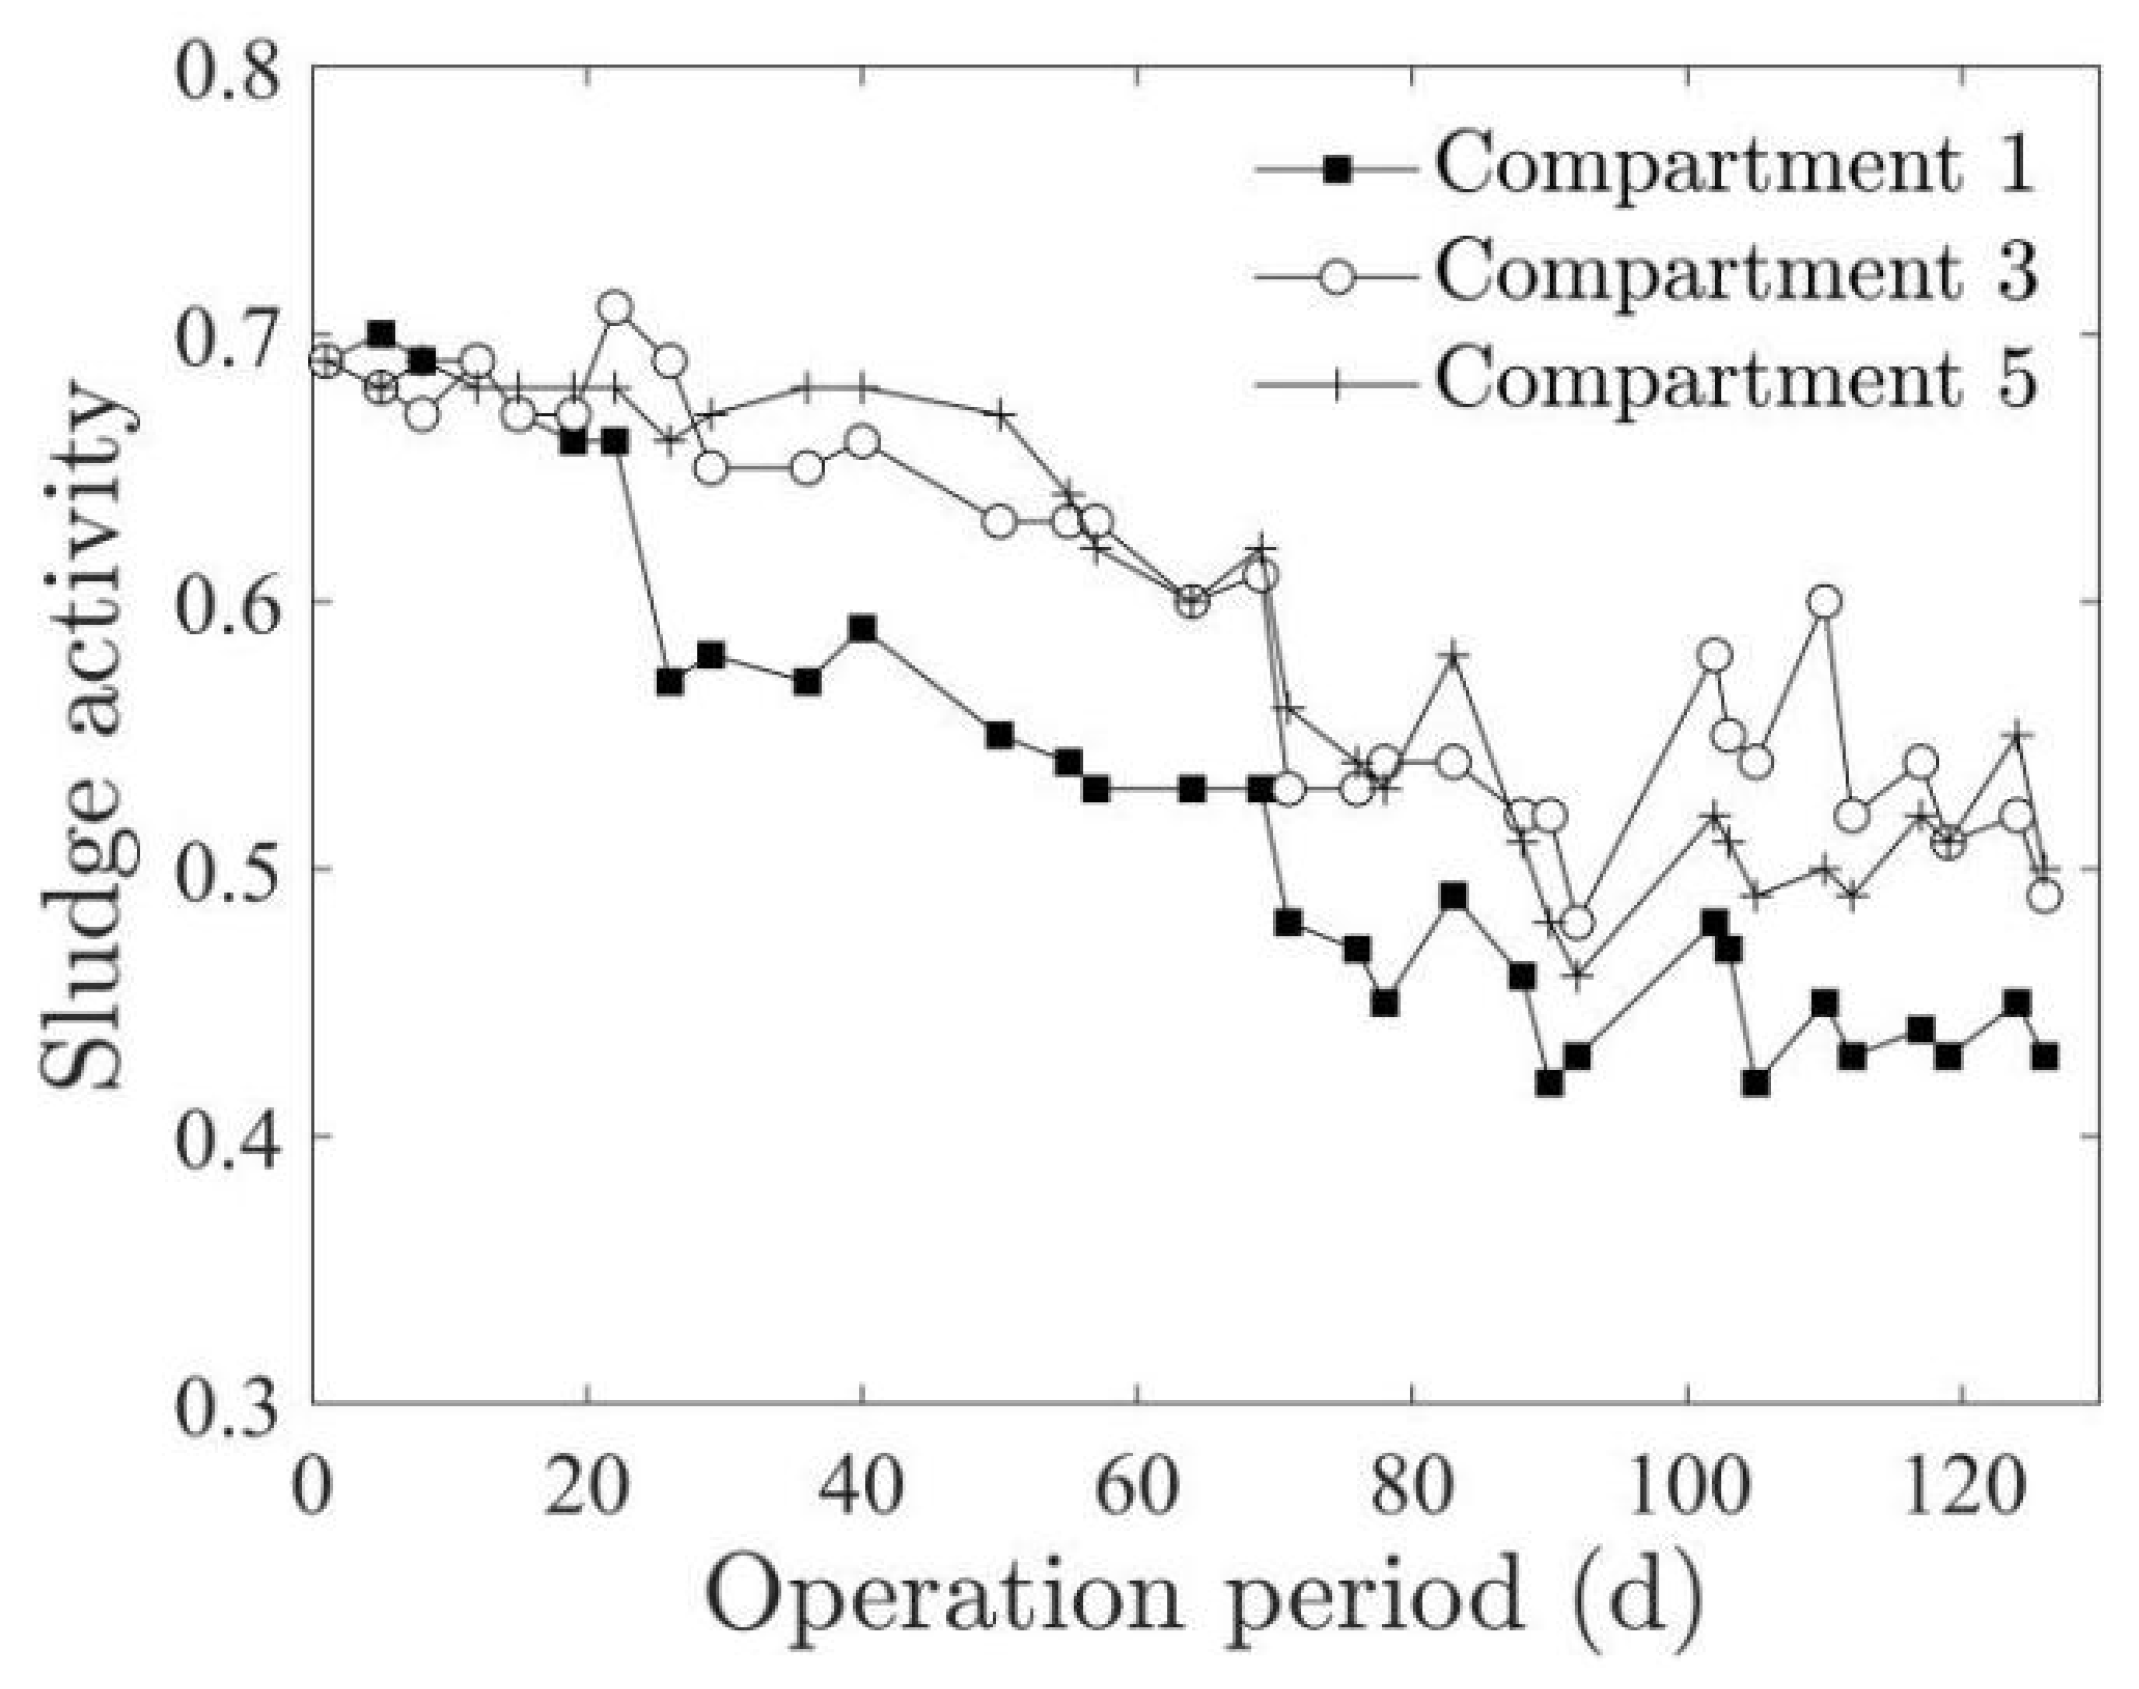
3.1.4. Variation of Sludge Activity in the ABR

In the engineering practice of wastewater treatment, the sludge activity is generally expressed by the ratio of mixed liquid volatile suspended solids (MLVSS) over mixed liquid suspended solids (MLSS), which indicates the proportion of active components in the sludge. The higher the sludge activity, the stronger the pollutant degradation capacity of unit mass sludge [42]. Figure 5 shows the variation of sludge activity in Compartments 1, 3 and 5 during the ABR operation. It can be seen that when the reactor was started, the sludge activity was about 0.70, and then continued to decrease, falling to 0.42, 0.49 and 0.50, respectively, in Compartments 1, 3 and 5 at day 130. The range of the sludge activity was similar to those reported by a few studies [43,44], and the decrease was mainly caused by the accumulation of inorganic solids in the sludge. Generally, when the inorganic matter is deposited or suspended in the reactor, it will hinder the full contact between the activated sludge and organic pollutants in wastewater and cause harm to the growth and metabolism of the microorganisms. The sludge activity in Compartment 1 was always the lowest among these compartments because the wastewater first flowed into it, where the most inorganic solids were accumulated. When the wastewater reached subsequent compartments, the inorganic solids in it had been intercepted and reduced. This means that in order to maintain high sludge activity, an appropriate amount of sludge should be discharged regularly from the reactor bottom so as to reduce the content of inorganic components and ensure the activity of anaerobic microorganisms.

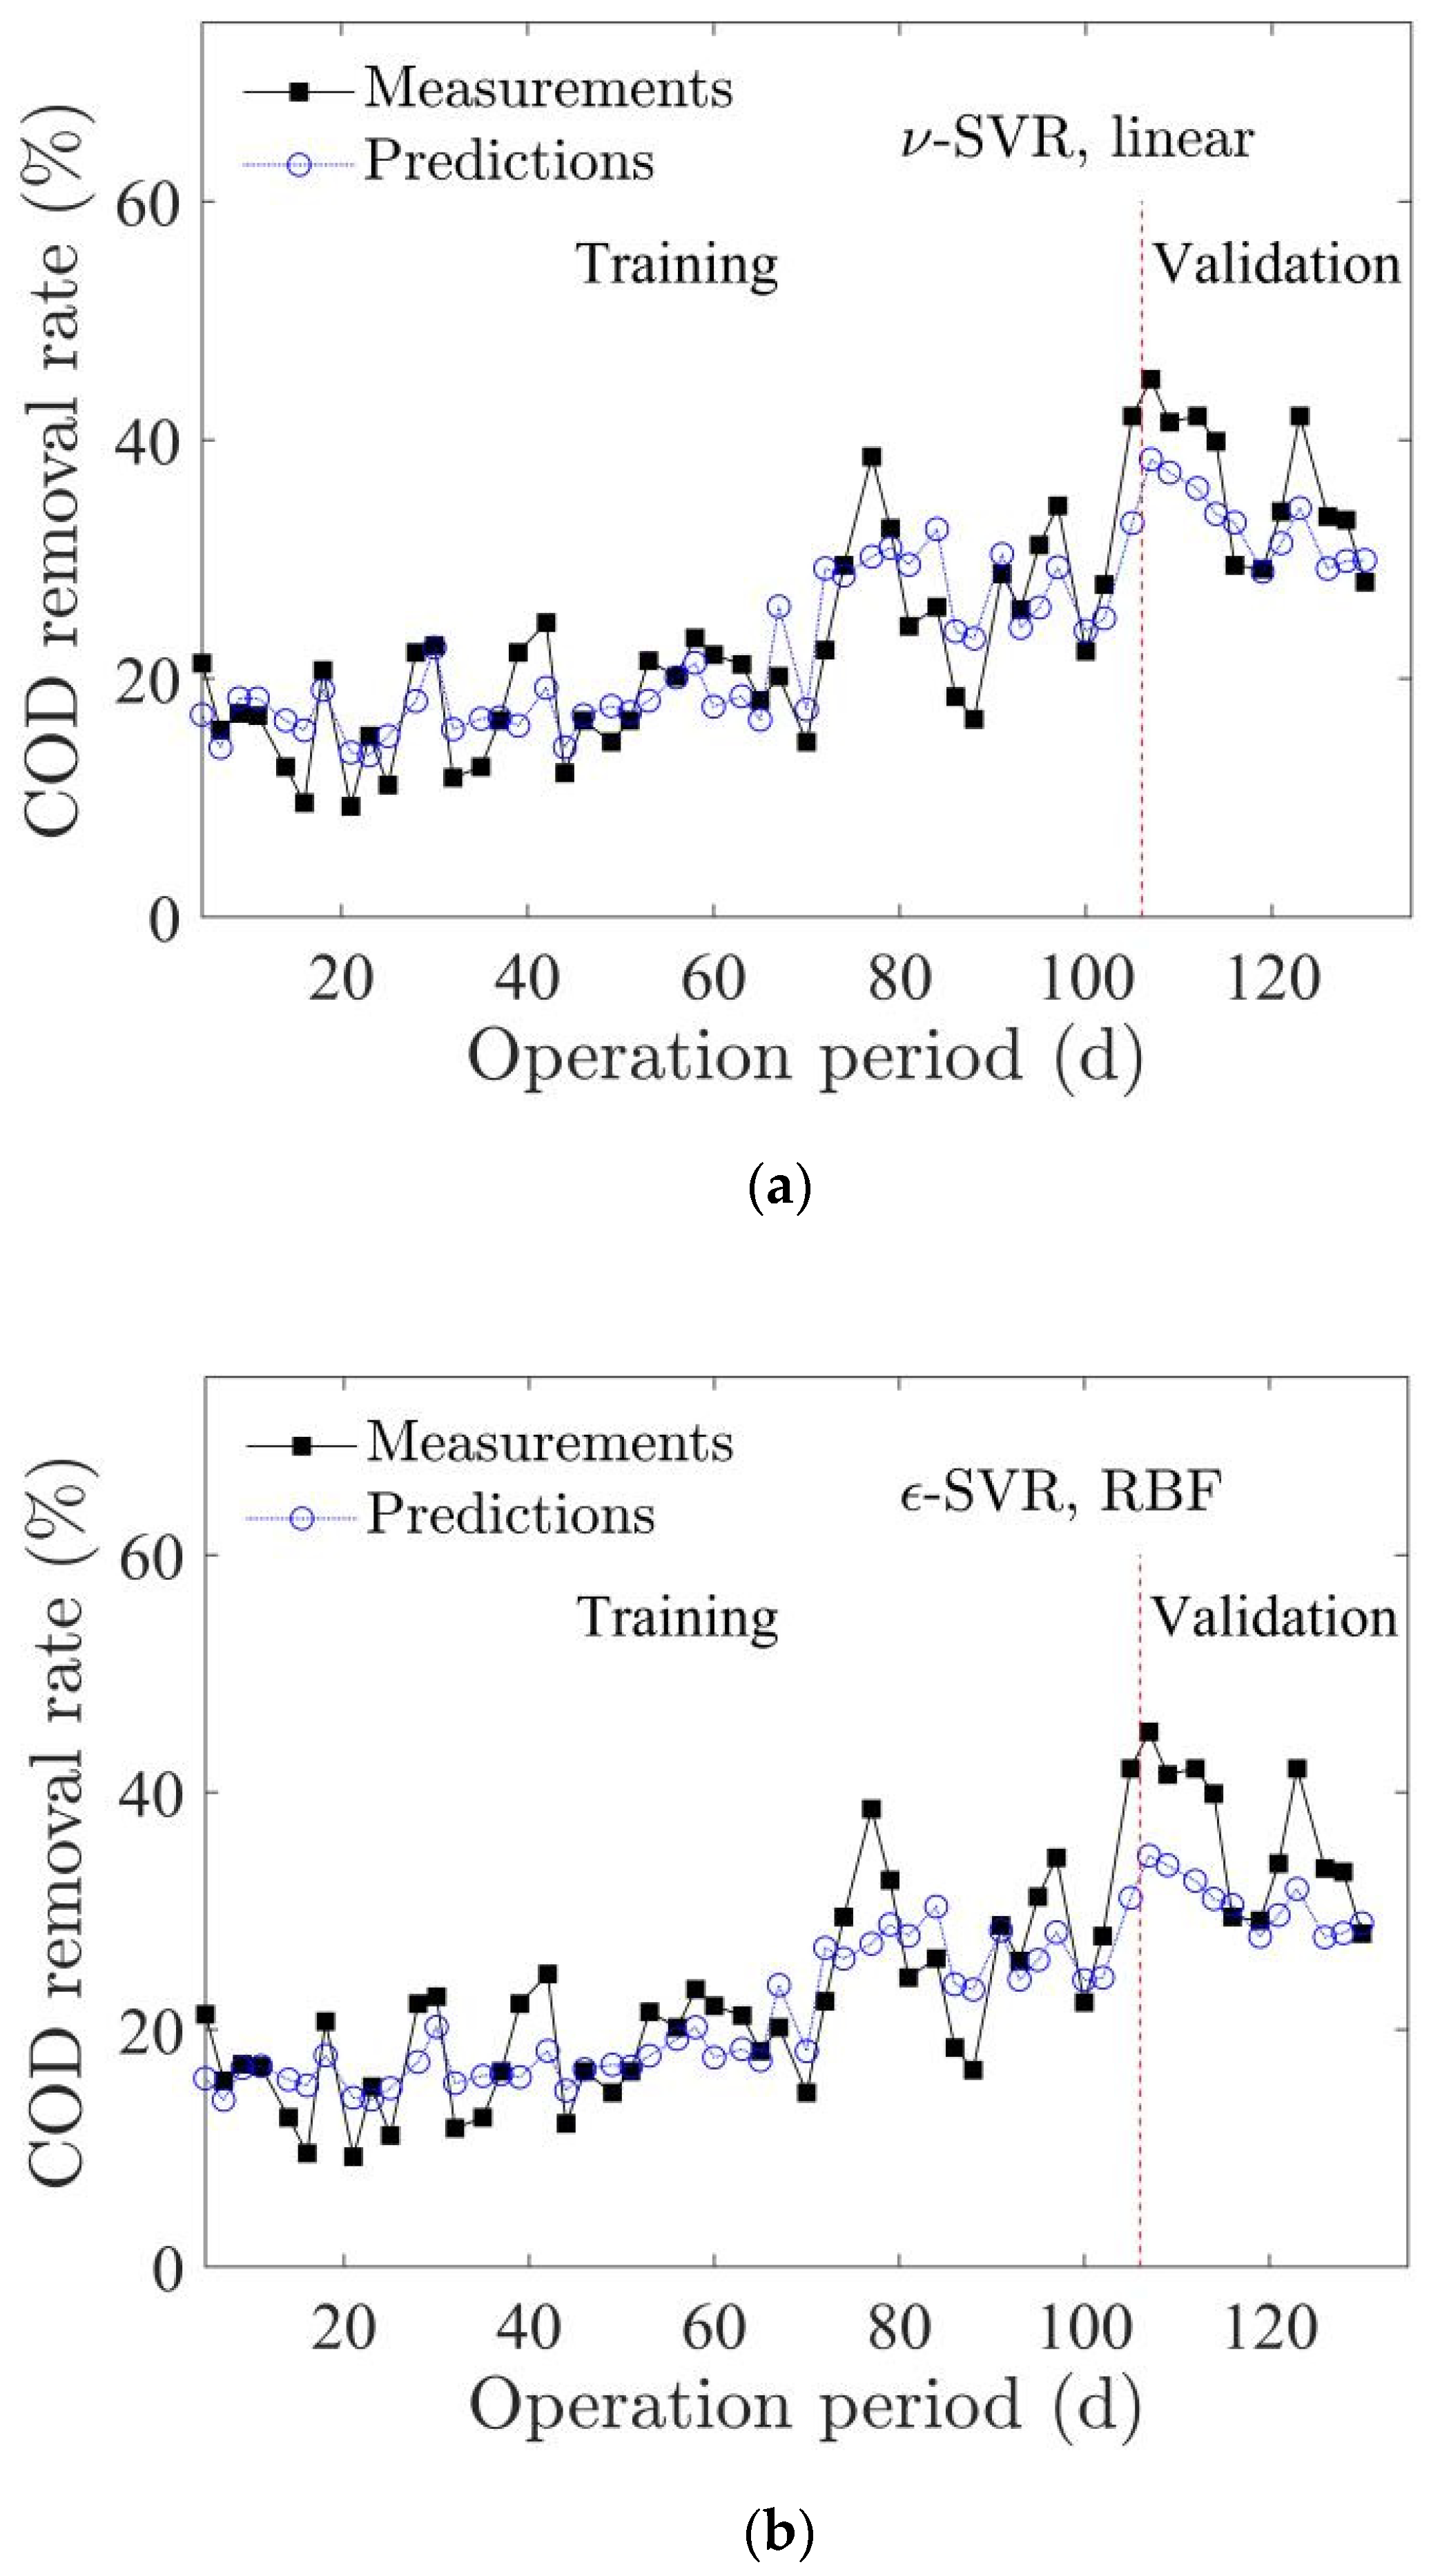
3.2. SVR for the COD Removal

Since the final product of anaerobic treatment of organic wastewater is inorganic salt or gas, the anaerobic reactor in good operation can achieve a certain COD removal rate. Generally, a high COD removal rate achieved by the anaerobic reactor may reduce the organic load for the subsequent aerobic treatment process and make the system operate more effectively and economically. During the 130-day operation, the range of the COD removal rate achieved by the ABR increased from around 10% to a maximum value of 45.1%, shown in Figure 6.
In order to predict the performance of the ABR in degrading organic pollutants, the SVR technology was employed to relate the variation of COD removal rate to its influencing factors. The data used for SVR is listed in Table A1. The performance of ν-SVR and ε-SVR with linear, RBF and sigmoid kernel function, including the iteration times, and RMSE and R2 for both training and validation data sets, respectively, is summarized in Table 3. For the six combinations for training, an RMSE range of 4.05–4.27% and an R2 range of 0.688–0.701 have been achieved by the SVR. For the validation, it can be found that the ν-SVR algorithm generally performs better than ε-SVR does, indicated by a lower range of RMSE (4.77–5.05%) and a higher range of R2 (0.737–0.738) of the former. The two algorithms do not display significant difference in their performance when using different kernel functions.
Table 4 summarizes the optimized parameters used by ν-SVR and ε-SVR with linear, RBF and sigmoid kernel function, respectively. The number of support vectors used by the ε-SVR (25) is smaller than that used by the ν-SVR (34), consistent with its fewer iteration times. This indicates that when the data amount is huge, the ε-SVR using fewer support vectors may obtain a faster model training and prediction speed. Both algorithms with linear kernel function has the lowest value of c (0.22 and 0.13), which shows the highest tolerance for error, while those with RBF kernel function have the highest c (21.11 and 48.50), indicating the lowest error tolerance.
Figure 6 shows the predictions against the measurements of the COD removal rate for the ν-SVR with linear kernel function in (a) and ε-SVR with RBF kernel function in (b), respectively. Both predictions can capture the variation trend of the COD removal rate, but the outputs from the former algorithm behave more closely to the actual measurements. In general, the performance of SVR seems not as good as some reported studies on its application to anaerobic treatment of domestic sewage [43] or synthetic wastewater [45], which can be mainly attributed to the complex water quality of the printing and dyeing wastewater. However, the errors caused by the SVR models and the fitting correlation are acceptable in engineering practice.

3.3. Advantages and Limitations of This Study

One advantage of this study is that a pilot-scale anaerobic reactor equipped with packing was employed to treat the printing and dyeing wastewater collected from a real wastewater treatment plant, with long-term operation and monitoring. Furthermore, the advanced and powerful artificial intelligence machine learning algorithm-support vector machine is used to establish the regression model, which enables the prediction of the reactor performance.
One limitation of this study is that the effect of the change of weather conditions was unknown. The results were obtained when the water temperature naturally increased with the warming of the weather, but if the reactor was started in the season of temperature decline, the operation results might differ. In addition, this study focused on the performance of the reactor in degrading organic pollutants, while the biogas was not analyzed in detail, which is another limitation.

4. Conclusions

A pilot-scale anaerobic baffled reactor with packing was constructed to treat the printing and dyeing wastewater from the coagulation sedimentation tank of a wastewater treatment plant. The reactor was operated for 130 days, and the performance was monitored. The alkalinity of the wastewater increased at the early stage of operation, mainly due to the reduction of sulfate and the degradation of nitrogen-containing organic compounds; after 97 days of operation, both the VFA content and the ratio of VFA to COD in the wastewater decreased, indicating the activity of methanogens. At an HRT of 12 h and an OLR of 2.0–2.5 kg COD/(m3·d), the reactor stabilized the pH fluctuation of wastewater and achieved an average colority removal rate of 10.5%, eliminated tryptophan AS-E and azo dye acid blue, as well as reduced azo dyes acid orange and direct Blue 106, which is conducive to subsequent aerobic treatment. The accumulation of inorganic solids in wastewater led to the decline of sludge activity, indicating that a proper amount of sludge should be discharged regularly from the reactor. On the whole, the reactor system maintained stable operation and showed satisfactory degradation effect on the printing and dyeing wastewater. The support vector regression technology demonstrates its ability in relating the reactor performance to its influencing factors. The algorithm of ν-SVR achieves an RMSE range of 4.77–5.05% and an R2 range of 0.737–0.738 for the validation data set of COD removal rate, which can satisfy the need of practical engineering prediction in wastewater treatment.

Author Contributions

Conceptualization, methodology, formal analysis, funding acquisition, project administration, writing–original draft, Z.Q.; investigation, software, Z.W.; supervision, validation, M.C.; writing–review and editing, D.X. All authors have read and agreed to the published version of the manuscript.

Funding

This research was funded by the National Natural Science Foundation of China (41807466, 42076167).

Institutional Review Board Statement

Not applicable.

Informed Consent Statement

Not applicable.

Data Availability Statement

Not applicable.

Conflicts of Interest

The authors declare no conflict of interest.

Appendix A

Table A1. Data used for SVR.
Operation Period (d)Influent COD (mg/L)Effluent COD (mg/L)Water Temperature
(°C)
Flow Rate (m3/d) VLR
(kg COD/(m3·d))
Influent SS (mg/L)
1112597015.67.20.45120.5
31188104316.77.30.48115.0
5123697317.47.40.51234.2
7116498216.37.60.49166.2
9108589917.87.80.47270.8
111311109017.88.10.59257.6
141263110418.88.60.60212.2
161231113123.78.60.59203.9
18109086424.311.40.69266.0
21107297321.810.60.63143.0
23101285820.811.00.62133.9
2593683223.810.60.55188.4
2880962922.813.80.62237.0
3093672220.913.30.69336.5
3297085620.911.00.59190.3
3598986521.511.10.61210.3
3796380422.411.80.63210.3
3997776023.612.90.70184.3
4292569724.414.40.74253.3
4490579524.013.70.69139.6
4691176123.814.00.71201.3
4981769724.113.90.63228.6
5189174425.014.60.72206.6
5387568724.516.90.82209.4
56104083026.416.30.94251.6
5896273727.818.20.97273.7
6088769226.817.90.88192.8
6376760528.020.20.86208.9
6583368229.921.61.00146.0
6782865931.422.91.05368.8
7077265932.923.81.02162.8
721313101932.124.01.75374.9
74100470831.424.41.36395.3
77116371430.924.01.55415.5
79113476432.431.41.98364.5
8197473632.933.81.83335.9
84114684732.034.42.19368.7
8682767431.933.31.53230.3
8886772332.232.21.55219.0
9184460133.035.41.66367.8
9385463431.934.41.63223.3
95100469132.935.31.97229.5
97104568533.435.52.06302.8
100100277934.032.31.80213.9
10291866233.030.61.56267.2
105127073734.034.72.45359.2
107131772334.934.72.54481.5
109132277335.034.12.50461.3
112134678136.530.92.31464.6
114131579035.830.52.23420.2
116131692835.430.22.21405.1
119127990535.230.82.19304.3
121127284035.832.42.29347.3
123131376136.233.62.45399.0
126116577435.831.12.01328.5
128119179436.130.22.00349.2
130114082036.036.02.28299.6

References

  1. Shao, M.; Li, Y.; Meng, L.; Guo, J.; Gao, Y.; Liu, Y.; Huang, M. Simultaneous removal of antimony, chromium and aniline by forward osmosis membrane: Preparation, performance and mechanism. Desalination 2021, 520, 115363. [Google Scholar] [CrossRef]
  2. Zhai, Q.; Liu, R.; Wang, C.; Wen, X.; Li, X.; Sun, W. A novel scheme for the utilization of Cu slag flotation tailings in preparing internal electrolysis materials to degrade printing and dyeing wastewater. J. Hazard. Mater. 2022, 424, 127537. [Google Scholar] [CrossRef]
  3. Cui, M.H.; Gao, L.; Lee, H.S.; Wang, A.J. Mixed dye wastewater treatment in a bioelectrochemical system-centered process. Bioresour. Technol. 2020, 297, 122420. [Google Scholar] [CrossRef] [PubMed]
  4. Che, L.; Xu, H.; Wei, Z.; Wei, R.; Yang, B. Activated carbon modified with nano manganese dioxide triggered electron transport pathway changes for boosted anaerobic treatment of dyeing wastewater. Environ. Res. 2022, 203, 111944. [Google Scholar] [CrossRef] [PubMed]
  5. Romero-Soto, I.C.; García-Gómez, C.; Álvarez-Valencia, L.H.; Meza-Escalante, E.R.; Leyva-Soto, L.A.; Camacho-Ruiz, M.A.; Concha-Guzmán, M.O.; Ulloa-Mercado, R.G.; Díaz-Tenorio, L.M.; Gortáres-Moroyoqui, P. Sequential Congo Red elimination by UASB reactor coupled to electrochemical systems. Water 2021, 13, 3087. [Google Scholar] [CrossRef]
  6. Berkessa, Y.W.; Yan, B.; Li, T.; Jegatheesan, V.; Zhang, Y. Treatment of anthraquinone dye textile wastewater using anaerobic dynamic membrane bioreactor: Performance and microbial dynamics. Chemosphere 2020, 238, 124539. [Google Scholar] [CrossRef] [PubMed]
  7. Chaturvedi, A.; Rai, B.N.; Singh, R.S.; Jaiswal, R.P. Comparative toxicity assessment using plant and luminescent bacterial assays after anaerobic treatments of dyeing wastewater in a recirculating fixed bed bioreactor. J. Environ. Chem. Eng. 2021, 9, 105466. [Google Scholar] [CrossRef]
  8. Yang, B.; Xu, H.; Yang, S.; Bi, S.; Li, F.; Shen, C.; Ma, C.; Tian, Q.; Liu, J.; Song, X.; et al. Treatment of industrial dyeing wastewater with a pilot-scale strengthened circulation anaerobic reactor. Bioresour. Technol. 2018, 264, 154–162. [Google Scholar] [CrossRef] [PubMed]
  9. Xu, H.; Yang, B.; Liu, Y.B.; Li, F.; Shen, C.S.; Ma, C.Y.; Tian, Q.; Song, X.S.; Sand, W. Recent advances in anaerobic biological processes for textile printing and dyeing wastewater treatment: A mini-review. World J. Microbiol. Biotechnol. 2018, 34, 165. [Google Scholar] [CrossRef]
  10. Huang, R.M.; Liu, Z.; Zhou, X.J.; Mo, J.C.; Liu, X. Research on treatment of printing and dyeing wastewater by hybrid anaerobic baffled reactor. Desalin. Water Treat. 2015, 54, 590–597. [Google Scholar] [CrossRef]
  11. Nguyen, T.H.; Watari, T.; Hatamoto, M.; Sutani, D.; Setiadi, T.; Yamaguchi, T. Evaluation of a combined anaerobic baffled reactor-downflow hanging sponge biosystem for treatment of synthetic dyeing wastewater. Environ. Technol. Innov. 2020, 19, 100913. [Google Scholar] [CrossRef]
  12. Pirsaheb, M.; Amini, J.; Hossaini, H. Application of ABR/zeolite for TKN removal from compost leachate. Environ. Technol. Innov. 2021, 24, 102020. [Google Scholar] [CrossRef]
  13. Nguyen, T.H.; Watari, T.; Hatamoto, M.; Setiadi, T.; Yamaguchi, T. Enhanced decolorization of dyeing wastewater in a sponges-submerged anaerobic reactor. Chemosphere 2021, 279, 130475. [Google Scholar] [CrossRef]
  14. Liu, N.; Yun, Y.; Hu, L.; Xin, L.; Han, M.; Zhang, P. Study on start-up membraneless anaerobic baffled reactor coupled with microbial fuel cell for dye wastewater treatment. ACS Omega 2021, 6, 23515–23527. [Google Scholar] [CrossRef] [PubMed]
  15. Wang, T.; Wang, X.; Yuan, L.; Luo, Z.; Indira, H.K. Start-up and operational performance of Anammox process in an anaerobic baffled biofilm reactor (ABBR) at a moderate temperature. Bioresour. Technol. 2019, 279, 1–9. [Google Scholar] [CrossRef]
  16. Enitan, A.M.; Adeyemo, J.; Swalaha, F.M.; Kumari, S.; Bux, F. Optimization of biogas generation using anaerobic digestion models and computational intelligence approaches. Rev. Chem. Eng. 2017, 33, 309–335. [Google Scholar] [CrossRef]
  17. Shi, S.; Xu, G. Novel performance prediction model of a biofilm system treating domestic wastewater based on stacked denoising auto-encoders deep learning network. Chem. Eng. J. 2018, 347, 280–290. [Google Scholar] [CrossRef]
  18. Vapnik, V.N. The Nature of Statistical Learning Theory; Springer: New York, NY, USA, 1995. [Google Scholar]
  19. Chang, C.C.; Lin, C.J. LIBSVM: A library for support vector machines. ACM Trans. Intel. Syst. Technol. 2011, 27, 1–27. [Google Scholar] [CrossRef]
  20. Liu, J.; Kang, X.; Luan, X.; Gao, L.; Tian, H.; Liu, X. Performance and membrane fouling behaviors analysis with SVR-LibSVM model in a submerged anaerobic membrane bioreactor treating low-strength domestic sewage. Environ. Technol. Innov. 2020, 19, 100844. [Google Scholar] [CrossRef]
  21. Qi, Z.; Xiang, G.; Xiong, D. Performance evaluation of pilot-scale hybrid anaerobic baffled reactor (HABR) to process dyeing wastewater based on grey relational analysis. Appl. Sci. 2019, 9, 1974. [Google Scholar] [CrossRef] [Green Version]
  22. APHA/AWWA/WEF. Standard Methods for the Examination of Water and Wastewater; American Public Health Association: Washington, DC, USA, 2005. [Google Scholar]
  23. Vasilaki, V.; Conca, V.; Frison, N.; Eusebi, A.L.; Fatone, F.; Katsou, E. A knowledge discovery framework to predict the N2O emissions in the wastewater sector. Water Res. 2020, 178, 115799. [Google Scholar] [CrossRef]
  24. Platt, J.C. Probabilistic outputs for support vector machines and comparison to regularized likelihood methods. In Advances in Large Margin Classifiers; Smola, A., Bartlett, P., Schölkopf, B., Schuurmans, D., Eds.; MIT Press: Cambridge, MA, USA, 2000. [Google Scholar]
  25. Zhang, C.; Wu, K.; Huang, L.; Sun, K.; Zou, Y.; Xiong, Z.; Li, B. Virtual screening and discovery of matrix metalloproteinase-12 inhibitors by swarm intelligence optimization algorithm-based machine learning. ChemistrySelect 2020, 5, 11112–11119. [Google Scholar] [CrossRef]
  26. Granata, F.; Papirio, S.; Esposito, G.; Gargano, R.; de Marinis, G. Machine learning algorithms for the forecasting of wastewater quality indicators. Water 2017, 9, 105. [Google Scholar] [CrossRef] [Green Version]
  27. Bertacchi, S.; Ruusunen, M.; Sorsa, A.; Sirviö, A.; Branduardi, P. Mathematical analysis and update of ADM1 model for biomethane production by anaerobic digestion. Fermentation 2021, 7, 237. [Google Scholar] [CrossRef]
  28. Feng, Y.; Feng, L.; Liu, S.; Duan, J.; Zhang, Y.; Li, S.; Sun, X.; Wang, S.; Yuan, X. Emerging investigator series: Inhibition and recovery of anaerobic granular sludge performance in response to short-term polystyrene nanoparticle exposure. Environ. Sci. Water Res. Technol. 2018, 4, 1902–1911. [Google Scholar] [CrossRef]
  29. Feng, D.; Xia, A.; Huang, Y.; Zhu, X.; Zhu, X.; Liao, Q. Effects of carbon cloth on anaerobic digestion of high concentration organic wastewater under various mixing conditions. J. Hazard. Mater. 2022, 423, 127100. [Google Scholar] [CrossRef]
  30. Lim, J.X.; Zhou, Y.; Vadivelu, V.M. Enhanced volatile fatty acid production and microbial population analysis in anaerobic treatment of high strength wastewater. J. Water Process Eng. 2020, 33, 101058. [Google Scholar] [CrossRef]
  31. Khan, M.A.; Ngo, H.H.; Guo, W.; Liu, Y.; Nghiem, L.D.; Chang, S.W.; Nguyen, D.D.; Zhang, S.; Luo, G.; Jia, H. Optimization of hydraulic retention time and organic loading rate for volatile fatty acid production from low strength wastewater in an anaerobic membrane bioreactor. Bioresour. Technol. 2019, 271, 100–108. [Google Scholar] [CrossRef]
  32. Seneesrisakul, K.; Jantaruksa, T.; Jiraprasertwong, A.; Pornmai, K.; Rangsunvigit, P.; Chavadej, S. Effects of the reactor volumetric ratio and recycle ratio on the methane and energy productivity of a three-step anaerobic sequencing batch reactor (3S-ASBR) treating ethanol wastewater. Energy 2021, 227, 120512. [Google Scholar] [CrossRef]
  33. Costa, J.M.; de Castro, K.C.; Rodriguez, R.P.; Sancinetti, G.P. Anaerobic reactors for the treatment of sulphate and metal-rich wastewater: A review. Int. J. Environ. Anal. Chem. 2020. [Google Scholar] [CrossRef]
  34. Chang, M.; Wang, Y.; Zhong, R.; Zhang, K.; Pan, Y.; Lyu, L.; Zhu, T. Performance of HABR + MSABP system for the treatment of dairy wastewater and analyses of microbial community structure and low excess sludge production. Bioresour. Technol. 2020, 311, 123576. [Google Scholar] [CrossRef]
  35. Mao, C.; Feng, Y.; Wang, X.; Ren, G. Review on research achievements of biogas from anaerobic digestion. Renew. Sust. Energ. Rev. 2015, 45, 540–555. [Google Scholar] [CrossRef]
  36. Atasoy, M.; Eyice, O.; Cetecioglu, Z. A comprehensive study of volatile fatty acids production from batch reactor to anaerobic sequencing batch reactor by using cheese processing wastewater. Bioresour. Technol. 2020, 311, 123529. [Google Scholar] [CrossRef] [PubMed]
  37. Menezes, O.; Brito, R.; Hallwass, F.; Florêncio, L.; Kato, M.T.; Gavazza, S. Coupling intermittent micro-aeration to anaerobic digestion improves tetra-azo dye Direct Black 22 treatment in sequencing batch reactors. Chem. Eng. Res. Des. 2019, 146, 369–378. [Google Scholar] [CrossRef]
  38. Franca, R.D.G.; Vieira, A.; Carvalho, G.; Oehmen, A.; Pinheiro, H.M.; Crespo, M.T.B.; Lourenco, N.D. Oerskovia paurometabola can efficiently decolorize azo dye Acid Red 14 and remove its recalcitrant metabolite. Ecotox. Environ. Safe. 2020, 191, 110007. [Google Scholar] [CrossRef] [PubMed]
  39. Wijetunga, S.; Li, X.; Jian, C. Effect of organic load on decolourization of textile wastewater containing acid dyes in upflow anaerobic sludge blanket reactor. J. Hazard. Mater. 2010, 177, 792–798. [Google Scholar] [CrossRef]
  40. Georgiou, G.; Metallinou, C.; Aivasidis, A.; Voudrias, E.; Gimouhopoulos, K. Decolorization of azo-reactive dyes and cotton-textile wastewater using anaerobic digestion and acetate-consuming bacteria. Biochem. Eng. J. 2004, 9, 75–79. [Google Scholar] [CrossRef]
  41. Liu, W.; You, Y.; Sun, D.; Wang, S.; Zhu, J.; Liu, C. Decolorization and detoxification of water-insoluble Sudan dye by Shewanella putrefaciens CN32 co-cultured with Bacillus circulans BWL1061. Ecotoxicol. Environ. Safe. 2018, 166, 11–17. [Google Scholar] [CrossRef]
  42. Xie, E.; Xu, X.; Luo, G. Study on a novel reactor of sludge process reduction for domestic sewage treatment. Environ. Technol. 2013, 34, 1593–1599. [Google Scholar]
  43. Liu, W.; Lian, J.; Guo, J.; Guo, Y.; Yue, L.; Niu, Y.; Duan, L. Perchlorate bioreduction by anaerobic granular sludge immobilised with FeHA complex: Performance, extracellular polymeric substances and microbial community structure. J. Hazard. Mater. 2020, 398, 122898. [Google Scholar] [CrossRef]
  44. Sun, X.; Liu, B.; Zhang, L.; Aketagawa, K.; Xue, B.; Ren, Y.; Bai, J.; Zhan, Y.; Chen, S.; Dong, B. Partial ozonation of returned sludge via high-concentration ozone to reduce excess sludge production: A pilot study. Sci. Total Environ. 2022, 807, 150773. [Google Scholar] [CrossRef] [PubMed]
  45. Liu, Z.; Wan, J.; Ma, Y.; Wang, Y. Online prediction of effluent COD in the anaerobic wastewater treatment system based on PCA-LSSVM algorithm. Environ. Sci. Pollut. Res. 2019, 26, 12828–12841. [Google Scholar] [CrossRef] [PubMed]
Figure 1. Schematic diagram of the anaerobic baffled reactor with packing in this study.
Fermentation 08 00099 g001
Figure 2. Variation of the (a) VFA concentration and (b) ratio of VFA to COD in the influent and effluent wastewater during the ABR operation period.
Fermentation 08 00099 g002
Figure 3. Variation of the alkalinity and pH of the influent and effluent wastewater during the ABR operation period. (a) shows the variation of alkalinity in the influent, Compartment 3 and effluent; (b) shows the variation of alkalinity in the influent and effluent.
Fermentation 08 00099 g003
Figure 4. Variation of colority of the influent and effluent wastewater during the ABR operation period.
Fermentation 08 00099 g004
Figure 5. Variation of the sludge activity in Compartments 1, 3 and 5 during the anaerobic reactor operation period.
Fermentation 08 00099 g005
Figure 6. Comparison between the experimental measurements and the predictions by the SVR on the COD removal rate during the reactor operation period. The regression mode was ν-SVR with linear kernel function in (a), and ε-SVR with RBF kernel function in (b), respectively.
Fermentation 08 00099 g006
Table 1. Quality of the wastewater entering the anaerobic reactor.
IndexCOD (mg/L)pHColority (Times)VFA (mmol/L)Alkalinity (mg/L)
Value670–12806.4–9.5220–3401.0–4.0570–1300
Table 2. Analytical methods for the investigated water quality indexes.
Water Quality IndexAnalytical MethodStandard Followed
Water temperatureThermometer methodChina national standard GB 13195-1991
pHGlass electrode methodChina national standard GB/T6920-1986
CODPotassium dichromate methodChina national standard GB 11914-1989
SSGravimetric methodChina trade standard CJ/T 51-2018
ColorityDilution multiple methodChina national standard GB 11903-1989
AlkalinityNeutralization-titration methodChina national standard GB/T 9736-2008
VFA 1Distillation-titration methodChina trade standard Q/YZJ10-03-02-2000
1 The unit is molarity (mmol/L) or mass concentration (mg/L) converted according to acetic acid.
Table 3. Performance of ν-SVR and ε-SVR with three types of kernel functions on the prediction of COD removal rate.
SVR TypeKernel Function TypeTrainingValidation
RMSE (%)R2RMSE (%)R2
ν-SVRLinear4.050.7014.770.737
RBF4.050.7004.880.737
Sigmoid4.090.6945.050.738
ε-SVRLinear4.270.6896.850.715
RBF4.270.6886.860.715
Sigmoid4.270.6886.890.715
Table 4. Optimized parameters of ν-SVR and ε-SVR with three types of kernel functions on the prediction of COD removal rate.
SVR TypeKernel Function TypeNumber of Support Vectorsνbc γ  
ν-SVRLinear340.696−0.1180.22-
RBF340.696−0.38421.110.0052
Sigmoid340.702−0.1292.640.109
SVR TypeKernel Function TypeNumber of Support Vectorsεbc γ
ε-SVRLinear250.214−0.1840.13-
RBF250.214−0.19348.500.0013
Sigmoid250.214−0.1843.030.041
Publisher’s Note: MDPI stays neutral with regard to jurisdictional claims in published maps and institutional affiliations.

