
Can Supplemented Skim Milk (SKM) Boost Your Gut Health?

 ,
,  ,
, 
Abstract
: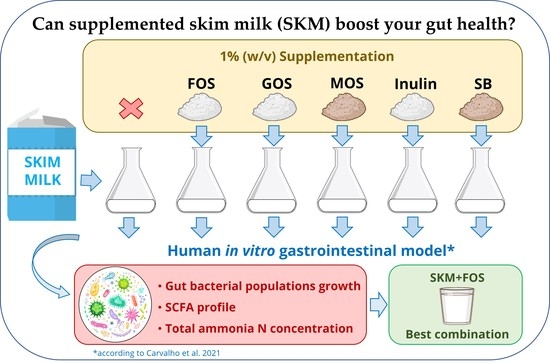
1. Introduction
2. Materials and Methods
2.1. Reagents/Chemicals and Apparatus
2.2. Preparation of Fecal Inoculum
2.3. Information Regarding the Fecal Donors
2.4. Human In Vitro Gastrointestinal Tract (GIT) Simulation Model
2.5. Bacterial Enumeration by Real-Time qPCR
2.6. Determination of Organic Acids Produced Throughout Fermentation
2.7. Measurement of Total Ammonia Nitrogen Concentration
2.8. Statistical Analysis
3. Results
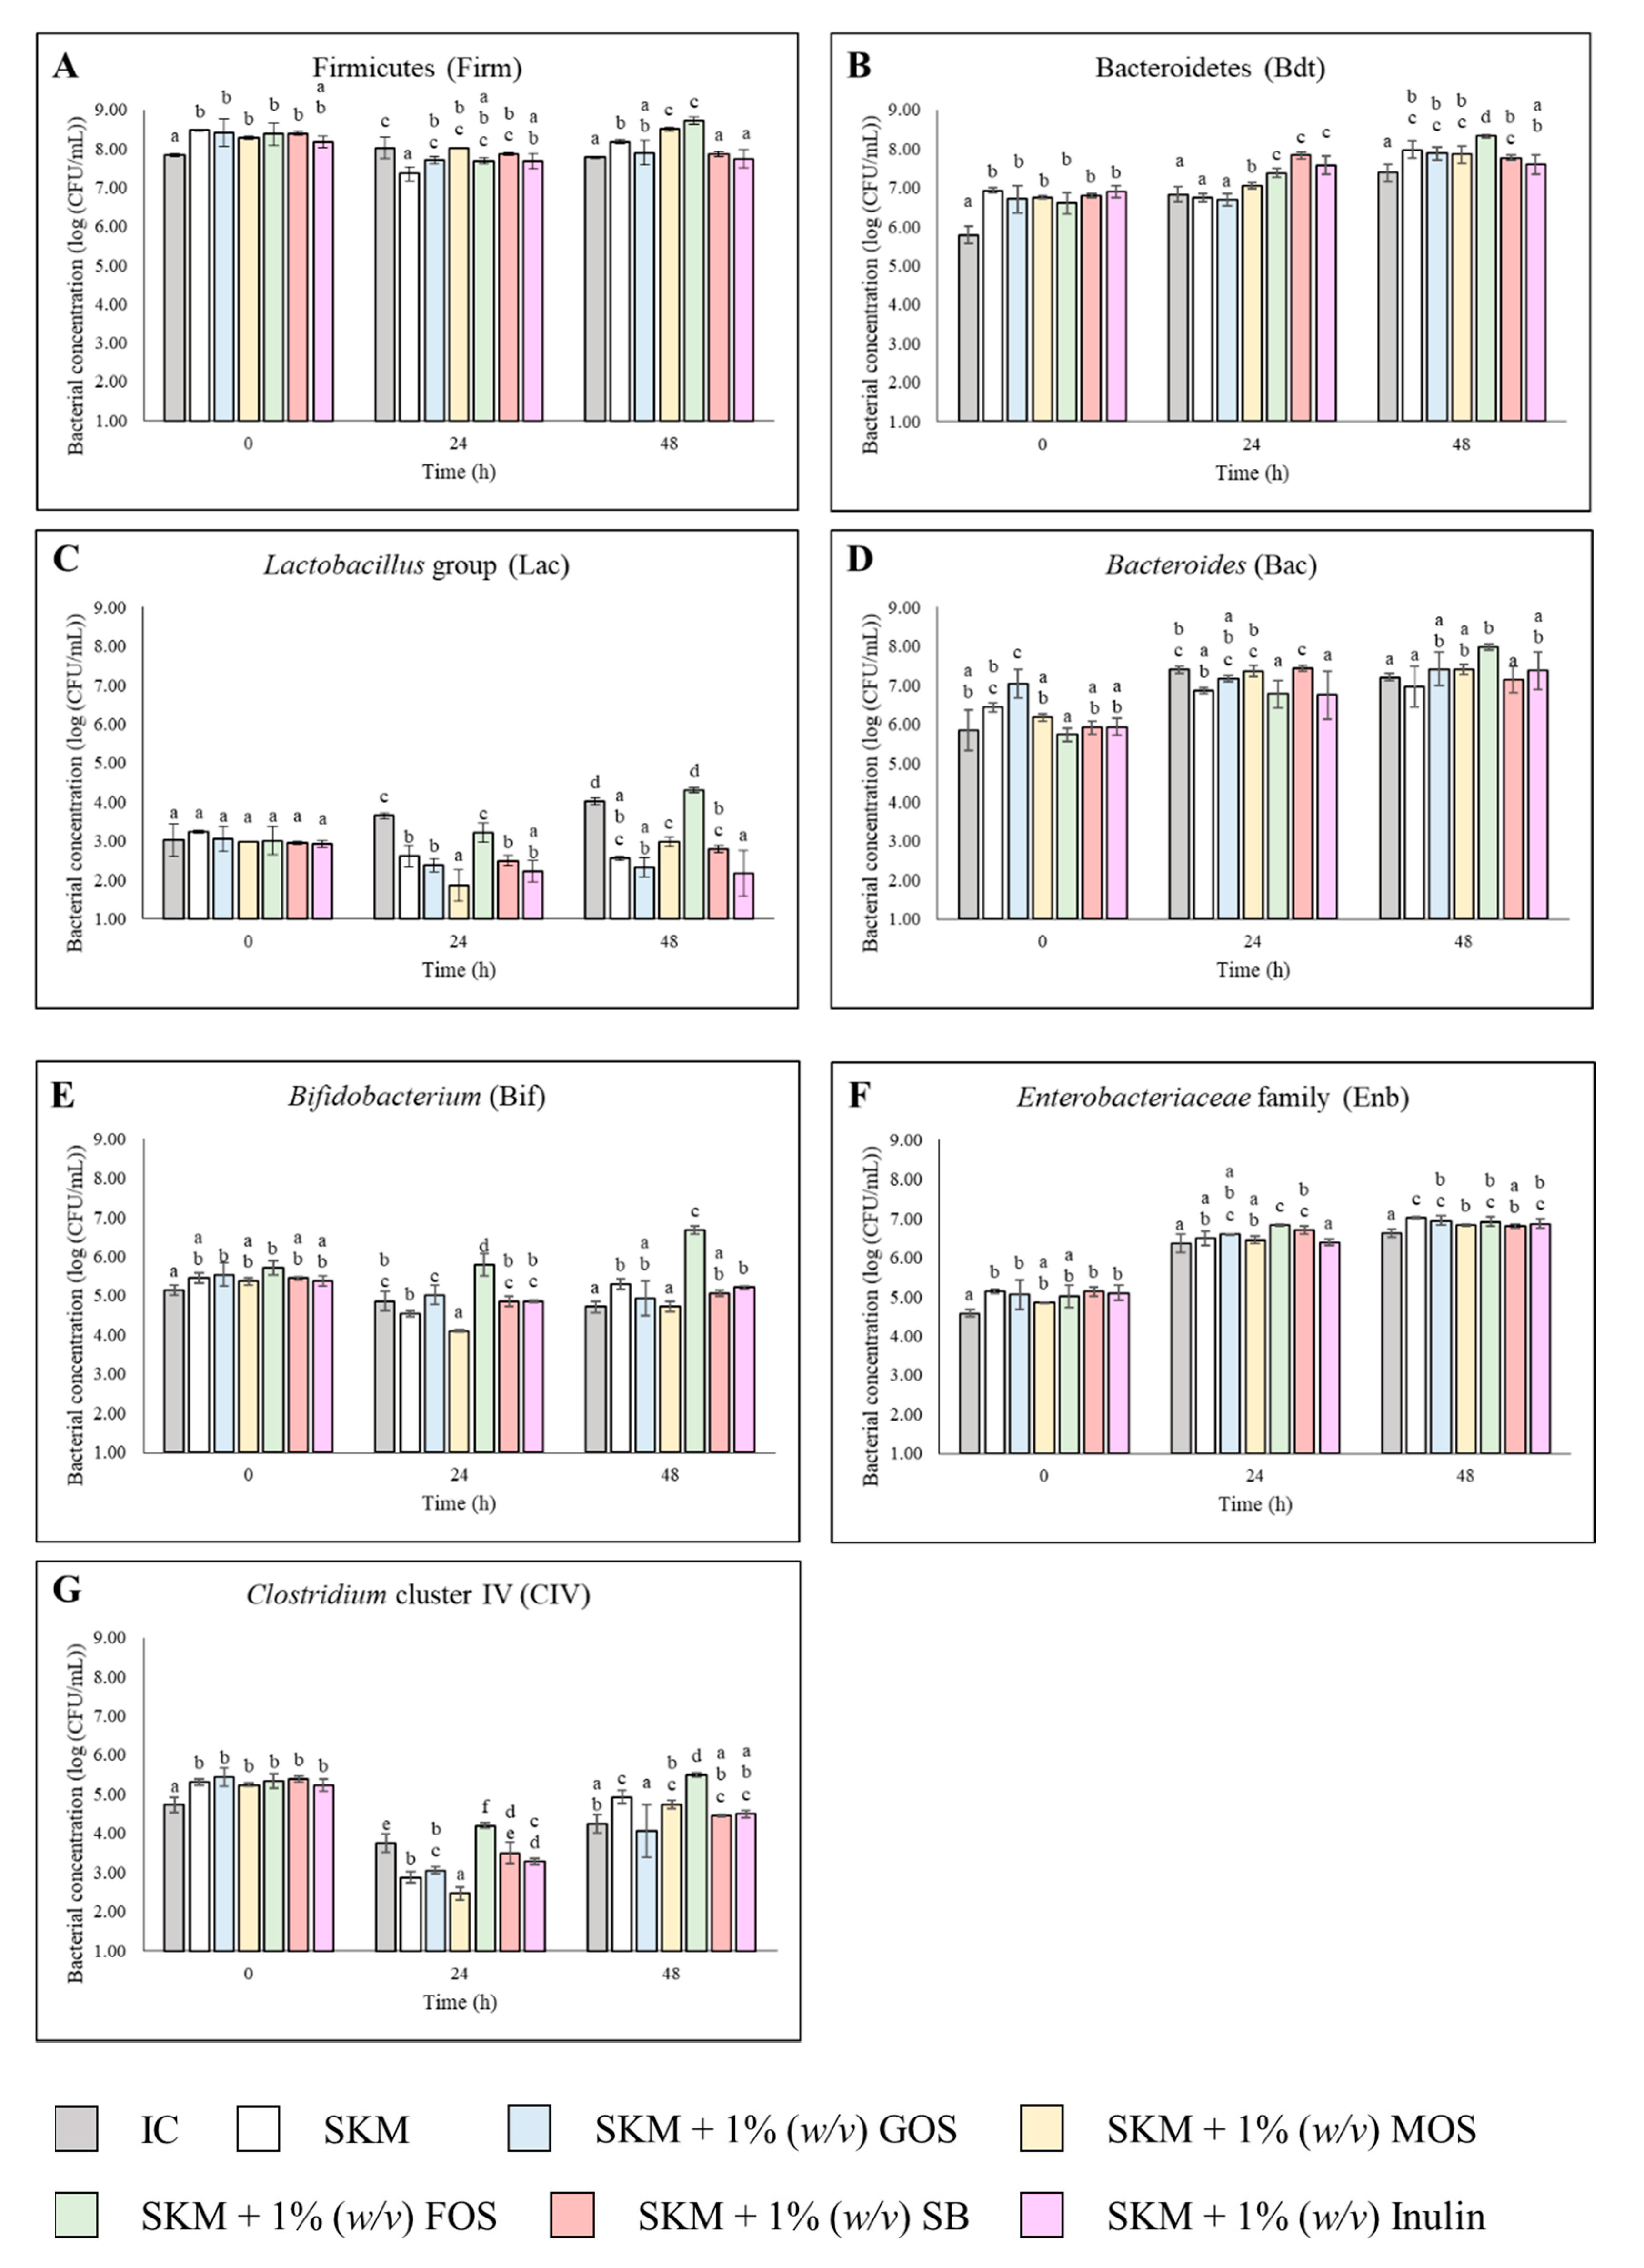
3.1. Bacterial Profile on the Fermentations
3.2. Colonic fermentations SCFA Profile
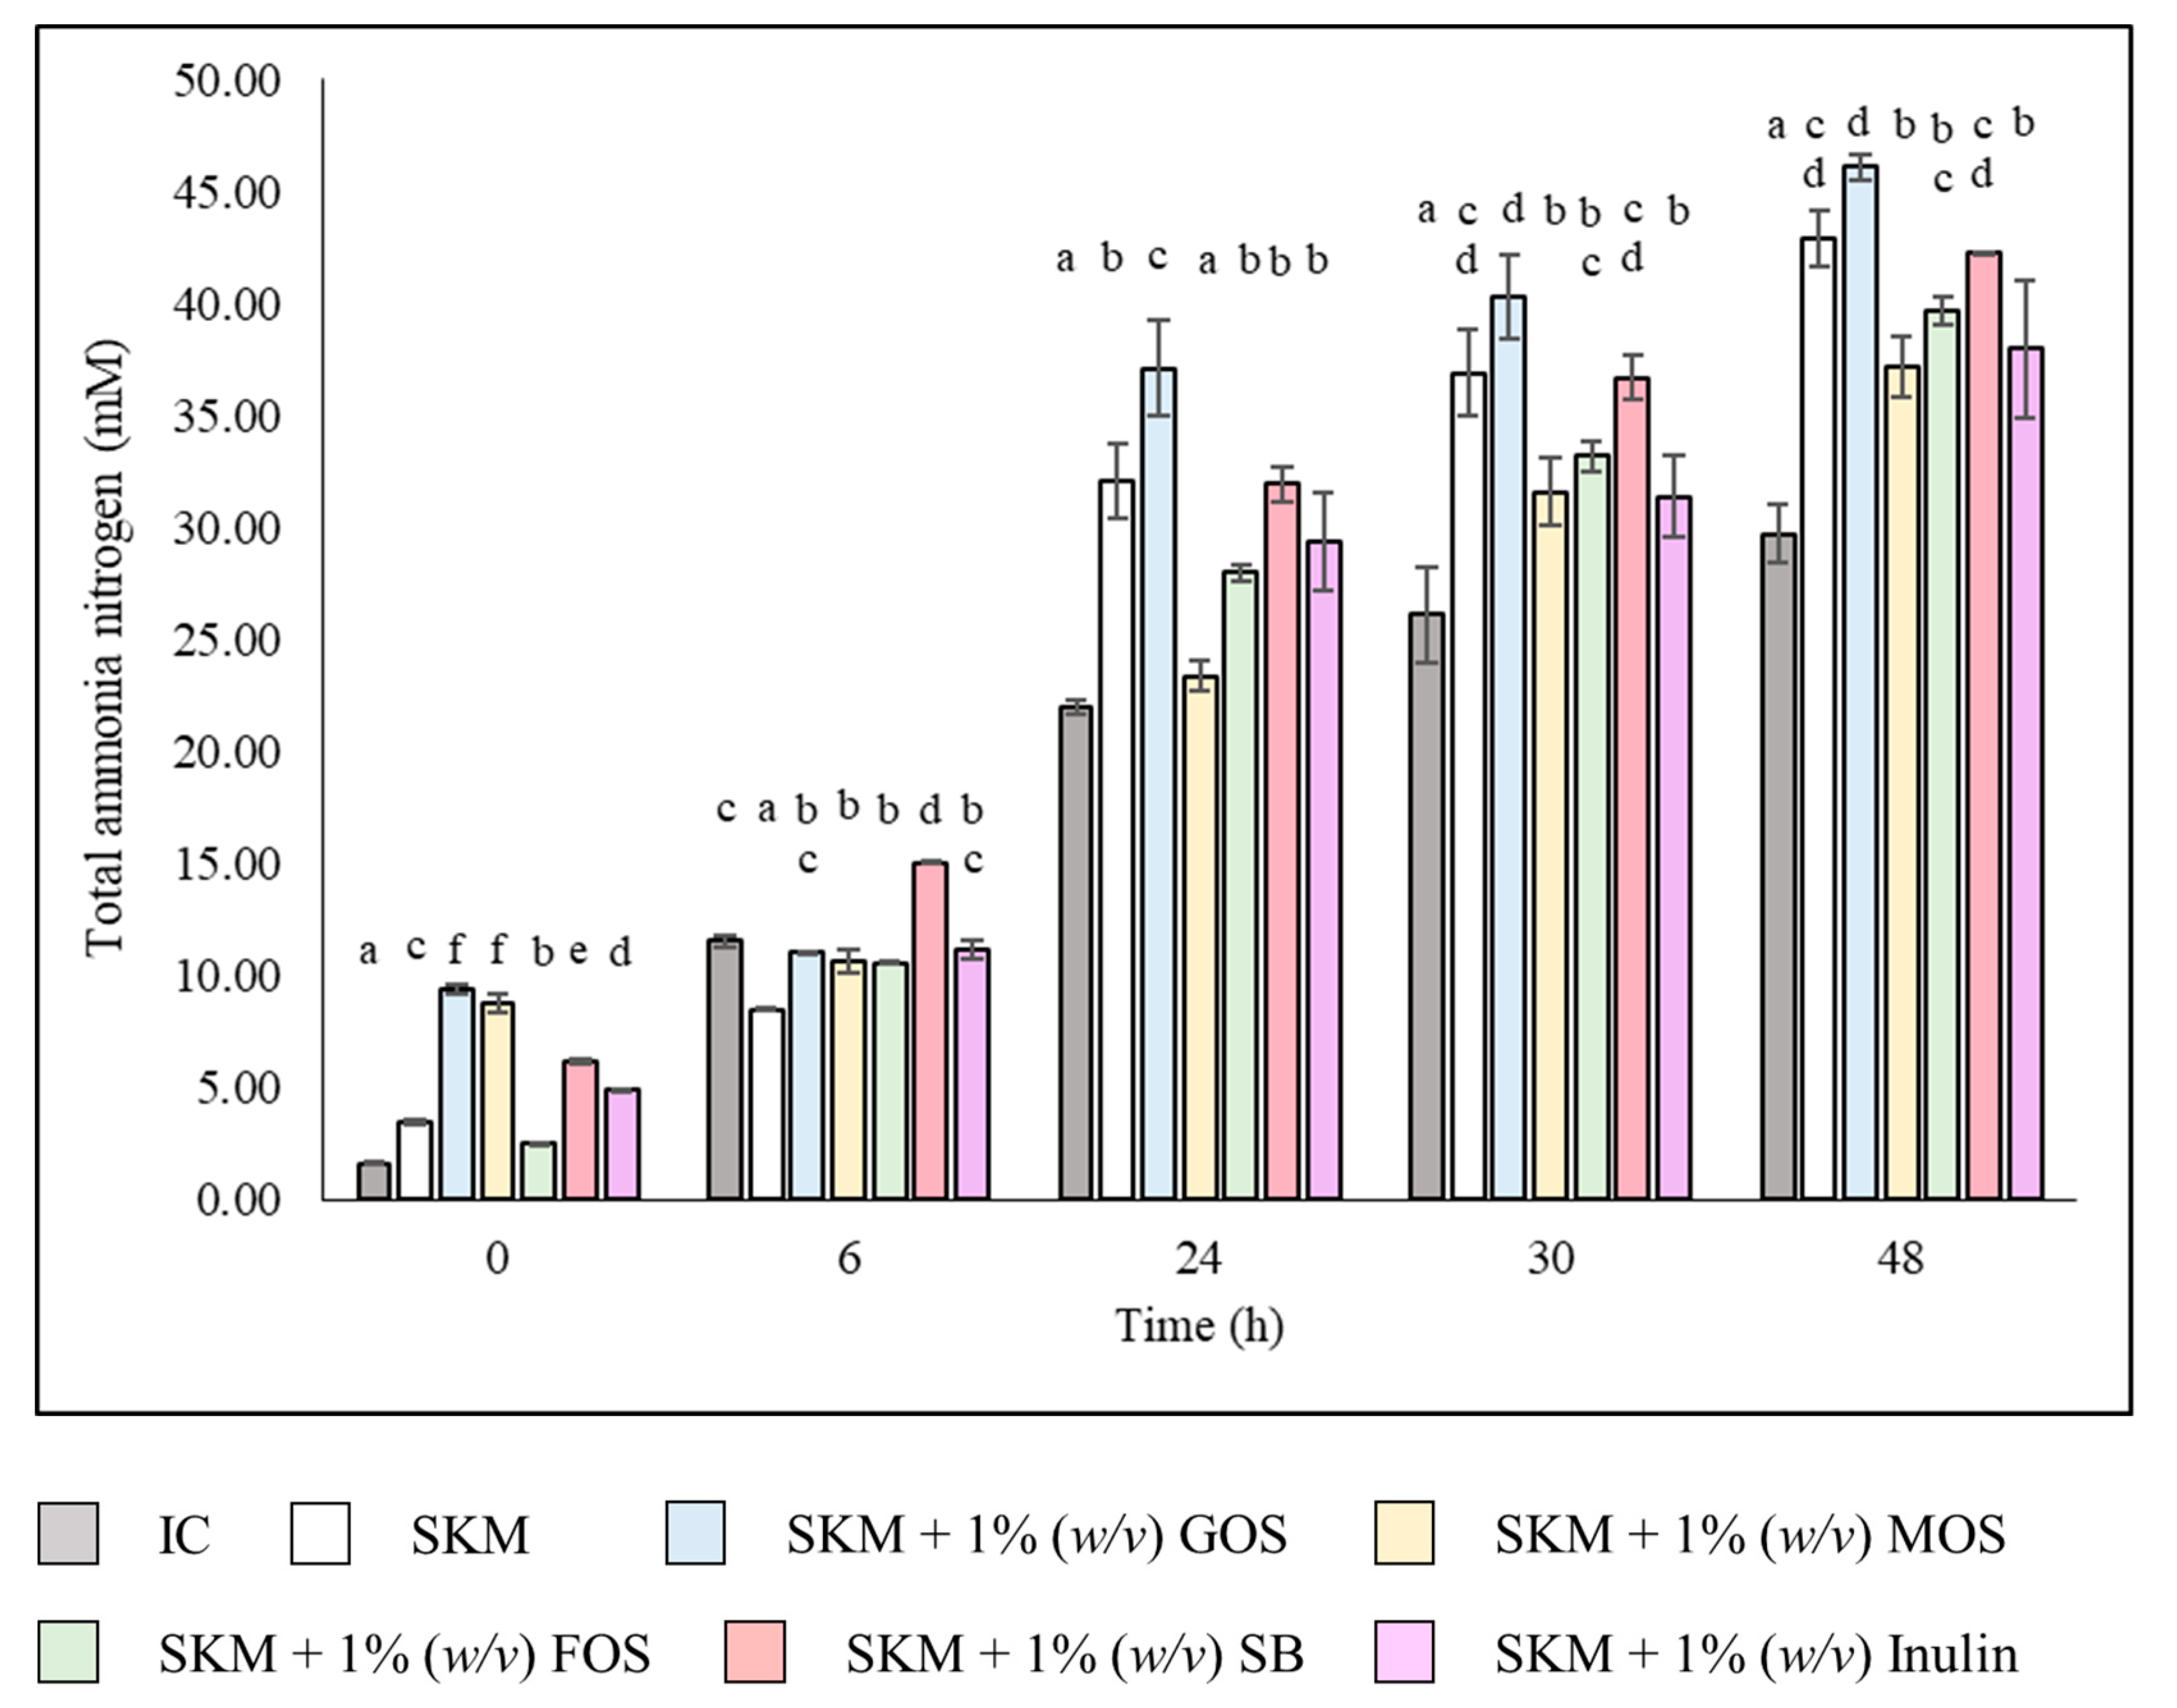
3.3. Colonic Fermentations Total Ammonia Nitrogen Profile
4. Discussion
5. Conclusions
Supplementary Materials
Author Contributions
Funding
Institutional Review Board Statement
Informed Consent Statement
Data Availability Statement
Acknowledgments
Conflicts of Interest
Appendix A. Materials and Methods
Appendix A.1. Reagents/Chemicals Used in This Study
- Acetic acid glacial (Sigma, St. Louis, MO, USA);
- Ammonium Carbonate—(NH4)2CO3 (Merck KGaA, Darmstadt, Germany);
- Bile bovine (Sigma, St. Louis, MO, USA);
- Bile salts (Sigma, St. Louis, MO, USA);
- Bile acid assay kit (Sigma, St. Louis, MO, USA);
- Bimuno daily (GOS) (Clasado Ltd., Reading, UK);
- Butyric acid (Sigma, St. Louis, MO, USA);
- Calcium chloride dihydrate—CaCl2(H2O)2 (Carlo Erba Reagents, Barcelona, Spain)
- Calcium chloride hexahydrate—CaCl2(H2O)6 (Sigma, St. Louis, MO, USA);
- Defibrinated sheep blood OxoidTM (Thermo Fischer Scientific, Waltham, MA, USA)
- Dipotassium hydrogen phosphate—K2HPO4 (Honeywell Fluka, Seelze, Germany);
- DL—lactic acid (Sigma, St. Louis, MO, USA);
- Fructooligosaccharides from chicory root (FOS) (Megazyme, Bray, Ireland);
- Glycerol—analytical grade (Fisher Scientific, Loughborough, UK);
- Hemin (Sigma, St. Louis, MO, USA);
- Hemoglobin (Sigma, St. Louis, MO, USA);
- Hydrochloric acid—HCl (Honeywell Fluka, Seelze, Germany);
- Inulin from chicory (Sigma-Aldrich, St. Louis, MO, USA);
- L-cysteine HCl (Sigma-Aldrich, St. Louis, MO, USA);
- Magnesium chloride hexahydrate—MgCl2(H2O)6 (Panreac, Barcelona, Spain);
- Magnesium sulfate heptahydrate—MgSO4(H2O)7 (Sigma, St. Louis, MO, USA);
- Molico skim milk powder—SKM (Nestlé S.A., Vevey, Switzerland);
- Na-p-tosyl-L-arginine methyl esther hydrochloride-TAME (Sigma, St. Louis, MO, USA);
- Ohly-GO® SoluMOS (Ohly, Hamburg, Germany);
- Pancreatin from porcine pancreas (Sigma, St. Louis, MO, USA);
- Pepsin from porcine gastric mucosa powder (Sigma, St. Louis, MO, USA);
- Peptone from animal tissue (Sigma, St. Louis, MO, USA);
- Phosphate buffered saline (Dulbecco A) OxoidTM (Thermo Fischer Scien-tific, Waltham, MA, USA);
- Potassium chloride—KCl (Honeywell Fluka, Seelze, Germany);
- Potassium dihydrogen phosphate—KH2PO4 (Merck KGaA, Darmstadt, Germany);
- Propionic acid (Sigma, St. Louis, MO, USA);
- Resazurin sodium salt (Sigma, St. Louis, MO, USA);
- Sodium chloride—NaCl (Honeywell Fluka, Seelze, Germany);
- Sodium hydrogen carbonate—NaHCO3 (Panreac, Barcelona, Spain);
- Sodium hydroxide—NaOH (LabChem, Zelienople, PA, USA);
- Sulfuric acid—H2SO4 (Honeywell Fluka, Seelze, Germany);
- Trichloroacetic acid—TCA (Sigma, St. Louis, MO, USA);
- Tris(hydroxymethyl)aminomethane hydrochloride (Merck KGaA, Darmstadt, Germany)
- Tween 80 (Sigma, St. Louis, MO, USA);
- UL-250® (Saccharomyces boulardii)(Biocodex, Gentilly, France);
- Vitamin K1 (Sigma, St. Louis, MO, USA);
- Yeast extract (Sigma, St. Louis, MO, USA).
Appendix A.2. Culture Media
- Columbia agar base—CBA (Liofilchem, Roseto degli Abruzzi, Italy);
- de Man, Rogosa and Sharpe agar—MRSA (Biokar Diagnostics, Allonne, France);
- MacConkey agar—MCA (Biolife, Milan, Italy);
- Muller-Hinton broth (Biokar diagnostics, Allonne, France);
- Tryptic soy broth (Biokar diagnostics, Allonne, France).
Appendix A.3. Apparatus Used in This Study
- 1 kDa molecular weight cut-off regenerated cellulose dialysis tubing Spec-tra/Por® 6 (Spectrum, New Brunswick, NJ, USA);
- Agilent 1260 II series HPLC (Agilent, Santa Clara, CA, USA);
- Alpha 2–4 LSC plus model (Martin Christ Gefriertrocknungsanlagen GmbH, Osterode am Harz, Germany);
- Anaerobic cabinet, Whitley A35 workstation (Don Whitley Scientific, Bingley, UK);
- FerMac 260 pH controller (Electrolab Biotech Ltd., Gloucestershire, UK);
- Heraeus™ Megafuge™ 16R Centrifuge (Thermo Fischer Scientific, Waltham, MA, USA)
- Ion-exclusion Aminex HPX-87H column (Biorad, Hercules, CA, USA);
- Mixwel® laboratory blender (Alliance Bio Expertise, Guipry, France);
- MR Hei-Tec magnetic stirrer (Heidolph Instruments GmbH & CO. KG, Schwabach, Germany)
- MST magnetic stirrer (Velp Scientifica, Usmate Velate, Italy)
- OxoidTM AnaeroGenTM 2.5 L sachet (Thermo Fischer Scientific, Waltham, CA, USA);
- OxoidTM AnaeroJarTM 2.5 L (Thermo Fischer Scientific, Waltham, CA, USA);
- Reax top vortex (Heidolph Instruments GmbH & CO. KG, Schwabach, Germany);
- Refrigerator Beko RSNE445E33WN (Beko, Istanbul, Turkey);
- Sension+ 9663 Ammonium Ion Selective Electrode (ISE) (Hach, CO, USA);
- Synergy H1 Hybrid Multi-Mode Reader (BioTek, Winooski, VT, USA);
- UV-1900 UV-VIS spectrophotometer (Shimadzu, Kyoto, Japan);
- Tamper proof specimen 1-L containers (Sigma, St. Louis, MO, USA).
References
- Oliveira, A.; Amaro, A.L.; Pintado, M. Impact of food matrix components on nutritional and functional properties of fruit-based products. Curr. Opin. Food Sci. 2018, 22, 153–159. [Google Scholar] [CrossRef]
- de Carvalho, N.M.; Madureira, A.R.; Pintado, M.E. The potential of insects as food sources—A review. Crit. Rev. Food Sci. Nutr. 2020, 60, 3642–3652. [Google Scholar] [CrossRef] [PubMed]
- Flint, H.J.; Scott, K.P.; Louis, P.; Duncan, S.H. The role of the gut microbiota in nutrition and health. Nat. Rev. Gastroenterol. Hepatol. 2012, 9, 577–589. [Google Scholar] [CrossRef] [PubMed]
- Zafar, H.; Saier, M.H., Jr. Gut Bacteroides species in health and disease. Gut Microbes 2021, 13, 1848158. [Google Scholar] [CrossRef] [PubMed]
- El Sohaimy, S.A. Functional foods and nutraceuticals-modern approach to food science. World Appl. Sci. J. 2012, 20, 691–708. [Google Scholar]
- Graf, D.; Di Cagno, R.; Fåk, F.; Flint, H.J.; Nyman, M.; Saarela, M.; Watzl, B. Contribution of diet to the composition of the human gut microbiota. Microb. Ecol. Health Dis. 2015, 26, 26164. [Google Scholar] [CrossRef]
- Carvalho, N.M.D.; Costa, E.M.; Silva, S.; Pimentel, L.; Fernandes, T.H.; Pintado, M.E. Fermented Foods and Beverages in Human Diet and Their Influence on Gut Microbiota and Health. Fermentation 2018, 4, 90. [Google Scholar] [CrossRef] [Green Version]
- Davani-Davari, D.; Negahdaripour, M.; Karimzadeh, I.; Seifan, M.; Mohkam, M.; Masoumi, S.J.; Berenjian, A.; Ghasemi, Y. Prebiotics: Definition, types, sources, mechanisms, and clinical applications. Foods 2019, 8, 92. [Google Scholar] [CrossRef] [Green Version]
- Anwar, H.; Iftikhar, A.; Muzaffar, H.; Almatroudi, A.; Allemailem, K.S.; Navaid, S.; Saleem, S.; Khurshid, M. Biodiversity of Gut Microbiota: Impact of Various Host and Environmental Factors. Biomed. Res. Int. 2021, 2021, 5575245. [Google Scholar] [CrossRef]
- Thursby, E.; Juge, N. Introduction to the human gut microbiota. Biochem. J. 2017, 474, 1823–1836. [Google Scholar] [CrossRef]
- Lopetuso, L.R.; Scaldaferri, F.; Petito, V.; Gasbarrini, A. Commensal Clostridia: Leading players in the maintenance of gut homeostasis. Gut Pathog. 2013, 5, 23. [Google Scholar] [CrossRef] [PubMed] [Green Version]
- Magne, F.; Gotteland, M.; Gauthier, L.; Zazueta, A.; Pesoa, S.; Navarrete, P.; Balamurugan, R. The Firmicutes/Bacteroidetes ratio: A relevant marker of gut dysbiosis in obese patients? Nutrients 2020, 12, 1474. [Google Scholar] [CrossRef] [PubMed]
- Kiousi, D.E.; Chorianopoulos, N.; Tassou, C.C.; Galanis, A. The Clash of Microbiomes: From the Food Matrix to the Host Gut. Microorganisms 2022, 10, 116. [Google Scholar] [CrossRef] [PubMed]
- Le Bastard, Q.; Chapelet, G.; Javaudin, F.; Lepelletier, D.; Batard, E.; Montassier, E. The effects of inulin on gut microbial composition: A systematic review of evidence from human studies. Eur. J. Clin. Microbiol. Infect. Dis. 2020, 39, 403–413. [Google Scholar] [CrossRef]
- Cunningham, M.; Azcarate-Peril, M.A.; Barnard, A.; Benoit, V.; Grimaldi, R.; Guyonnet, D.; Holscher, H.D.; Hunter, K.; Manurung, S.; Obis, D. Shaping the Future of Probiotics and Prebiotics. Trends Microbiol. 2021, 29, 667–685. [Google Scholar] [CrossRef]
- Ayyash, M.; Abdalla, A.; Alhammadi, A.; Ranadheera, C.S.; Baig, M.A.; Al-Ramadi, B.; Chen, G.; Kamal-Eldin, A.; Huppertz, T. Probiotic survival, biological functionality and untargeted metabolomics of the bioaccessible compounds in fermented camel and bovine milk after in vitro digestion. Food Chem. 2021, 363, 130243. [Google Scholar] [CrossRef]
- Hurtado-Romero, A.; Del Toro-Barbosa, M.; Garcia-Amezquita, L.E.; García-Cayuela, T. Innovative technologies for the production of food ingredients with prebiotic potential: Modifications, applications, and validation methods. Trends Food Sci. Technol. 2020, 104, 117–131. [Google Scholar] [CrossRef]
- Nehir El, S.; Simsek, S. Food echnological applications for optimal nutrition: An overview of opportunities for the food industry. Compr. Rev. Food Sci. Food Saf. 2012, 11, 2–12. [Google Scholar] [CrossRef]
- Zepeda-Hernández, A.; Garcia-Amezquita, L.E.; Requena, T.; García-Cayuela, T. Probiotics, prebiotics, and synbiotics added to dairy products: Uses and applications to manage type 2 diabetes. Food Res. Int. 2021, 142, 110208. [Google Scholar] [CrossRef]
- Kariyawasam, K.M.G.M.M.; Lee, N.-K.; Paik, H.-D. Fermented dairy products as delivery vehicles of novel probiotic strains isolated from traditional fermented Asian foods. J. Food Sci. Technol. 2021, 58, 2467–2478. [Google Scholar] [CrossRef]
- Rasika, D.M.D.; Vidanarachchi, J.K.; Luiz, S.F.; Azeredo, D.R.; Cruz, A.G.; Ranadheera, C.S. Probiotic Delivery through Non-Dairy Plant-Based Food Matrices. Agriculture 2021, 11, 599. [Google Scholar] [CrossRef]
- Smith, N.W.; Fletcher, A.J.; Hill, J.P.; McNabb, W.C. Modeling the Contribution of Milk to Global Nutrition. Front. Nutr. 2021, 8, 716100. [Google Scholar] [CrossRef] [PubMed]
- Scott, K.P.; Grimaldi, R.; Cunningham, M.; Sarbini, S.R.; Wijeyesekera, A.; Tang, M.L.K.; Lee, J.; Yau, Y.F.; Ansell, J.; Theis, S. Developments in understanding and applying prebiotics in research and practice—An ISAPP conference paper. J. Appl. Microbiol. 2020, 128, 934–949. [Google Scholar] [CrossRef] [PubMed]
- Shinn, L.M.; Li, Y.; Mansharamani, A.; Auvil, L.S.; Welge, M.E.; Bushell, C.; Khan, N.A.; Charron, C.S.; Novotny, J.A.; Baer, D.J. Fecal bacteria as biomarkers for predicting food intake in healthy adults. J. Nutr. 2021, 151, 423–433. [Google Scholar] [CrossRef]
- Amorim, C.; Silvério, S.C.; Cardoso, B.B.; Alves, J.I.; Pereira, M.A.; Rodrigues, L.R. In vitro fermentation of raffinose to unravel its potential as prebiotic ingredient. LWT 2020, 126, 109322. [Google Scholar] [CrossRef]
- Ashaolu, T.J.; Ashaolu, J.O.; Adeyeye, S.A.O. Fermentation of prebiotics by human colonic microbiota in vitro and short chain fatty acids production: A critical review. J. Appl. Microbiol. 2020, 130, 677–687. [Google Scholar] [CrossRef]
- Carvalho, N.M.D.; Oliveira, D.L.; Saleh, M.A.D.; Pintado, M.; Madureira, A.R. Preservation of Human Gut Microbiota Inoculums for In Vitro Fermentations Studies. Fermentation 2021, 7, 14. [Google Scholar] [CrossRef]
- Brodkorb, A.; Egger, L.; Alminger, M.; Alvito, P.; Assunção, R.; Ballance, S.; Bohn, T.; Bourlieu-Lacanal, C.; Boutrou, R.; Carrière, F. INFOGEST static in vitro simulation of gastrointestinal food digestion. Nat. Protoc. 2019, 14, 991–1014. [Google Scholar] [CrossRef]
- de Carvalho, N.M.; Walton, G.E.; Poveda, C.G.; Silva, S.N.; Amorim, M.; Madureira, A.R.; Pintado, M.E.; Gibson, G.R.; Jauregi, P. Study of in vitro digestion of Tenebrio molitor flour for evaluation of its impact on the human gut microbiota. J. Funct. Foods 2019, 59, 101–109. [Google Scholar] [CrossRef]
- Sánchez-Patán, F.; Cueva, C.; Monagas, M.; Walton, G.E.; Gibson, M.G.R.; Quintanilla-López, J.E.; Lebrón-Aguilar, R.; Martin-Alvarez, P.J.; Moreno-Arribas, M.V.; Bartolomé, B. In vitro fermentation of a red wine extract by human gut microbiota: Changes in microbial groups and formation of phenolic metabolites. J. Agric. Food Chem. 2012, 60, 2136–2147. [Google Scholar] [CrossRef]
- Queipo-Ortuño, M.I.; Seoane, L.M.; Murri, M.; Pardo, M.; Gomez-Zumaquero, J.M.; Cardona, F.; Casanueva, F.; Tinahones, F.J. Gut microbiota composition in male rat models under different nutritional status and physical activity and its association with serum leptin and ghrelin levels. PLoS ONE 2013, 8, e65465. [Google Scholar] [CrossRef] [PubMed]
- Heilig, H.G.H.J.; Zoetendal, E.G.; Vaughan, E.E.; Marteau, P.; Akkermans, A.D.L.; de Vos, W.M. Molecular diversity of Lactobacillus spp. and other lactic acid bacteria in the human intestine as determined by specific amplification of 16S ribosomal DNA. Appl. Environ. Microbiol. 2002, 68, 114–123. [Google Scholar] [CrossRef] [PubMed] [Green Version]
- Walter, J.; Hertel, C.; Tannock, G.W.; Lis, C.M.; Munro, K.; Hammes, W.P. Detection of Lactobacillus, Pediococcus, Leuconostoc, and Weissella species in human feces by using group-specific PCR primers and denaturing gradient gel electrophoresis. Appl. Environ. Microbiol. 2001, 67, 2578–2585. [Google Scholar] [CrossRef] [PubMed] [Green Version]
- Matsuki, T.; Watanabe, K.; Fujimoto, J.; Miyamoto, Y.; Takada, T.; Matsumoto, K.; Oyaizu, H.; Tanaka, R. Development of 16S rRNA-gene-targeted group-specific primers for the detection and identification of predominant bacteria in human feces. Appl. Environ. Microbiol. 2002, 68, 5445–5451. [Google Scholar] [CrossRef] [Green Version]
- Delroisse, J.-M.; Boulvin, A.-L.; Parmentier, I.; Dauphin, R.D.; Vandenbol, M.; Portetelle, D. Quantification of Bifidobacterium spp. and Lactobacillus spp. in rat fecal samples by real-time PCR. Microbiol. Res. 2008, 163, 663–670. [Google Scholar] [CrossRef]
- Bartosch, S.; Fite, A.; Macfarlane, G.T.; McMurdo, M.E.T. Characterization of bacterial communities in feces from healthy elderly volunteers and hospitalized elderly patients by using real-time PCR and effects of antibiotic treatment on the fecal microbiota. Appl. Environ. Microbiol. 2004, 70, 3575–3581. [Google Scholar] [CrossRef] [Green Version]
- Van Dyke, M.I.; McCarthy, A.J. Molecular biological detection and characterization of Clostridium populations in municipal landfill sites. Appl. Environ. Microbiol. 2002, 68, 2049–2053. [Google Scholar] [CrossRef] [Green Version]
- Wen, Y.; Mao, Y.; Kang, Z.; Luo, Q. Application of an ammonium ion-selective electrode for the real-time measurement of ammonia nitrogen based on pH and temperature compensation. Measurement 2019, 137, 98–101. [Google Scholar] [CrossRef]
- Guarner, F.; Malagelada, J.-R. Gut flora in health and disease. Lancet 2003, 361, 512–519. [Google Scholar] [CrossRef]
- Nechvatal, J.M.; Ram, J.L.; Basson, M.D.; Namprachan, P.; Niec, S.R.; Badsha, K.Z.; Matherly, L.H.; Majumdar, A.P.N.; Kato, I. Fecal collection, ambient preservation, and DNA extraction for PCR amplification of bacterial and human markers from human feces. J. Microbiol. Methods 2008, 72, 124–132. [Google Scholar] [CrossRef]
- Yasmin, A.; Butt, M.S.; Afzaal, M.; van Baak, M.; Nadeem, M.T.; Shahid, M.Z. Prebiotics, gut microbiota and metabolic risks: Unveiling the relationship. J. Funct. Foods 2015, 17, 189–201. [Google Scholar] [CrossRef]
- Markowiak, P.; Śliżewska, K. The role of probiotics, prebiotics and synbiotics in animal nutrition. Gut Pathog. 2018, 10, 21. [Google Scholar] [CrossRef] [PubMed]
- Azad, M.A.K.; Gao, J.; Ma, J.; Li, T.; Tan, B.; Huang, X.; Jie, Y. Opportunities of prebiotics for the intestinal health of monogastric animals. Anim. Nutr. 2020, 6, 379–388. [Google Scholar] [CrossRef] [PubMed]
- Yu, L.; Zhao, X.; Cheng, M.; Yang, G.; Wang, B.; Liu, H.; Hu, Y.; Zhu, L.; Zhang, S.; Xiao, Z. Saccharomyces boulardii administration changes gut microbiota and attenuates D-galactosamine-induced liver injury. Sci. Rep. 2017, 7, 1359. [Google Scholar] [CrossRef] [PubMed] [Green Version]
- Song, Q.; Wang, Y.; Huang, L.; Shen, M.; Yu, Y.; Yu, Q.; Chen, Y.; Xie, J. Review of the relationships among polysaccharides, gut microbiota, and human health. Food Res. Int. 2021, 140, 109858. [Google Scholar] [CrossRef] [PubMed]
- Macfarlane, G.T.; Macfarlane, S. Bacteria, colonic fermentation, and gastrointestinal health. J. AOAC Int. 2012, 95, 50–60. [Google Scholar] [CrossRef] [PubMed]
- Mariat, D.; Firmesse, O.; Levenez, F.; Guimarăes, V.D.; Sokol, H.; Doré, J.; Corthier, G.; Furet, J. The Firmicutes/Bacteroidetes ratio of the human microbiota changes with age. BMC Microbiol. 2009, 9, 123. [Google Scholar] [CrossRef]
- Dill-McFarland, K.A.; Tang, Z.-Z.; Kemis, J.H.; Kerby, R.L.; Chen, G.; Palloni, A.; Sorenson, T.; Rey, F.E.; Herd, P. Close social relationships correlate with human gut microbiota composition. Sci. Rep. 2019, 9, 703. [Google Scholar] [CrossRef] [Green Version]
- Zeb, F.; Wu, X.; Chen, L.; Fatima, S.; Chen, A.; Xu, C.; Jianglei, R.; Feng, Q.; Li, M. Time-restricted feeding is associated with changes in human gut microbiota related to nutrient intake. Nutrition 2020, 78, 110797. [Google Scholar] [CrossRef]
- Crovesy, L.; Masterson, D.; Rosado, E.L. Profile of the gut microbiota of adults with obesity: A systematic review. Eur. J. Clin. Nutr. 2020, 74, 1251–1262. [Google Scholar] [CrossRef]
- Conlon, M.A.; Bird, A.R. The impact of diet and lifestyle on gut microbiota and human health. Nutrients 2015, 7, 17–44. [Google Scholar] [CrossRef] [PubMed]
- Fujio-Vejar, S.; Vasquez, Y.; Morales, P.; Magne, F.; Vera-Wolf, P.; Ugalde, J.A.; Navarrete, P.; Gotteland, M. The gut microbiota of healthy chilean subjects reveals a high abundance of the phylum verrucomicrobia. Front. Microbiol. 2017, 8, 1221. [Google Scholar] [CrossRef] [PubMed] [Green Version]
- Yadav, S.; Jha, R. Strategies to modulate the intestinal microbiota and their effects on nutrient utilization, performance, and health of poultry. J. Anim. Sci. Biotechnol. 2019, 10, 2. [Google Scholar] [CrossRef]
- Zhu, N.; Wang, J.; Yu, L.; Zhang, Q.; Chen, K.; Liu, B. Modulation of growth performance and intestinal microbiota in chickens fed plant extracts or virginiamycin. Front. Microbiol. 2019, 10, 1333. [Google Scholar] [CrossRef]
- Matsuki, T.; Watanabe, K.; Fujimoto, J.; Takada, T.; Tanaka, R. Use of 16S rRNA gene-targeted group-specific primers for real-time PCR analysis of predominant bacteria in human feces. Appl. Environ. Microbiol. 2004, 70, 7220–7228. [Google Scholar] [CrossRef] [PubMed] [Green Version]
- Palaria, A.; Johnson-Kanda, I.; O’Sullivan, D.J. Effect of a synbiotic yogurt on levels of fecal bifidobacteria, clostridia, and enterobacteria. Appl. Environ. Microbiol. 2012, 78, 933–940. [Google Scholar] [CrossRef] [PubMed] [Green Version]
- Reuter, G. The Lactobacillus and Bifidobacterium microflora of the human intestine: Composition and succession. Curr. Issues Intest. Microbiol. 2001, 2, 43–53. [Google Scholar] [PubMed]
- Shinohara, K.; Ohashi, Y.; Kawasumi, K.; Terada, A.; Fujisawa, T. Effect of apple intake on fecal microbiota and metabolites in humans. Anaerobe 2010, 16, 510–515. [Google Scholar] [CrossRef]
- Aguirre, M. Fermentation of Indigestible Carbohydrates by the Gut Microbiota 2016. Ph.D. Thesis, Maastricht University, Maastricht, The Netherlands, 2016. [Google Scholar]
- Butler, M.I.; Bastiaanssen, T.F.S.; Long-Smith, C.; Berding, K.; Morkl, S.; Cusack, A.-M.; Strain, C.; Porteous-Allen, P.; Claesson, M.J.; Stanton, C. Recipe for a healthy gut: Intake of unpasteurised milk is associated with increased lactobacillus abundance in the human gut microbiome. Nutrients 2020, 12, 1468. [Google Scholar] [CrossRef]
- Aslam, H.; Marx, W.; Rocks, T.; Loughman, A.; Chandrasekaran, V.; Ruusunen, A.; Dawson, S.L.; West, M.; Mullarkey, E.; Pasco, J.A. The effects of dairy and dairy derivatives on the gut microbiota: A systematic literature review. Gut Microbes 2020, 12, 1799533. [Google Scholar] [CrossRef]
- Jost, T.; Lacroix, C.; Braegger, C.; Chassard, C. Impact of human milk bacteria and oligosaccharides on neonatal gut microbiota establishment and gut health. Nutr. Rev. 2015, 73, 426–437. [Google Scholar] [CrossRef]
- Singh, R.S.; Singh, R.P. Production of fructooligosaccharides from inulin by endoinulinases and their prebiotic potential. Food Technol. Biotechnol. 2010, 48, 435. [Google Scholar]
- Yang, P.; Zhao, J. Variations on gut health and energy metabolism in pigs and humans by intake of different dietary fibers. Food Sci. Nutr. 2021, 9, 4639–4654. [Google Scholar] [CrossRef] [PubMed]
- Zaher, S. Nutrition and the gut microbiome during critical illness: A new insight of nutritional therapy. Saudi J. Gastroenterol. Off. J. Saudi Gastroenterol. Assoc. 2020, 26, 290. [Google Scholar] [CrossRef]
- Aguirre, M.; Eck, A.; Koenen, M.E.; Savelkoul, P.H.M.; Budding, A.E.; Venema, K. Evaluation of an optimal preparation of human standardized fecal inocula for in vitro fermentation studies. J. Microbiol. Methods 2015, 117, 78–84. [Google Scholar] [CrossRef] [PubMed]
- Ríos-Covián, D.; Ruas-Madiedo, P.; Margolles, A.; Gueimonde, M.; De Los Reyes-gavilán, C.G.; Salazar, N. Intestinal short chain fatty acids and their link with diet and human health. Front. Microbiol. 2016, 7, 185. [Google Scholar] [CrossRef] [PubMed] [Green Version]
- Morrison, D.J.; Preston, T. Formation of short chain fatty acids by the gut microbiota and their impact on human metabolism. Gut Microbes 2016, 7, 189–200. [Google Scholar] [CrossRef] [Green Version]
- Silva, Y.P.; Bernardi, A.; Frozza, R.L. The role of short-chain fatty acids from gut microbiota in gut-brain communication. Front. Endocrinol. 2020, 11, 25. [Google Scholar] [CrossRef] [Green Version]
- Rowland, I.; Gibson, G.; Heinken, A.; Scott, K.; Swann, J.; Thiele, I.; Tuohy, K. Gut microbiota functions: Metabolism of nutrients and other food components. Eur. J. Nutr. 2018, 57, 1–24. [Google Scholar] [CrossRef] [Green Version]
- Den Besten, G.; van Eunen, K.; Groen, A.K.; Venema, K.; Reijngoud, D.-J.; Bakker, B.M. The role of short-chain fatty acids in the interplay between diet, gut microbiota, and host energy metabolism. J. Lipid Res. 2013, 54, 2325–2340. [Google Scholar] [CrossRef] [Green Version]
- Costabile, A.; Kolida, S.; Klinder, A.; Gietl, E.; Bäuerlein, M.; Frohberg, C.; Landschütze, V.; Gibson, G.R. A double-blind, placebo-controlled, cross-over study to establish the bifidogenic effect of a very-long-chain inulin extracted from globe artichoke (Cynara scolymus) in healthy human subjects. Br. J. Nutr. 2010, 104, 1007–1017. [Google Scholar] [CrossRef] [PubMed] [Green Version]
- Davis, L.M.G.; Martínez, I.; Walter, J.; Goin, C.; Hutkins, R.W. Barcoded pyrosequencing reveals that consumption of galactooligosaccharides results in a highly specific bifidogenic response in humans. PLoS ONE 2011, 6, e25200. [Google Scholar] [CrossRef] [PubMed] [Green Version]
- Kleessen, B.; Schwarz, S.; Boehm, A.; Fuhrmann, H.; Richter, A.; Henle, T.; Krueger, M. Jerusalem artichoke and chicory inulin in bakery products affect faecal microbiota of healthy volunteers. Br. J. Nutr. 2007, 98, 540–549. [Google Scholar] [CrossRef] [PubMed] [Green Version]
- Ramirez-Farias, C.; Slezak, K.; Fuller, Z.; Duncan, A.; Holtrop, G.; Louis, P. Effect of inulin on the human gut microbiota: Stimulation of Bifidobacterium adolescentis and Faecalibacterium prausnitzii. Br. J. Nutr. 2008, 101, 541–550. [Google Scholar] [CrossRef] [PubMed] [Green Version]
- Vulevic, J.; Juric, A.; Tzortzis, G.; Gibson, G.R. A mixture of trans-galactooligosaccharides reduces markers of metabolic syndrome and modulates the fecal microbiota and immune function of overweight adults. J. Nutr. 2013, 143, 324–331. [Google Scholar] [CrossRef]
- Aguirre, M.; Jonkers, D.M.A.E.; Troost, F.J.; Roeselers, G.; Venema, K. In vitro characterization of the impact of different substrates on metabolite production, energy extraction and composition of gut microbiota from lean and obese subjects. PLoS ONE 2014, 9, e113864. [Google Scholar] [CrossRef] [Green Version]
- Verbeke, K.A.; Boobis, A.R.; Chiodini, A.; Edwards, C.A.; Franck, A.; Kleerebezem, M.; Nauta, A.; Raes, J.; Van Tol, E.A.F.; Tuohy, K.M. Towards microbial fermentation metabolites as markers for health benefits of prebiotics. Nutr. Res. Rev. 2015, 28, 42–66. [Google Scholar] [CrossRef] [Green Version]
- Beards, E.; Tuohy, K.; Gibson, G. Bacterial, SCFA and gas profiles of a range of food ingredients following in vitro fermentation by human colonic microbiota. Anaerobe 2010, 16, 420–425. [Google Scholar] [CrossRef]
- Liu, Y.; Gibson, G.R.; Walton, G.E. An in vitro approach to study effects of prebiotics and probiotics on the faecal microbiota and selected immune parameters relevant to the elderly. PLoS ONE 2016, 11, e0162604. [Google Scholar] [CrossRef]
- Min, F.-F.; Hu, J.-L.; Nie, S.-P.; Xie, J.-H.; Xie, M.-Y. In vitro fermentation of the polysaccharides from Cyclocarya paliurus leaves by human fecal inoculums. Carbohydr. Polym. 2014, 112, 563–568. [Google Scholar] [CrossRef]
- Rodrigues, D.; Walton, G.; Sousa, S.; Rocha-Santos, T.A.P.; Duarte, A.C.; Freitas, A.C.; Gomes, A.M.P. In vitro fermentation and prebiotic potential of selected extracts from seaweeds and mushrooms. LWT 2016, 73, 131–139. [Google Scholar] [CrossRef]
- Korpela, K. Diet, Microbiota, and Metabolic Health: Trade-Off Between Saccharolytic and Proteolytic Fermentation. Annu. Rev. Food Sci. Technol. 2018, 9, 65–84. [Google Scholar] [CrossRef] [PubMed]
- De Preter, V.; Hamer, H.M.; Windey, K.; Verbeke, K. The impact of pre-and/or probiotics on human colonic metabolism: Does it affect human health? Mol. Nutr. Food Res. 2011, 55, 46–57. [Google Scholar] [CrossRef] [PubMed]
- Scott, K.P.; Gratz, S.W.; Sheridan, P.O.; Flint, H.J.; Duncan, S.H. The influence of diet on the gut microbiota. Pharmacol. Res. 2013, 69, 52–60. [Google Scholar] [CrossRef] [PubMed]
- Tan, J.; McKenzie, C.; Potamitis, M.; Thorburn, A.N.; Mackay, C.R.; Macia, L. The role of short-chain fatty acids in health and disease. In Advances in Immunology; Elsevier: Amsterdam, The Netherlands, 2014; Volume 121, pp. 91–119. ISBN 0065-2776. [Google Scholar]
- Krüger, D.; van der Werf, M. Benefits of Application of Yeast Cell Walls in Animal Husbandry. Available online: https://www.ohly.com/media/4393/benefits-of-application-of-yeast-cell-walls-in-animal-husbandry.pdf (accessed on 20 January 2022).
- Diether, N.E.; Willing, B.P. Microbial fermentation of dietary protein: An important factor in diet–microbe–host interaction. Microorganisms 2019, 7, 19. [Google Scholar] [CrossRef] [PubMed] [Green Version]
- Leschelle, X.; Robert, V.; Delpal, S.; Mouille, B.; Mayeur, C.; Martel, P.; Blachier, F. Isolation of pig colonic crypts for cytotoxic assay of luminal compounds: Effects of hydrogen sulfide, ammonia, and deoxycholic acid. Cell Biol. Toxicol. 2002, 18, 193–203. [Google Scholar] [CrossRef] [PubMed]
- Tsujii, M.; Kawano, S.; Tsuji, S.; Fusamoto, H.; Kamada, T.; Sato, N. Mechanism of gastric mucosal damage induced by ammonia. Gastroenterology 1992, 102, 1881–1888. [Google Scholar] [CrossRef]
- Slavin, J. Fiber and prebiotics: Mechanisms and health benefits. Nutrients 2013, 5, 1417–1435. [Google Scholar] [CrossRef] [Green Version]
- Jackson, M.I.; Jewell, D.E. Balance of saccharolysis and proteolysis underpins improvements in stool quality induced by adding a fiber bundle containing bound polyphenols to either hydrolyzed meat or grain-rich foods. Gut Microbes 2019, 10, 298–320. [Google Scholar] [CrossRef] [Green Version]
- Birkett, A.; Muir, J.; Phillips, J.; Jones, G.; O’Dea, K. Resistant starch lowers fecal concentrations of ammonia and phenols in humans. Am. J. Clin. Nutr. 1996, 63, 766–772. [Google Scholar] [CrossRef] [Green Version]
- Vince, A.J.; McNeil, N.I.; Wager, J.D.; Wrong, O.M. The effect of lactulose, pectin, arabinogalactan and cellulose on the production of organic acids and metabolism of ammonia by intestinal bacteria in a faecal incubation system. Br. J. Nutr. 1990, 63, 17–26. [Google Scholar] [CrossRef] [PubMed]
- Wang, X.; Gibson, G.R.; Sailer, M.; Theis, S.; Rastall, R.A. Prebiotics inhibit proteolysis by gut bacteria in a host diet-dependent manner: A three-stage continuous in vitro gut model experiment. Appl. Environ. Microbiol. 2020, 86, e02730-19. [Google Scholar] [CrossRef] [PubMed]
- Kumar, M.; Babaei, P.; Ji, B.; Nielsen, J. Human gut microbiota and healthy aging: Recent developments and future prospective. Nutr. Health Aging 2016, 4, 3–16. [Google Scholar] [CrossRef] [PubMed] [Green Version]
- David, L.A.; Maurice, C.F.; Carmody, R.N.; Gootenberg, D.B.; Button, J.E.; Wolfe, B.E.; Ling, A.V.; Devlin, A.S.; Varma, Y.; Fischbach, M.A. Diet rapidly and reproducibly alters the human gut microbiome. Nature 2014, 505, 559–563. [Google Scholar] [CrossRef] [Green Version]


| Donors Information | |||||||
|---|---|---|---|---|---|---|---|
| Donor | Genre | Height (m) | Weight (kg) | Age (years) | BMI (kg/m2) | Dairy Consumption | Regular Exercise |
| D1 | Female | 1.76 | 81 | 35 | 26.15 | Yes | Yes |
| D2 | Male | 1.82 | 97 | 25 | 29.37 | Yes | Yes |
| D3 | Female | 1.62 | 60 | 40 | 22.86 | Yes | Yes |
| D4 | Male | 1.68 | 72 | 32 | 25.51 | Yes | Yes |
| D5 | Female | 1.55 | 55 | 35 | 22.89 | Yes | Yes |
| Primer | Target Group or Organism | Genomic DNA Standard | Sequence (5′-3′) | Amplicon Size (bp) | Reference |
|---|---|---|---|---|---|
| Firm | Firmicutes | Lactobacillus gasseri DSM 20077 | F: ATGTGGTTTAATTCGAAGCA | 126 | [31] |
| R: AGCTGACGACAACCATGCAC | |||||
| Lac | Lactobacillus group | F: CACCGCTACACATGGAG | 341 | [32,33] | |
| R: AGCAGTAGGGAATCTTCCA | |||||
| Bdt | Bacteroidetes | Bacteroides intestinalis DSM 17393 | F: CATGTGGTTTAATTCGATGAT | 126 | [31] |
| R: AGCTGACGACAACCATGCAG | |||||
| Bac | Bacteroides | F: ATAGCCTTTCGAAAGRAAGAT | 501 | [34] | |
| R: CCAGTATCAACTGCAATTTTA | |||||
| Bif | Bifidobacterium | Bifidobacterium animalis ssp. lactis BB-12 DSM 15954 | F: CGCGTCYGGTGTGAAAG | 244 | [35] |
| R: CCCCACATCCAGCATCCA | |||||
| Enb | Enterobacteriaceae family | Salmonella enteritidis subsp. enterica ATCC 13076 | F: CATTGACGTTACCCGCAGAAGAAGC | 195 | [36] |
| R: CTCTACGAGACTCAAGCTTGC | |||||
| CIV | Clostridium cluster IV | Clostridium leptum DSM 753 | F: TTACTGGGTGTAAAGGG | 580 | [37] |
| R: TAGAGTGCTCTTGCGTA |
| Bacteria Monoculture | Media Broth | Media Agar | Incubation Conditions |
|---|---|---|---|
| Lactobacillus gasseri DSM 20077 | MRSB + 0.1% (w/v) cysteine | MRSA+ 0.1% (w/v) cysteine | Anaerobic 37 °C 2 days |
| Bacteroides intestinalis DSM 17393 | TSB+ 5% DSB | CBA + 5% (v/v) DSB | |
| Bifidobacterium animalis ssp. lactis BB-12 DSM 15954 | MRSB + 0.1% (w/v) cysteine | MRSA + 0.1% (w/v) cysteine | |
| Salmonella enteritidis subsp. enterica ATCC 13076 | MHB | MCA | |
| Clostridium leptum DSM 753 | PYMB | PYMA |
Publisher’s Note: MDPI stays neutral with regard to jurisdictional claims in published maps and institutional affiliations. |
© 2022 by the authors. Licensee MDPI, Basel, Switzerland. This article is an open access article distributed under the terms and conditions of the Creative Commons Attribution (CC BY) license (https://creativecommons.org/licenses/by/4.0/).
Share and Cite
de Carvalho, N.M.; Oliveira, D.L.; Costa, C.M.; Pintado, M.; Madureira, A.R. Can Supplemented Skim Milk (SKM) Boost Your Gut Health? Fermentation 2022, 8, 126. https://doi.org/10.3390/fermentation8030126
de Carvalho NM, Oliveira DL, Costa CM, Pintado M, Madureira AR. Can Supplemented Skim Milk (SKM) Boost Your Gut Health? Fermentation. 2022; 8(3):126. https://doi.org/10.3390/fermentation8030126
Chicago/Turabian Stylede Carvalho, Nelson Mota, Diana Luazi Oliveira, Célia Maria Costa, Manuela Pintado, and Ana Raquel Madureira. 2022. "Can Supplemented Skim Milk (SKM) Boost Your Gut Health?" Fermentation 8, no. 3: 126. https://doi.org/10.3390/fermentation8030126