Article

Valorization of a Pyrolytic Aqueous Condensate and Its Main Components for L-Malic Acid Production with Aspergillus oryzae DSM 1863

by
Christin Kubisch
* and
Katrin Ochsenreither
Institute of Process Engineering in Life Sciences 2-Technical Biology, Karlsruhe Institute of Technology (KIT), Fritz-Haber-Weg 4, 76131 Karlsruhe, Germany
*
Author to whom correspondence should be addressed.
Fermentation 2022, 8(3), 107; https://doi.org/10.3390/fermentation8030107
Submission received: 17 February 2022 / Revised: 25 February 2022 / Accepted: 28 February 2022 / Published: 28 February 2022
(This article belongs to the Special Issue Organic Waste Valorization into Added-Value Products)

Abstract

:
Pyrolytic aqueous condensate (PAC) might serve as a cost-effective substrate for microbial malic acid production, as it is an unused side stream of the fast pyrolysis of lignocellulosic biomass that contains acetol and acetate as potential carbon sources. In the present study, shake flask cultures were performed to evaluate the suitability of acetol and its combination with acetate as substrates for growth and L-malate production with the filamentous fungus Aspergillus oryzae. Acetol concentrations of up to 40 g/L were shown to be utilized for fungal growth. In combination with acetate, co-metabolization of both substrates for biomass and malate formation was observed, although the maximum tolerated acetol concentration decreased to 20 g/L. Furthermore, malate production on PAC detoxified by a combination of rotary evaporation, overliming and activated carbon treatment was studied. In shake flasks, cultivation using 100% PAC resulted in the production of 3.37 ± 0.61 g/L malate, which was considerably improved by pH adjustment up to 9.77 ± 0.55 g/L. A successful scale-up to 0.5-L bioreactors was conducted, achieving comparable yields and productivities to the shake flask cultures. Accordingly, fungal malate production using PAC was successfully demonstrated, paving the way for a bio-based production of the acid.

1. Introduction

Malic acid is a dicarboxylic acid used primarily as an acidulant and flavor enhancer in the food and beverage industry, but it can also be applied as an ingredient in cosmetics and pharmaceuticals [1,2,3,4], as well as in animal feed [5,6,7]. Another potential field of application, which could become increasingly important in the future, is its use in the production of biopolymers [8,9]. Due to its dicarboxylic nature, it also possesses the potential to be converted into a number of high-value chemicals, and was therefore selected in 2004 by the U.S. Department of Energy as one of the top twelve building block chemicals that can be derived from biomass [10]. Although biological production of malic acid is possible, it is currently produced largely by chemical synthesis using maleic anhydride as a starting material, which in turn is obtained by vapor-phase oxidation of fossil hydrocarbons like butane and benzene [11]. Bio-based alternatives to chemical synthesis include enzymatic conversion of fumaric acid to malic acid [12,13,14,15] and microbial fermentation processes. Since malic acid is an intermediate of the tricarboxylic acid (TCA) cycle and thus an essential component of the metabolism in aerobic cells, many microorganisms are naturally capable of producing this acid, or can be enabled to do so by metabolic engineering [16]. Among the natural producers, fungal organisms of the genera Rhizopus [17], Ustilago [18,19], and Aspergillus [20,21] have proven to be particularly efficient. Moreover, especially for species of the latter genus, it has already been shown that they are capable of using a wide range of substrates for malate formation [22,23,24,25,26]. Identifying cost-effective alternatives to the utilization of edible sugars such as glucose is an important step in making microbial malic acid production more economically competitive with conventional fossil-based processes. Unexploited lignocellulose-based residues are particularly suitable for this purpose, as the polymer is the world’s most abundant renewable resource and is therefore readily available and inexpensive. In addition, its use does not create any competition with food and feed industries.
One such residue is the aqueous condensate produced during the fast pyrolysis of wheat straw as the first part of the bioliq® process performed at the Karlsruhe Institute of Technology, Germany (KIT) [27]. While the desired energy-rich products, namely pyrolysis oil and char, are mixed together to form biosyncrude and then further processed into liquid fuels by gasification, the aqueous condensate currently remains largely unused due to its low heating value. The main components of the condensate are the α-hydroxylated ketone acetol (approx. 5 wt %) and acetic acid (3–4 wt %). While acetol (hydroxyacetone) is considered to be one of the major oxygenated C2–4 products resulting from the degradation of cellulose (possible pathways are described in [28,29]), acetate is primarily formed by deacetylation of hemicellulose. For the latter, it is already known that several microorganisms are naturally capable of using it as sole substrate for growth [30,31]. Metabolization of acetate occurs via acetyl-CoA and the TCA cycle and thus offers many possibilities for production of several value-added bioproducts, such as malic acid [32]. For example, it was recently shown that Aspergillus oryzae is able to use high acetate concentrations of up to 55 g/L for malate production, with 45 g/L being ideal and resulting in the formation of 8.44 ± 0.42 g/L malate after 192 h [33]. In contrast, the utilization of acetol by the fungus has not yet been described in literature. Instead, previous work mainly addressed its inhibitory effect on growth and malic acid production when added to glucose-containing media [34]. There is also little information on the use of the ketone as substrates for other microorganisms, although a few studies show that it seems to be possible in some bacteria [35] and yeasts [36]. However, in addition to the two main components, the PAC contains a variety of other compounds (detailed GC/MS analysis contained in [37]) and some of them may have an inhibitory effect on the growth of microorganisms, so that detoxification is usually required before the microbial valorization of the condensate. In a previous work, we were able to establish a method that allows the use of the condensate from the bioliq® process as the sole substrate for the growth of A. oryzae by a combination of rotary evaporation, overliming, and a subsequent activated carbon treatment [37]. However, during this detoxification procedure and the associated removal of inhibitory substances, the content of acetol was also reduced to 2.96 g/L, while the concentration of acetate remained largely unchanged.
Therefore, the first objective of the present studies was to investigate whether the removal of the ketone is actually necessary or whether the treatment implies the loss of a potential substrate for growth and acid production with Aspergillus oryzae. For this purpose, shake flask cultures were performed with acetol as the sole C-source as well as in mixtures with acetate in order to mimic the PAC composition. Subsequently, the fungal acid production was investigated using the authentic detoxified condensate, and the scalability of the process to bioreactors was evaluated after successful pH optimization.

2. Materials and Methods

2.1. Microorganism

Aspergillus oryzae DSM 1863 was obtained from the DSMZ German Collection of Microorganisms and Cell Cultures (Deutsche Sammlung von Mikroorganismen und Zellkulturen GmbH, Braunschweig, Germany).

2.2. Media and Cultivation Conditions

Malic acid production with A. oryzae is a two-step process, in which biomass growth and acid formation are decoupled from each other. First, a preculture is inoculated by adding spore suspension, and the cultures are then incubated until a sufficient amount of biomass is formed. After filtration and thorough washing with sterile ultrapure water, the biomass is transferred to the main culture medium, which is characterized by a reduced nitrogen concentration to stimulate acid formation. In addition, CaCO3 is added to the main cultures as pH buffering agent and for CO2 supply.

2.2.1. Preparation of the Spore Solution

For the preparation of glycerol stocks of A. oryzae conidia the fungus was grown on minimal medium according to Barratt et al. containing 10 g/L glucose, 6 g/L NaNO3, 0.52 g/L KCl, 0.52 g/L MgSO4·7H2O, and 1.52 g/L KH2PO4 [38] and 2 mL/L 1000 × Hutner’s Trace Elements. The pH of the medium was adjusted to 6.5 using NaOH and 20 g/L agar were added immediately before sterilization for 20 min at 121 °C. The 1000 × Hutner’s Trace Element solution contains 5 g/L FeSO4·7H2O, 50 g/L EDTA-Na2, 22 g/L ZnSO4·7H2O, 11 g/L H3BO3, 5 g/L MnCl2·4H2O, 1.6 g/L CoCl2·6H2O, 1.6 g/L CuSO4·5H2O, and 1.1 g/L (NH4)6Mo7O24·4H2O, pH 6.5 [39]. After incubation at 30 °C for 7 days, spores were harvested by suspension in 50% glycerol and filtered through a sterile Miracloth (Merck KGaA, Darmstadt, Germany). The final concentration of the suspension was adjusted to 3 × 10⁷ spores/mL. Aliquots were prepared and stored at −80 °C until use.

2.2.2. Preculture Cultivations for Biomass Formation

The medium for the preculture cultivations in shake flask consisted of 4 g/L (NH4)2SO4, 0.75 g/L KH2PO4, 0.98 g/L K2HPO4, 0.1 g/L MgSO4·7H2O, 0.1 g/L CaCl2·2H2O, 5 mg/L NaCl, 5 mg/L FeSO4·7H2O [22] and 2 mL/L Hutner’s Trace Element solution. For the growth test with acetol as sole C-source, the medium was first prepared as 2× concentrated stock solution and then diluted to 1× concentration by adding ultrapure water and the volume of ketone required to obtain final concentrations of 3 g/L; 5 g/L, 10 g/L, 20 g/L, 30 g/L, 40 g/L and 50 g/L acetol. After autoclaving for 20 min at 121 °C, the pH of the media was sterilely adjusted to 6.5 with 10 M NaOH. Similarly, for the media containing mixtures of acetate and acetol, a 2× concentrated acetic acid solution was first prepared with the aforementioned media constituents and filled up to 1× concentration with ultrapure water and 0–40 g/L acetol. The pH of the media was adjusted to a value of 7 prior to autoclaving, but was also readjusted afterwards with 10 M NaOH if necessary. All preculture experiments were performed in 500 mL baffled shake flasks, each filled with 100 mL of medium and 1 mL of a 10 vol-% Tween® 80 solution to prevent fungal growth on the flask walls. For inoculation, 1 mL of spore solution (c = 3 × 10⁷ spores/mL) was added to each flask and the cultures were then incubated at 30 °C and 100 rpm for 96 h. Samples of 1.9 mL were taken daily to measure substrate consumption and pH change, and the remaining culture broth was then used for determination of cell dry weight (CDW). All experiments were performed as biological triplicates.

2.2.3. Precultures for Main Culture Inoculation

Precultures were not only needed to study fungal growth, but also to inoculate main cultures for malic acid production. For all main culture experiments with detoxified PAC, the condensate was also used as the sole C-source in the precultures. To prepare the corresponding preculture medium, the components were dissolved in the pyrolysis condensate, and the medium was sterile filtered through a bottle top filter (Nalgene Rapid-Flow, PES, pore size 0.2 µm, Thermo Scientific (Waltham, MA, USA)) to prevent its composition from being altered by the heat of autoclaving. The biomass for all main culture experiments with acetate, i.e., for the mixtures with acetol in the shake flask as well as for the bioreactor fermentations, was grown in precultures containing 40 g/L acetate as the sole substrate. Generally, the same cultivation conditions were used as in the growth experiments, but no sampling was performed and the cultivation time was shortened to 48 h to allow transfer of the cells to the main culture in their exponential growth phase.

2.2.4. Main Culture for Malic Acid Production in Shake Flasks

In general, all main culture media were composed of 1.2 g/L (NH4)2SO4, 0.1 g/L KH2PO4, 0.17 g/L K2HPO4, 0.1 g/L MgSO4·7H2O, 0.1 g/L CaCl2·2H2O, 5 mg/L NaCl, and 60 mg/L FeSO4·7H2O. As in the corresponding growth experiment, the medium for the main cultures with mixtures of 40 g/L acetate and 3–20 g/L acetol was first prepared without the ketone at 2× concentration and adjusted to a pH of 5.5 with NaOH pellets. After diluting the medium to 1× concentration with ultrapure water and acetol, the medium was autoclaved at 121 °C for 20 min. In contrast, for all main cultures on PAC, the medium was sterile filtered after dissolving the above components in the condensate. Whereas in the first PAC cultivation the pH of the medium was not adjusted and was measured to be 6.5, for the experiment on the effect of the initial medium pH on malic acid production, the pH was lowered to a value of 5.5 before sterile filtration using 96% H2SO4 or 100% acetic acid. Similar to the precultures, the main cultures were performed at 100 mL scale in 500 mL baffled flasks, but an additional 90 g/L of CaCO3 was added to each flask. Inoculation of the flasks was performed by weighing 0.75 g of filtered (Miracloth) and thoroughly washed biomass from the corresponding precultures into each flask. The cultures were incubated for 240 h at 32 °C and 120 rpm and samples of 4 mL were taken every 48 h for determination of the substrate consumption, product formation, and pH-value. All experiments were performed as biological quadruplicates.

2.2.5. Bioreactor Cultivations for Malate Production

Four parallel A. oryzae batch fermentations were performed in the sixfors bioreactor (Infors AG Switzerland), a multi-fermenter system that allows for simultaneous cultivation in up to six 500 mL vessels. Each vessel can be controlled independently via a shared control unit equipped with IRIS software for online monitoring of the cultivation parameters. The media for the bioreactor cultures consisted of the same components already listed in the section on the main culture experiments in shake flasks. To prepare the medium for the control reactors, these components were added to a solution of 40 g/L acetic acid and the mixture was adjusted to a pH of 5.5 with NaOH pellets. A volume of 350 mL of the medium was added to each of the reactors, which was then autoclaved at 121 °C for 20 min. As in the shake flask experiments, the medium containing PAC was sterilized via filtration and 350 mL of the medium was filled into each of the previously autoclaved reactors. A concentration of 90 g/L CaCO3 was added sterilely to all four bioreactors. For inoculation, the contents of two preculture flasks were filtered together through a Miracloth filter, washed thoroughly with sterile ultrapure water and resuspended in 50 mL of the corresponding sterile main culture medium. The suspension was added to the bioreactor, resulting in a final working volume of 400 mL. Throughout the fermentation, the temperature and stirrer speed were kept constant at 32 °C and 800 rpm, respectively, and aeration was performed at a rate of 10 L/h. Immediately after the start of aeration, 0.1 mL of antifoam solution (Contraspum A 4050 HAC (Zschimmer und Schwarz GmbH und Co. KG, Lahnstein, Germany)) was added sterilely to each reactor to counteract foam formation. Despite online pH monitoring, pH adjustment to a value <7.5 with 72% H2SO4 was performed manually on a daily basis starting at a cultivation time of 72 h. The total cultivation time was 144 h and sterile sampling of 4 mL from each reactor was performed once a day to quantify substrate consumption and product formation. Fermentations were conducted as biological duplicates.

2.3. Formation and Detoxification of the PAC

The PAC used in this work was formed in the second condensation step of the fast pyrolysis, which represents the first part of the bioliq® process performed at KIT [27]. Prior to its utilization as substrate in fungal fermentations, the PAC was detoxified by rotary evaporation, overliming and a subsequent activated carbon treatment [37]. At the beginning of the detoxification procedure, the pH of the PAC was set to 6.5 using NaOH pellets. The forming precipitate was separated via centrifugation at 4700× g for 10 min and the supernatant was filtered using a paper filter (type MN615, cellulose, Macherey-Nagel (Düren, Germany)). For the rotary evaporation, the PAC was heated to 80 °C in an oil bath under constant rotation at 90 rpm. The pressure was gradually reduced to 200 mbar and held for 4 h. After evaporation the PAC was refilled with ultrapure water to the initial volume to prevent concentration of non-volatile toxins. Subsequent overliming treatment was performed by increasing the pH of the evaporated condensate to a value of 12 using NaOH pellets. The alkaline PAC was then incubated in a closed bottle for 90 min stirring in an oil bath at 100 °C. After the incubation, the PAC was centrifuged again under the conditions mentioned above and the supernatant was filtered through paper filters (type MN615, cellulose, Macherey-Nagel (Düren, Germany)). The pH of the filtrate was adjusted to 6.5 with 96% H2SO4. For the activated carbon treatment, a carbon load of 10% (w/v) was added to the PAC and the suspension was incubated for 10 min at room temperature with continuous agitation. The carbon particles were then separated by centrifugation and the supernatant was further purified by two successive vacuum filtration steps. The first step, using a Büchner funnel and two layers of paper filters (type 595, Whatman, Cytiva (Marlborough, MA, USA)), was followed by bottle top filtration (Nalgene Rapid-Flow, PES, pore size 0.2 µm, Thermo Scientific (Waltham, MA, USA)).

2.4. Analytics

2.4.1. Quantification of the Fungal Cell Dry Weight

Fungal dry cell weight was determined by filtering the content of an entire shake flask through a pre-weighed paper filter. The retained biomass was thoroughly washed with ultrapure water and the filters were dried in an oven at 70 °C until no more change in weight could be detected. The dried filters were weighed with a precision scale and the CDW was expressed in g/L after subtracting the blank weight of the filters.

2.4.2. HPLC Analysis of Substrate Consumption and Malate Production

The concentrations of acetol, acetate and malate in the cultures were analyzed using a reverse-phase HPLC system (Agilent 1100 Series, Agilent, Santa Clara, CA, USA) equipped with a Rezex ROA organic acid H+ (8%) column (300 × 7.8 mm, 8 µm particle size; Phenomenex) and a Rezex ROA organic acid H+ (8%) guard column (50 × 7.8 mm). For sample preparation, centrifugation was performed at 4700× g for 10 min in order to separate the biomass as well as the CaCO3 contained in the main culture samples. A volume of 10 µL of the supernatant was automatically injected into the HPLC after appropriate dilution. For analysis of samples containing PAC, 5 mM H2SO4 was used as mobile phase and the oven temperature was maintained at 50 °C. Detection was performed using a refractive index detector. All other samples were analyzed at 60 °C using a UV detector and 3 mM H2SO4 as eluent. The carboxylic acids and acetol were detected at wavelengths of 220 nm and 280 nm, respectively. Elution was carried out isocratically for all samples at a flow rate of 0.5 mL/min, and quantification was performed using calibration curves in the range of 0.1–5 g/L.

3. Results

3.1. Utilization of Acetol as Substrate for Biomass Formation of A. oryzae

In this experiment the ability of A. oryzae to metabolize acetol concentrations in the range of 3–50 g/L as a carbon source for biomass formation was evaluated (Figure 1). In the course of the experiments, no growth or substrate consumption were observed in the 50 g/L cultures, so the corresponding data are not included. However, even at lower concentrations, the ketone already seems to exert an inhibiting effect on the fungus. While in the flasks containing 3 g/L and 5 g/L of acetol complete consumption of the substrate was observed, with 10–40 g/L acetol only 50.7%, 22.1%, 15.4% and 3.4% of the ketone were metabolized within 96 h of cultivation. The initial lag phase, during which the fungus adjusted to the cultivation conditions, also lengthened with increasing acetol content.
In the flasks with the lowest substrate concentration, metabolization of the ketone was already observed after 24 h, and thus no lag phase could be detected. In contrast, it took at least 48 h for substrate consumption to start in the cultures containing 5–20 g/L acetol. At an initial concentration of 30 g/L acetol, the onset of metabolization was delayed by another 24 h. However, the longest lag phase was observed in the flasks containing 40 g/L acetol, as a decrease in substrate concentration was not detected until the last day of cultivation. The delayed and reduced metabolization of the substrate also affected the biomass formation. While the highest CDW of 2.59 ± 0.01 g/L was reached in flasks containing 3 g/L acetol, the maximum biomass concentration decreased gradually to 2.29 ± 0.08 g/L, 2.19 ± 0.11 g/L, 1.83 ± 0.07 g/L, 1.69 ± 0.05 g/L and 0.22 ± 0.01 g/L with increasing acetol concentration. Moreover, the time of reaching the maximum CDW and the subsequent transition to the death phase was increasingly postponed. For substrate concentrations ≤10 g/L the highest CDW was detected after 48 h of cultivation and a decrease in biomass was observed in the following samples. By contrast, for 20–30 g/L acetol a transition to the death phase occurred only after 72 h, and for the flasks containing 40 g/L acetol a decrease in the CDW was not detected until the end of the cultivation. In the cultures with 3 and 5 g/L acetol, the transition to the death phase coincided with the complete consumption of the C-source. However, even for the flasks with 10–30 g/L, a decrease in CDW was observed at the end of cultivation, although acetol was still present. This suggests that at least one other nutrient in the medium was depleted. It is also striking that in the first 24 h of cultivation biomass formation as well as a drop in pH was already detected, even in the flasks in which no acetol had been consumed at that time. This might indicate that A. oryzae uses additional substrates for its initial growth. The most likely candidates for alternative C-sources are the glycerol contained in the spore solution and substances that probably result from Maillard reactions occurring during autoclaving. The latter could also explain why the initial acetol concentration in the cultures was always lower than expected. Nevertheless, it was successfully demonstrated that the main component of the PAC is in principle suitable as a substrate for fungal growth, but apparently not for the production of organic acids, since in this work malate was not detected in any culture containing acetol as sole C-source (data not shown).

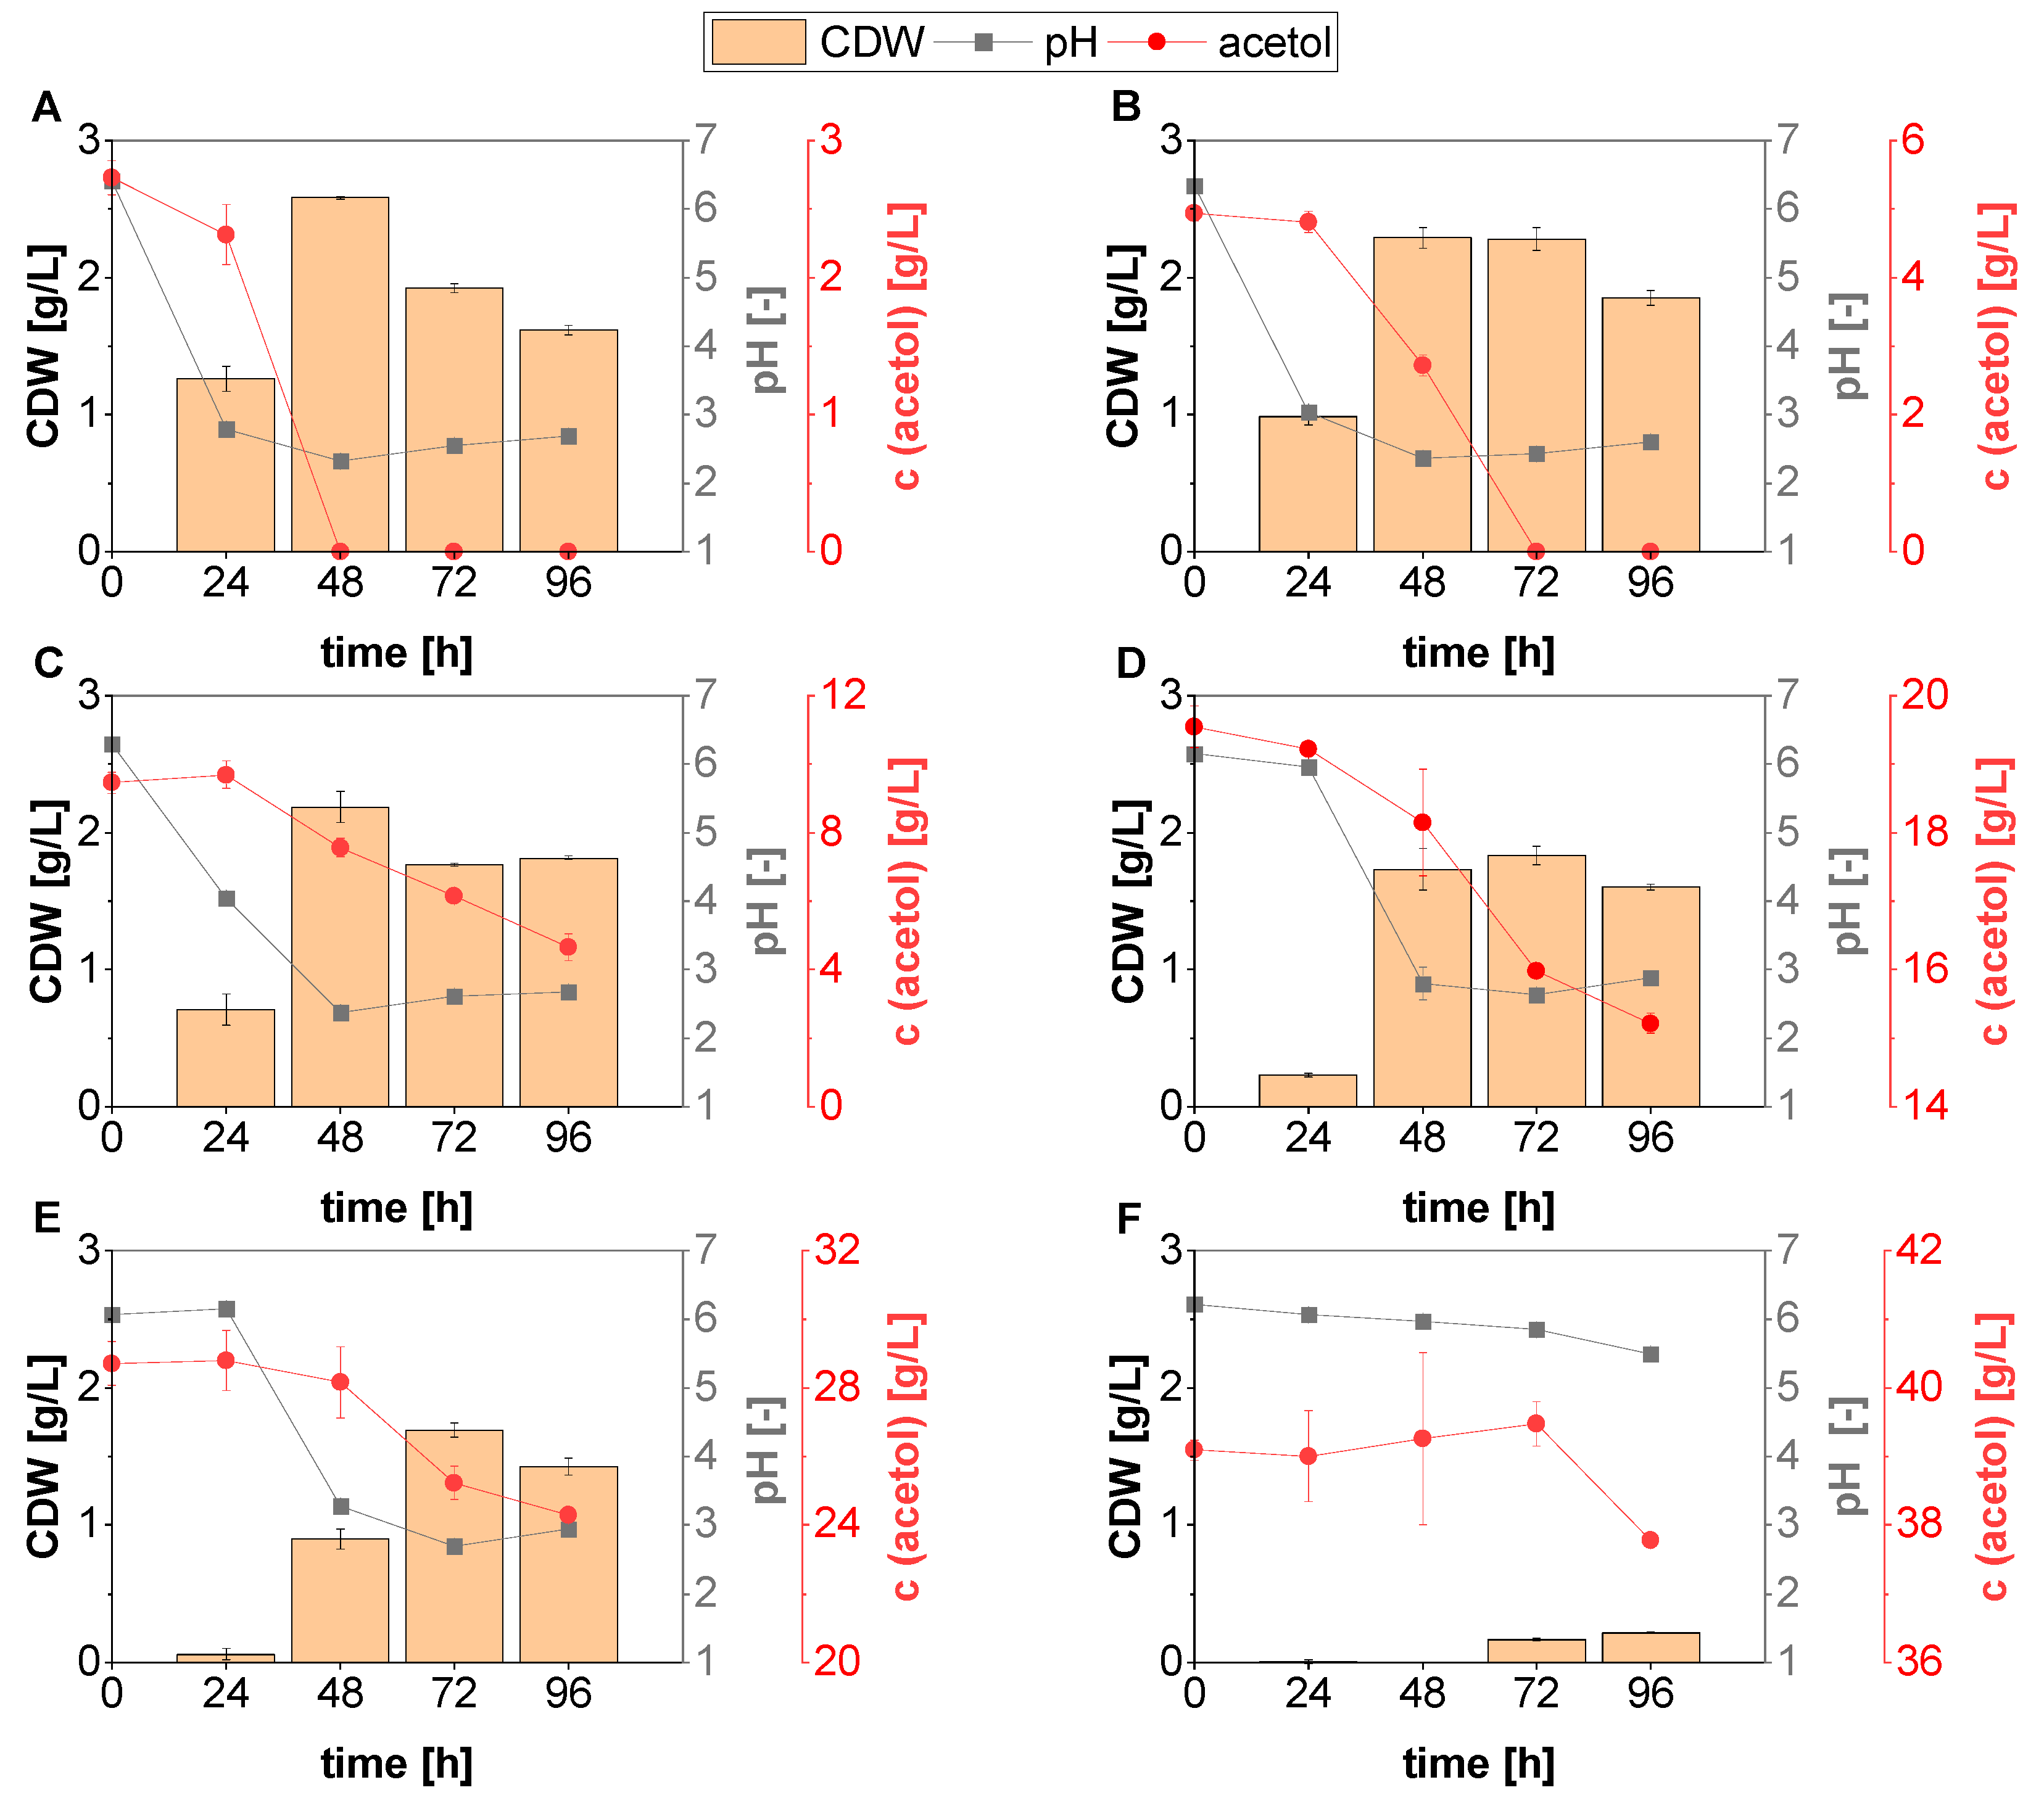
3.2. Acetate-Acetol Mixtures as Substrates for Fungal Growth

Since it is already known that acetate concentrations such as the 40 g/L contained in the PAC can be utilized by A. oryzae and the acetate content in the condensate remains largely unchanged during detoxification, artificial PACs consisting of 40 g/L acetate and different concentrations of 0–40 g/L acetol were tested for their suitability as substrates for fungal growth (Figure 2). However, no biomass formation was observed for the flasks containing 30 g/L and 40 g/L of the ketone, so data for these cultures are not included. As displayed in Figure 2, the acetate control did not show any lag phase, since metabolization of the initially contained 39.91 ± 0.73 g/L acetate started immediately and a CDW of 0.56 ± 0.06 g/L was already detected after 24 h. The largest decrease in the acetate concentration was observed between 24–48 h and was measured to be 4.43 g/L. The high substrate consumption at this stage of cultivation resulted in almost a six-fold increase in fungal biomass to 3.13 ± 0.25 g/L. Subsequently, acetate consumption flattened slightly, and only a negligible increase in biomass to 3.29 ± 0.21 g/L was observed after 96 h, leading to the conclusion that the fungus entered the stationary growth phase after only 48 h in these cultures.
In contrast, biomass formation in the flasks containing acetol slowed down with increasing ketone concentration. While the cultures containing 3 and 5 g/L of the ketone still behaved comparably to the control, and biomass formation started after 24 h, it was delayed by another 24 h in the flasks with 10 and 20 g/L acetol. As already observed in the first experiment, the delayed onset of biomass formation also shifted the time point at which the maximum CDW was reached. In the 3 g/L acetol cultures, the highest biomass concentration of 3.58 ± 0.17 g/L was obtained after 72 h, and the fungus thus entered the stationary growth phase 24 h later than in the acetate control. In contrast, for acetol concentrations ≥5 g/L, an increase in biomass was detected until the end of cultivation. Accordingly, no stationary phase was observed and it cannot be assessed whether the maximum CDW has already been reached. Despite the increasing lag phase in the acetol-containing cultures, no reduction in the final CDW was observed compared to the control (Table 1).
Rather, acetol contents of up to 10 g/L even seemed to have a slightly positive effect on fungal growth, as biomass concentration appeared to increase with the increasing amount of ketone, resulting in the highest CDW of 4.46 ± 0.64 g/L obtained in the 10 g/L acetol cultures. However, due to the large standard deviation, this cannot be assumed to be significant. Only when the acetol content was raised to 20 g/L did the biomass formation decrease considerably to a maximum CDW of 3.47 ± 0.40 g/L, which was still comparable to the acetate control. The increase in biomass concentration in the cultures with 3–10 g/L acetol can be attributed to the metabolization of the ketone as an additional C-source, since acetate consumption in the flasks behaved largely similarly. In the flasks with 3 g/L, a complete conversion of acetol was observed after 72 h, and also the cultures with 5 g/L and 10 g/L contained only 0.10 ± 0.00 g/L and 0.63 ± 0.13 g/L of the ketone at the end of cultivation. Accordingly, the concentration of carbon metabolized by the fungus increased (Table 1). In contrast, in the flasks with an acetol content of 20 g/L, only 37.5% of the acetol initially added was metabolized. The consumption of acetate was also lowest and slowest in these flasks, as 30.92 ± 1.16 g/L of the substrate remained unused. Despite the reduced substrate utilization in the cultures with the highest ketone concentration, it was nevertheless demonstrated that combinations of 40 g/L acetate and up to 20 g/L acetol were suitable C-sources for A. oryzae and resulted in biomass titers comparable to those in the control. However, Table 1 shows that biomass yield was reduced with increasing acetol concentration from 0.28 ± 0.03 g/g for the control to 0.19 ± 0.03 g/g and 0.21 ± 0.02 g/g for the flasks containing 10 and 20 g/L acetol. This indicates an increasing inhibitory effect of the ketone, as already observed in the first experiment. The inhibition seemed to be even enhanced in the presence of acetate, since no more fungal growth was observed for concentrations >20 g/L acetol, whereas up to 40 g/L were tolerated when the ketone was the sole C-source.

3.3. L-Malic Acid Production with Acetate-Acetol Mixtures

Having shown that model mixtures of 40 g/L acetate and acetol in concentrations up to 20 g/L are suitable for fungal growth, we then investigated how these mixtures affect L-malic acid production of A. oryzae. Figure 3 shows that for acetol concentrations ≤10 g/L, no considerable differences were observed in both acetate consumption and malate production compared with the control. In these flasks, a strong reduction in acetate concentration was already detected after the first 48 h.
The decrease in concentration continued throughout the cultivation and, at the end, the final concentration of acetate was about 3.48–3.68 g/L in the flasks containing 0–5 g/L acetol and 6.78 ± 3.91 g/L in the 10 g/L cultures. The comparatively high final concentration in the latter might indicate an incipient inhibition of the fungal acetate utilization induced by the ketone, but due to the high standard deviation it cannot be considered significant. At an acetol concentration of 20 g/L, however, the inhibitory effect became clearly evident, as in these flasks the acetate consumption was considerably reduced, resulting in a final concentration of 20.17 ± 2.84 g/L. In addition to acetate, all acetol containing cultures simultaneously metabolized the ketone. In the flasks with an acetol content of 3 g/L, a complete conversion was detected after only 96 h, whereas in the cultures containing 5 and 10 g/L, it took 144 h for the acetol to be fully depleted. Similar to acetate, reduced utilization of the ketone was observed in the flasks containing 20 g/L acetol, with a concentration of 5.86 ± 0.85 g/L remaining unused at the end of the cultivation. The metabolization of the substrates, especially acetate, also had an impact on the pH curves (Figure 3). Although the first increase in pH after 48 h can be largely attributed to the outgassing of CO2 from the carbonate buffer, the flasks with acetol concentrations of 0–10 g/L already showed a higher pH at this time than those with 20 g/L, due to acetate consumption. However, as cultivation progressed, the pH curve flattened considerably for the flasks containing low acetol contents ≤10 g/L since malic acid production in these cultures started after 48 h and counteracted the pH increase. Nevertheless, both pH and malate concentration in these flasks continued to rise until the end of cultivation, with the greatest increase in product titer being observed between 48 and 144 h.
Consequently, these cultures reached their maximum yield and productivity at this stage of fermentation (Table 2). In the cultures containing 20 g/L acetol, only a slight change in pH was observed after the initial CO2-induced sharp increase, as little acetate was metabolized and no malate was formed during the first 96 h of cultivation. Only after 144 h were a clear pH increase and the onset of malic acid production detected, showing that product formation was clearly delayed compared to the flasks with 0–10 g/L acetol. This was followed by an exponential increase in malate concentration until the end of cultivation reaching a final titer of 3.72 ± 0.37 g/L malate. In comparison to the product concentrations achieved in the other cultures, the titer was considerably reduced, and also the lowest values for yield and productivity were obtained (Table 2). Generally, the values for these parameters tended to decrease with increasing acetol concentrations and it can therefore be assumed that the presence of the ketone does not have any beneficial effect on the fungal malate production.

3.4. PAC as Sole Substrate for L-Malic Acid Formation

As demonstrated in the previous experiment, the acetol contained in the PAC does not favor malic acid production with A. oryzae and should therefore be removed before the condensate is applied as substrate. The PAC used in this work had an acetol content of <3 g/L due to the various pretreatments. Hence, the focus in the following experiments was on acetate as the main substrate for malic acid production. In a first shake flask cultivation, it was assessed whether A. oryzae is in principle able to use the acetate contained in 100% PAC for acid formation. Subsequently, pH optimization was performed by lowering the initial pH of the medium, and the optimized process was finally transferred to 500 mL bioreactors.

3.4.1. General Suitability of PAC for Fungal Acid Formation

For the first shake flask experiment with PAC, the condensate was used immediately after detoxification (pH = 6.5), and a main culture medium containing 100% PAC was prepared. We intended to investigate whether A. oryzae is, in principle, able to utilize acetate not only in defined media, but also in PAC as a real lignocellulosic substrate. Moreover, in fact, Figure 4 shows that the fungus immediately began to convert the initial 40.15 ± 1.87 g/L of acetate to malic acid without any apparent lag phase, as a titer of 0.94 ± 0.15 g/L malate was detected after 24 h. The substrate concentration continued to decrease as the cultivation progressed and resulted in the formation of a maximum malate titer of 3.37 ± 0.61 g/L, and a maximum yield of 0.20 ± 0.05 g/g after 192 h (Table 3). However, in the last two days of fermentation, both the acetate consumption and the malic acid production curves flattened, leading to a final malate concentration of 3.22 ± 0.70 g/L, and 22.70 ± 2.36 g/L of substrate remaining unused. The decrease in metabolic activity is most likely due to the sharp increase in pH from an initial value of 8.05 ± 0.03 to 9.82 ± 0.04 at the end of cultivation and raised the question of whether a lower initial pH could improve malic acid production.

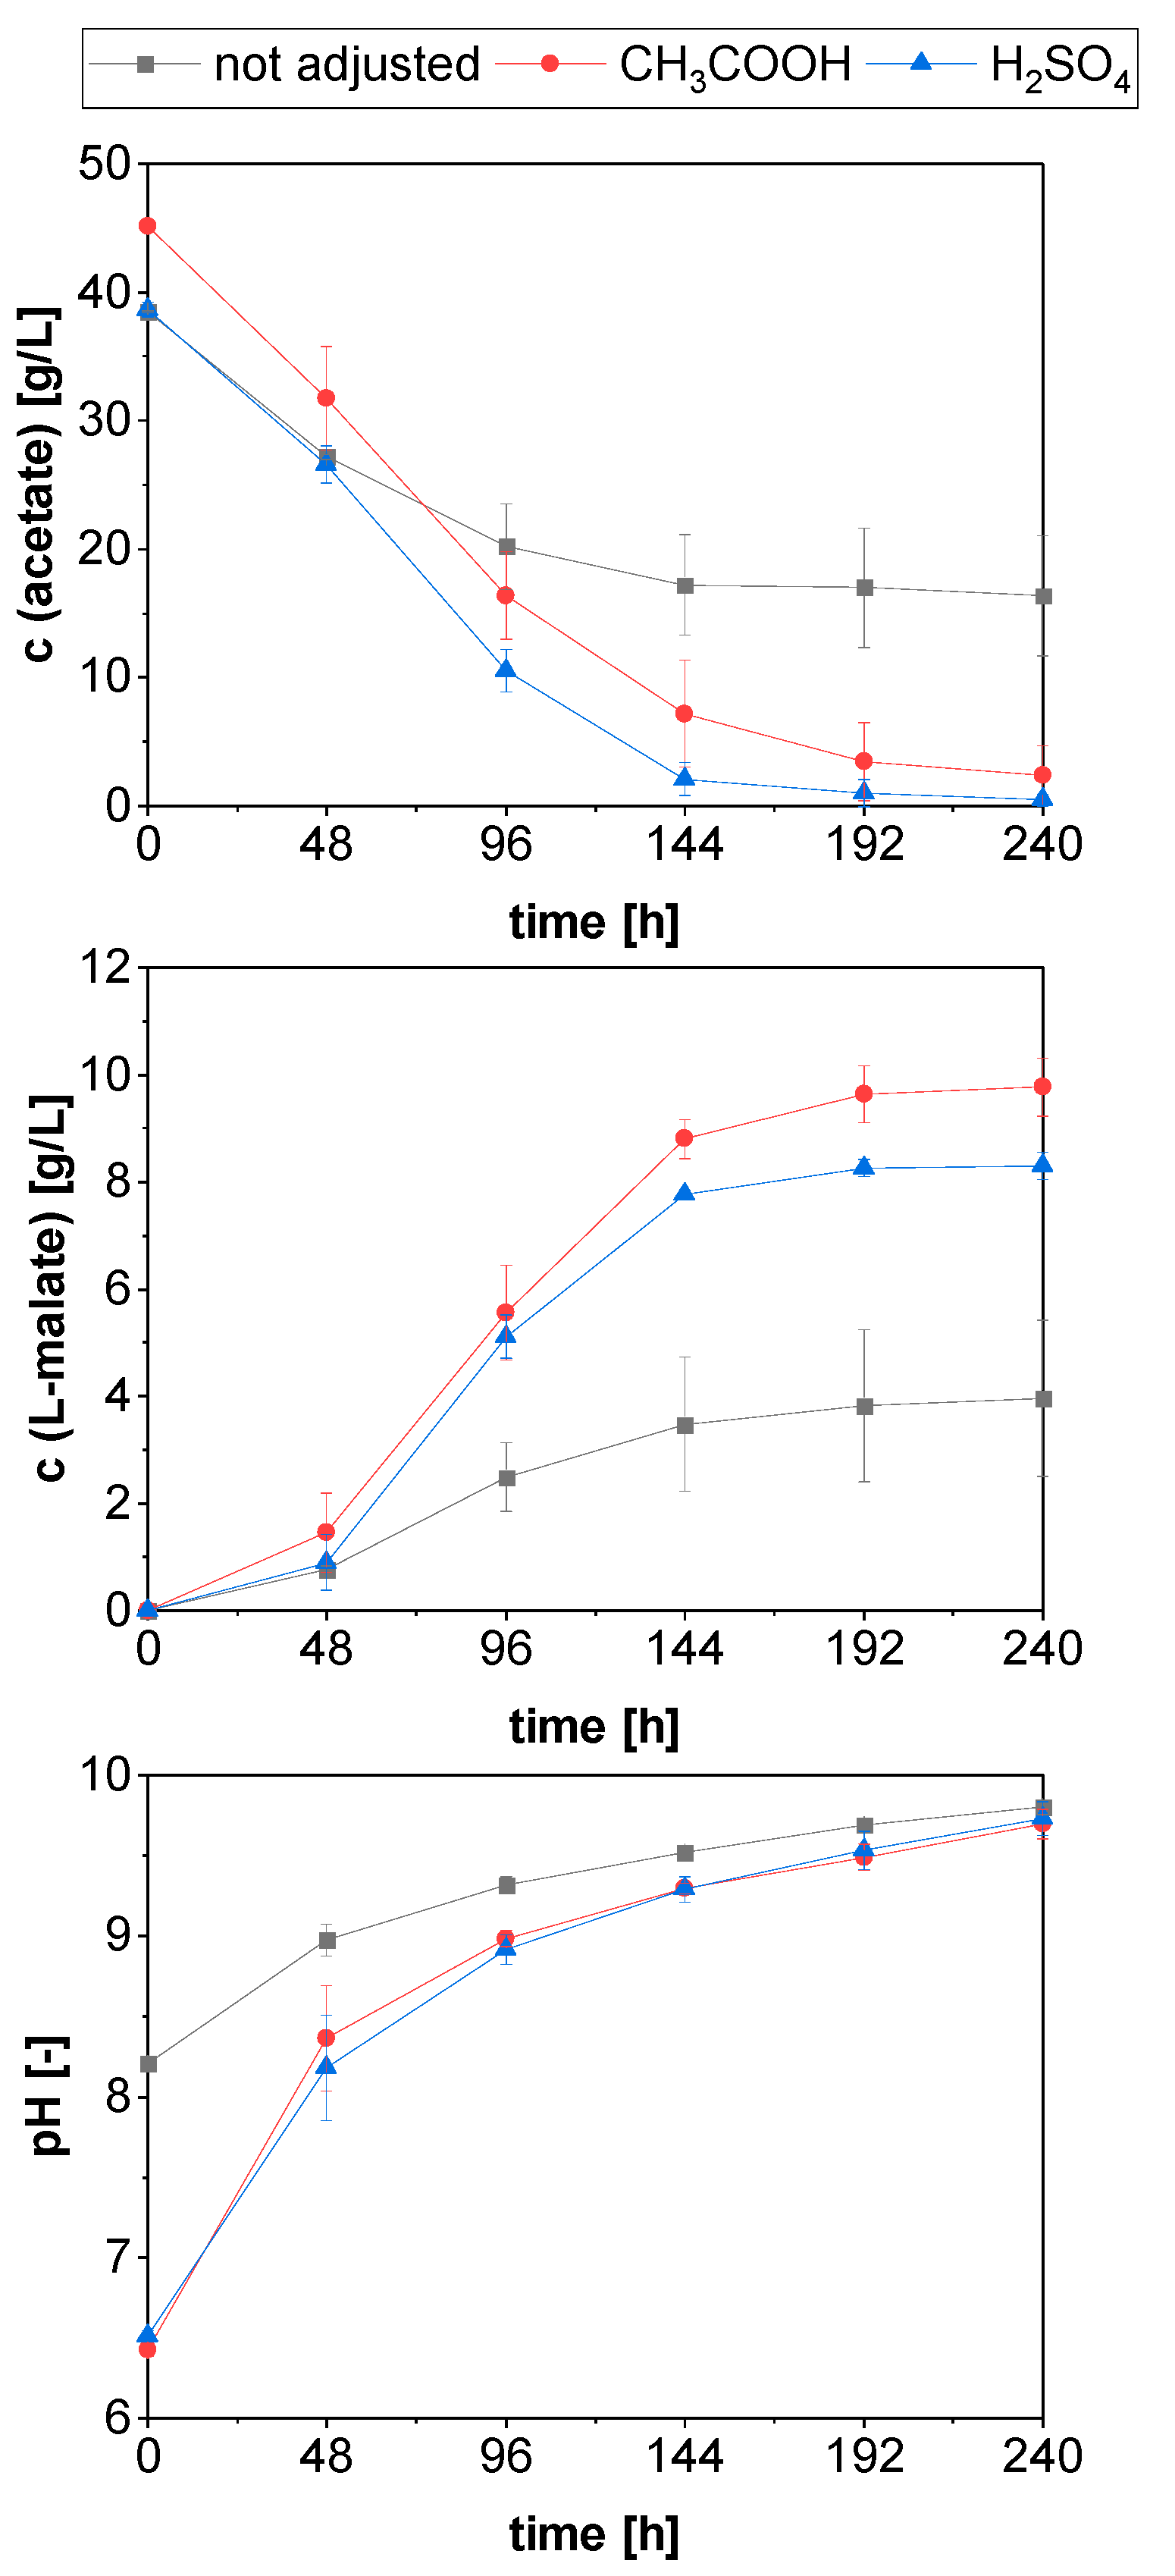
3.4.2. Role of the Initial Medium pH on L-Malic Acid Production from PAC

To evaluate the role of the initial pH of the PAC on malate production with A. oryzae, two different acids (100% acetic acid and 96% sulfuric acid) were used to lower the pH-value of the medium to 5.5 prior to sterile filtration. Due to the addition of CaCO3 to the flasks, the initial pH increased to about 6.5 in the pH-adjusted cultures whereas, as in the previous experiment, a slightly alkaline pH of 8.20 ± 0.03 was measured for the flasks containing non-adjusted PAC (Figure 5). Despite the different initial values, all cultures had a similar pH of 9.7–9.8 at the end of cultivation, mainly due to the strong pH increase that was observed in the adjusted flasks during the first 48 h. Since there were no appreciable differences in acetate consumption or malic acid production at that time compared to the non-adjusted control, this increase is most likely due to an increased outgassing of CO2. However, in the further course of the cultivation, a stronger pH increase was still observed in the pH-adjusted cultures, which can be attributed to improved substrate utilization.
While in the control flasks the curve for acetate concentration flattened sharply after 48 h of cultivation, leaving 16.40 ± 4.69 g/L of the substrate unused, acetate utilization was remarkably improved by the pH adjustment. As expected, the initial substrate concentration (45.18 ± 0.20 g/L) was higher in the flasks whose pH was decreased with acetic acid than in those for which sulfuric acid was used. In the latter, the initial acetate concentration was 38.64 ± 0.58 g/L and thus comparable to the control. Apart from the difference in initial concentrations, the substrate was metabolized equally in both pH-adjusted cultures, resulting in a parallel course of the two curves over 144 h of cultivation. In the last four days of fermentation, however, the substrate consumption began to flatten increasingly, especially in the H2SO4 adjusted cultures, leading to comparably low final concentrations.
The improved metabolization of the substrate in the pH-optimized cultures also had a positive effect on the malic acid production. Although small amounts of the acid were already detected in all cultures after only 48 h, the curve of the control was again noticeably flatter in the further course of cultivation and a final malate titer of only 3.96 ± 1.46 g/L was obtained. In contrast, a steep increase in malic acid concentration was observed in the pH-adjusted cultures, resulting in considerably higher malate concentrations than in the controls after only 96 h. At this time, very similar titers of 5.56 ± 0.88 g/L and 5.11 ± 0.40 g/L were measured in the flasks adjusted with H2SO4 and acetic acid, respectively. However, as already observed for acetate consumption, malate production gradually leveled off as the cultivation progressed, particularly in the flasks adjusted with H2SO4, making the difference between the two cultures increasingly obvious. Despite the gradual flattening of the curves, the maximum malate titers were reached at the end of cultivation and were found to be 8.30 ± 0.26 g/L and 9.77 ± 0.55 g/L, respectively, corresponding to increases of 2.1 and 2.5-fold compared with the unadjusted control. As indicated in Table 3, the yield and productivity values calculated for the control are comparable to those of the first cultivation, so the process appears reproducible despite the complex substrate. Although a significantly higher malate titer was measured in the flasks, whose pH was lowered with acetate, comparable yields were obtained in both pH-adjusted cultures (Table 3). Therefore, H2SO4 was chosen for pH adjustment in the subsequent reactor culture, since the main objective of this work was to use PAC as the sole substrate for fungal malate production.

3.4.3. Malic Acid Production in Bioreactor Cultivations

In the following experiment, it was investigated whether fungal malic acid production on PAC can be transferred from shake flasks to 0.5 L bioreactors. For comparison, a control fermentation was performed with a defined medium containing 40 g/L acetate (Figure 6). Although the pH of the media in this experiment was also adjusted to 5.5 with H2SO4 prior to sterilization, the initial pH values of about 6.7 in the reactors were slightly higher than in the previous shake flask experiments. The main reason for this, as well as for the rapid pH increase within the first 3–4 h of cultivation, can be seen in the enhanced outgassing of CO2 due to aeration and stirring.
The subsequent stabilization of pH to values of 7.7–7.9, was followed by a further increase after a fermentation time of about 12 h, which was observed especially in the control reactors and was most likely due to the onset of acetate metabolization. Since this occurred before the first sampling, no lag phase in substrate consumption could be recorded for these reactors. According to the pH values, acetate utilization started later in the reactors with PAC and the time of onset also differed greatly within the duplicate. While the increase in pH in the first reactor coincided with the 24 h sampling, it did not start in the second reactor until 13 h later. Moreover, the increase was smaller than in the controls, so that after 72 h a pH of 9.0–9.1 was measured in the reactors containing PAC, while in the acetate controls it was already found to be 9.7–9.8 at that time. Since it was shown in the previous experiment that pH plays an important role in malate production, it was decided to manually adjust the pH to values <7.5 with 72% H2SO4 after each sampling to prevent a further increase. However, by the time the next sample was taken, the pH had already returned to nearly the original value in all reactors, primarily due to repeated outgassing of CO2. Consistent with the pH curve, the course of substrate utilization at the beginning of the cultivation was flatter in the reactors with PAC than in the control. While in the latter, 52.1% of the initial acetate concentration had already been metabolized after 48 h, this was only 23.7% in the reactors containing the pyrolysis condensate. However, in the controls, substrate conversion decreased considerably as cultivation progressed, leaving a final concentration of 11.62 ± 2.29 g/L acetate unused. In contrast, a sharp decrease in substrate concentration was observed in the reactors with PAC after the initial lag phase, leading to an almost-complete conversion of acetate by the end of the cultivation. The reduced substrate consumption observed in the control cultures also affected their product formation. Although in the controls first malate titers were already measured in the 24 h samples due to the earlier onset of acetate consumption, and acid production thus started one day earlier than in the reactors containing PAC, comparably high titers were obtained after only 72 h. As cultivation progressed, malate production in the controls flattened noticeably and a final titer of only 2.73 ± 0.47 g/L was reached. In contrast, a strong increase in malate production continued to be observed in the reactors with PAC, which only weakened slightly in the last 24 h of fermentation. A maximum malate concentration of 7.31 ± 0.29 g/L was obtained in these reactors, which was 2.7 times higher than in the controls. Thus, it was successfully demonstrated that the process of fungal malate production on detoxified PAC can be transferred to the reactor scale. Compared to the concentration of 8.30 ± 0.26 g/L malate obtained in the shake flasks experiment, a slight reduction in product titer was observed. However, since the cultivation time in the bioreactor fermentations was much shorter, the overall productivity was increased to 0.051 g/(L∙h), which was the highest value of all PAC cultures performed (Table 3). As this work revealed a high importance of pH for fungal malate production on acetate-containing lignocellulosic side streams, the implementation of an automated pH regulation could be suitable to further improve the process.

4. Discussion

4.1. Acetol Utilization in A. oryzae Preculture

In this work, it was successfully demonstrated that Aspergillus oryzae is able to use acetol as the C-source for biomass formation at concentrations up to 40 g/L, although growth inhibition was observed with increasing ketone concentration. While several studies have been conducted on how pretreatments can effectively remove inhibitory compounds such as acetol (hydroxyacetone) from liquid pyrolysis products, thereby reducing toxicity to various microorganisms [36,40,41,42], there is little information on acetol as a single substance. Lian et al. investigated the inhibitory effect of various components of an aqueous pyrolysis sugar solution on S. cerevisiae strain ATCC 200062 and estimated its growth and ethanol production to be inhibited by 80.07% and 99.08%, respectively, compared with the control when the medium contained 2.16 wt-% acetol [43]. For Aspergillusoryzae, tolerance towards the ketone was also already studied previously on glucose-containing agar plates, and it was found that the fungus stopped growing at concentrations greater than 1.5 wt-% acetol. According to the authors of the study, the reason was probably the solvent properties of the ketone, which cause increasing disorganization of the cell membrane [34]. The tolerated acetol concentration was thus significantly lower than the 40 g/L achieved in the current work although the medium contained additional glucose as an easily metabolizable C-source. Therefore, as far as the authors are aware, acetol has not yet been reported to serve as sole substrate for growth of filamentous fungi, nor is there any knowledge on its metabolization in these organisms.
In contrast, for bacteria such as Thermoanaerobacterium thermosaccharolyticum [44,45] and Clostridium sphenoides [46], it is well known that acetol occurs as an intermediate in the formation of 1,2-propanediol from dihydroxyacetone phosphate. In the first step of the process, an enzyme called methylglyoxal synthase catalyzes the conversion of the triose phosphate to methylglyoxal by cleavage of an inorganic phosphate. This is followed by a stepwise reduction of the methylglyoxal to 1,2-propanediol, which proceeds with the formation of lactaldehyde or acetol as an intermediate and requires different reduction equivalents (NADH, NAD(P)H) depending on the oxidoreductase involved [47]. Although the production of 1,2-propanediol has been observed predominantly in bacteria, there is evidence that at least parts of this pathway are also present in yeasts and fungi. For example, two methylglyoxal oxidoreductases have already been identified for A. niger [48] and it has been shown in the same species as well as in A. nidulans that these two fungi possess glycerol dehydrogenases that have an activity of 18% towards methylglyoxal and thus can potentially catalyze its conversion to acetol or lactaldehyde [49]. In addition, it has already been shown by Walti et al. that A. niger is able to convert 1,2-propanediol back to acetol, suggesting that the reaction steps involved in this metabolic pathway are at least partially reversible [50]. The enzymes of the methylglyoxal pathway have also been identified in S. cerevisiae [51,52], but nevertheless the production of 1,2-propanediol by the yeast has so far mostly required genetic engineering [53,54,55,56], or was carried out as yeast-mediated bioconversion of acetol using ethanol or acetate as the primary energy source and for the regeneration of the reduction equivalents [57,58,59,60].
This raises the question of whether A. oryzae actually utilized acetol as the sole substrate for its growth in our preculture experiments or whether residual glycerol from the spore solution or Maillard products formed during autoclaving may have been used for this purpose. It is already known that the fungus is able to use glycerol as a C-source for growth [22] and that the formation of pyrazines can occur as products of the Maillard reaction between acetol and ammonia [61]. The decreased acetol concentration at the beginning of our cultivation indicates the formation of Maillard products. However, the reduction in initial acetol content was only 1.2–9.0% of the originally intended value, and the concentration of Maillard products formed was therefore probably too low to meet the fungal energy requirements. Moreover, at least for the cultures with 3 and 5 g/L acetol, there was a significant decrease in biomass concentration after the complete depletion of the ketone and thus a clear coupling of growth and acetol consumption. This is also supported by the work of Lian et al. who investigated the suitability of acetol, acetate as well as the mixture of both carbon sources for biomass formation and lipid production of the yeasts Cryptococcus curvatus, Rhodotorula glutinis and Lipomyces starkeyi and showed that all strains tested were capable of metabolizing the ketone as the sole substrate at a concentration of 1 wt-% [36]. Assuming the density of water for the medium, these results are most comparable to the cultures with 10 g/L acetol in our experiment, which also still showed good growth with a CDW of 2.19 ± 0.11 g/L and consequently very little inhibition compared with the lowest concentration of 3 g/L acetol (2.59 ± 0.01 g/L biomass). Furthermore, for two of the three yeasts studied, slightly increased CDWs were obtained on mixtures of 1 wt-% acetol and 1 wt-% acetate compared with the use of only one C-source. This coincides with our results, as we also detected slightly increased titers with additional 10 g/L acetol compared to the control containing acetate as the sole substrate.
Despite the slightly improved titers observed at low acetol concentrations in the mixtures with acetate, overall tolerance to the ketone was nevertheless lower in this experiment. Whereas 40 g/L of the ketone could still be tolerated when acetol was the only C-source, fungal growth was no longer observed at concentrations >20 g/L acetol when an additional 40 g/L acetate was present in the medium. This is most likely due to the fact that in addition to the stress that may be exerted on the fungal cell membrane by the solvent properties of acetol, osmotic stress is generated by acetate. Although in our preculture experiment with mixtures of acetol and acetate (pKa = 4.76), the initial pH of the cultures was 7 and thus most of the acetic acid was deprotonated, the small fraction of protonated uncharged acid molecules can probably enter the cell and lower its internal pH [32]. Using the Henderson–Hasselbalch equation, the concentration of protonated acetic acid in the medium was determined to be 0.23 g/L (0.004 mol/L) for our cultivation conditions. However, according to Alcano et al., only concentrations above 0.018–0.022 mol/L were found to completely inhibit spore germination of A. carbonarius, A. flavus, and A. parasiticus [62], so the concentration of protonated acetic acid in our medium was most likely not the main reason for the decreased acetol tolerance. As previously discussed by Kövilein et al. another possible osmotic stress factor results from the large amount of sodium ions that accumulates during media preparation when the 40 g/L of acetic acid is neutralized to a pH of 7 using NaOH pellets [33]. However, the pH adjustment resulted in a sodium ion concentration of only about 0.7 mol/L in the medium, which did not exceed the tolerance limits already determined for other Aspergillus species [63,64]. Accordingly, none of the individual stressors (acetol, protonated acetic acid, sodium ions) can explain the reduced acetol tolerance of A. oryzae in acetate-acetol mixtures. Nevertheless, it can be assumed that the inhibitory effects of the individual stressors add up or possibly even reinforce each other and thus probably cause the increased sensitivity to the ketone.

4.2. Malic Acid Production on Artificial and Real PAC

In accordance with the corresponding precultures, the main culture experiments with acetate-acetol mixtures also showed a clear inhibitory effect of ketone concentrations ≥20 g/L on malate production in A. oryzae. Whereas the product titers obtained at low acetol concentrations between 3–10 g/L (5.64 ± 0.59 g/L–6.02 ± 0.17 g/L) were still comparable with the acetate control (6.29 ± 0.46 g/L), the final malate concentration was reduced by 40.9% in the cultures containing 20 g/L acetol, and no product formation was detected at all when the medium contained ≥30 g/L of the ketone (data not shown). Malic acid yield as well as the productivity also decreased with increasing acetol content in the cultures. This coincides with the results of Dörsam et al. who also observed a considerable reduction in malate yield when increasing acetol concentrations were added to glucose containing A. oryzae main cultures [34]. In addition, they identified the maximum ketone concentration suitable for malate production to be 2.5 wt-%. Even though this was not a concentration we studied, it was nevertheless exactly between the acetol content at which we observed an initial inhibition and the one for which malate formation could no longer be detected. The fact that similar results were obtained in acetol mixtures with both acetate and glucose suggests that inhibition in the main cultures was quite independent of the primary C-source used. Consequently, the proportion of protonated acid or the concentration of sodium ions in our acetate cultures appeared to be of minor importance for product inhibition. The assumption that acetol is the main cause of the reduced malate production is also confirmed by the fact that, although concentrations up to 40 g/L acetol seem to be suitable for fungal growth, we did not succeed in using acetol as the sole C-source for acid production with A. oryzae (data not shown).
Dörsam also investigated malate production in shake flask cultures with artificial PAC consisting of acetol, acetate, and three other main PAC components (propionic acid, ethylene glucol, and methanol) and compared them with a 45 g/L acetate control. Consistent with the results in the glucose containing cultures, as well as those from our experiment, a level of 3.5 wt-% acetol was found to be completely inhibitory to malate production, while a reduction to 1.75 wt-% still yielded comparable titers to the control [65]. Complete omission of ketone from the model PACs even resulted in a significant increase in malate concentration to more than threefold, indicating that additional PAC components are used as C-sources for acid production. In any case, these results confirm that as much acetol as possible must be removed in order to efficiently use the condensate as a substrate for malate production with A. oryzae.
After removal of potential toxins from the PAC by rotary evaporation, overliming, and a subsequent activated carbon treatment, it was shown in this work that the condensate is indeed suitable for fungal malate production. However, the final achieved titer of 3.22 ± 0.70 g/L malate after 240 h was significantly lower than the concentration measured for the 40 g/L acetate control in the experiment with acetate-acetol mixtures (6.29 ± 0.46 g/L). The main reason for this observation is probably the high pH of the PAC medium, which already had a value of 8.05 at the beginning of the experiment and even increased to 9.81 as cultivation progressed. The inhibitory effect of alkaline medium pH has already been shown for other Aspergillus species. For example, Pinchai et al. found that the growth of A. fumigatus was significantly inhibited at a pH of 9 compared to the acidic range [66], and Aspergillus nidulans even showed inhibition at a pH of 8, especially in the presence of high sodium concentrations (1 mol/L) [67]. In our PAC main culture experiments, we reached similarly high values (about 0.9 mol/L) due to the neutralization of the condensate to a pH of 6.5 and the overliming with NaOH. However, since the two previously mentioned alkaline pH inhibition studies were growth experiments on agar plates, they were performed under completely different cultivation conditions and are therefore difficult to compare with the current experiment on product formation in shake flasks. In contrast, the study by Kövilein et al. in which the influence of initial pH on malic acid production with A. oryzae was investigated in acetate-containing main cultures seems more suitable for comparison with the current results. They found that for optimal malate production, the pH should ideally be adjusted to 5.5 before CaCO3 addition, as both lower and higher values result in decreased malate titers [33].
Therefore, in the follow-up experiment, two different pH adjusting agents, i.e., 96% H2SO4 and 100% acetic acid, were tested to lower the initial medium pH. The adaptation indeed resulted in an increase in the final malate titers to 8.30 ± 0.26 g/L and 9.77 ± 0.55 g/L, thus confirming that the high pH was the main cause of the reduced malate production. Although the use of acetic acid for pH adjustment increased the initial substrate concentration to 45 g/L, both adjusted cultures showed nearly identical maximum yield of 0.23 ± 0.03 g/g (acetic acid) and 0.22 ± 0.01 g/g (H2SO4). This is in accordance with the results of Kövilein et al. who performed main cultures in shake flasks containing acetate concentrations of 10–55 g/L and also obtained identical yields for the cultures with 40 g/L and 45 g/L acetate, respectively [33]. In their work, the yield was calculated to be 0.19 g/g, which was thus comparable to the values obtained in our experiment. Since the values for productivity were also only slightly higher in the cultures whose pH was adjusted with acetic acid, and the main objective of the work was to use PAC as the sole C-source for fungal acid production, H2SO4 was chosen as the pH-adjusting agent for the subsequent bioreactor cultivation.
For both the acetate control (2.73 ± 0.47 g/L) and the bioreactors containing PAC (7.30 ± 0.29 g/L), noticeably reduced titers were measured compared to the shake flask cultivations (acetate: 6.29 ± 0.46 g/L; PAC: 8.29 ± 0.26 g/L), but due to the shorter fermentation time of 144 h, yield and productivity should rather be used for comparison. In the bioreactors with PAC, the values for these parameters were roughly comparable to those obtained in the shake flask experiments, and even the highest overall productivity of all cultivations (0.051 ± 0.002 g/(L∙h)) was observed, indicating that upscaling into the bioreactor was successful. In contrast, the acetate control showed a considerable reduction compared to the shake flask experiment, since the maximum yield was approximately halved and the maximum and overall productivity were also reduced by 30.4% and 26.9%, respectively. One possible reason for the lower values could be the increased shear stress caused by stirring in the bioreactor. Furthermore, since filamentous growth was observed in both the PAC and acetate precultures, it is conceivable that some of the biomass became attached to the reactor internals after transfer to the bioreactor, where it was exposed to different conditions than the properly suspended cells. Another difference between cultivation in shake flasks and bioreactors was aeration, which, as previously shown by Halliwell et al. could affect acetate metabolism and production of certain organic acids [68], and therefore may have shifted the product spectrum. Aeration also led to an increased outgassing of CO2 and therefore already at the beginning of the cultivation to significantly higher pH values (≈7.6–7.9) than in the shake flask experiments. Particularly in the control reactors, this was followed by a further sharp pH increase, which can be attributed to the earlier onset of acetate metabolization, as well as the higher initial substrate consumption compared to the PAC-containing reactors. Thus, the pH in the controls already reached a value of 9.8 after 72 h of cultivation, while it was only 9.0–9.1 in the reactors with PAC medium. Accordingly, inhibition of the acid production by the alkaline medium pH most likely explains the reduction in yield and productivity in the control reactors. Although attempts were made to counteract the inhibition by manually readjusting the pH once a day, the acetate controls showed a considerable drop in metabolic activity as cultivation progressed, so that it can be assumed that the cells in these reactors had already been irreparably damaged. Moreover, the effect of the pH correction did not last long, since the repeated outgassing of CO2 probably caused the pH to rise again quickly to almost the former value.
Therefore, the authors consider the establishment of an automatic pH control promising to potentially further increase fungal acid production. However, in the reactors containing PAC, the acetate was almost completely depleted at the end of cultivation, so more substrate is needed in addition to pH control to increase acid production. One way to combine pH regulation and substrate supply is to use acetic acid or PAC as pH adjusting agents, although the latter is of limited suitability due to its relatively high pH of 6.5 after the pretreatment procedure. An alternative to feeding acetic acid that is more compatible with the objective of using PAC as the sole substrate might be the utilization of genetically modified strains whose carbon flux has been redirected toward increased malic acid production. Several approaches to genetically modify the malic acid production in Aspergillus species have already been described in the literature [69,70]. In these studies, significant improvement was achieved by targeted overexpression of genes directly involved in malate production and/or by deletion of metabolic pathways leading to the formation of by-products. The introduction and heterologous expression of genes from other organisms has also been carried out to enhance fungal acid production [71,72] and ultimately even offers the possibility of completely reconstructing metabolic pathways. Such an approach could potentially be pursued to allow malate production on acetol, which would both eliminate the need to remove the ketone by pretreatment and allow more carbon in the condensate to be used for malate formation.

5. Conclusions

In this study, it was shown for the first time that A. oryzae is able to use acetol as substrate for growth in shake flask cultures. The maximum tolerated concentration was identified to be 40 g/L, although increasing inhibition was already observed for lower acetol concentrations. In cultures with artificial PACs containing 40 g/L acetate and different levels of acetol, however, growth was already found to be completely inhibited for ketone concentrations >20 g/L. Consequently, the maximum tolerated concentration was 50% lower than when acetol was used as sole substrate, suggesting that a combination of both C-sources exerts a synergistic inhibitory effect. Similar results were obtained for the fungal malic acid production on mixtures of acetate and acetol, as 20 g/L was also determined to be the maximum concentration still suitable for malate formation, but the achieved titer was already significantly reduced by 40.9% compared to the acetate control (6.29 ± 0.46 g/L). However, even at lower acetol levels, a noticeable decrease in yield and productivity was observed with increasing ketone concentration. Accordingly, acetol does not seem to be beneficial for the fungal malic acid production and the ketone content in the PAC should therefore be kept as low as possible. After a pretreatment that resulted in reduction of the acetol content to <3 g/L, the PAC was successfully used for acid production with A. oryzae as a concentration of 3.37 ± 0.61 g/L malate was detected after 192 h of shake flask cultivation. Inhibition by alkaline pH proved to be a limiting factor in malic acid production on PAC, so setting the initial medium pH to 5.5 with H2SO4 and acetic acid significantly increased the malate titer to 8.30 ± 0.26 g/L and 9.77 ± 0.55 g/L, respectively. Using H2SO4 for pH adjustment, the process was then successfully transferred to 500 mL bioreactors and 99% of the acetic acid contained in the PAC was converted to 7.31 ± 0.29 g/L malate within 144 h, resulting in the highest overall productivity ever obtained (0.051 ± 0.002 g/(L∙h)). Therefore, further improvement of the process could possibly be achieved by establishing an automated pH control with PAC or acetic acid to simultaneously supply substrate and counteract pH inhibition.

Author Contributions

Conceptualization, C.K.; methodology, C.K.; investigation, C.K.; formal analysis, C.K.; resources, K.O.; writing—original draft preparation, C.K.; writing—review and editing, K.O.; visualization, C.K.; supervision, K.O.; project administration, K.O.; funding acquisition, K.O. All authors have read and agreed to the published version of the manuscript.

Funding

This research was funded by the Federal Ministry of Education and Research (BMBF, No.: 031B0673D). The authors also acknowledge the support by the KIT-Publication Fund of the Karlsruhe Institute of Technology.

Institutional Review Board Statement

Not applicable.

Informed Consent Statement

Not applicable.

Data Availability Statement

All data underlying the current work are included in the article and are also available from the corresponding author upon request.

Acknowledgments

The authors thank the Institute of Catalysis Research and Technology (IKFT) at KIT for providing the PAC used in this work.

Conflicts of Interest

The authors declare no conflict of interest.

References

  1. Grignard, R. New Quaternary Ammonium Salts of Malic Acid and Their Application in Cosmetics. U.S. Patent 3,954,846, 4 May 1976. [Google Scholar]
  2. Gore, V.; Gadkar, M.; Pokharkar, K. Novel Process to Prepare Almotriptan. U.S. Patent 2010/0292290 A1, 18 November 2010. [Google Scholar]
  3. Löffler, M.; Morschhäuser, R. Acid Cosmetic, Dermatological and Pharmaceutical Agents. U.S. Patent 7,025,973, 11 April 2006. [Google Scholar]
  4. Wu, X.; Chen, Z.; Li, Y.; Yu, Q.; Lu, Y.; Zhu, Q.; Li, Y.; An, D.; Qi, J.; Wu, W. Improving dermal delivery of hydrophilic macromolecules by biocompatible ionic liquid based on choline and malic acid. Int. J. Pharm. 2019, 558, 380–387. [Google Scholar] [CrossRef]
  5. El-Zaiat, H.M.; Kholif, A.E.; Mohamed, D.A.; Matloup, O.H.; Anele, U.Y.; Sallam, S.M.A. Enhancing lactational performance of Holstein dairy cows under commercial production: Malic acid as an option. J. Sci. Food Agric. 2019, 99, 885–892. [Google Scholar] [CrossRef] [PubMed]
  6. Ren, F.; Yang, W.; Hu, J.; Huang, P.; Jiao, X.-A.; Huang, J. Feeding Malic Acid to Chickens at Slaughter Age Improves Microbial Safety with Regard to Campylobacter. Animals 2021, 11, 1999. [Google Scholar] [CrossRef]
  7. Nguyen, D.H.; Seok, W.J.; Kim, I.H. Organic acids mixture as a dietary additive for pigs—A review. Animals 2020, 10, 952. [Google Scholar] [CrossRef] [PubMed]
  8. Kajiyama, T.; Kobayashi, H.; Taguchi, T.; Kataoka, K.; Tanaka, J. Improved synthesis with high yield and increased molecular weight of poly (α, β-malic acid) by direct polycondensation. Biomacromolecules 2004, 5, 169–174. [Google Scholar] [CrossRef] [PubMed]
  9. Wan, Y.; Feng, G.; Shen, F.H.; Balian, G.; Laurencin, C.T.; Li, X. Novel biodegradable poly (1, 8-octanediol malate) for annulus fibrosus regeneration. Macromol. Biosci. 2007, 7, 1217–1224. [Google Scholar] [CrossRef]
  10. Werpy, T.; Petersen, G. Top Value Added Chemicals from Biomass: Volume I—Results of Screening for Potential Candidates from Sugars and Synthesis Gas; National Renewable Energy Lab: Golden, CO, USA, 2004.
  11. Kövilein, A.; Kubisch, C.; Cai, L.; Ochsenreither, K. Malic acid production from renewables: A review. J. Chem. Technol. Biotechnol. 2020, 95, 513–526. [Google Scholar] [CrossRef] [Green Version]
  12. Presečki, A.V.; Zelić, B.; Vasić-Rački, Đ. Comparison of the L-malic acid production by isolated fumarase and fumarase in permeabilized baker’s yeast cells. Enzyme Microb. Technol. 2007, 41, 605–612. [Google Scholar] [CrossRef]
  13. Naude, A.; Nicol, W. Malic acid production through the whole-cell hydration of fumaric acid with immobilised Rhizopus oryzae. Biochem. Eng. J. 2018, 137, 152–161. [Google Scholar] [CrossRef]
  14. Pandurić, N.; Šalić, A.; Zelić, B. Fully integrated biotransformation of fumaric acid by permeabilized baker’s yeast cells with in situ separation of L-malic acid using ultrafiltration, acidification and electrodialysis. Biochem. Eng. J. 2017, 125, 221–229. [Google Scholar] [CrossRef]
  15. Bressler, E.; Pines, O.; Goldberg, I.; Braun, S. Conversion of fumaric acid to l-malic by sol-gel immobilized Saccharomyces cerevisiae in a supported liquid membrane bioreactor. Biotechnol. Progr. 2002, 18, 445–450. [Google Scholar] [CrossRef] [PubMed]
  16. Dai, Z.; Zhou, H.; Zhang, S.; Gu, H.; Yang, Q.; Zhang, W.; Dong, W.; Ma, J.; Fang, Y.; Jiang, M. Current advance in biological production of malic acid using wild type and metabolic engineered strains. Bioresour. Technol. 2018, 258, 345–353. [Google Scholar] [CrossRef] [PubMed]
  17. Li, X.; Liu, Y.; Yang, Y.; Zhang, H.; Wang, H.; Wu, Y.; Zhang, M.; Sun, T.; Cheng, J.; Wu, X. High levels of malic acid production by the bioconversion of corn straw hydrolyte using an isolated Rhizopus delemar strain. Biotechnol. Bioprocess Eng. 2014, 19, 478–492. [Google Scholar] [CrossRef]
  18. Zambanini, T.; Kleineberg, W.; Sarikaya, E.; Buescher, J.M.; Meurer, G.; Wierckx, N.; Blank, L.M. Enhanced malic acid production from glycerol with high-cell density Ustilago trichophora TZ1 cultivations. Biotechnol. Biofuels 2016, 9, 135. [Google Scholar] [CrossRef] [PubMed] [Green Version]
  19. Zambanini, T.; Sarikaya, E.; Kleineberg, W.; Buescher, J.M.; Meurer, G.; Wierckx, N.; Blank, L.M. Efficient malic acid production from glycerol with Ustilago trichophora TZ1. Biotechnol. Biofuels 2016, 9, 67. [Google Scholar] [CrossRef] [Green Version]
  20. Battat, E.; Peleg, Y.; Bercovitz, A.; Rokem, J.S.; Goldberg, I. Optimization of L-malic acid production by Aspergillus flavus in a stirred fermentor. Biotechnol. Bioeng. 1991, 37, 1108–1116. [Google Scholar] [CrossRef]
  21. Knuf, C.; Nookaew, I.; Brown, S.H.; McCulloch, M.; Berry, A.; Nielsen, J. Investigation of malic acid production in Aspergillus oryzae under nitrogen starvation conditions. Appl. Environ. Microbiol. 2013, 79, 6050–6058. [Google Scholar] [CrossRef] [Green Version]
  22. Ochsenreither, K.; Fischer, C.; Neumann, A.; Syldatk, C. Process characterization and influence of alternative carbon sources and carbon-to-nitrogen ratio on organic acid production by Aspergillus oryzae DSM1863. Appl. Microbiol. Biotechnol. 2014, 98, 5449–5460. [Google Scholar] [CrossRef] [PubMed]
  23. West, T.P. Malic acid production from thin stillage by Aspergillus species. Biotechnol. Lett 2011, 33, 2463–2467. [Google Scholar] [CrossRef]
  24. Iyyappan, J.; Bharathiraja, B.; Baskar, G.; Kamalanaban, E. Process optimization and kinetic analysis of malic acid production from crude glycerol using Aspergillus niger. Bioresour. Technol. 2019, 281, 18–25. [Google Scholar] [CrossRef]
  25. Dörsam, S.; Fesseler, J.; Gorte, O.; Hahn, T.; Zibek, S.; Syldatk, C.; Ochsenreither, K. Sustainable carbon sources for microbial organic acid production with filamentous fungi. Biotechnol. Biofuels 2017, 10, 242. [Google Scholar] [CrossRef] [PubMed] [Green Version]
  26. Oswald, F.; Dörsam, S.; Veith, N.; Zwick, M.; Neumann, A.; Ochsenreither, K.; Syldatk, C. Sequential mixed cultures: From syngas to malic acid. Front. Microbiol. 2016, 7, 891. [Google Scholar] [CrossRef] [PubMed]
  27. Pfitzer, C.; Dahmen, N.; Troger, N.; Weirich, F.; Sauer, J.; Gunther, A.; Muller-Hagedorn, M. Fast pyrolysis of wheat straw in the bioliq pilot plant. Energy Fuels 2016, 30, 8047–8054. [Google Scholar] [CrossRef]
  28. Hu, B.; Lu, Q.; Jiang, X.; Liu, J.; Cui, M.; Dong, C.; Yang, Y. Formation mechanism of hydroxyacetone in glucose pyrolysis: A combined experimental and theoretical study. Proc. Combust. Inst. 2019, 37, 2741–2748. [Google Scholar] [CrossRef]
  29. Shen, D.K.; Gu, S. The mechanism for thermal decomposition of cellulose and its main products. Bioresour. Technol. 2009, 100, 6496–6504. [Google Scholar] [CrossRef] [PubMed]
  30. Kiefer, D.; Merkel, M.; Lilge, L.; Hausmann, R.; Henkel, M. High cell density cultivation of Corynebacterium glutamicum on bio-based lignocellulosic acetate using pH-coupled online feeding control. Bioresour. Technol. 2021, 340, 125666. [Google Scholar] [CrossRef] [PubMed]
  31. Arnold, S.; Tews, T.; Kiefer, M.; Henkel, M.; Hausmann, R. Evaluation of small organic acids present in fast pyrolysis bio-oil from lignocellulose as feedstocks for bacterial bioconversion. GCB Bioenergy 2019, 11, 1159–1172. [Google Scholar] [CrossRef] [Green Version]
  32. Kiefer, D.; Merkel, M.; Lilge, L.; Henkel, M.; Hausmann, R. From acetate to bio-based products: Underexploited potential for industrial biotechnology. Trends Biotechnol. 2021, 39, 397–411. [Google Scholar] [CrossRef] [PubMed]
  33. Kövilein, A.; Umpfenbach, J.; Ochsenreither, K. Acetate as substrate for l-malic acid production with Aspergillus oryzae DSM 1863. Biotechnol. Biofuels 2021, 14, 48. [Google Scholar] [CrossRef]
  34. Dörsam, S.; Kirchhoff, J.; Bigalke, M.; Dahmen, N.; Syldatk, C.; Ochsenreither, K. Evaluation of Pyrolysis Oil as Carbon Source for Fungal Fermentation. Front. Microbiol. 2016, 7, 2059. [Google Scholar] [CrossRef]
  35. Lange, J.; Müller, F.; Bernecker, K.; Dahmen, N.; Takors, R.; Blombach, B. Valorization of pyrolysis water: A biorefinery side stream, for 1,2-propanediol production with engineered Corynebacterium glutamicum. Biotechnol. Biofuels 2017, 10, 277. [Google Scholar] [CrossRef] [PubMed] [Green Version]
  36. Lian, J.; Garcia-Perez, M.; Coates, R.; Wu, H.; Chen, S. Yeast fermentation of carboxylic acids obtained from pyrolytic aqueous phases for lipid production. Bioresour. Technol. 2012, 118, 177–186. [Google Scholar] [CrossRef]
  37. Kubisch, C.; Ochsenreither, K. Detoxification of a pyrolytic aqueous condensate from wheat straw for utilization as substrate in Aspergillus oryzae DSM 1863 cultivations. Biotechnol. Biofuels 2022, 15, 18. [Google Scholar] [CrossRef]
  38. Barratt, R.W.; Johnson, G.B.; Ogata, W.N. Wild-type and mutant stocks of Aspergillus nidulans. Genetics 1965, 52, 233. [Google Scholar] [CrossRef]
  39. Hill, T.W.; Kafer, E. Improved protocols for Aspergillus minimal medium: Trace element and minimal medium salt stock solutions. Fungal Genet. Rep. 2001, 48, 20–21. [Google Scholar] [CrossRef] [Green Version]
  40. Liang, Y.; Zhao, X.; Chi, Z.; Rover, M.; Johnston, P.; Brown, R.; Jarboe, L.; Wen, Z. Utilization of acetic acid-rich pyrolytic bio-oil by microalga Chlamydomonas reinhardtii: Reducing bio-oil toxicity and enhancing algal toxicity tolerance. Bioresour. Technol. 2013, 133, 500–506. [Google Scholar] [CrossRef] [PubMed]
  41. Zhao, X.; Chi, Z.; Rover, M.; Brown, R.; Jarboe, L.; Wen, Z. Microalgae fermentation of acetic acid-rich pyrolytic bio-oil: Reducing bio-oil toxicity by alkali treatment. Environ. Prog. Sustain. Energy 2013, 32, 955–961. [Google Scholar] [CrossRef]
  42. Zhao, X.; Davis, K.; Brown, R.; Jarboe, L.; Wen, Z. Alkaline treatment for detoxification of acetic acid-rich pyrolytic bio-oil for microalgae fermentation: Effects of alkaline species and the detoxification mechanisms. Biomass Bioenergy 2015, 80, 203–212. [Google Scholar] [CrossRef]
  43. Lian, J.; Chen, S.; Zhou, S.; Wang, Z.; O’Fallon, J.; Li, C.-Z.; Garcia-Perez, M. Separation, hydrolysis and fermentation of pyrolytic sugars to produce ethanol and lipids. Bioresour. Technol. 2010, 101, 9688–9699. [Google Scholar] [CrossRef] [PubMed]
  44. Cameron, D.C.; Cooney, C.L. A novel fermentation: The production of R (–)–1,2–propanediol and acetol by Clostridium thermosaccharolyticum. Biotechnology 1986, 4, 651–654. [Google Scholar] [CrossRef]
  45. Altaras, N.E.; Etzel, M.R.; Cameron, D.C. Conversion of Sugars to 1,2-Propanediol by Thermoanaerobacterium thermosaccharolyticum HG-8. Biotechnol. Progr. 2001, 17, 52–56. [Google Scholar] [CrossRef] [PubMed]
  46. Tran-Din, K.; Gottschalk, G. Formation of D (-)-1,2-propanediol and D (-)-lactate from glucose by Clostridium sphenoides under phosphate limitation. Arch. Microbiol. 1985, 142, 87–92. [Google Scholar] [CrossRef]
  47. Bennett, G.N.; San, K.-Y. Microbial formation, biotechnological production and applications of 1,2-propanediol. Appl. Microbiol. Biotechnol. 2001, 55, 1–9. [Google Scholar] [CrossRef] [PubMed]
  48. Inoue, Y.; Rhee, H.; Watanabe, K.; Murata, K.; Kimura, A. Metabolism of 2-oxoaldehyde in mold: Purification and characterization of two methylglyoxal reductases from Aspergillus niger. Eur. J. Biochem. 1988, 171, 213–218. [Google Scholar] [CrossRef] [PubMed]
  49. Schuurink, R.; Busink, R.; Hondmann, D.H.; Wltteveen, C.F.; Vlsser, J. Purification and properties of NADP+-dependent glycerol dehydrogenases from Aspergillus nidulans and A. niger. Microbiology 1990, 136, 1043–1050. [Google Scholar] [CrossRef] [PubMed] [Green Version]
  50. Walti, A. Action of Aspergillus niger on normal 1,2-diols. J. Am. Chem. Soc. 1934, 56, 2723–2726. [Google Scholar] [CrossRef]
  51. Murata, K.; Fukuda, Y.; Watanabe, K.; Saikusa, T.; Shimosaka, M.; Kimura, A. Characterization of methylglyoxal synthase in Saccharomyces cerevisiae. Biochem. Biophys. Res. Commun. 1985, 131, 190–198. [Google Scholar] [CrossRef]
  52. Nakamura, K.; Kondo, S.; Kawai, Y.; Nakajima, N.; Ohno, A. Amino acid sequence and characterization of aldo-keto reductase from bakers’ yeast. Biosci. Biotechnol. Biochem. 1997, 61, 375–377. [Google Scholar] [CrossRef]
  53. Jung, J.-Y.; Choi, E.-S.; Oh, M.-K. Enhanced production of 1,2-propanediol by tpil deletion in Saccharomyces cerevisiae. J. Microbiol. Biotechnol. 2008, 18, 1797–1802. [Google Scholar]
  54. Jung, J.-Y.; Yun, H.-S.; Lee, J.-W.; Oh, M.-K. Production of 1,2-propanediol from glycerol in Saccharomyces cerevisiae. J. Microbiol. Biotechnol. 2011, 21, 846–853. [Google Scholar] [CrossRef] [Green Version]
  55. Jeon, E.; Lee, S.; Kim, D.; Yoon, H.; Oh, M.; Park, C.; Lee, J. Development of a Saccharomyces cerevisiae strain for the production of 1, 2-propanediol by gene manipulation. Enzyme Microb. Technol. 2009, 45, 42–47. [Google Scholar] [CrossRef]
  56. Lee, W.; DaSilva, N.A. Application of sequential integration for metabolic engineering of 1,2-propanediol production in yeast. Metab. Eng. 2006, 8, 58–65. [Google Scholar] [CrossRef] [PubMed]
  57. Kometani, T.; Kitasuji, E.; Matsuno, R. Baker’s yeast mediated bioreduction. A new procedure using ethanol as an energy source. Chem. Lett. 1989, 1465–1466. [Google Scholar] [CrossRef]
  58. Kometani, T.; Kitatsuji, E.; Matsuno, R. Baker’s yeast mediated bioreduction: Practical procedure using EtOH as energy source. J. Ferment. Bioeng. 1991, 71, 197–199. [Google Scholar] [CrossRef]
  59. Kometani, T.; Yoshii, H.; Takeuchi, Y.; Matsuno, R. Large-scale preparation of (R)-1,2-propanediol through baker’s yeast-mediated bioreduction. J. Ferment. Bioeng. 1993, 76, 414–415. [Google Scholar] [CrossRef]
  60. Kometani, T.; Kitatsuji, E.; Matsuno, R. Bioreduction of ketones mediated by baker’s yeast with acetate as ultimate reducing agent. Agric. Biol. Chem. 1991, 55, 867–868. [Google Scholar]
  61. Yu, A.-N.; Tan, Z.-W.; Wang, F.-S. Mechanistic studies on the formation of pyrazines by Maillard reaction between L-ascorbic acid and L-glutamic acid. LWT Food Sci. Technol. 2013, 50, 64–71. [Google Scholar] [CrossRef]
  62. Alcano, M.D.J.; Jahn, R.C.; Scherer, C.D.; Wigmann, É.F.; Moraes, V.M.; Garcia, M.V.; Mallmann, C.A.; Copetti, M.V. Susceptibility of Aspergillus spp. to acetic and sorbic acids based on pH and effect of sub-inhibitory doses of sorbic acid on ochratoxin A production. Food Res. Int. 2016, 81, 25–30. [Google Scholar] [CrossRef]
  63. O’Mahony, R.J.; Burns, A.T.H.; Millam, S.; Hooley, P.; Fincham, D.A. Isotropic growth of spores and salt tolerance in Aspergillus nidulans. Mycol. Res. 2002, 106, 1480–1486. [Google Scholar] [CrossRef]
  64. Wang, Y.; Yan, H.; Neng, J.; Gao, J.; Yang, B.; Liu, Y. The Influence of NaCl and Glucose content on Growth and Ochratoxin A production by Aspergillus ochraceus, Aspergillus carbonarius and Penicillium nordicum. Toxins 2020, 12, 515. [Google Scholar] [CrossRef]
  65. Dörsam, S. Evaluation of Renewable Resources as Carbon Sources for Organic Acid Production with Filamentous Fungi. Ph.D. Thesis, Karlsruhe Institute of Technology, Karlsruhe, Germany, 2018. Available online: https://d-nb.info/115547435x/34 (accessed on 24 January 2022).
  66. Pinchai, N.; Juvvadi, P.R.; Fortwendel, J.R.; Perfect, B.Z.; Rogg, L.E.; Asfaw, Y.G.; Steinbach, W.J. The Aspergillus fumigatus P-type Golgi apparatus Ca2+/Mn2+ ATPase PmrA is involved in cation homeostasis and cell wall integrity but is not essential for pathogenesis. Eukaryot. Cell 2010, 9, 472–476. [Google Scholar] [CrossRef] [PubMed] [Green Version]
  67. Markina-Iñarrairaegui, A.; Spielvogel, A.; Etxebeste, O.; Ugalde, U.; Espeso, E.A. Tolerance to alkaline ambient pH in Aspergillus nidulans depends on the activity of ENA proteins. Sci. Rep. 2020, 10, 14325. [Google Scholar] [CrossRef] [PubMed]
  68. Halliwell, G. The Effect of Aeration on the Metabolism of Acetate by Aspergillus niger. J. Exp. Bot. 1953, 4, 369–376. [Google Scholar] [CrossRef]
  69. Brown, S.H.; Bashkirova, L.; Berka, R.; Chandler, T.; Doty, T.; McCall, K.; McCulloch, M.; McFarland, S.; Thompson, S.; Yaver, D. Metabolic engineering of Aspergillus oryzae NRRL 3488 for increased production of L-malic acid. Appl. Microbiol. Biotechnol. 2013, 97, 8903–8912. [Google Scholar] [CrossRef] [PubMed]
  70. Xu, Y.; Zhou, Y.; Cao, W.; Liu, H. Improved production of malic acid in Aspergillus niger by abolishing citric acid accumulation and enhancing glycolytic flux. ACS Synth. Biol. 2020, 9, 1418–1425. [Google Scholar] [CrossRef]
  71. Liu, J.; Li, J.; Liu, Y.; Shin, H.; Ledesma-Amaro, R.; Du, G.; Chen, J.; Liu, L. Synergistic rewiring of carbon metabolism and redox metabolism in cytoplasm and mitochondria of Aspergillus oryzae for increased L-malate production. ACS Synth. Biol. 2018, 7, 2139–2147. [Google Scholar] [CrossRef] [Green Version]
  72. Liu, J.; Xie, Z.; Shin, H.; Li, J.; Du, G.; Chen, J.; Liu, L. Rewiring the reductive tricarboxylic acid pathway and L-malate transport pathway of Aspergillus oryzae for overproduction of L-malate. J. Biotechnol. 2017, 253, 1–9. [Google Scholar] [CrossRef]
Figure 1. Substrate consumption and biomass formation of A. oryzae in shake flask precultures containing acetol concentrations of (A) 3 g/L; (B) 5 g/L; (C) 10 g/L; (D) 20 g/L; (E) 30 g/L; (F) 40 g/L as sole carbon source. The data represent mean values of three replicates and error bars indicate the standard deviation.
Fermentation 08 00107 g001
Figure 2. Comparison of growth in A. oryzae shake flask precultures containing (A) 40 g/L of acetate as sole carbon source as well as mixtures of acetate and acetol concentrations of (B) 3 g/L; (C) 5 g/L; (D) 10 g/L; (E) 20 g/L. The data represent mean values of three replicates and error bars indicate the standard deviation.
Fermentation 08 00107 g002
Figure 3. Malic acid production, substrate consumption, and pH values in A. oryzae shake flask main cultures containing mixtures of 40 g/L acetate and different concentrations (0–20 g/L) of acetol. The data represent mean values of four replicates and error bars indicate the standard deviation.
Fermentation 08 00107 g003
Figure 4. Malic acid production of A. oryzae in shake flask main cultures containing 100% PAC detoxified by rotary evaporation, overliming and a subsequent activated carbon treatment. The data represent mean values of four replicates and error bars indicate the standard deviation.
Fermentation 08 00107 g004
Figure 5. Optimization of the initial medium pH in A. oryzae shake flasks main cultures containing 100% detoxified PAC (original pH = 6.5). The pH of the PAC was either not adjusted or set to 5.5 prior to sterile filtration using 100% acetic acid or 96% H2SO4. The data represent mean values of quadruplicates and error bars indicate the standard deviation.
Fermentation 08 00107 g005
Figure 6. Bioreactor cultivations with A. oryzae using (A) 40 g/L acetate and (B) 100% detoxified PAC main culture medium. The initial medium pH was set to 5.5 using 96% H2SO4 prior to CaCO3 addition and a daily manual pH adjustment with 72% H2SO4 to a value <7.5 was performed starting after 72 h of fermentation. The data represent mean values of duplicates and error bars indicate the standard deviation.
Fermentation 08 00107 g006
Table 1. Substrate consumption and growth parameters after 96 h cultivation of A. oryzae using acetate-acetol mixtures.
c Acetol [g/L]Consumed
Acetate [g/L]
Consumed
Acetol [g/L]
Consumed
Substrate [g/L]
Final CDW [g/L]Yx/s 1 [g/g]
011.74 ± 1.180.00 ± 0.0011.74 ± 1.183.29 ± 0.210.28 ± 0.03
311.21 ± 0.492.77 ± 0.0013.97 ± 0.493.57 ± 0.350.26 ± 0.03
512.42 ± 1.574.38 ± 0.0116.80 ± 1.574.37 ± 0.360.26 ± 0.03
1015.09 ± 0.518.35 ± 0.1323.44 ± 0.534.46 ± 0.640.19 ± 0.03
209.71 ± 1.177.96 ± 0.9217.66 ± 1.493.47± 0.400.21 ± 0.02
1 The biomass yield Yx/s was calculated as g biomass formed per g substrate consumed.
Table 2. Comparison of substrate consumption and L-malate production in A. oryzae main cultures containing acetate-acetol mixtures.
c Acetol [g/L]Consumed
Acetate [g/L]
Consumed
Acetol [g/L]
Consumed
Carbon [g/L]
Final Malate
Titer [g/L]
Maximum Yield
Yp/s, Carbon 1 [g/g]
Maximum Productivity
P Max 1 [g/(L∙h)]
P Overall 2 [g/(L∙h)]
037.16 ± 1.580.00 ± 0.0015.12 ± 0.646.29 ± 0.46 0.18 ± 0.05 (96 h)0.046 ± 0.008 (96 h)0.026 ± 0.002
337.23 ± 1.892.73 ± 0.1216.47 ± 0.776.02 ± 0.170.15 ± 0.00 (144 h)0.039 ± 0.000 (144 h)0.025 ± 0.001
536.81 ± 0.684.51 ± 0.2017.17 ± 0.295.71 ± 0.380.14 ± 0.01 (144 h)0.037 ± 0.003 (144 h)0.024 ± 0.002
1034.57 ± 5.539.54 ± 0.2118.71 ± 2.255.64 ± 0.590.11 ± 0.02 (240 h)0.032 ± 0.008 (144 h)0.024 ± 0.002
2020.86 ± 2.8514.23 ± 1.4115.41 ± 1.353.72 ± 0.370.09 ± 0.01 (240 h)0.016 ± 0.002 (240 h)0.016 ± 0.002
1 The time at which the maximum value was reached is indicated in brackets. 2 Overall productivity P was calculated as final malate titer divided by the cultivation time of 240 h.
Table 3. Summary of substrate consumption and malic acid production in A. oryzae cultivations with PAC.
CultivationCondition Consumed
Acetate [g/L]
Maximum
Malate Titer [g/L]
Maximum Yield Yp/s 1 [g/g]Maximum Yield Yp/s, Carbon [g/g]Maximum
Productivity
P Max [g/(L∙h)]
Overall
Productivity P 2
[g/(L∙h)]
first shake flask
cultivation
pH not
adjusted
17.45 ± 3.013.37± 0.61 (192 h) 0.20 ± 0.05 (192 h)0.18 ± 0.05 (192 h)0.026 ± 0.006 (96 h) 0.013 ± 0.003
pH
optimization
in shake
flasks
pH not
adjusted
22.07 ± 4.693.96 ± 1.46 (240 h)0.18 ± 0.08 (240 h)0.16 ± 0.07 (240 h)0.026 ± 0.007 (96 h) 0.016 ± 0.006
pH
adjusted
with H2SO4
38.19 ± 0.758.29 ± 0.26 (240 h)0.22 ± 0.01 (192 h)0.19 ± 0.01 (192 h)0.054 ± 0.001 (144 h) 0.035 ± 0.001
pH
adjusted with
CH3COOH
42.82 ± 2.369.77 ± 0.55 (240 h)0.23 ± 0.03 (144 h)0.21 ± 0.02 (144 h)0.061 ± 0.002 (144 h) 0.041 ± 0.002
bioreactor
cultivations
acetate
control
29.71 ± 2.302.73 ± 0.47 (144 h)0.09 ± 0.02 (192)0.08 ± 0.02 (192)0.032 ± 0.008 (72 h)0.019 ± 0.003
PAC40.82 ± 0.377.30 ± 0.29 (144 h)0.18 ± 0.01 (144 h) 0.16 ± 0.01 (240)0.054 ± 0.010 (120 h)0.051 ± 0.002
1 The time at which the maximum value was reached is indicated in brackets. 2 The overall productivity was calculated as final malate titer divided by the cultivation time, which differed for the shake flask experiments (240 h) and the reactor cultivations (144 h).
Publisher’s Note: MDPI stays neutral with regard to jurisdictional claims in published maps and institutional affiliations.

