Article

Assessment of Lemon Juice Starter Addition on Secondary Fermented Soy Sauce

1
Department of Hospitality Management, MingDao University, Changhua 523, Taiwan
2
Department of Food Science, Tunghai University, Taichung 407, Taiwan
3
Science and Technology Management Institute, DePaul University, Lawrenceville, VA 23868, USA
*
Author to whom correspondence should be addressed.
Fermentation 2022, 8(2), 73; https://doi.org/10.3390/fermentation8020073
Submission received: 31 December 2021 / Revised: 30 January 2022 / Accepted: 7 February 2022 / Published: 9 February 2022

Abstract

:
Soy sauce is one of the most popular ingredients for delicious cuisines across the world, and it is made via various fermentation processes using wheat and soybeans. The purpose of this study was to add a lemon juice starter into secondary fermentation soy sauce to produce a new flavor of soy sauce to meet current health awareness and innovation market trends. The results showed that the lactic acid bacteria of the A group (soy sauce/starter culture ratio of 3:1) gradually decreased from 9.89 to 8.32 log CFU/mL by the seventh day, and then to 5.39 log CFU/mL by the 30th day, while they were not detected by the 60th day. Meanwhile, those of the B group (soy sauce/starter culture ratio of 1:1) showed a decrease from 10.39 to 8.58 log CFU/mL by the seventh day, and then to 5.39 log CFU/mL by the 30th day and 4.43 log CFU/mL by the 60th day, while they were not detected by the 90th day. As for yeast, the A group showed a decrease from 10.83 to 9.29 log CFU/mL (or 10.25 to 9.27 log CFU/mL for the B group) by the seventh day. Yeasts were not detected after 30 days in either the A or B group. The acidity and salinity of the lemon-flavored sauce was maintained after secondary fermentation. Sensory evaluation showed that the soy sauce with a lemon juice starter was accepted by consumers and obtained a better result than commercial soy sauce. In conclusion, secondary fermentation with starters contributes to the flavor quality of sauce products. Fruit juice is adjustable in terms of the acidity and salinity of the soy sauce and produces good flavor after secondary fermentation whenever it acts as a starter. The fact that customers favored the innovative lemon-flavored soy sauce indicates that this study is on the right trend.

1. Introduction

Soy sauce is a traditional Asian fermented seasoning with a unique flavor. Therefore, the global sales of soy sauce are increasing year on year [1]. There are three methods for producing soy sauce, including the traditional method, the rapid fermentation method, and the mixing method. For the traditional method, soybeans, wheat, salt, and koji undergo six months of fermentation, while rapid fermentation uses defatted soybeans rather than soybean-hydrolyzed plant-based proteins with hydrochloric acid, which is also called acid hydrolysis. The mixing method is carried out by hydrolyzing the ingredients and then fermenting them with microorganisms. However, the traditional method of making soy sauce is still the most popular among consumers.
The soy sauce market has gradually increased in recent years, not only in Asia, but also in American and European countries—using different materials and fermentation processes—which has resulted in the development of many different soy sauce flavors. In addition, modern consumers pay more attention to health awareness, including reducing their sodium intake; therefore, soy sauce with a reduced salt content has become a new trend, and among such soy sauces, fruit-flavored soy sauce (e.g., grapefruit, banana, and passion fruit) has been produced, impressing and providing choices for consumers. The purpose of this study was to raise awareness of the need of customers to implement the idea of reduced salt and the addition of lemon flavoring in the secondary fermentation process for soy sauce to meet current health awareness and the innovative market environment.
Moreover, past studies have shown that Pichia guilliermondii added into soy sauce mash is able to produce phenolic volatiles, while Zygosaccharomyces rouxii is able to produce 4-hydroxy-2-ethyl- 5-methyl-3-furanone (HEMF) and 4-hydroxy-2,5-dimethyl-3-furanone (HDMF) [2]. During fermentation, yeast performs glycolysis, converting pyruvate to alcohol and aroma compounds; however, each yeast or lactic acid bacteria species produces a different flavor [3]. Heterolactic acid bacteria produces lactic and acetic acids during the fermentation process, so the expressed aroma components are more complicated [4]. Besides yeast, lactic acid bacteria are used as a starter for fermentation in soy sauce. Previous literature indicates that a suitable microbial starter culture used in fermentation will produce a product with a desirable flavor [2]. Secondary fermentation usually takes place in wine, beer, cheese, and chocolate production, while in soy sauce, it is still rare [5,6,7,8]. However, secondary fermentation is responsible for the diversity in flavor of soy sauce [3]; thus, this step is considered important in making soy sauce.
Lemon is one of the most popular citrus fruits. It has a unique flavor and is often used in sports drinks. Lemon has lots of phenolic compounds, such as flavonoids and limonin [9], which contain antioxidant, anti-inflammatory, and free-radical-scavenging characteristics [10]. The area populated by lemon crops reaches 46,000 hectares each year. Recently, there have been many studies indicating the benefits and processability of lemons, including lemon juice, slices, liquor, and fermented products. Previous literature states that fermented lemon with lactic acid bacteria is able to improve the quality of such products [7]. However, studies on fermented lemon juice in soy sauce are still rare in the food industry. Therefore, in this study, lemon juice was first fermented with yeast and a lactic acid bacteria starter and then used for secondary fermentation in a reduced salt soy sauce to investigate the physicochemical and flavor changes.

2. Materials and Methods

2.1. Sample Preparation

2.1.1. Starter Culture Preparation

The lemon juice had to be adjusted to suitable fermentation conditions. Reverse-osmosis (RO) water was used to dilute the lemon juice to an acidity of 0.5%, and sodium citrate was used to adjust pH to 5 and the sugar level to 25 °Brix. Then, 1% yeast powder and 1% lactic acid bacteria (Lactobacillus plantarum) were added to the lemon juice and left to ferment until the stationary phase.

2.1.2. Secondary Fermentation

This step combined the starter culture prepared previously and the raw soy sauce for secondary fermentation. The raw soy sauce and starter culture were combined at different ratios (soy sauce/starter culture), including groups A (3:1) and B (1:1). The control group used a mix of soy sauce and fresh lemon juice. Salinity was controlled at 12% and 8%. Samples were taken every 30 days during secondary fermentation.

2.2. Sample Analysis

2.2.1. Analysis of Amino Nitrogen

One gram of the sample was added to 20 mL of RO water and then underwent water bath shaking at 125 rpm for 1 h. Next, 25 mL was quantified after being vacuum-filtered through Whatman No. 4 filter paper. Analysis was carried out by titration using 0.05 N NaOH with 5 mL of the sample, 4 mL of formaldehyde (pH 8.5), 4 mL of RO water, and a few drops of phenolphthalein as indicator, while the control group used 5 mL of the sample with 8 mL of RO water. Amino nitrogen was calculated using the formula below:
Amino nitrogen (%) = (a − b) × F × 0.0007 × D/5 × 1/S × 100
  • S: Sample weight (g)
  • a: Endpoint titration volume of sample
  • b: Endpoint titration volume of blank
  • F: Factor of titrant
  • D: Total volume of sample after dilution (mL)

2.2.2. Analysis of Enzyme Activity

  • Crude enzyme liquid preparation
Ten grams of the sample was weighted, and then, 90 mL of 1% NaCl was added, extracted with ultrasonication for 1 h and vacuum-filtered through Whatman No. 4 filter paper.
b.
Analysis of amylase activity
One milliliter of crude enzyme, 1 mL of 1% soluble starch solution, and 1 mL of 0.2 M buffer solution (pH 5.0) were reacted in a 50 °C water bath for 30 min, then ended with 0.5 mL of 1 N NaOH. Next, 0.5 mL of the solution was reacted with 0.5 mL of DNS solution in 100 °C water bath for 5 min and mixed well with 3 mL of RO water after cooling. The absorbance of the solution was then tested under 540 nm. The unit of enzyme activity is expressed as Unit, and the amount of enzyme that produced 1 mg of glucose per gram of sample within 30 min is defined as one unit of amylase activity [11].
c.
Protease activity
According to method of Arima, with some modifications, sodium caseinate was used as the substrate and tyrosine as the standard [12]. First, 1 mM of tyrosine solution (0.25, 0.50, 0.75, 1.00, and 1.25 mL) was used to quantify to 2.5 mL with 0.2 N HCl in a test tube, then 5 mL of 1 N NaOH and 1.5 mL of Folin–Ciocalteu reagent were added and reacted for 15 min and then tested by a spectrophotometer at 578 nm. For sample analysis, 1 mL of the crude enzyme solution and enzyme activity test substrate solution each were reacted for 30 min at 37 °C in a water bath. After this, 5 mL of a 5% TCA solution was added and filtered through filter paper. Then, 2.5 mL of the solution was reacted with 5 mL of 1 N NaOH and 1.5 mL of Folin–Ciocalteu reagent for 15 min and tested under 578 nm. The unit of enzyme activity is expressed in U, which is the amount of enzyme required to decompose casein and release 1 mM tyrosine per minute. The enzyme activity test matrix solution was prepared as 1 g of sodium caseinate and 3 mL of 1 N NaOH dissolved in 5 mL of RO pure water. Next, 2 mL of phosphate buffer (1 M, pH 7.5) and 30 mL of RO water were added, and then 1 N NaOH was used to adjust the pH to 10, and finally to quantify to 50 mL with reverse-osmosis pure water.

2.2.3. pH Value

According to Devanthi and Gkatzionis’s method, the well-mixed sample was tested by a pH meter [13].

2.2.4. Titrable Acidity

According to the CNS 8626 method, 10 mL of the sample was quantified with RO water to 100 mL. Then, 25 mL of the sample with 0.3–0.5 mL of phenolphthalein indicator was titrated with 0.1 N NaOH until a pale pink color appeared for 15 s. The result was calculated with the formula below:
g/100 mL= [(A × B × F × D) ÷ C] × 100/E × 100%
  • A: Titration volume of NaOH
  • B: Concentration of NaOH
  • C: Volume of sampling
  • D: Equivalent to 1 mL of organic acid (g) in 0.1 N NaOH (calculated with lactic acid, 0.009)
  • E: Original volume of the sample
  • F: Factor of the titrant

2.2.5. Color

The color of the sample was determined by the refraction of the colorimeter. The changes IN the L, a, and b values during fermentation were recorded. L represents the lightness of the sample, a represents the red-green color of the sample, and b represents the blue-yellow color of the sample. The color was determined by the supernatant of the sample after centrifugation at 5200 rpm and 10 °C.

2.2.6. Salinity

The salinity of the sample was determined according to CNS 6246 method. The sample was filtered, then 1 mL was drawn and quantified to 500 mL. After this, 25 mL of the sample solution was added to 100 mL of RO water and 1 mL of 10% K2CrO4 of the indicator, then titrated with 0.02 N AgNO3 until a red-brown color was formed.
NaCl (%) = (F × V × 0.00117 × DF) ÷ W × 100
  • F: Factor of 0.02 N AgNO3
  • V: Volume used in titration
  • DF: Dilution factor

2.2.7. Reducing Sugar

Reducing sugar was determined by the method of Miller. A co-thermal reaction occurred when reducing sugar and 3,5-dinitrosalicylic acid of the DNS solution reacted. Under alkaline conditions, Cu2+ was reduced to Cu2+, formed a red residue, and was tested under 540 nm. The color was proportional to the concentration of reducing sugar [11].
One milliliter of the sample was quantified with 10 mL of RO water; then, 2 mL of the solution was diluted with 2 mL of the DNS solution, dissolved under heat, made up to 100 mL in volume, and then placed in a 100 °C water bath for 15 min before being made up to 100 mL in volume again. Then, the absorbance at 540 nm was determined.

2.2.8. Microbial Determination

  • Yeast Count
Using a modified version of the method of Singracha et al. [2], peptone diluent was sterilized at 121 °C for 15 min and cooled after the sterilization had been completed. Then, 1 mL of the sample was serially diluted with peptone diluent, after which 0.1 mL of solution was placed with the medium for 72 h of incubation. The colonies were then counted [2].
b.
Lactic acid bacterial count
The pour plate method was used with selective lactobacilli MRS medium, where peptone diluent was sterilized at 121 °C for 15 min and cooled after sterilization had been completed. Then, 1 mL of peptone diluent was serially diluted and placed to incubate for 72 h at 35–37 °C. The colonies were then counted.

2.2.9. Sensory Evaluation

Soy sauce samples with yeast and lactic acid underwent the nine-point hedonic scale test. Then, 20 consumer test panels evaluated the overall, appearance, aroma, flavor, taste, and aftertaste acceptance of the samples. The score was scaled from one to nine points, where 1 represented weak (disliked), 5 represented medium (liked), and 9 represented strong (very liked).

2.3. Statistical Analysis

All results are shown as mean ± standard deviation and obtained through triplicates. The results obtained were statistically analyzed by one-way ANOVA (SPSS) and possessed Duncan’s multiple range test (p < 0.05).

3. Results

3.1. Lemon Juice Starter Culture

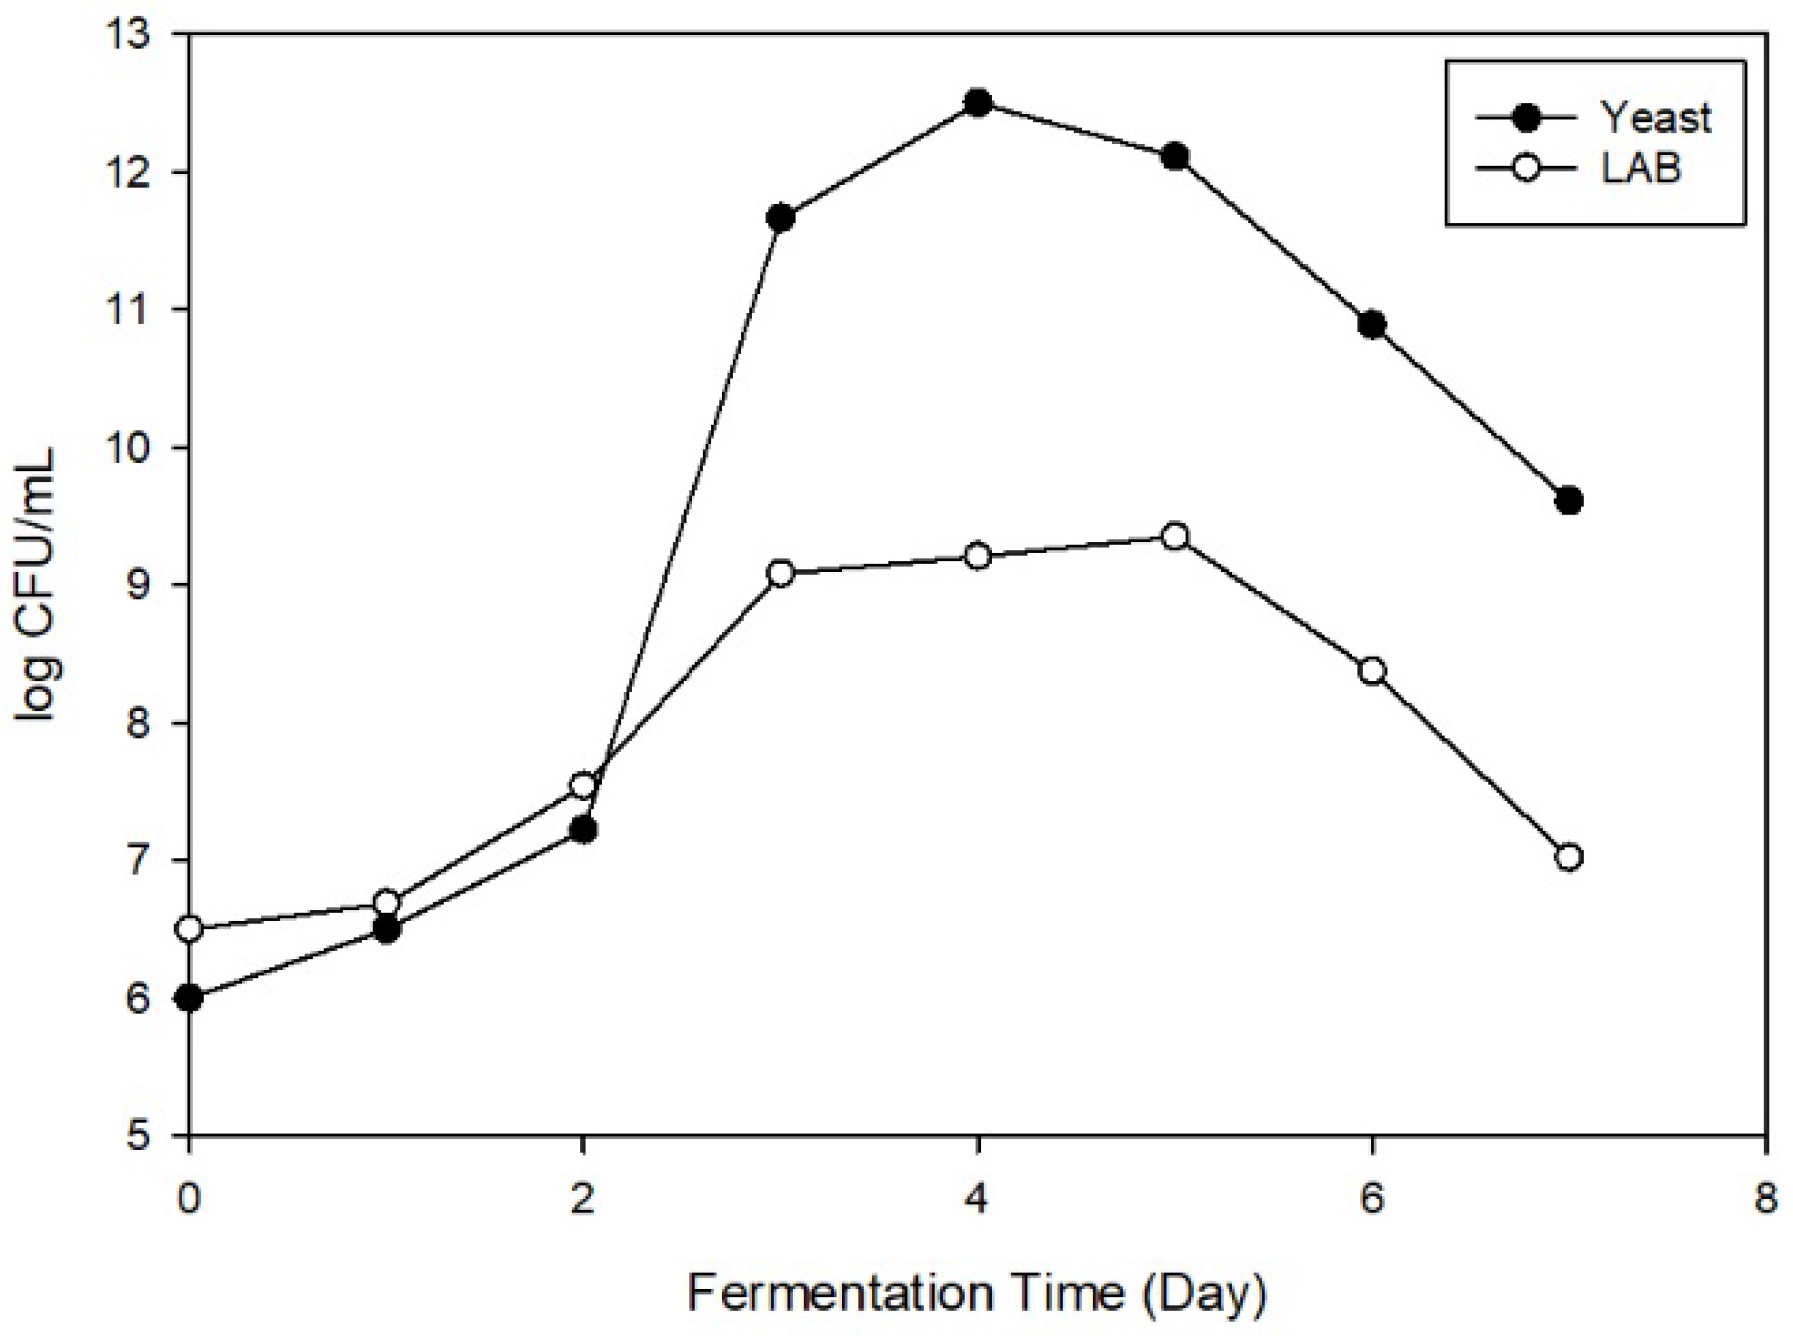
3.1.1. Total Plate Count of Lactic Acid Bacteria and Yeast

The acidity and pH value affected the growth of microorganisms directly. During the fermentation of lemon juice (acidity 6.22, pH 2.05), the yeast and lactic acid bacteria showed a decrease of 1 log every 24 h.
From the previous study, the suitable growth conditions of yeast were a pH value between 4.0 and 6.0; if the pH range was exceeded, the yeast growth was inhibited. Meanwhile, the lactic acid bacteria needed a pH of 5.0–7.0 to produce lactic acid [14]. From Figure 1, the adjusted lemon juice culture with yeast and lactic acid bacteria increased along with the fermentation day. Yeast entered the log growth phase on the second day of fermentation and reached the maximum number of 12.54 log (CFU/mL) on the fifth day; meanwhile, lactic acid bacteria entered the stationary phase on the second day and had the highest number of 9.32 log (CFU/mL), before entering the death phase.

3.1.2. Sugar Content

Aldonic acid and aldaric acid can be used to reduce sugar, and all disaccharides such as maltose and lactose and monosaccharides such as glucose, galactose, and fructose are also reducing sugars. Yeast uses sugar to produce ethanol and CO2 as metabolites. The results, as shown in Figure 2A, indicate that both alcoholic and lactic acid fermentation were used, with the reducing sugar content in the alcoholic fermentation decreasing from 4.91 to 1.45 mg/mL and that in lactic acid fermentation decreasing from 5.02 to 2.68 mg/mL. This shows a disproportionate relationship with the plate count.

3.1.3. pH Values

During fermentation, the pH value has a great influence on the growth of microorganisms, and the pH regulation is able to suppress or promote the growth of microorganisms. The changes in pH value in the alcoholic and lactic acid fermentation are shown in Figure 2B. Both fermentations started at pH 5.89–5.90 and indicated a decreasing trend within the fermentation period; however, the alcoholic fermentation did not produce acid. Hence, the pH value decreased from 5.89 to 5.40 during 0–10 days of fermentation and may have been contaminated by other bacteria, while lactic acid fermentation indicated a stably decreasing pH trend from 5.90 to 4.80 during 0–7 days of fermentation. This is because the metabolites of lactic acid bacteria include organic acid, such as acetic, lactic, and propionic acid.

3.1.4. Titratable Acid

The titratable acid is defined as the total acid in food and is called the total acidity. The concentration is usually determined by using titration (with NaOH as the standard alkaline solution). Figure 2C shows the changes in titratable acid of alcoholic and lactic acid fermentation. As alcoholic fermentation did not produce acid, the acidity had a decreasing trend. This may be due to the contamination of other bacteria during fermentation causing a rise from 0.5% to 0.8% (calculated with citric acid). In lactic acid fermentation, the lactose converted to lactic acid; hence, the pH value after fermentation was raised from 0.5% to 1.6% (calculated by lactic acid) within seven days (Figure 2C).

3.2. Secondary Fermentation of Soy Sauce

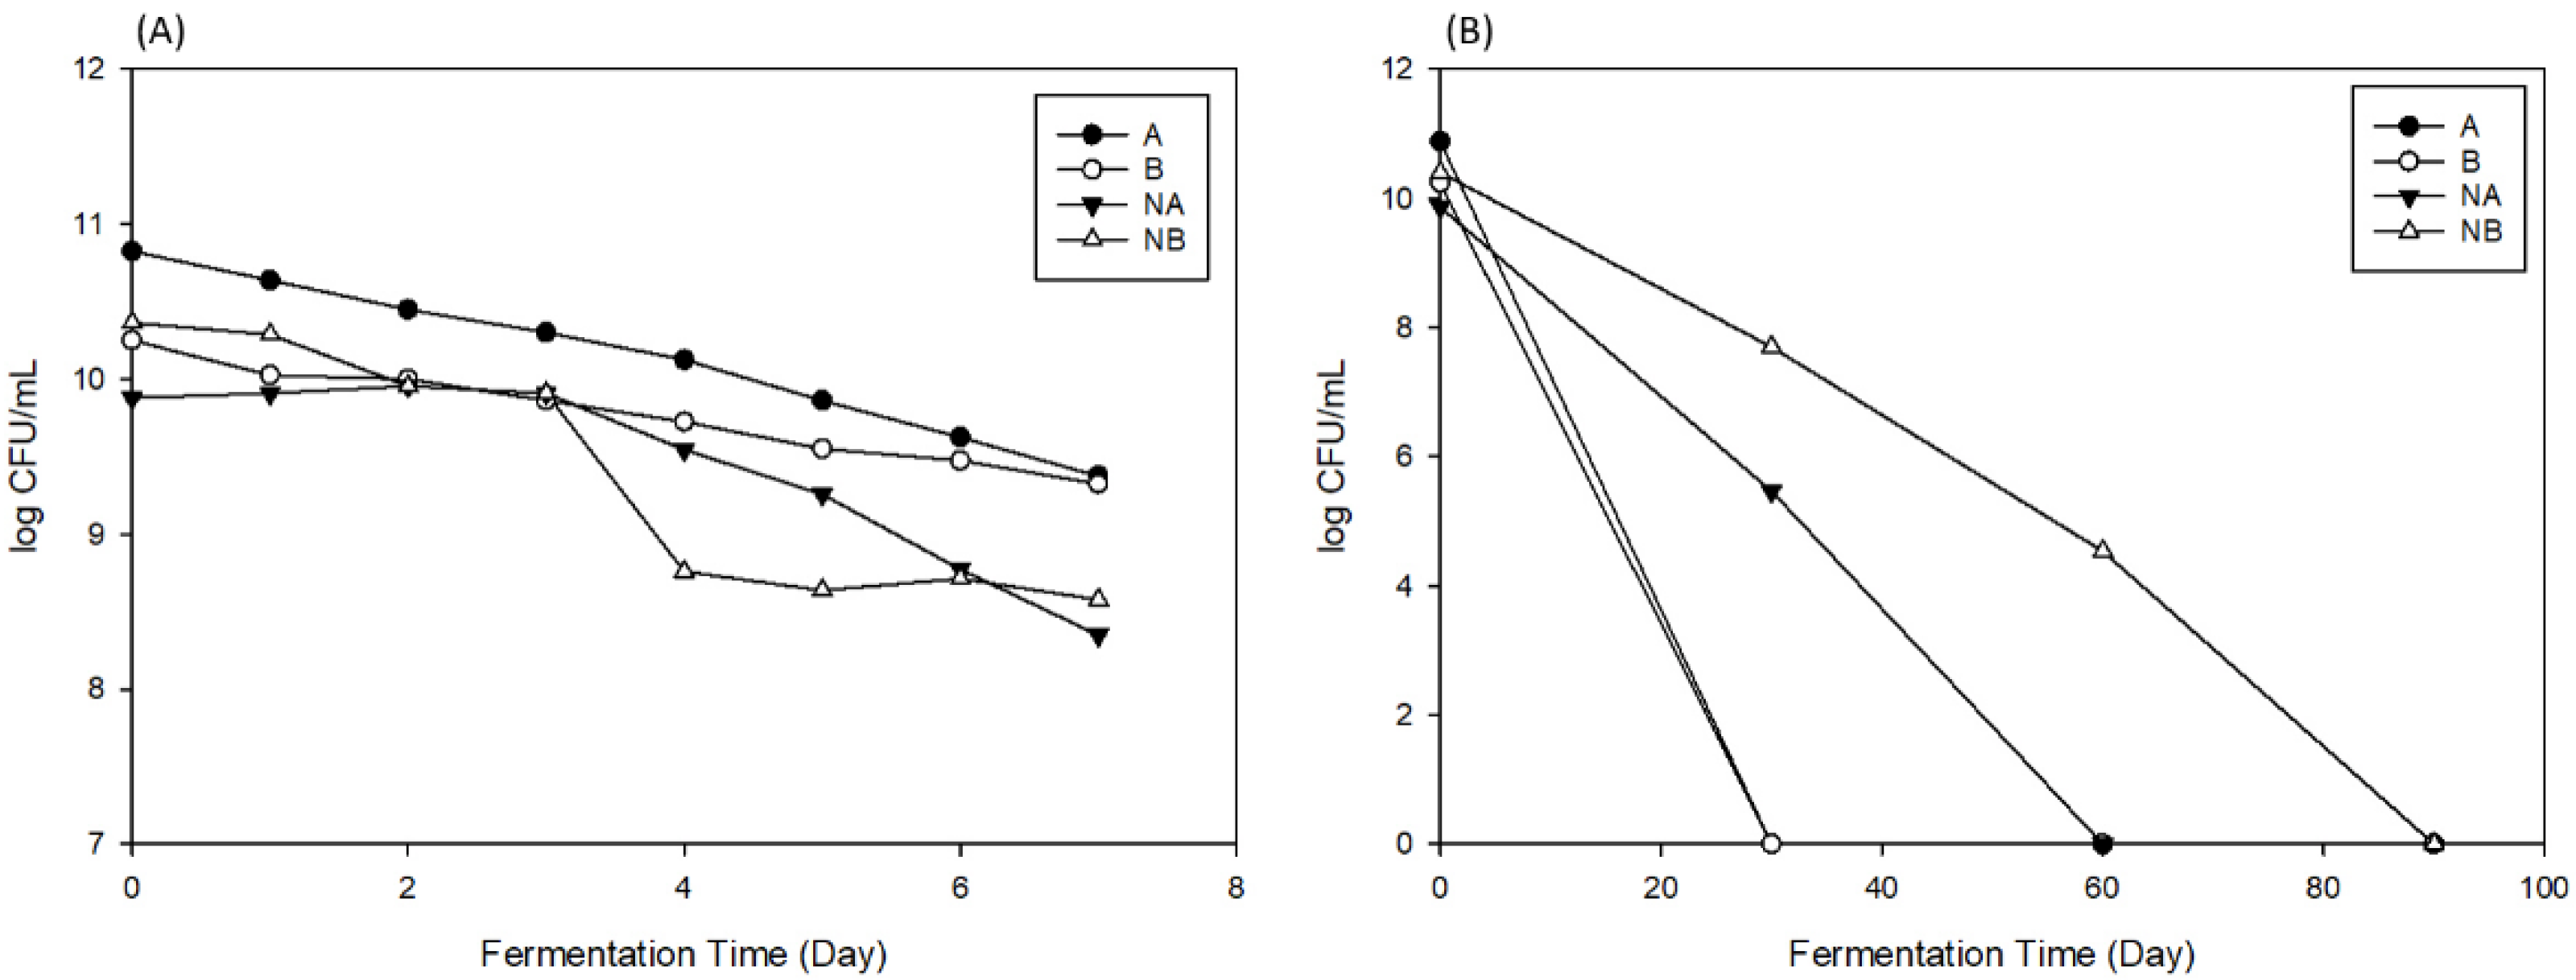
3.2.1. Bacterial Count

Raw soy sauce refers to the press-fermented moromi, which contains undecomposed sugar and protein that fuel microorganisms’ metabolism. During fermentation, the salinity is the important factor affecting the physical and chemical changes of microorganisms [15]. As shown in Figure 3, the yeast count in Figure 3A and B was 10.83 and 10.25 log (CFU/mL), respectively, on Day 0, while the lactic acid bacteria in Figure 3A and B was 9.89 and 10.39 log (CFU/mL), respectively. However, on Day 30, the yeast was dead in both groups, and the lactic acid showed 5.39 and 7.39 log (CFU/mL) in Figure 3A and B, respectively. When fermentation reached Day 60, the lactic acid bacteria in Figure 3A was dead, while there was 4.43 log (CFU/mL) in Figure 3B; meanwhile, the lactic acid bacteria in group Figure 3B was dead on Day 90. With an increase in fermentation time, the yeast and lactic acid bacteria had a falling trend, but lactic acid bacteria are able to live longer, as they are halotolerant and have a better tolerance to salt solutions. Thus, microorganisms’ physiological activity performed better at 8% salinity than at 12%. Yeast produces amino acids, vitamins, and pyruvates during fermentation which provide nutrients for lactic acid bacteria [16].

3.2.2. Enzymatic Activity

Amylase is able to decompose macromolecule sugar to micromolecules for microbiological usage [17], while protein decomposes to produce peptides and amino acids to enhance the flavor, and the increase in protease activity leads to a shorter fermentation period. Figure 4 shows the results of the enzyme activity during secondary fermentation. The A and B groups’ amylase showed an initial activity of 428 and 372 (unit/g), while this activity increased to 526 and 428 (unit/g) by Day 7. Meanwhile, protease showed an initial activity of 20 and 15 (unit/g) for groups A and B, respectively, then resulted in 21 and 14 (unit/g) by Day 7. Microorganisms produced amylase as products and the starter culture contained sugar; hence, the enzyme activity indicated a rising trend and the amount of carbohydrates improved the amylase activity. Hydrolysis of the protein affected the activity of protease, and thus, the activity did not change within the fermentation period, which was also because of the protein in soy sauce being lower and the fact that no extra addition of protein took place [18].

3.2.3. Amine Nitrogen Content

Amine nitrogen is one of the indications of fermented soy products. Reduced sugar, aldehydes, and the amine group undergo dehydration, and hence, a higher amount represents a higher amount of protein and amino acids, with glutamic acid and salt being the main flavors and which can affect the Maillard reaction of soy sauce. According to CNS 423, Grade A soy sauce should contain an amine nitrogen concentration of 0.56 g/100 mL, while in samples of groups A and B, the initial amine nitrogen content was 0.873 and 0.693 g/100 mL, respectively. The amine nitrogen concentration slightly increased to 0.905 and 0.773 g/100 mL by Day 90 (Table 1).

3.2.4. Reducing Sugar Content

The reducing sugar hydrolyzed to glyceraldehyde, fructose, glucose, etc., with the action of amylase [13]. Yeasts and lactic acids need sugars for growth and metabolism; the amount of reducing sugar allows us to determine the effect of the decomposition and sugar consumption of microorganisms. The reducing sugar during fermentation was 5%, and the initial amount of reducing sugar of groups A, B, NA, and NB was 22, 20, 1.27 and 0.72 mg/mL, respectively (Figure 5A). Along with the fermentation period, the reducing sugar decreased. Group A did not show a significant change within fermentation Days 60–90, while group B showed a decreasing trend. However, at the end of the fermentation, the reducing sugar of both groups reduced slowly. This was due to the salt concentration of soy sauce, which led to the dehydration of cells. However, groups NA and NB resulted in an increase by Day 90, which might be due to the leftover microorganisms in soy sauce decomposing the carbohydrates of lemon into monosaccharides [13].

3.2.5. Color Parameter

The color of soy sauce is one of the indications for consumers. The color determination is indicated as L, a, and b values, where the L value represents the lightness, the a value represents red-green color, and the b value represents yellow-blue color. Color changes are mainly due to the production of amino acids and sugars of the Maillard reaction, which is nonoxidative and nonenzymatic and produces melanoidin [19]. Figure 6 shows the results of the color changes. The initial colors of groups A, B, NA, and NB were 4.89, 3.72, 1.40, and 1.98 (L value); 6.52, 6.02, 2.58, and 2.00 (a value); and 3.29, 5.88, 0.42, and 0.56 (b value), respectively. After 90 days of fermentation, the colors of the soy sauce were 8.98, 11.62, 12.62, and 6.28 (L value); 6.37, 4.38, 6.92, and 4.38 (a value); and 4.22, 5.70, 4.28, and 6.25 (b value), respectively. The color of the soy sauce within the 90 days of fermentation indicated increasing and decreasing trends, but still showed a brighter color. This is caused by the color of lemon peel, which has a brighter color and contains soluble chlorophyll [20].

3.2.6. pH Value and Acidity

Acidity is one of the important indicators of fermented foods [21]. The decomposition and degradation of sugars produce acid; thus, the acidity is related to amylase [22]. Figure 5B,C show the results of the acidity and pH values. Groups A, B, NA, and NB showed an initial acidity and pH of 3.68%, 4.70%, 3.80%, a 2.90% and 4.39, 4.01, 4.09, and 3.82, respectively. Then, the acidity decreased as the fermentation time increased (1.98%, 2.70%, 2.80%, and 2.00%); meanwhile, the pH values of groups A and B increased to 4.52 and 4.13, respectively. This is because the organic acid esterified with the OH group of the soy sauce to produce esters; hence, the acidity decreased and the pH value increased. However, it may have also been due to the relationship with the metabolite of lactic acid (lactic acid and acetic acid). The lactic acid and Z. rouxii would decrease the acidity and reduce the production of organic acid. The starter culture chosen for secondary fermentation was not halotolerant and did not cause death during the fermentation period; therefore, there were no changes in pH value and acidity.

3.2.7. Sensory Evaluation

The results of the sensory evaluation of the soy sauce with yeast and lactic acid are shown in Figure 7. The soy sauce with yeast and lactic acid showed higher acceptance than commercially sold soy sauce. For overall acceptance, the soy sauce with LAB had the highest score, while the appearance did not show significant changes among three groups. This means that although lemon juice was added to the soy sauce, there was no effect on the appearance. However, for aroma, the lemon juice enhanced the smell and flavor of the soy sauce and was acceptable to consumers. The soy sauce with yeast and lactic acid bacteria were both had higher scores than commercially sold soy sauce. For taste acceptance, there were no significant differences among them.

4. Conclusions

Lemon juice (0.5% acidity, pH 5) was used as a starter to evaluate the maximum bacterial count in alcoholic and lactic acid fermentation. The fermentation resulted in maximum bacterial counts on days 4 (alcoholic fermentation) and 5 (lactic acid fermentation). In secondary fermentation, lactic acid was found to have a greater salt tolerance than yeast, and had a higher activity in a lower salt concentration environment. The amine nitrogen, protease activity, salinity, and pH after 90 days of fermentation with or without the starter did not show significant changes. In conclusion, a lower-salt-tolerance bacterium chosen for fermentation was hard to maintain during fermentation, but it still enhanced the flavor and may have controlled the acidity within 2–3%, requiring a pH lower than 4.5 to inhibit the growth of microorganisms.

Author Contributions

Conceptualization, Y.-H.C. and J.-Y.C. (Ju-Yun Chien); methodology, G.C.W.L., J.-Y.C. (Ju-Yun Chien) and L.-S.H.; validation, L.-S.H., S.-D.W. and J.-Y.C. (Jhih-Ying Ciou); formal analysis, Y.-H.C.; writing—original draft preparation, Y.-H.C., G.C.W.L. and J.-Y.C.; writing—review and editing, J.-Y.C. (Jhih-Ying Ciou); supervision, S.-D.W. and J.-Y.C. (Jhih-Ying Ciou). All authors have read and agreed to the published version of the manuscript.

Funding

This research was supported in part by a research grant from the Ministry of Science and Technology, Taiwan (MOST 110-2313-B-029-001-MY3 to LSH).

Institutional Review Board Statement

Not applicable.

Informed Consent Statement

Not applicable.

Data Availability Statement

Data are contained in the main article.

Acknowledgments

We thank Li-Hsien Chen for valuable discussion during soy sauce fermentation.

Conflicts of Interest

The authors declare no conflict of interest.

References

  1. Zhao, G.; Ding, L.L.; Hadiatullah, H.; Li, S.; Wang, X.; Yao, Y.; Liu, J.; Jiang, S. Characterization of the Typical Fragrant Compounds in Traditional Chinese-Type Soy Sauce. Food Chem. 2020, 312, 126054. [Google Scholar] [CrossRef] [PubMed]
  2. Singracha, P.; Niamsiri, N.; Visessanguan, W.; Lertsiri, S.; Assavanig, A. Application of Lactic Acid Bacteria and Yeasts as Starter Cultures for Reduced-Salt Soy Sauce (Moromi) Fermentation. LWT-Food Sci. Technol. 2017, 78, 181–188. [Google Scholar] [CrossRef]
  3. Wah, T.T.; Walaisri, S.; Assavanig, A.; Niamsiri, N.; Lertsiri, S. Co-Culturing of Pichia Guilliermondii Enhanced Volatile Flavor Compound Formation by Zygosaccharomyces Rouxii in the Model System of Thai Soy Sauce Fermentation. Int. J. Food Microbiol. 2013, 160, 282–289. [Google Scholar] [CrossRef] [PubMed]
  4. Frazier, W.C.; Westhoff, D.C. Food Microbiology; McGraw-Hill: New York, NY, USA, 1988; pp. 98–102. [Google Scholar]
  5. Hsieh, C.Y.; Ciou, J.Y.; Shih, M.K.; Hsieh, S.L.; Huang, Y.W.; Chen, M.H.; Hou, C.Y. Effect of Lemon Water Vapor Extract (LWAE) from Lemon Byproducts on the Physiological Activity and Quality of Lemon Fermented Products. Int. J. Food Prop. 2021, 24, 264–276. [Google Scholar] [CrossRef]
  6. Canonico, L.; Comitini, F. Torulaspora Delbrueckii for Secondary Fermentation in Sparkling Wine Production. Food Microbiol. 2018, 74, 100–106. [Google Scholar] [CrossRef] [PubMed]
  7. Daly, D.F.M.; Mcsweeney, P.L.H.; Sheehan, J.J. Split Defect and Secondary Fermentation in Swiss-Type Cheeses-A Review Article Published by EDP Sciences. Dairy Sci. Technol. 2010, 90, 3–26. [Google Scholar] [CrossRef]
  8. Nebesny, E.; Rutkowski, J. Effect of Roasting and Secondary Fermentation on Cocoa Bean Enrichment. Pol. J. Food Nutr. Sci. 1998, 3, 437–445. [Google Scholar]
  9. Sun, Y.; Tao, W.; Huang, H.; Ye, X.; Sun, P. Flavonoids, Phenolic Acids, Carotenoids and Antioxidant Activity of Fresh Eating Citrus Fruits, Using the Coupled in Vitro Digestion and Human Intestinal HepG2 Cells Model. Food Chem. 2019, 279, 321–327. [Google Scholar] [CrossRef] [PubMed]
  10. Mohamed, R.S.; Fouda, K.; Akl, E.M. Hepatorenal Protective Effect of Flaxseed Protein Isolate Incorporated in Lemon Juice against Lead Toxicity in Rats. Toxicol. Rep. 2020, 7, 30–35. [Google Scholar] [CrossRef] [PubMed]
  11. Miller, G.L. Use of Dinitrosalicylic Acid Reagent for Determination of Reducing Sugar. Anal. Chem. 1959, 31, 426–428. [Google Scholar] [CrossRef]
  12. Arima, K.; Yu, J.; Iwasaki, S. Milk-clotting enzyme from Mucor pusillus var. Lindt. In Methods in Enzymology; Perlmann, G., Lorand, L., Eds.; Academic Press: New York, NY, USA, 1970; Volume 19, pp. 446–459. [Google Scholar]
  13. Devanthi, P.V.P.; Gkatzionis, K. Soy Sauce Fermentation: Microorganisms, Aroma Formation, and Process Modification. Food Res. Int. 2019, 120, 364–374. [Google Scholar] [CrossRef] [PubMed]
  14. Tsuge, Y.; Kato, N.; Yamamoto, S.; Suda, M.; Inui, M. Enhanced Production of D-Lactate from Mixed Sugars in Corynebacterium glutamicum by Overexpression of Glycolytic Genes Encoding Phosphofructokinase and Triosephosphate Isomerase. J. Biosci. Bioeng. 2019, 127, 288–293. [Google Scholar] [CrossRef] [PubMed]
  15. Everis, L.K.; Betts, G. Microbial Issues in Salt Reduction. In Reducing Salt in Foods, 2nd ed; Woodhead Publishing: Cambridge, UK, 2019; pp. 129–155. [Google Scholar]
  16. Su, Y.; Seguinot, P.; Sanchez, I.; Ortiz-Julien, A.; Heras, J.M.; Querol, A.; Camarasa, C.; Guillamón, J.M. Nitrogen Sources Preferences of Non-Saccharomyces Yeasts to Sustain Growth and Fermentation under Winemaking Conditions. Food Microbiol. 2020, 85, 103287. [Google Scholar] [CrossRef] [PubMed]
  17. Agirre, J.; Moroz, O.; Meier, S.; Brask, J.; Munch, A.; Hoff, T.; Andersen, C.; Wilson, K.S.; Davies, G.J. The Structure of the AliC GH13 α-Amylase from Alicyclobacillus Sp. Reveals the Accommodation of Starch Branching Points in the α-Amylase Family. Acta Crystallogr. Sect. D Struct. Biol. 2019, 75, 1–7. [Google Scholar] [CrossRef] [PubMed] [Green Version]
  18. Leite, J.J.G.; Brito, É.H.S.; Cordeiro, R.A.; Brilhante, R.S.N.; Sidrim, J.J.C.; Bertini, L.M.; De Morais, S.M.; Rocha, M.F.G. Chemical Composition, Toxicity and Larvicidal and Antifungal Activities of Persea Americana (Avocado) Seed Extracts. Rev. Soc. Bras. Med. Trop. 2009, 42, 110–113. [Google Scholar] [CrossRef] [PubMed] [Green Version]
  19. Lund, M.N.; Ray, C.A. Control of Maillard Reactions in Foods: Strategies and Chemical Mechanisms. J. Agric. Food Chem. 2017, 65, 4537–4552. [Google Scholar] [CrossRef] [PubMed] [Green Version]
  20. Hall, J.A. Glucosides of the Navel Orange. J. Am. Chem. Soc. 1925, 47, 1191–1195. [Google Scholar] [CrossRef]
  21. Hoang, N.X.; Ferng, S.; Ting, C.H.; Lu, Y.C.; Yeh, Y.F.; Lai, Y.R.; Yih-Yuan Chiou, R.; Hwang, J.Y.; Hsu, C.K. Effect of Initial 5 Days Fermentation under Low Salt Condition on the Quality of Soy Sauce. LWT-Food Sci. Technol. 2018, 92, 234–241. [Google Scholar] [CrossRef]
  22. Liang, R.; Huang, J.; Wu, X.; Fan, J.; Xu, Y.; Wu, C.; Jin, Y.; Zhou, R. Effect of Raw Material and Starters on the Metabolite Constituents and Microbial Community Diversity of Fermented Soy Sauce. J. Sci. Food Agric. 2019, 99, 5687–5695. [Google Scholar] [CrossRef] [PubMed]
Figure 1. The growth curve of yeast and lactic acid bacteria.
Fermentation 08 00073 g001
Figure 2. The changes in reducing sugar (A), pH value (B), and acidity (C) during fermentation in the lemon juice starter.
Fermentation 08 00073 g002
Figure 3. The growth curve of yeast and lactic acid bacteria during secondary fermentation in soy sauce in a short period (A) and long period (B) of time.
Fermentation 08 00073 g003
Figure 4. The changes in amylase (A) and protease (B) activities during secondary fermentation.
Fermentation 08 00073 g004
Figure 5. The changes in reducing sugar (A), pH value (B), and acidity (C) during secondary fermentation.
Fermentation 08 00073 g005
Figure 6. The changes in color parameters in L value (A), a value (B), and b value (C) during secondary fermentation.
Fermentation 08 00073 g006
Figure 7. The sensory evaluation of soy sauces.
Fermentation 08 00073 g007
Table 1. The changes in amine nitrogen during the secondary fermentation of soy sauce and a lemon juice starter.
DayGroup AGroup B
00.873 ± 0.02 a0.693 ± 0.03 a
300.890 ± 0.12 ab0.720 ± 0.01 a
600.907 ± 0.02 b0.766 ± 0.01 b
900.905 ± 0.01 b0.773 ± 0.11 b
Each value represents the mean ± SD (n = 3). Different letters in the same column indicate significant differences (p < 0.05).
Publisher’s Note: MDPI stays neutral with regard to jurisdictional claims in published maps and institutional affiliations.

