Article

Characterization and Viability Prediction of Commercial Probiotic Supplements under Temperature and Concentration Conditioning Factors by NIR Spectroscopy

1
Department of Measurements and Process Control, Institute of Food Science and Technology, Hungarian University of Agriculture and Life Sciences, Somlói út 14-16, 1118 Budapest, Hungary
2
Department of Nutrition and Dietetics, Institute of Health Sciences, Marmara University, 34854 Istanbul, Turkey
3
Department of Food Microbiology, Hygiene and Safety, Institute of Food Science and Technology, Hungarian University of Agriculture and Life Sciences, Somlói út 14-16, 1118 Budapest, Hungary
*
Author to whom correspondence should be addressed.
Fermentation 2022, 8(2), 66; https://doi.org/10.3390/fermentation8020066
Submission received: 20 December 2021 / Revised: 21 January 2022 / Accepted: 26 January 2022 / Published: 31 January 2022

Abstract

:
The quality of probiotics has been associated with bacteria and yeast strains’ contents and their stability against conditioning factors. Near-infrared spectroscopy (NIRS), as a non-destructive, fast, real-time, and cost-effective analytical technique, can provide some advantages over more traditional food quality control methods in quality evaluation. The aim of our study was to evaluate the applicability of NIRS to the characterization and viability prediction of three commercial probiotic food supplement powders containing lactic acid bacteria (LAB) subjected to concentration and temperature conditioning factors. For each probiotic, 3 different concentrations were considered, and besides normal preparation (25 °C, control), samples were subjected to heat treatment at 60 or 90 °C and left to cool down until reaching room temperature prior to further analysis. Overall, after applying chemometrics to the NIR spectra, the obtained principal component analysis-based linear discriminant analysis (PCA-LDA) classification models showed a high accuracy in both recognition and prediction. The temperature has an important impact on the discrimination of samples. According to the concentration, the best models were identified for the 90 °C temperature treatment, reaching 100% average correct classification for recognition and over 90% for prediction. However, the prediction accuracy decreased substantially at lower temperatures. For the 25 °C temperature treatment, the prediction accuracy decreased to nearly 60% for 2 of the 3 probiotics. Moreover, according to the temperature level, both the recognition and prediction accuracies were close to 100%. Additionally, the partial least square regression (PLSR) model achieved respectable values for the prediction of the colony-forming units (log CFU/g) of the probiotic samples, with a determination coefficient for prediction (R2Pr) of 0.82 and root mean square error for prediction (RMSEP) of 0.64. The results of our study show that NIRS is a fast, reliable, and promising alternative to the conventional microbiology technique for the characterization and prediction of the viability of probiotic supplement drink preparations.

Graphical Abstract

1. Introduction

The traditional definition of probiotics is that they are live microorganisms that, when administered in adequate amounts, confer health benefits to the host by positively balancing microbiota and their activity in the gastrointestinal (GI) tract [1,2]. An imbalance of the microbiota has been associated to more than 25 diseases in the gastrointestinal system, autoimmune disease, and emotional health, among others [3]. Probiotics are usually used for the prevention and treatment of conditions, including inflammatory bowel diseases (IBD), diarrhea, and liver diseases. They also play an essential role in host metabolism by reducing the risk of various metabolic disorders, such as cardiovascular diseases, hypertension, obesity, arteriosclerosis, and cancer, and slow down the aging process [4,5].
Probiotics are generally associated with beneficial bacterial and yeast strains. Bacteria of the genus Bifidobacterium, Lactobacillus, and Streptococcus are regarded as probiotic bacteria; nevertheless, yeast, such as Saccharomyces, also have probiotic potential [6,7,8]. Bacteria of the Lactobacillus genus are widely used as a probiotic strain by various companies for the production of a variety of functional food products. Recent studies have reclassified species from Lactobacillus into 26 genera due to their high genetic heterogeneity, resulting in the probiotic supplement market being comprised of former lactobacilli or “ex-Lactobacillus” species [9]. Some of the important probiotic bacteria after reclassification include: Lactobacillus acidophilus, Levilactobacillus brevis, Lacticaseibacillus casei, Lactobacillus crispatus, Latilactobacillus curvatus, Lactobacillus delbrueckii, Limosilactobacillus fermentum, Lactobacillus gasseri, Lactobacillus helveticus, Lacticaseibacillus rhamnosus, Lactobacillus johnsonii, Lactiplantibacillus plantarum, Lacticaseibacillus paracasei, Limosilactobacillus reuteri, and Lacticaseibacillus rhamnosus [5,10,11].
For dietary supplements, probiotics are primarily utilized in a freeze-dried powder format. They are usually presented in capsules, tablets, and powder in stick packaging or sachet formats and stored in ambient conditions [12,13]. Dietary supplement products must provide the probiotic count on the label during the shelf life of the product. This ensures that the consumer receives the adequate dose of probiotics that was reported to result in the health claims or the otherwise suggested health benefit [1,14,15]. It is important to characterize the stability of each strain to determine the minimal count of each component strain in a multi-strain formulation and to ensure the proper amount of overage is added during the production of the dietary supplement format. However, this is challenging, especially in the case of various strains from the same species. Up to date, there have been no reported methods that are reliable and can be generally applied.
Several methods have been applied for the characterization of probiotics [12]. The most common methods are molecular-based techniques, such as quantitative real-time PCR, fluorescent-activated cell sorting (FACS), reverse transcription (RT-PCR), and 16S and 23S ribosomal DNA sequencing [16]. Recently, matrix-assisted laser desorption/ionization time-of-flight mass spectrometry (MALDI-TOF MS) has been reported as a rapid, cost-effective, and accurate analytical technique for the identification and classification of numerous bacterial species. MALDI-TOF MS was successfully used for bacterial identification in probiotics and yoghurts [17]. The combination of capillary isoelectric focusing (CIEF) in tapered fused silica (FS) with MALDI-TOF MS was proven to be an efficient approach for the identification of probiotic bacteria from cow’s milk [18]. Raman spectroscopy has also been used for the direct identification of microorganisms isolated from various foods, including commercial probiotics [19]. The effect of probiotic-assisted antibiotics treatment on the body’s state was evaluated using the mid-infrared spectroscopy technique by analyzing the breath [20].
Another important aspect that influences the dose of probiotics that the consumer receives is factors that decrease the viability of probiotics. Temperature is an important factor that can reduce the quality of probiotics. Therefore, companies and researchers have considered the thermal stability of probiotics. Heat stress affects a number of regions and processes that are crucial to microbial activity and growth. Lactic acid (LAB) species are generally sensitive to temperatures above 50 °C, although the thermal tolerance appears to be strain and species specific [21,22,23]. Studies on LAB survival and adaptations at high temperatures have shown that some species are able to survive in high temperatures between 45 and 80 °C [23,24].
Different approaches have been used by researchers to test the thermal resistance of probiotics, including simulation of probiotic growth under different fermentation temperatures and the thermal stability of probiotics under manufacturing, storage, and transport conditions, among others. For instance, regarding probiotic manufacturing, testing of spry-dried LAB subjected to elevated growth temperatures showed that after heat treatment at 60 °C, the survival of heat-adapted L. cremoris and L. rhamnosus GG increased by 0.7–1.5 and 0.3 log, respectively [25]. In an evaluation of the preservation of LAB probiotics using 3 double-microencapsulation methods, microencapsulated LAB subjected to the 3 methods showed better tolerance of high temperatures (60 °C for 60 min, 70 °C for 30 min, and 80 and 100 °C for 30 s) compared to free cells [26]. Moreover, from several strains, L. casei showed the highest alfa-galactosidase stability in a study that tested potential probiotics and corresponding alfa-galactosidase for bean products [27]. On the other hand, regarding fermentation and storage conditions, an evaluation of probiotic lactic beverages (21 days at 7 °C) showed that fermentation temperatures of 37 °C are preferred over 45 °C as they provide better storage stability [28]. Moreover, probiotics’ stability is significantly impacted by the storage temperature, for which 4 °C has shown the best viability preservation of probiotic dried powder [29].
Regarding near-infrared spectroscopy (NIRS), which is a non-destructive, quick, and real-time analytical method, there are reports showing that it has good potential for probiotics characterization. It has been used for LAB probiotic bacteria identification during different growing stages [30,31]. NIRS has also been proposed as a good alternative for yogurt production control by studying LAB fermentation [32]. Moreover, NIRS has been used to determine the influence of temperature in aqueous solutions, for instance, to determine the macronutrient stability of pasteurized and unpasteurized human milk [33]. It has also been tested for the assessment of the quality of infant formula under different temperatures during preheating and storage [34]. However, there is a lack of substantial information regarding the influence of the water temperature applied to the probiotic supplement just before consumers’ intake.
The aim of this study was to characterize the viability of different concentrations of commercial probiotic products containing LAB strains subjected to water at different temperatures by means of near-infrared spectroscopy. Furthermore, we aimed to correlate the results from microbiology analysis of probiotics with NIRS results and develop accurate models for viable counts (log CFU/g) prediction by applying chemometrics (PCA, PCA-LDA, and PLSR).

2. Materials and Methods

2.1. Sample Preparation

Three commercial probiotic food supplements in a powder format were used for this investigation. They were named probiotic N (Istanbul, Turkey), P, and A (Budapest, Hungary). Probiotic P and A belongs to the same commercial brand. Meanwhile, probiotic N belongs to a different brand. The label of probiotic N product states 2.5 × 10⁹ CFU/2 g of powder, including 5 types of bacterial strains: Lactobacillus acidophillus, Lacticaseibacillus rhamnosus, Enterococcus faecium, Bifidobacterium bifidum, and Bifidobacterium longum. The probiotic P product label declares 7.5 × 10⁹ CFU/3 g of powder, including 9 types of microorganisms: Bifidobacterium bifidus W23, Bifidobacterium lactis W51, Bifidobacterium lactis W52, Lactobacillus acidophilus W22, Lacticaseibacillus casei W56, Lacticaseibacillus paracasei W20, Lactiplantibacillus plantarum W62, Ligilactobacillus salivarius W24, and Lactococcus lactis W19. The probiotic A label states 3 × 10⁹ CFU/3 g of powder, including 6 types of microorganisms: Bifidobacterium lactis W51, Enterococcus faecium W54, Lactobacillus acidophilus W55, Lacticaseibacillus casei W56, Ligilactobacillus salivarius W57, and Lactococcus lactis W58.
For each probiotic product, 3 levels of concentration were considered for the drink preparation: C1: 3 g/125 mL, C2: 2.5 g/125 mL, and C3: 2 g/125 mL. The daily doses in the label of the probiotics are 2g for probiotic P and 3 g for both probiotic A and probiotic N, which was considered to establish the tested concentration levels. Additionally, 3 levels of temperature were analyzed: T1: 25 °C, T2: 60 °C, and T3: 90 °C, to model the possible real-life situation in which the consumer prepares probiotic drinks with water at different temperatures. The preparation methodology consisted of weighing the probiotic powder according to the desired concentration and adding distilled water according to the desired temperature level. The samples were then allowed to cool down to near room temperature before proceeding with the selected analysis. The cooling down times for the 60 and 90 °C treatments were 35 and 44 min, respectively. In total, 3 repetitions of each preparation were prepared, resulting in 81 samples for the 3-probiotic products (3 probiotic × 3 concentrations × 3 temperatures × 3 repetitions).

2.2. Microbiological Analysis

2.2.1. Preparation of Active Bacterial Culture

Man, Rogosa, and Sharp (MRS) agar (Biolab, Hungary), a low-selective medium, was applied for cultivation of Lactobacillus spp. with pour plating. For the dilutions, maximum recovery diluents (MRDs) (1 g of bacteriological peptone and 8.5 g of NaCl in 1 L of distilled water) were prepared, after which the prepared products were autoclaved at 121 °C for 15 min.

2.2.2. Enumeration of Bacteria

Each of the prepared samples, according to the probiotic-concentration-temperature combination, were serially diluted in MRD. MRS agar was poured out onto plated the appropriate dilutions. The plates were incubated at 37 °C for 72 h and the number of colonies (log CFU/g) were counted.

2.3. Near-Infrared Spectroscopic Analysis

NIR spectral data of the prepared samples were obtained using a benchtop MetriNIR spectrophotometer (MetriNIR Research, Development and Service Co., Budapest, Hungary), which included a white reflector. A 25 °C thermo-regulated circular cuvette (self-made), with a metallic wall (inner diameter: 5 cm; outer diameter: 8.5 cm) and with 0.4 mm crystal layer thickness, was used to collect the transflectance spectra and in the wavelength range of 900–1700 nm. For the NIRS measurements, 81 prepared samples were scanned in 3 parallels and 3 consecutive scans (each parallelly prepared sample was scanned 9 times, resulting in 27 spectra for each probiotic product and each treatment). A total of 729 scans was obtained, 243 scans for each probiotic product. The sequence of the samples was randomized before NIRS scanning.

2.4. Data Analysis

Viable counts (Log CFU/g) of the samples were determined for statistical analysis. Descriptive statistics and one-way analysis of variance (ANOVA) were applied according to probiotics subjected to different temperature levels by 3 repetitions (3 probiotics × 3 temperatures); the three concentrations were considered as repetitions for this analysis. After significant ANOVA results were found, Tuckey’s test (p < 0.05) was applied to evaluate differences between groups.
The recorded raw NIR spectra were analyzed, and the 950–1630 nm range was selected by eliminating the noisy ends of spectra. Principal component analysis (PCA) was employed to recognize patterns in the multivariate spectra. Principal component analysis-based linear discriminant analysis (PCA-LDA) models were built for classification according to probiotic type, concentration, and temperature groups separately. Principal component (PC) number optimization was performed to determine the optimal PCs to be used as input for the LDA models (PCA-LDA). The optimal number of PCs was determined using three-fold cross-validation. In each step of the cross-validation, the data of one repeat of the samples was left out. The optimal PC number was selected according to the lowest difference between the model building and cross-validation (CV) accuracies and the highest validation accuracy. Then, 2/3 of the data was used for model building while optimal PC and the rest of the data (1/3) were used for external validation. Single and combined spectra pretreatments were evaluated to determine the best possible PCA-LDA models, resulting in a total of 41 evaluated spectra pretreatments. The single spectra pretreatments consisted of Savitzky–Golay (SG) smoothing filter 2nd-order polynomial (13, 17, or 21 points), 1st derivative, 2nd derivatives, multiplicative scatter correction (MSC), standard normal variate (SNV), and de-trending (deTr). Savitsky–Golay smoothing was applied to decrease the spectral noise without disturbing their signal tendency. SNV and MSC permit correction of the undesirable scatter effects of light. De-trending (de Tr) can be referred to as baseline correction [35,36,37,38].
After PCA-LDA results were obtained, the best models were selected according to the spectral pretreatments that allowed the highest CV accuracy percentage. Partial least squares regression (PLSR) models were developed to predict the log CFU/g sample; hence, the NIR spectra were correlated with the microbiology analysis results. The determination coefficient (R2) and root mean square error (RMSE) were established for calibration (R2C, RMSEC), cross-validation (R2CV, RMSECV), and prediction (R2Pr, RMSEP). Then, 2/3 of the data (repetitions R2 and R3) were used to build the PLSR models. Cross-validation was performed by leaving out the spectra of one treatment (probiotic-concentration-temperature) in each step. Finally, the remining 1/3 of the data (R1) were used for the prediction to test the robustness of the final model. The optimal repetition linked to the prediction and best pretreatment combination was selected to obtain the PLSR model with the highest R2Pr for reporting. Additionally, the main contributing wavelengths in the 1950–1630 nm range for the PLSR model were reported. In the present study, R-project software version 4.0.3. (developed by R Core Team. Vienna, Austria. 2020) was used for data analysis [39].

3. Results and Discussion

3.1. Results of the Microbiological Analysis

The results from the microbiological analysis in Figure 1, show the log CFU/g values of the probiotic samples according to the temperature level for each probiotic type.
The highest log CFU/g values were found at 25 °C (room temperature), followed by 60 and 90 °C. This trend was observed for all the probiotic types (N, A, and P). Probiotic survivability is thermal dependent. The majority of Lactobacillus strains that are mesophilic can survive at temperatures under 50 °C. Other strains are thermophiles and can grow at higher temperatures over 50 °C [21,22,23,24,40]. The most marked difference in the microbiological count was shown in the case of probiotic N, which showed an initial count of 9.1 log CFU/g at 25 °C. Meanwhile, at 60 °C, the value was reduced to 6.0 log CFU/g and at the maximum tested temperature of 90 °C, the value decreased to 4.5 log CFU/g. The counts of probiotics A and P differed depending on the temperature, but this difference was less marked than probiotic N. For probiotic A, the log CFU/g was 8.7, 8.1, and 7.5 log CFU/g at 25, 60, and 90 °C, respectively. Meanwhile, for probiotic P, the log CFU/g was 8.6, 7.7, and 5.9 at 25, 60, and 90°C, respectively. Overall, probiotic A was the most thermally stable followed by probiotic P and probiotic N.
The objective of this study was to simulate the influence of the water temperature applied by consumers before the intake of probiotic beverages. For the 60 and 90 °C treatments, the heated water was applied to the probiotics and left to cool down to room temperature. By following this approach, at 60 °C, a 3 log reduction was observed for probiotic N and a 1 log reduction was observed for probiotic A and P. Comparatively, Franz and Holy (1996) [41] evaluated the heat resistance of 3 meat spoilage lactic acid bacteria in vitro and showed that at 60 °C, the D-values were between 15 and 40 s for a 1 log bacteria reduction. On the other hand, and as mentioned by Teoh et al. (2011) [42], in a study on probiotics containing L. acidophilus and L. acidophilus and B. pseudocatenulatum in which a 60 °C constant temperature was applied for 30 min, the viability of the probiotic was reduced from 9 to 4 log (5 log reduction). This suggests that by applying the methodology of this study, the reduction in viability is less marked compared to the conventional method. However, it provides a more realistic approach from thee consumer perspective, especially when high temperatures of 60 to 90 °C are applied.

3.2. Near-Infrared Spectroscopy Results

3.2.1. NIR Spectra of Samples According to the Temperature Level

Figure 2 shows the smoothed NIR spectra of the probiotic samples colored by the temperature level from 950 to 1630 nm. In the 950–1400 and 1500–1630 nm ranges, a certain tendency was observed for the spectra belonging to the different temperatures. T1 (25 °C) and T3 (90 °C) were completely separated. However, overlapping with T2 (60 °C) was observed. Additionally, NIR spectra were colored according to the probiotic type and the concentration (not shown). This revealed higher spectra overlapping; further statistical analysis and data treatment was applied to reveal a clearer tendency.

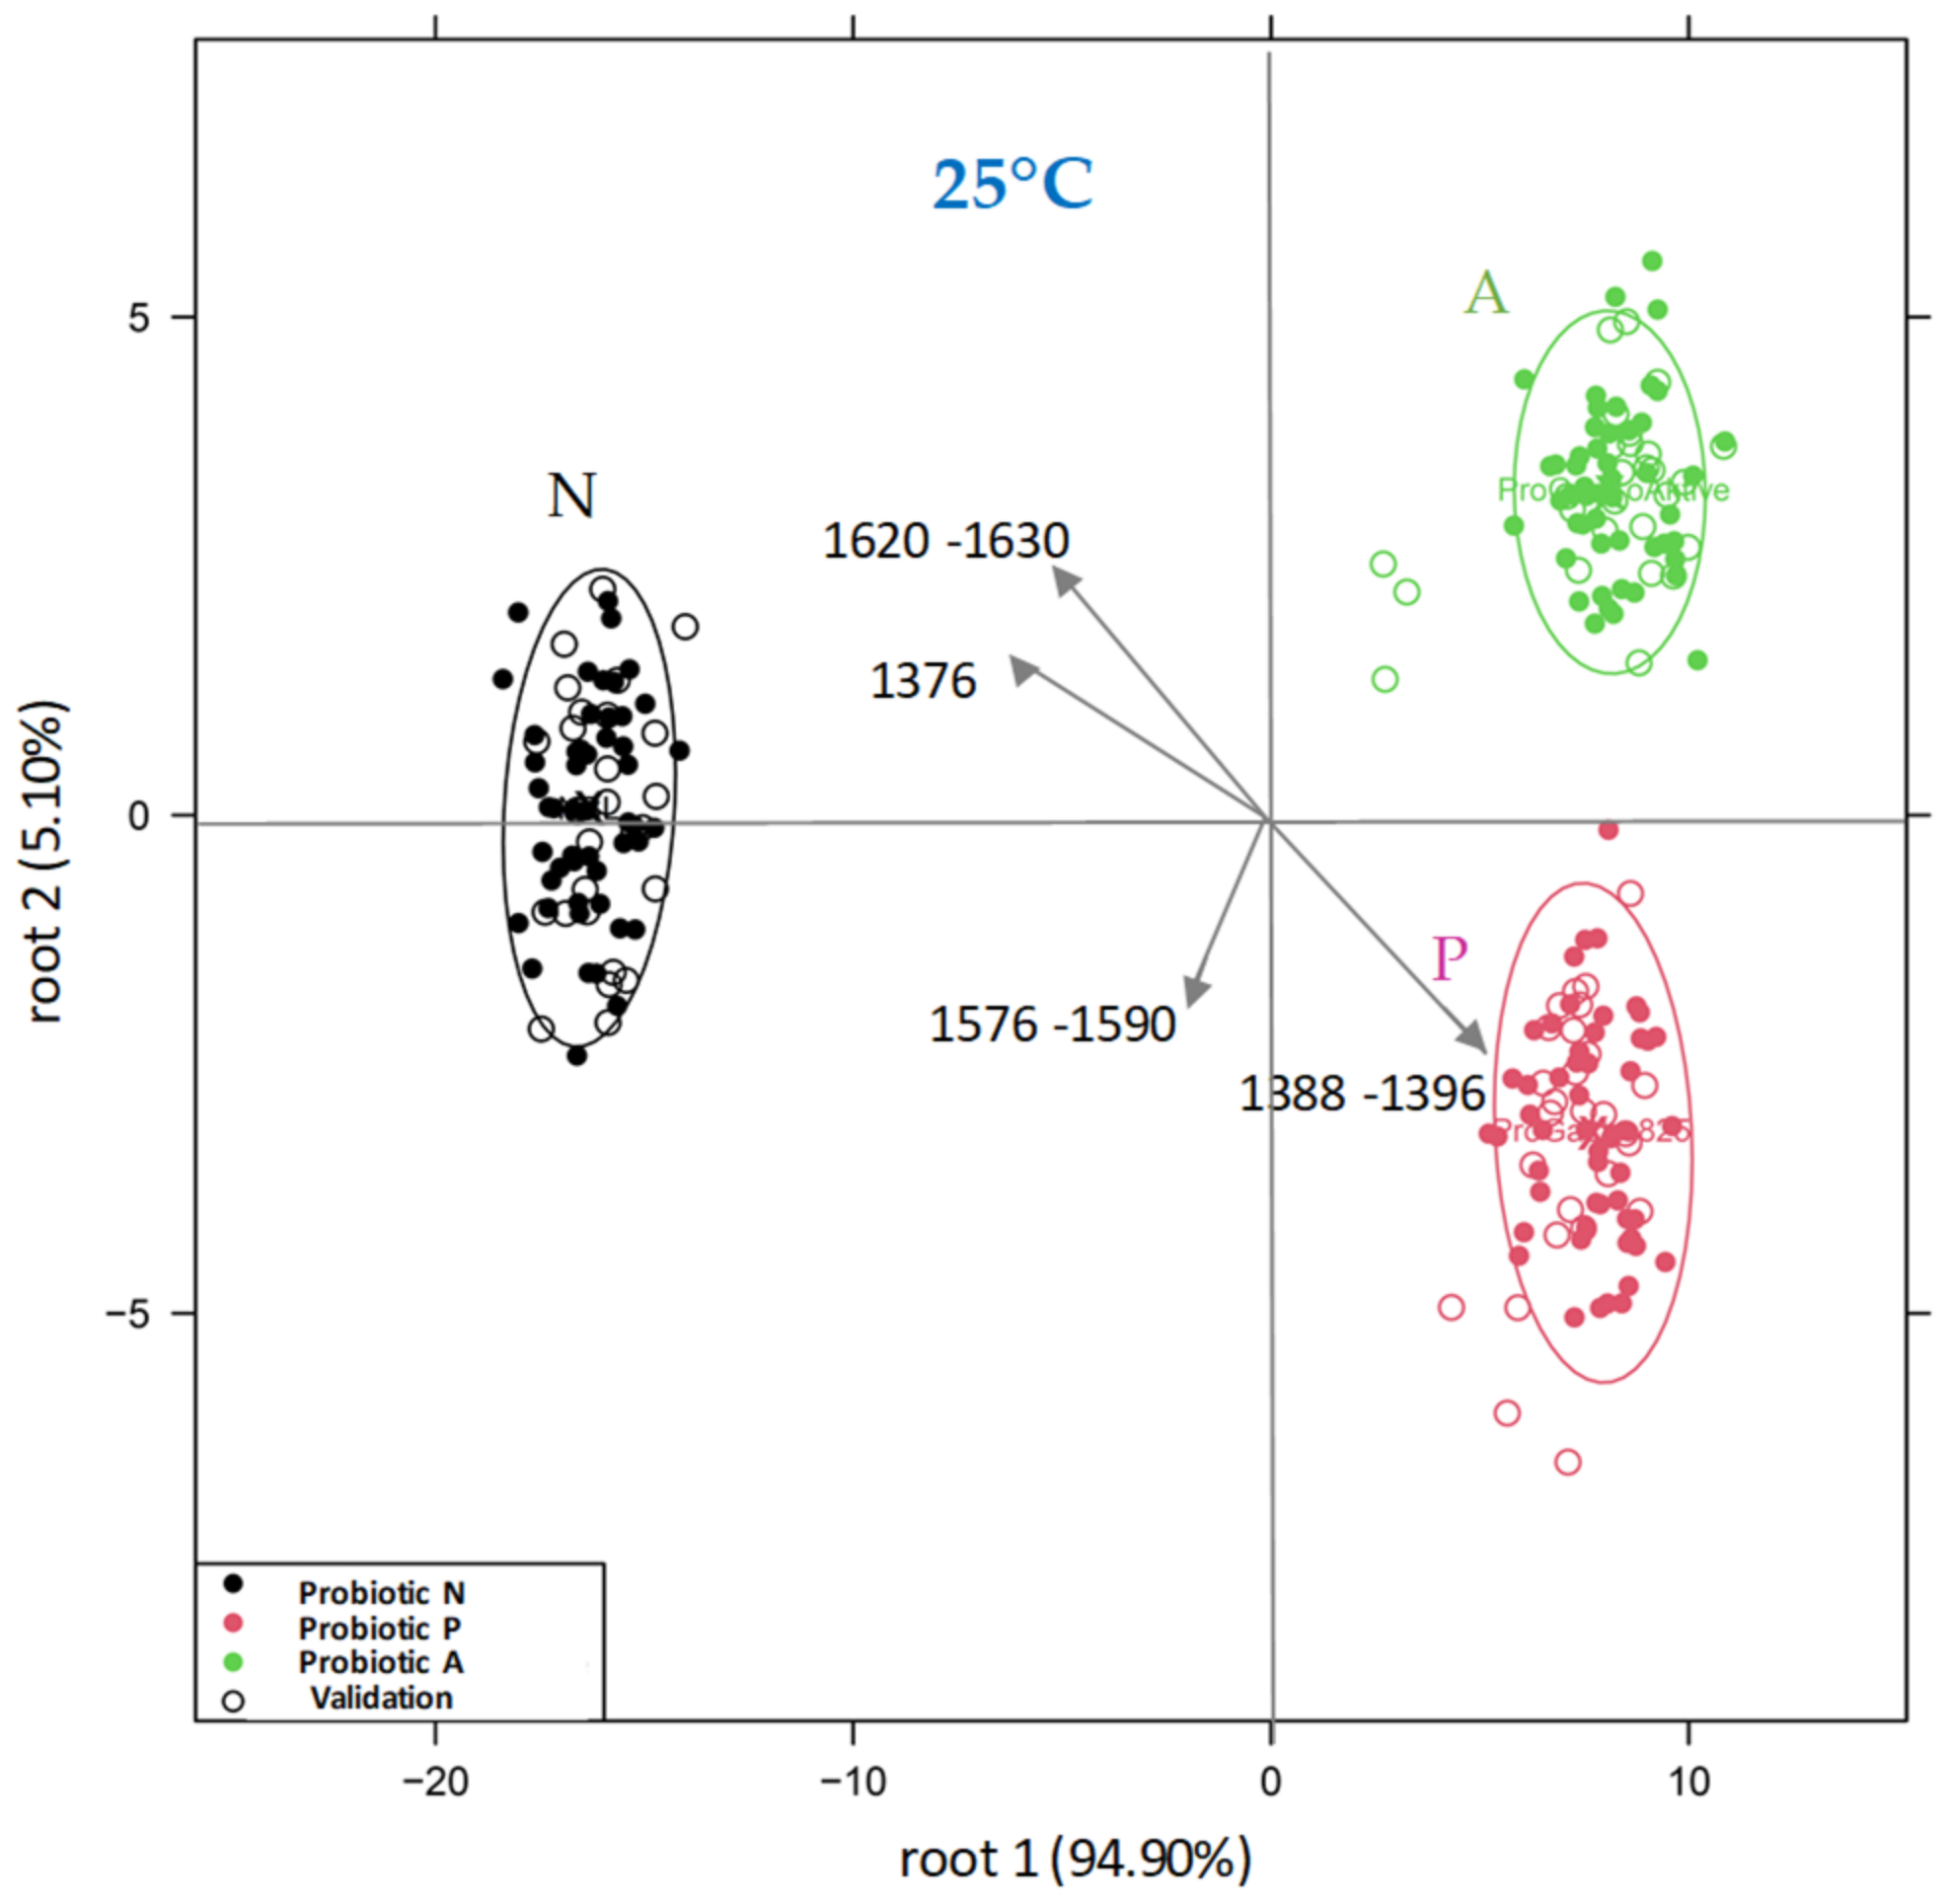
3.2.2. Discrimination of Probiotic Samples at Room Temperature

The PCA-LDA results for the discrimination of the three probiotics (N, A, and P) at 25 °C are shown in Figure 3. For this, all the samples from the three concentrations were considered as a group. Discrimination of the probiotics was observed on root 1 (94.90%) and root 2 (5.10%), showing separation. Closer proximity was observed between probiotics A and P compared to probiotic N, which clearly presented better separation from the other groups. The matrix from the N samples was visually different from the other two probiotics. This is because probiotics A and P contain more strains and complementary compounds that are in common compared to probiotic N. The best model for classification was achieved by applying the SGl 2-17-0 pretreatment. It presented a 100% accuracy for recognition and 99.18% accuracy for prediction. Moreover, the wavelengths that mostly contributed to the discrimination included 1376, 1388-1396, and 1576–1590 nm. These wavelength ranges were associated with the first overtone region (1300–1600 nm) of NIRS. This region is highly associated with biological and aqueous systems and characterized by intermolecular hydrogen bonds (C-H, O-H, and N-H), which are related to the main components of the probiotic preparations: water, protein, lipid, sugar, and supplemental organic compounds [43,44,45,46].

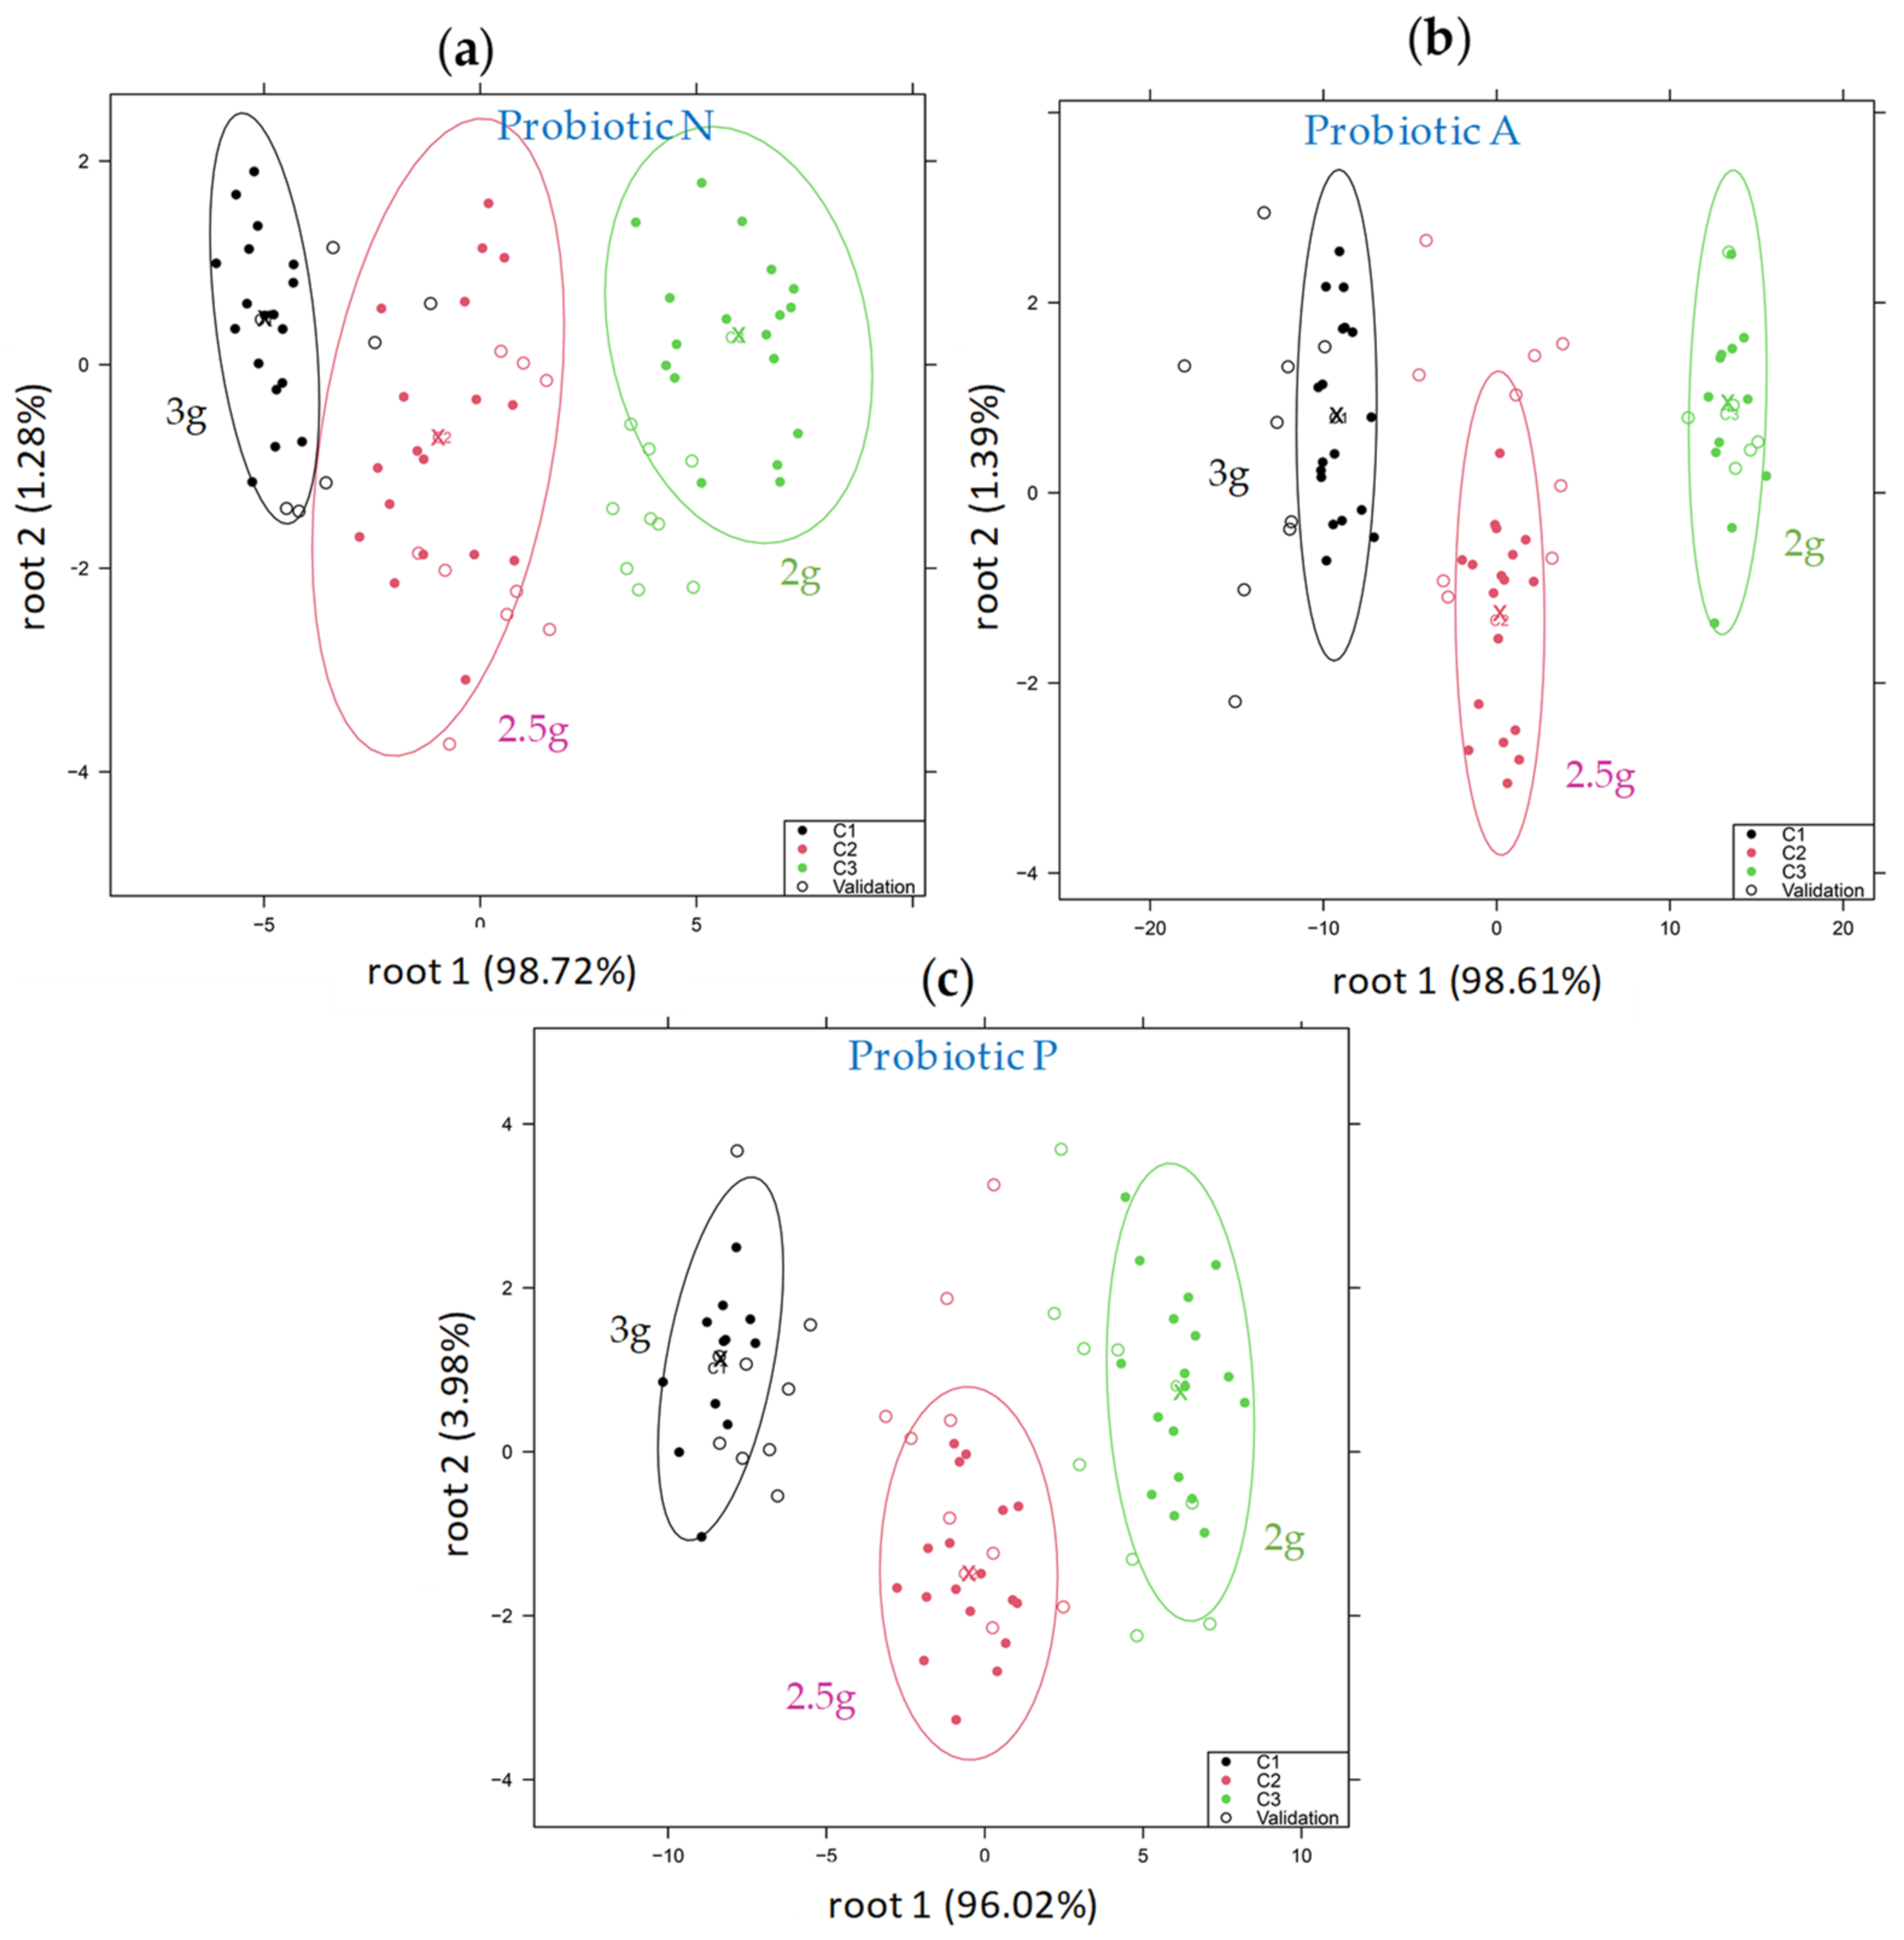
3.2.3. Discrimination of Probiotic Samples According to the Concentration Level

PCA-LDA for probiotic samples subjected to 90 °C (T3) is reported, in which models showed higher accuracy compared to 25 (T1) and 60 °C (T2). Discrimination was performed according to the concentration level of each probiotic separately. The PCA-LDA models for T3, represented in Figure 4 showed misclassification between the different concentrations and overlapping was observed, especially between consecutive concentrations (C1-C2 and C2-C3). However, a trend of separation following a specific order according to the concentration C1, C2, and C3 (from high to low concentration) was observed.
Additionally, Table 1 shows a confusion table of the PCA-LDA models. In the upper part of the table, the classification of the probiotic samples subjected to 90 °C (T3) is shown. The modeling showed high values of correct classification. All probiotics presented 100% average recognition. For prediction, probiotic A presented the highest accuracy (95.06%), followed by probiotic N (93.52%) and probiotic P (90.12%). Some misclassification was observed between consecutive concentrations C1-C2 and C2-C3. The best models were found by applying the following spectra pretreatments: de Tr and MSC for probiotic N, SG 2-21-0 and de Tr for probiotic A, and SG 2-17-0 and SG 2-17-2 for probiotic P.
Additionally, Table 1 shows the PCA-LDA results for the probiotic samples subjected to 25 °C (T1). Only probiotic N showed a high accuracy for recognition (100%) and prediction (93.83%). However, the values for probiotic A and probiotic P decreased, showing major misclassification. Probiotic A showed a 96.68% recognition accuracy and 60.65% prediction accuracy and probiotic P showed a 94.45% recognition accuracy and 60.50% prediction accuracy.

3.2.4. Discrimination of the Probiotic Samples According to the Temperature Level

Figure 5 shows the PCA-LDA according to the temperature level for each of the probiotics separately. For this, the samples from concentration 1 (C1) were considered.
Probiotic A showed the best classification models, presenting a 100% accuracy for both recognition and prediction by applying SG 2-17-0 and MSC. Similarly, probiotic P showed high accuracy for recognition (100%) and prediction (92.59%) by applying de Tr. Additionally, probiotic N showed a high percentage of discrimination between groups, accounting for 100% recognition accuracy and 94.60% prediction accuracy after applying SG 2-13-0 and SG 2-21-1. Accordingly, higher separation of samples based on temperature was observed for probiotic A (Figure 5b).
Table 2 shows a confusion table of the LDA models for the classification of the probiotics according to the temperature level. The modeling showed high values of correct classification for every probiotic. Minor misclassification was found between T1 and T2 and T1 and T3 in the case of probiotic N and between T1 and T2 for probiotic P.

3.2.5. PLSR for the Prediction of the Viability of Probiotics

Figure 6a,b show the predictive model of the CFU counts for all the probiotics tested in combination according to the concentration and temperature. The best model was achieved by selecting samples from repetitions R2 and R3 for model calibration and CV, and R1 for prediction. Additionally, SG 2-21-0 and SG 2-13-2 pretreatments were applied. In Figure 6a, it can be seen that the coefficient of determination for calibration (R2C) was 0.87 with a root mean square error of calibration (RMSEC) of 0.54. After cross-validation, the R2CV was 0.68 and RMSECV was 0.84. Furthermore, Figure 6b shows a coefficient of determination for prediction (R2Pr) of 0.82 and RMSEP of 0.64. The number of components (# comps) established to achieve the best model was seven. Additionally, in Figure 6c, the main contributing wavelengths and related regression coefficients associated with the PLSR of Figure 6a are shown. It can be seen that the wavelength range of 1300–1600 nm presented the highest number of contributing wavelengths and the highest peaks that contributed the most to the prediction of the probiotic viability. The probiotic preparations are mainly comprised of water and a lesser amount of organic compounds. This kind of matrix presents high absorbance in the first overtone region of water of 1300-1600 nm [43,44,45,46]. The main wavelengths were found at 1458 nm, which is associated with OH stretching [30,47,48,49]. Meanwhile, 1484 nm is associated with OH/NH stretching [30,50,51,52]. In the region from 950 to 1300 nm, the main wavelength was assigned to 1140 nm, which is related to the combination overtone of free water (S0). As reported in [30], this characteristic refers to the closest band of 1155 nm.

4. Conclusions

ANOVA and Tukey test p < 0.05 identified statistical differences between probiotic products subjected to different temperature levels, showing well-differentiated groups between 25 and 90 °C as expected. Considering NIRS, principal component analysis-based linear discriminant analysis (PCA-LDA) of the spectra showed high discrimination between the 3 probiotics when evaluated at room temperature, with 100% correct classification. In addition, PCA-LDA was performed for each probiotic separately, according to their temperature levels. The classification model for each probiotic presented 100% recognition accuracy and high prediction accuracy (over 90%), showing a clear separation between the applied temperature levels (25, 60, or 90 °C). In the same manner, PCA-LDA was performed for each probiotic product separately, according to their concentration levels. A significant effect of the temperature and probiotic type on the classification of samples according to the concentrations was observed. The higher temperature treatment (90 °C) showed better discrimination of the concentrations, reaching a 100% recognition accuracy and over 90% prediction accuracy for each probiotic model. In contrast, the models’ accuracy for probiotic A and probiotic P was significantly affected by the lower temperature treatment (25 °C), presenting a recognition accuracy of around 60 %. Evaluation of the 41 spectral pretreatments (alone and combined) allowed the most accurate models to be achieved.
The PLSR model of the log CFU/g of the probiotic products according to the concentration and temperature conditioning factors presented significant prediction values of R2Pr: 0.82 and RMSEP: 0.64 log CFU/g. Over 20 contributing wavelengths were observed in the 950–1630 nm region. However, most contributing wavelengths were located in the first overtone region of water from 1300-1600 nm. The 2 most relevant wavelengths at 1458 and 1484 nm were associated with OH stretching and OH/NH stretching, respectively. NIRS is a promising alternative for determining the viability of probiotic strains in probiotic supplements prepared under different conditions.

Author Contributions

Conceptualization, J.P.A.B., G.K. and Z.K.; Data curation, J.P.A.B.; Formal analysis, J.P.A.B., E.O., A.C. and M.M.; Funding acquisition, Z.K.; Investigation, J.P.A.B., E.O., A.C. and M.M.; Methodology, Z.K.; Project administration, J.P.A.B. and Z.K.; Resources, G.K. and Z.K.; Software, J.P.A.B., Z.G. and Z.K.; Supervision, G.K., Z.G. and Z.K.; Validation, Z.G. and Z.K.; Visualization, J.P.A.B.; Writing—original draft, J.P.A.B., E.O., A.C. and M.M.; Writing—review and editing, J.P.A.B., E.O., A.C., M.M., G.K., Z.G. and Z.K. All authors have read and agreed to the published version of the manuscript.

Funding

This research was supported by the European Union and co-financed by the European Social Fund (grant agreement no. EFOP-3.6.3-VEKOP-16-2017-00005); by the European Union and co-financed by the European Regional Development Fund and the Hungarian Government (grant agreement no. GINOP-2.2.1-18-2020-00025).

Institutional Review Board Statement

Not applicable.

Informed Consent Statement

Not applicable.

Data Availability Statement

The data presented in this study are available on request from the corresponding author. The data are not publicly available, due to privacy reasons.

Conflicts of Interest

The authors declare no conflict of interest.

References

  1. FAO/WHO. Report of a Joint FAO/WHO Working Group on Drafting Guidelines for the Evaluation of Probiotics in Food; WHO: Toronto, ON, Canada, 2002. [Google Scholar]
  2. Parker, E.A.; Roy, T.; Christopher, A.; Wieland, S. Probiotics and Gastrointestinal Conditions: An Overview of Evidence from the Cochrane Collaboration. Nutrition 2018, 45, 125–134. [Google Scholar] [CrossRef] [PubMed]
  3. De Vos, W.M.; De Vos, E.A.J. Role of the Intestinal Microbiome in Health and Disease: From Correlation to Causation. Nutr. Rev. 2012, 70, S45–S56. [Google Scholar] [CrossRef] [PubMed]
  4. O’Shea, E.F.; Cotter, P.D.; Stanton, C.; Ross, R.P.; Hill, C. Production of Bioactive Substances by Intestinal Bacteria as a Basis for Explaining Probiotic Mechanisms: Bacteriocins and Conjugated Linoleic Acid. Int. J. Food Microbiol. 2012, 152, 189–205. [Google Scholar] [CrossRef] [PubMed]
  5. Mishra, V.; Shah, C.; Mokashe, N.; Chavan, R.; Yadav, H.; Prajapati, J. Probiotics as Potential Antioxidants: A Systematic Review. J. Agric. Food Chem 2015, 63, 3615–3626. [Google Scholar] [CrossRef]
  6. Wescombe, P.A.; Heng, N.C.K.; Burton, J.P.; Chilcott, C.N.; Tagg, J.R. Streptococcal Bacteriocins and the Case for Streptococcus Salivarius as Model Oral Probiotics. Future Microbiol. 2009, 4, 819–835. [Google Scholar] [CrossRef] [Green Version]
  7. Vanderhoof, J.A. Probiotics and Intestinal Inflammatory Disorders in Infants and ChildrenNo Title. J. Pediatr. Gastroenterol. Nutr. 2000, 30, S34–S38. [Google Scholar] [CrossRef]
  8. Menezes, A.; Lacerda, C.; Ribeiro, D.; Freitas, R. Combination of Probiotic Yeast and Lactic Acid Bacteria as Starter Culture to Produce Maize-Based Beverages. Food Res. Int. 2018, 111, 187–197. [Google Scholar] [CrossRef]
  9. Zheng, J.; Wittouck, S.; Salvetti, E.; Franz, C.M.A.P.; Harris, H.M.B.; Mattarelli, P.; O’toole, P.W.; Pot, B.; Vandamme, P.; Walter, J.; et al. A Taxonomic Note on the Genus Lactobacillus: Description of 23 Novel Genera, Emended Description of the Genus Lactobacillus Beijerinck 1901, and Union of Lactobacillaceae and Leuconostocaceae. Int. J. Syst. Evol. Microbiol. 2020, 70, 2782–2858. [Google Scholar] [CrossRef]
  10. Cissé, H.; Kagambèga, B.; Sawadogo, A.; Tankoano, A.; Sangaré, G.; Traoré, Y.; Irène, I.; Ouoba, L.; Savadogo, A. Molecular Characterization of Bacillus, Lactic Acid Bacteria and Yeast as Potential Probiotic Isolated from Fermented Food. Sci. African 2019, 6, 1–13. [Google Scholar] [CrossRef]
  11. Juliana, A.; Colasacco, C.; Emmanouil, E.; Kohlhepp, S.; Harriott, O. Strain-Level Diversity of Commercial Probiotic Isolates of Bacillus, Lactobacillus, and Saccharomyces Species Illustrated by Molecular Identification and Phenotypic Profiling. PLoS ONE 2019, 14, 1–19. [Google Scholar] [CrossRef]
  12. Fenster, K.; Freeburg, B.; Hollard, C.; Wong, C.; Laursen, R.R.; Ouwehand, A.C. The Production and Delivery of Probiotics: A Review of a Practical Approach. Microorganisms 2019, 7, 83. [Google Scholar] [CrossRef] [Green Version]
  13. Nagashima, A.I.; Pansiera, P.E.; Baracat, M.M.; Gómez, J. Development of Effervescent Products, in Powder and Tablet Form, Supplemented with Probiotics Lactobacillus Acidophilus and Saccharomyces Boulardii. Food Sci. Technol. 2013, 33, 605–611. [Google Scholar] [CrossRef] [Green Version]
  14. Kesavelu, D.; Anusha, R.; Iddya, K.; Indrani, K. Composition and Laboratory Correlation of Commercial Probiotics in India. Cureus 2020, 12, e11334. [Google Scholar] [CrossRef] [PubMed]
  15. Astashkina, A.P.; Khudyakova, L.I.; Kolbysheva, Y.V. Microbiological Quality Control of Probiotic Products. Procedia Chem. 2014, 10, 74–79. [Google Scholar] [CrossRef] [Green Version]
  16. Yadav, R.; Shukla, P. An Overview of Advanced Technologies for Selection of Probiotics and Their Expediency: A Review. Crit. Rev. Food Sci. Nutr. 2017, 57, 3233–3242. [Google Scholar] [CrossRef]
  17. Angelakis, E.; Million, M.; Henry, M.; Raoult, D. Rapid and Accurate Bacterial Identification in Probiotics and Yoghurts by MALDI-TOF Mass Spectrometry. J. Food Sci. 2011, 76, 568–572. [Google Scholar] [CrossRef]
  18. Horká, M.; Karásek, P.; Šalplachta, J.; Růžička, F.; Vykydalová, M.; Kubesová, A.; Dráb, V.; Roth, M.; Šlais, K. Capillary Isoelectric Focusing of Probiotic Bacteria from Cow’s Milk in Tapered Fused Silica Capillary with off-Line Matrix-Assisted Laser Desorption/Ionization Time-of-Flight Mass Spectrometry Identification. Anal. Chim. Acta 2013, 788, 193–199. [Google Scholar] [CrossRef]
  19. Zielińska, D.; Oldak, A.; Rzepkowska, A.; Zieliński, K. Enumeration and Identification of Probiotic Bacteria in Food Matrices. Adv. Biotechnol. Food Ind. 2018, 14, 167–196. [Google Scholar] [CrossRef]
  20. Maiti, K.S.; Apolonski, A. Monitoring the Reaction of the Body State to Antibiotic Treatment against Helicobacter Pylori via Infrared Spectroscopy: A Case Study. Molecules 2021, 26, 3474. [Google Scholar] [CrossRef]
  21. Corcoran, B.M.; Stanton, C.; Fitzgerald, G.; Ross, R.P. Life Under Stress: The Probiotic Stress Response and How It May Be Manipulated. Curr. Pharm. Des. 2008, 14, 1382–1399. [Google Scholar] [CrossRef]
  22. Suokko, A.; Savijoki, K.; Malinen, E.; Palva, A.; Varmanen, P. Characterization of a Mobile ClpL Gene from Lactobacillus Rhamnosus. Appl. Environ. Microbiol. 2005, 71, 2061–2069. [Google Scholar] [CrossRef] [PubMed] [Green Version]
  23. Desmond, C.; Fitzgerald, G.F.; Stanton, C.; Ross, R.P. Improved Stress Tolerance of GroESL-Overproducing Lactococcus Lactis and Probiotic Lactobacillus Paracasei NFBC 338. Appl. Environ. Microbiol. 2004, 70, 5929–5936. [Google Scholar] [CrossRef] [PubMed] [Green Version]
  24. Bove, P.; Russo, P.; Capozzi, V.; Gallone, A.; Spano, G.; Fiocco, D. Lactobacillus Plantarum Passage through an Oro-Gastro-Intestinal Tract Simulator: Carrier Matrix Effect and Transcriptional Analysis of Genes Associated to Stress and Probiosis. Microbiol. Res. 2013, 168, 351–359. [Google Scholar] [CrossRef] [PubMed]
  25. Hao, F.; Fu, N.; Ndiaye, H.; Woo, M.W.; Jeantet, R.; Chen, X.D. Thermotolerance, Survival, and Stability of Lactic Acid Bacteria After Spray Drying as Affected by the Increase of Growth Temperature. Food Bioprocess Technol. 2021, 14, 120–132. [Google Scholar] [CrossRef]
  26. Pupa, P.; Apiwatsiri, P.; Sirichokchatchawan, W.; Pirarat, N. The Efficacy of Three Double - Microencapsulation Methods for Preservation of Probiotic Bacteria. Nature 2021, 11, 1–9. [Google Scholar] [CrossRef]
  27. Liu, X.; Champagne, C.P.; Lee, B.H.; Boye, J.I.; Casgrain, M. Thermostability of Probiotics and Their Alpha-Galactosidases and the Potential for Bean Products. Biotechnol. Res. Int. 2014, 2014, 21. [Google Scholar] [CrossRef]
  28. Fiorentini, Â.M.; Ballus, C.A.; De Oliveira, M.L.; Cunha, M.F.; Klajn, V.M. The Influence of Different Combinations of Probiotic Bacteria and Fermentation Temperatures on the Microbiological and Physicochemical Characteristics of Fermented Lactic Beverages Containing Soybean Hydrosoluble Extract during Refrigerated Storage. Ciência e Tecnol. Aliment. 2011, 31, 597–607. [Google Scholar] [CrossRef] [Green Version]
  29. Luangthongkam, P.; Blinco, J.; Dart, P.; Callaghan, M.; Speight, R. Food and Bioproducts Processing Comparison of Spray-Drying and Freeze-Drying for Inoculum Production of the Probiotic Bacillus Amyloliquefaciens Strain H57. Food Bioprod. Process. 2021, 130, 121–131. [Google Scholar] [CrossRef]
  30. Slavchev, A.; Kovacs, Z.; Koshiba, H.; Nagai, A.; Bázár, G.; Krastanov, A.; Kubota, Y.; Tsenkova, R. Monitoring of Water Spectral Pattern Reveals Differences in Probiotics Growth When Used for Rapid Bacteria Selection. PLoS ONE 2015, 10, 1–18. [Google Scholar] [CrossRef] [Green Version]
  31. Slavchev, A.; Kovacs, Z.; Koshiba, H.; Bazar, G.; Pollner, B.; Krastanov, A.; Tsenkova, R. Monitoring of Water Spectral Patterns of Lactobacilli Development as a Tool for Rapid Selection of Probiotic Candidates. J. Near Infrared Spectrosc. 2017, 25, 423–431. [Google Scholar] [CrossRef]
  32. Muncan, J.; Tei, K.; Tsenkova, R. Real-Time Monitoring of Yogurt Fermentation Process by Aquaphotomics near-Infrared Spectroscopy. Sensors 2021, 21, 177. [Google Scholar] [CrossRef]
  33. Kotrri, G.; Fusch, G.; Kwan, C.; Choi, D.; Choi, A.; Al Kafi, N.; Rochow, N.; Fusch, C. Validation of Correction Algorithms for Near-IR Analysis of Human Milk in an Independent Sample Set—Effect of Pasteurization. Nutrients 2016, 8, 119. [Google Scholar] [CrossRef] [Green Version]
  34. Wang, X.; Esquerre, C.; Downey, G.; Henihan, L.; O’Callaghan, D.; O’Donnell, C. Assessment of Infant Formula Quality and Composition Using Vis-NIR, MIR and Raman Process Analytical Technologies. Talanta 2018, 183, 320–328. [Google Scholar] [CrossRef]
  35. Savitzky, A.; Golay, M.J.E. Smoothing and Differentiation of Data by Simplified Least Squares Procedures. Anal. Chem. 1964, 36, 1627–1639. [Google Scholar] [CrossRef]
  36. Barnes, R.J.; Dhanoa, M.S.; Lister, S.J. Standard Normal Variate Transformation and De-Trending of Near-Infrared Diffuse Reflectance Spectra. Appl. Spectrosc. 1989, 43, 772–777. [Google Scholar] [CrossRef]
  37. Liu, Y.; Liu, Y.; Chen, Y.; Zhang, Y.; Shi, T.; Wang, J. The Influence of Spectral Pretreatment on the Selection of Representative Calibration Samples for Soil Organic Matter Estimation Using Vis-NIR Reflectance Spectroscopy. Remote Sens. 2019, 11, 450. [Google Scholar] [CrossRef] [Green Version]
  38. Rinnan, A.; Berg, F.; Engelsen, S.B. Review of the Most Common Pre-Processing Techniques for near-Infrared Spectra. Trends Anal. Chem. 2009, 28, 1201–1222. [Google Scholar] [CrossRef]
  39. R Core Team. R: A Language and Environment for Statistical Computing; R Foundation for Statistical Computing: Copenhagen, Denmark, 2020. [Google Scholar]
  40. Prasad, J.; Mcjarrow, P.; Gopal, P. Heat and Osmotic Stress Responses of Probiotic Lactobacillus Rhamnosus HN001 ( DR20 ) in Relation to Viability after Drying. Appl. Environ. Microbiol. 2003, 69, 917–925. [Google Scholar] [CrossRef] [Green Version]
  41. Franz, C.M.A.P.; Von Holy, A. Thermotolerance of Meat Spoilage Lactic Acid Bacteria and Their Inactivation in Vacuum-Packaged Vienna Sausages. Int. J. Food Microbiol. 1996, 1605, 59–73. [Google Scholar] [CrossRef]
  42. Teoh, P.L.; Mirhosseini, S.H.; Mustafa, S.; Yazid, M.; Manap, A. Tolerance of Free and Encapsulated Probiotics towards Heat Treatment and High Sodium Concentration Tolerance of Free and Encapsulated Probiotics towards Heat Treatment and High Sodium Concentration. J. Food Agric. Environ. 2011, 9, 69–73. [Google Scholar] [CrossRef]
  43. Tsenkova, R.; Muncan, J.; Pollner, B.; Kovacs, Z. Essentials of Aquaphotomics and Its Chemometrics Approaches. Front. Chem. 2018, 6, 1–25. [Google Scholar] [CrossRef]
  44. Ozaki, Y.; Genkawa, T.; Futami, Y. Near-infrared spectroscopy. In Encyclopedia of Spectroscopy and Spectrometry; Elsevier Ltd.: Amsterdam, The Netherlands, 2016; pp. 40–49. ISBN 9780128032244. [Google Scholar]
  45. Siesler, H.W.; Ozaki, Y.; Kawata, S.; Heise, H.M. Near-Infrared Spectroscopy: Principles, Instruments, Applications; WILEY-VCH Verlag GmbH: Weinheim, Germany, 2002; ISBN 3527301496. [Google Scholar]
  46. Muncan, J.; Tsenkova, R. Aquaphotomics—From Innovative Knowledge to Integrative Platform in Science and Technology. Molecules 2019, 24, 2742. [Google Scholar] [CrossRef] [Green Version]
  47. Workman, J.J. The Handbook of Organic Compounds, Three-Volume Set, 1st ed.; Academic Press Inc: San Diego, CA, USA, 2000; ISBN 9780127635606. [Google Scholar]
  48. Izutsu, K.; Fujimaki, Y.; Kuwabara, A.; Hiyama, Y.; Yomota, C.; Aoyagi, N. Near-Infrared Analysis of Protein Secondary Structure in Aqueous Solutions and Freeze-Dried Solids. J. Pharma. Sc. 2006, 95, 781–789. [Google Scholar] [CrossRef]
  49. Maeda, H.; Ozaki, Y. Near Infrared Spectroscopy and Chemometrics Studies of Temperature- Dependent Spectral Variations of Water: Relationship between Spectral Changes and Hydrogen Bonds. J. Near Infrared Spectrosc. 1995, 3, 191–201. [Google Scholar] [CrossRef]
  50. Wei, D.; Salahub, D.R. Hydrated Proton Clusters: Ab Initio Molecular Dynamics Simulation and Simulated Annealing. J. Chem. Phys. 1997, 106, 6086–6094. [Google Scholar] [CrossRef]
  51. Mizuse, K.; Fujii, A. Tuning of the Internal Energy and Isomer Distribution in Small Protonated Water Clusters H+(H2O)4−8: An Application of the Inert Gas Messenger Technique. J. Phys. Chem. A 2012, 116, 4868–4877. [Google Scholar] [CrossRef] [PubMed]
  52. Fischer, M.; Tran, C.D. Investigation of Solid-Phase Peptide Synthesis by the Near-Infrared Multispectral Imaging Technique: A Detection Method for Combinatorial Chemistry. Anal. Chem. 1999, 71, 2255–2261. [Google Scholar] [CrossRef] [PubMed]
Figure 1. Microbiological analysis. Log CFU/g of probiotic samples probiotic N, probiotic A, and Probiotic P, prepared at three different temperatures T1 (25 °C), T2 (60 °C), and T3 (90 °C). Letter (a–e) represent significantly different groups (p ≤ 0.05), based on ANOVA and the Tukey HSD post hoc test.
Fermentation 08 00066 g001
Figure 2. NIR spectra of probiotic samples according to temperature level T1 (25 °C), T2 (60 °C), and T3 (90 °C).
Fermentation 08 00066 g002
Figure 3. PCA-LDA of probiotic samples prepared at room temperature of 25 °C. N = 237 (NIR samples scans). Built with 95% confidence interval ellipsis. The center of the ellipses is denoted by x, training and validation sets are denoted by solid and hollow points, respectively.
Fermentation 08 00066 g003
Figure 4. PCA-LDA for probiotic samples subjected to 90 °C (T3) according to the concentration level for each probiotic type (a) probiotic N, (b) probiotic A, and (c) probiotic P. Built with 95% confidence interval ellipsis. The center of the ellipses is denoted by x, training and validation sets are denoted by solid and hollow points, respectively. N = 78 for probiotic N, N = 72 for probiotic A, and N = 75 for probiotic P.
Fermentation 08 00066 g004
Figure 5. PCA-LDA for probiotic samples from concentration (C1) according to the temperature level for each probiotic type (a) probiotic N, (b) probiotic A, and (c) probiotic P. Built with 95% confidence interval ellipsis. The center of the ellipses is denoted by x, training and validation sets are denoted by solid and hollow points, respectively. N = 75 for probiotic N, N = 78 for probiotic A, and N = 72 for probiotic P.
Fermentation 08 00066 g005
Figure 6. Prediction of the CFU counts of probiotic samples by PLSR. (a) PLSR model used for calibration (C) and cross-validation (CV). R2 and R3 are the repetitions selected for the model (N = 2). (b) PLSR model for the prediction of samples (Pr). R1 is the repetition selected for prediction (N = 1). (c) Main contributing wavelengths of 1950–1630 nm for the PLSR model.
Fermentation 08 00066 g006
Table 1. Confusion table of the PCA-LDA models for probiotic samples subjected to 90 °C (T3) according to the concentration level.
T3 (90 °C)Probiotic NProbiotic AProbiotic P
Average Recognition (100%)Average Recognition (100%)Average Recognition (100%)
%C1C2C3C1C2C3C1C2C3
C1100001000010000
C2010000100001000
C3001000010000100
Average Prediction (93.52%)Average Prediction (95.06%)Average Prediction (90.12%)
%C1C2C3C1C2C3C1C2C3
C191.6711.11096.307.41010011.1111.11
C28.3388.8903.7088.890081.480
C30010003.7010007.4188.89
T1 (25 °C)Probiotic NProbiotic AProbiotic P
Average Recognition (100%)Average Recognition (95.68%)Average Recognition (94.45%)
%C1C2C3C1C2C3C1C2C3
C1100001005.56096.303.700
C201000088.891.853.7092.595.56
C30010005.5698.1503.7094.44
Average Prediction (93.83%)Average Prediction (60.65%)Average Prediction (60.50%)
%C1C2C3C1C2C3C1C2C3
C188.897.41070.8337.04062.9614.8122.22
C211.1192.59016.6729.6318.5211.1151.8511.11
C30010012.5033.3381.4825.9333.3366.67
Table 2. Confusion table of the PCA-LDA models for probiotic samples from concentration C1 according to the temperature level.
Probiotic NProbiotic AProbiotic P
Average Recognition (100%)Average Recognition (100%)Average Recognition (100%)
%T1T2T3T1T2T3T1T2T3
T1100001000010000
T2010000100001000
T3001000010000100
Average Prediction (94.60%)Average Prediction (100%)Average Prediction (92.59%)
%T1T2T3T1T2T3T1T2T3
T196.3012.5001000077.7800
T2087.5000100022.221000
T33.7001000010000100
Publisher’s Note: MDPI stays neutral with regard to jurisdictional claims in published maps and institutional affiliations.

