Article

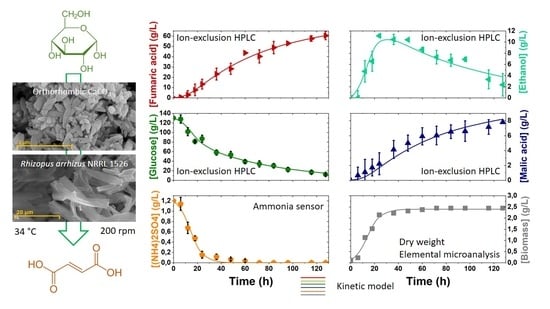
Production of Fumaric Acid by Rhizopus arrhizus NRRL 1526: A Simple Production Medium and the Kinetic Modelling of the Bioprocess

1
FQPIMA Group, Materials and Chemical Engineering Department, Chemical Science School, Complutense University of Madrid, 28040 Madrid, Spain
2
Thünen Institute of Agricultural Technology, 38116 Braunschweig, Germany
*
Author to whom correspondence should be addressed.
Fermentation 2022, 8(2), 64; https://doi.org/10.3390/fermentation8020064
Submission received: 23 December 2021 / Revised: 23 January 2022 / Accepted: 26 January 2022 / Published: 30 January 2022

Abstract

:
Fumaric acid is a promising monomer to obtain biomass-based polyesters and polyamides, and it is mainly produced by fungi of the Rhizopus genus in medium to high titters. The use of glucose, a main component of starchy and cellulosic food waste, as carbon source, together with a low-nitrogen source concentration, is a promising route to reduce process costs. In this work, the effects of nitrogen and carbonate sources on Rhizopus arrhizus NRRL 1526 morphology and fumaric acid productivity were analysed, simplifying the traditional production broth composition. Moreover, a non-structured, non-segregated kinetic model was proposed and fitted to concentration data of all relevant components obtained in batches performed in triplicate with the selected production broth at 34 °C and 200 rpm in an orbital shaker.

Graphical Abstract

1. Introduction

Fumaric acid has been designated by the US Department of Energy (DOE) as one of the top 12 value chemicals to be produced from biomass [1,2]. In addition, the production of this acid by a fermentative process that can be implemented in a multi-feedstock biorefinery contributes to the development of the circular economy and bioeconomy [3].
The IUPAC name of fumaric acid is (2E)-But-2-enedioic acid, being a dicarboxylic acid with a double bond between C2 and C3, as well as the trans-isomer of maleic acid. This particular fact provides certain specific properties, such as a high melting temperature or a very low water solubility (7 g/L at 25 °C) [4].
Although the acid is widely used as an acidulant in the food and feed industries [4], a promising industrial application is as chemical building block, being the raw material to obtain several resins and polyamides [4,5]. In recent years, new applications for this acid have been developed, such as a supplement for cattle feeding, reducing up to 70% methane emissions [6]; in new biopolymers; and as a crosslinker for packaging materials, providing more sturdiness and modifying swelling and mechanical behaviour of hydrogels [7,8]. In medicine, fumaric acid and its esters are used as an active ingredient against the skin disease psoriasis and multiple sclerosis (encephalomyelitis disseminata), a chronic inflammatory autoimmune disease of the nervous system [9,10].
Biotechnological production of fumaric acid via fermentation is a process that was studied and developed in the 1950s [11]. However, fermentative production was substituted by more profitable processes based on fossil resources. In recent years, the interest for fermentative production of fumaric acid has increased through the concept of biorefinery, obtaining fumaric acid as a raw material along from food or agri-food industries-derived wastes [8,12,13]. Glucose is the main component in this kind of waste [14,15]. For this reason, the present study uses glucose as substrate to generate deeper knowledge about this process, seeking further development of the biorefinery process.
Filamentous fungi are considered as the best fumaric acid producers, standing out among Rhizopus spp. [4,8]. These microorganisms are employed in several industrial processes, such as the production of antibiotics, amino acids, biopolymers and carboxylic acids [2]. Classical operation modes are implemented at the industrial scale, such as submerged and solid state fermentation, while others are being actively researched, as is the case of simultaneous saccharification and fermentation [4,16].
The development and growth of filamentous fungi occurs on hyphae, generating different morphologies [4,5]. These morphologies are an indicator of the metabolic and cellular states, influencing the fungal production profile [17]. In fact, fungal morphology can be controlled through certain process conditions such as agitation or aeration rates [17,18,19], spore initial concentration [7] or supplementary nitrogen sources [5]. This morphological growth generates certain technical problems such as low oxygen transfer or high broth viscosity, with the precise quantification of the viable biomass being very complex.
For controlling the fungal morphology, several authors have immobilised the microorganism on different supports, from synthetic ones such as polypropylene [20] to natural carriers such as loofah fibres [21]. Using these immobilized biocatalysts, several operation regimes have been tested, such as the continue regime on tubular reactors or batch operation on stirred tanks. In these bioprocesses, different support configurations have been employed, such as small particles to generate pellets or direct mycelium attachment on fibrous structures or surfaces [20,21]. In the present study, the effect of several operation conditions on morphology were studied, including the selection of a proper diameter of CaCO3 used as CO2 supplier and pH controller [22].
Fungal metabolism generates fumaric acid through two different pathways. One pathway is the Tricarboxylic Acids cycle (TCA), common in all eukaryotic organisms. Fumaric acid produced by the TCA cycle is an intermediate and is not excreted outside of mitochondria [22,23,24]. The second pathway is the reductive TCA cycle (carried out in cytosol) [14], which is responsible for fumaric acid overproduction on filamentous fungi [14,22,25]. This latter pathway requires CO2 fixation. Either the presence of the gaseous compounds by direct feed or the addition of a carbonate, mainly CaCO3, is critical for the production of fumaric acid [26].
Several studies have concluded that nitrogen-limiting conditions increase fumaric acid yield [5,23,26]. Therefore, the nitrogen concentration in the broth must be followed to understand its consumption and influence over the productive profile, morphology and cell viability. Moreover, there is an evident lack of kinetic models regarding fumaric acid production. Only some kinetic studies have been published, mainly focused on yields calculation [20,27]. Kinetic models, starting from the relatively simple (as non-structured, non-segregated macroscopic kinetic models), can help to achieve an in-depth understanding of how operation conditions affect the bioprocess, as well as the external and internal dynamic phenomena, including cell metabolic reactions and their rates.
The objective of this work is to maximize the production of fumaric acid while simplifying the composition of the production broth, including the nitrogen sources. In addition, this work aims to provide a non-structured, non-segregated kinetic model able to explain and simulate the development and behaviour of the fungi on fumaric acid production. For this purpose, an analysis of nitrogen consumption and assimilation on the biomass was performed to understand how it affects fungal growth and viability.

2. Materials and Methods

2.1. Microorganism and Stock Elaboration

Rhizopus arrhizus NRRL 1526 was selected by screening for fumaric acid production. It was provided by the Agriculture Research Service culture collection (NRRL). It was received as a lyophilus, and was rehydrated and cultured on agar plates with PDA (potato dextrose agar) medium for 5 days at 34 °C to achieve proper growth and sporulation. After sporulation, spores were extracted and later quantified using a Neubauer chamber. The obtained individual doses of stock were conserved on a 20% w/w glycerol/saline solution at −80 °C.

2.2. Media and Culture Conditions

In the present study, some process conditions selected by previous researchers were applied [7]. All experiments were performed at 34 °C and 200 rpm, with an initial spore concentration of 109 spores/L on the inoculum, using 100 mL non-baffled Erlenmeyer flasks with 20 mL of each culture medium with cellulose covers [7]. To start each production run, the initial inoculum volume transferred to production medium was 10% v/v, using the inoculum culture obtained after 12 h in the aforementioned conditions. All experiments were performed in triplicate [7].
As previously described, the bioprocess was divided into two in-series stages: inoculum production and acid production. The inoculum stage is focused on the obtention of a fungal biomass with a proper morphology and optimal metabolic state [7]. This stage requires a medium specifically designed for fungal growth (inoculum medium) [11], which was modified by previous researchers to allow a free pH evolution for reaching the appropriate pellet morphology [7]. Its composition is described in Table 1.
The medium employed in the production stage was a consolidated benchmark medium used in several studies [7,28,29]. In the present study, this production medium was modified to enhance fumaric acid production, as shown in Table 1.

2.3. Carbonate Characterization

To control fungal morphology during the bioprocess, different types of calcium carbonate have been tested to determine the effect of different particle sizes and shapes or any slight compositional variation due to micronutrients [30].
To this end, Scanning Electron Microscopy with Energy Dispersion Spectroscopy (SEM-EDS) was applied using a JEOL JSM 6335F microscope (JEOL Ltd., Tokyo, Japan). Several high-resolution images for crystallization system and particle size characterization, alongside with local elemental composition analysis of the samples, were obtained.
To further determine the particle average size and its dispersion, the Focused Beam Reflectance Measurement (FBRM) technique was employed to measure the chord length of CaCO3 particles using a Particle Track 400 probe (PT400, Mettler-Toledo, Coslada, Madrid, Spain). This probe was equipped with a rotating laser beam, which was emitted to suspension and through the reflection time when laser beam interacted with every particle. Knowing the rotation speed, the chord length was calculated. Later, using a specific software, the particle size was determined using regression models [31,32].
In this way, a particle size distribution can be obtained for analysis, and the average particle diameter can be calculated.

2.4. Biomass Characterization

Due to the filamentous nature of the fungi, its biomass must be quantified using cell dry weight determination. For this purpose, the working protocol “one flask, one sample” was developed, where each sample taken is the whole content of one flask [7]. In the present work, the biomass was not only quantified but its structure and composition were investigated by several techniques.
Lyophilised biomass was analysed through SEM-EDS, using the same device as in calcium carbonate characterization. We obtained a high-resolution images for surface characterization (SEM), which was complemented with a semiquantitative composition determination (EDS).
In addition, the biomass composition was exactly determined by elemental microanalysis, conducted with an elemental microanalyzer LECO CHNS-932, which provides accurate results about the elemental composition of the fungal biomass.
To use both characterization techniques, the biomass must be completely lyophilized. For this purpose, the biomass was separated from the fermentation broth by centrifugating each flask content 3 times at 8,500 rpm, with a thorough washing. Next, the biomass was frozen at -80 °C for 24 h and subsequently lyophilized for 5 days. Finally, it was very finely grinded and analysed.

2.5. Sample Analysis

Substrates and metabolic products concentration obtained from production experiments were determined by HPLC using a modular device (Jasco PU-2089, AS-2059, CO-2060, RI-2031 & MD-2015, Jasco Corporation Ishikawamachi Hachioji-shi, Tokyo Japan), employing a REZEX ROA-Organic Acid H+ column and H2SO4 0.005 M as mobile phase at 0.5 mL/min and 60 °C.
Fumaric acid was quantified using a diode array detector (Jasco MD-2015) at a wavelength of 250 nm, while the concentration of all other existing substances on liquid samples, such as glucose, ethanol and malic acid, were measured by refractive index detector (Jasco RI-2031).
Bradford assays were performed to determine the soluble protein content in fermentation broth [33].
In addition, the sample pH and ammonia concentration were determined through a pH-meter Hanna Instruments HI-5521(Hanna Instruments, Woonsocket, Rhode Island, USA), using specific probes for pH (Hanna Instruments HI-1131) and ammonia concentration (Hanna Instruments HI-4101) determinations.

2.6. Mathematical Procedures

Specific software, namely Aspen Custom Modeller V10® (ACM) (Aspen Technology, Inc., Bedford, MA, USA) and OriginLab 2019® (OriginLab Corporation, Northampton, MA, USA) was used to perform fitting to different non-structured, non-segregated kinetic models. Mathematic methods for nonlinear fitting based on the Levenberg–Marquardt algorithm, combined with numeric integration by Euler method, were used.
The proposed kinetic models are described in Section 3.2. For the selection of the most suitable model for the experimental data, several statistical parameters were considered. Root Main Square Error (RMSE) is a parameter to minimize because its value is a measure of the error between the experimental and estimated data. On the other hand, F95 is a parameter to maximize, meaning the fitting of the data to a Fisher-Snedecor distribution in a 95% confidence must be always over a critical value (theoretical, tabulated) [34,35].
Finally, the percentage of variation explained (%VE) presents how suitable the model is to explain the evolution of the variables with time. Its value must be the closest possible to 100% [34,36].

3. Results and Discussion

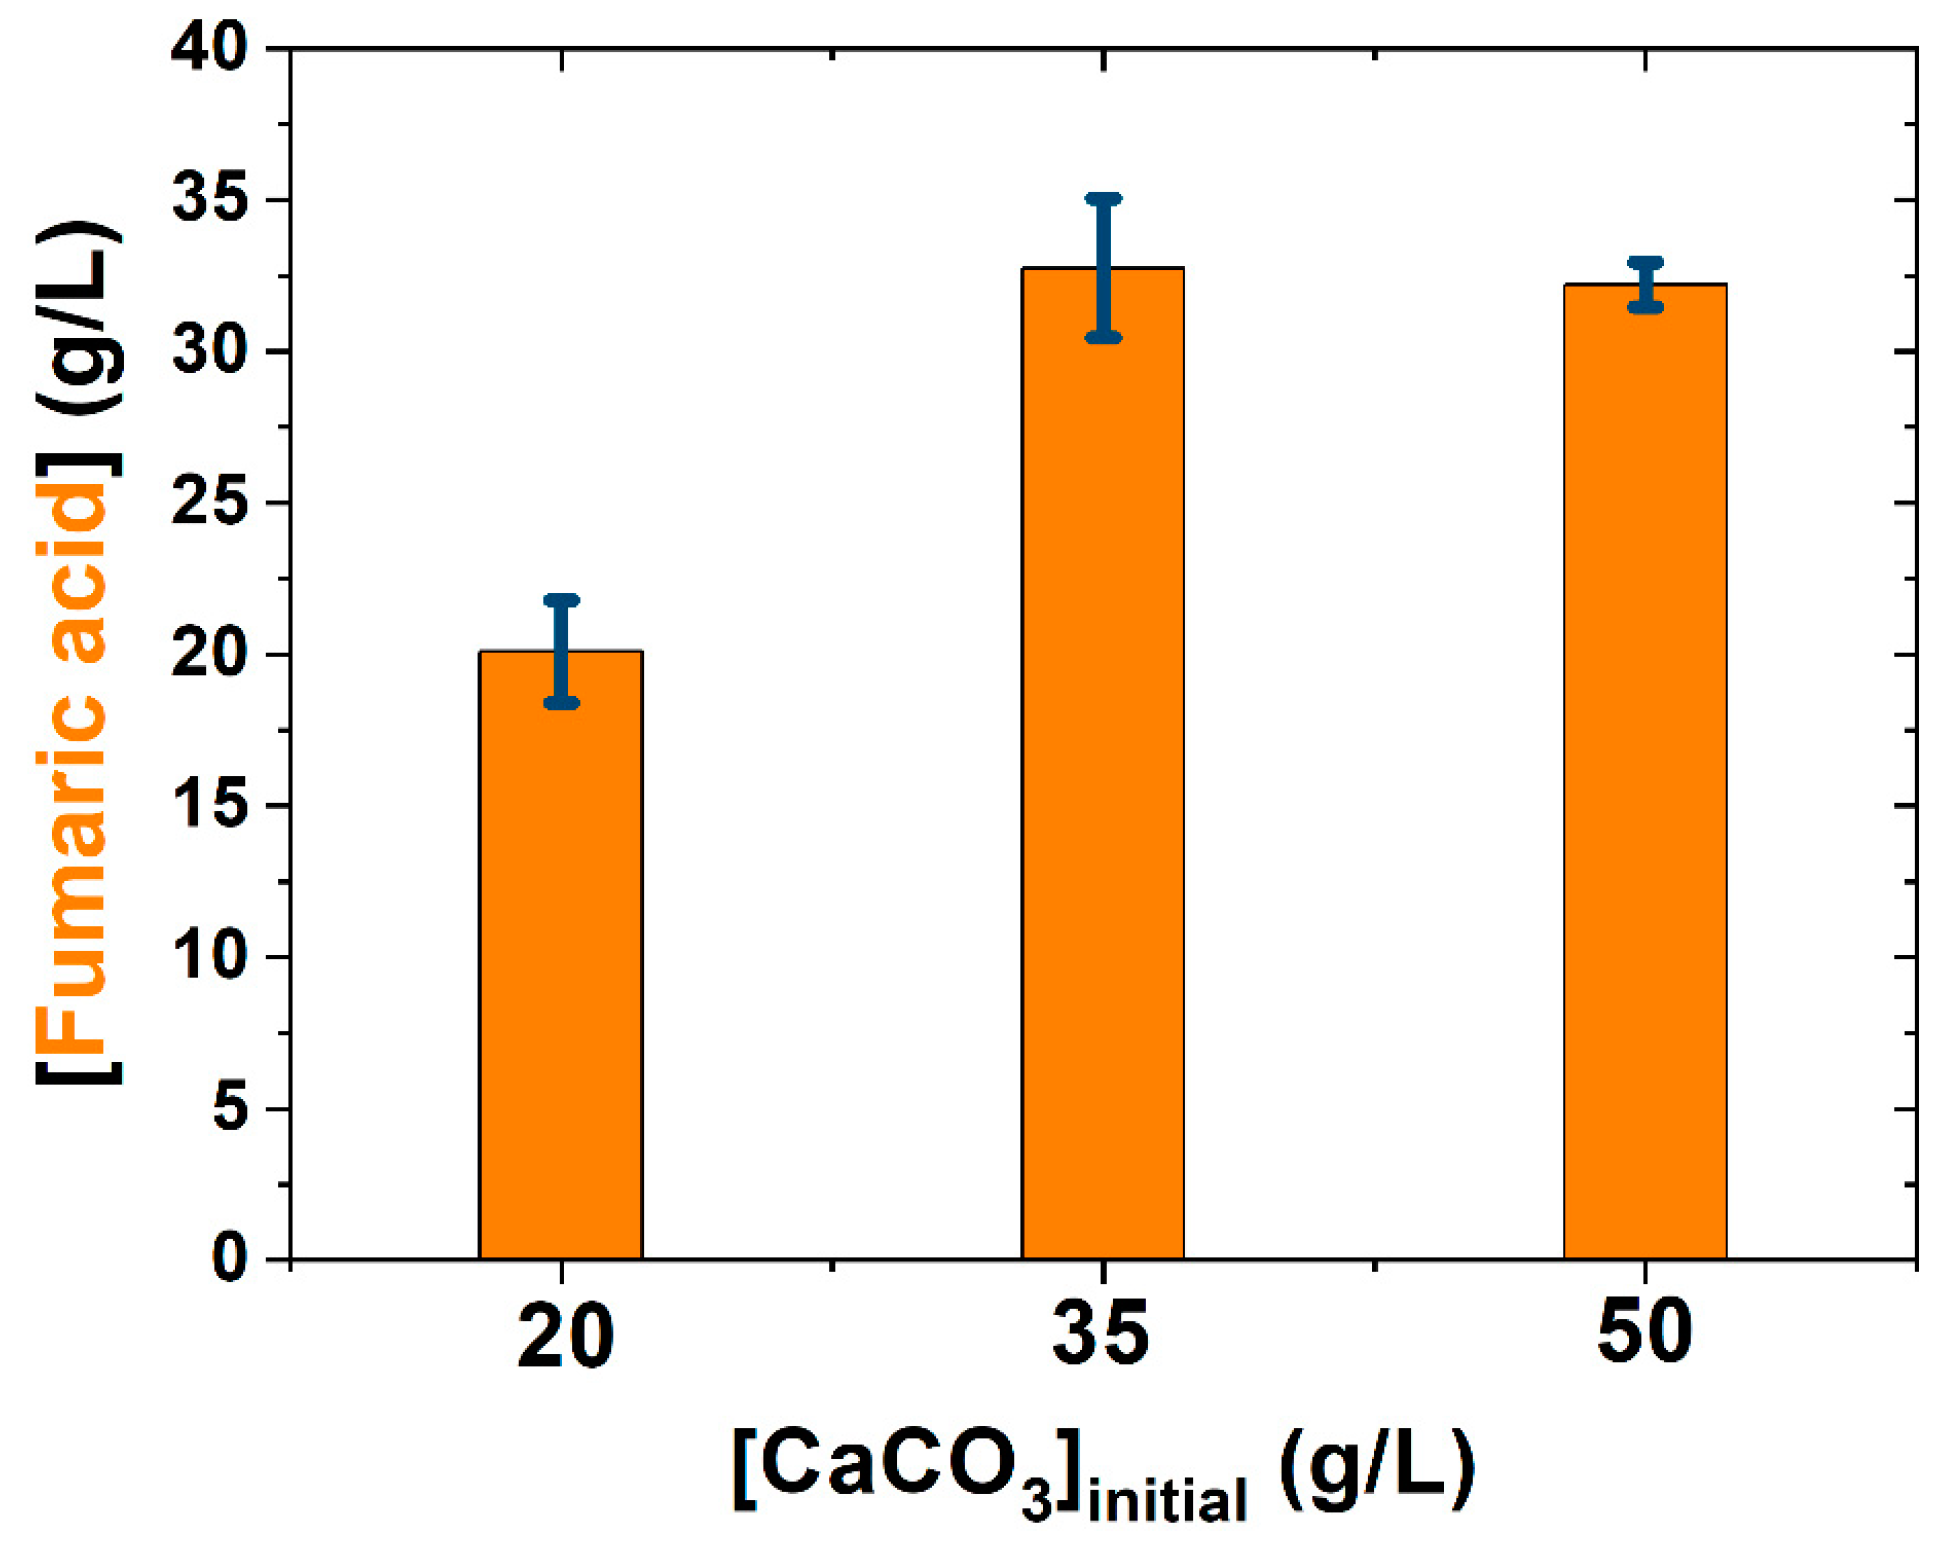
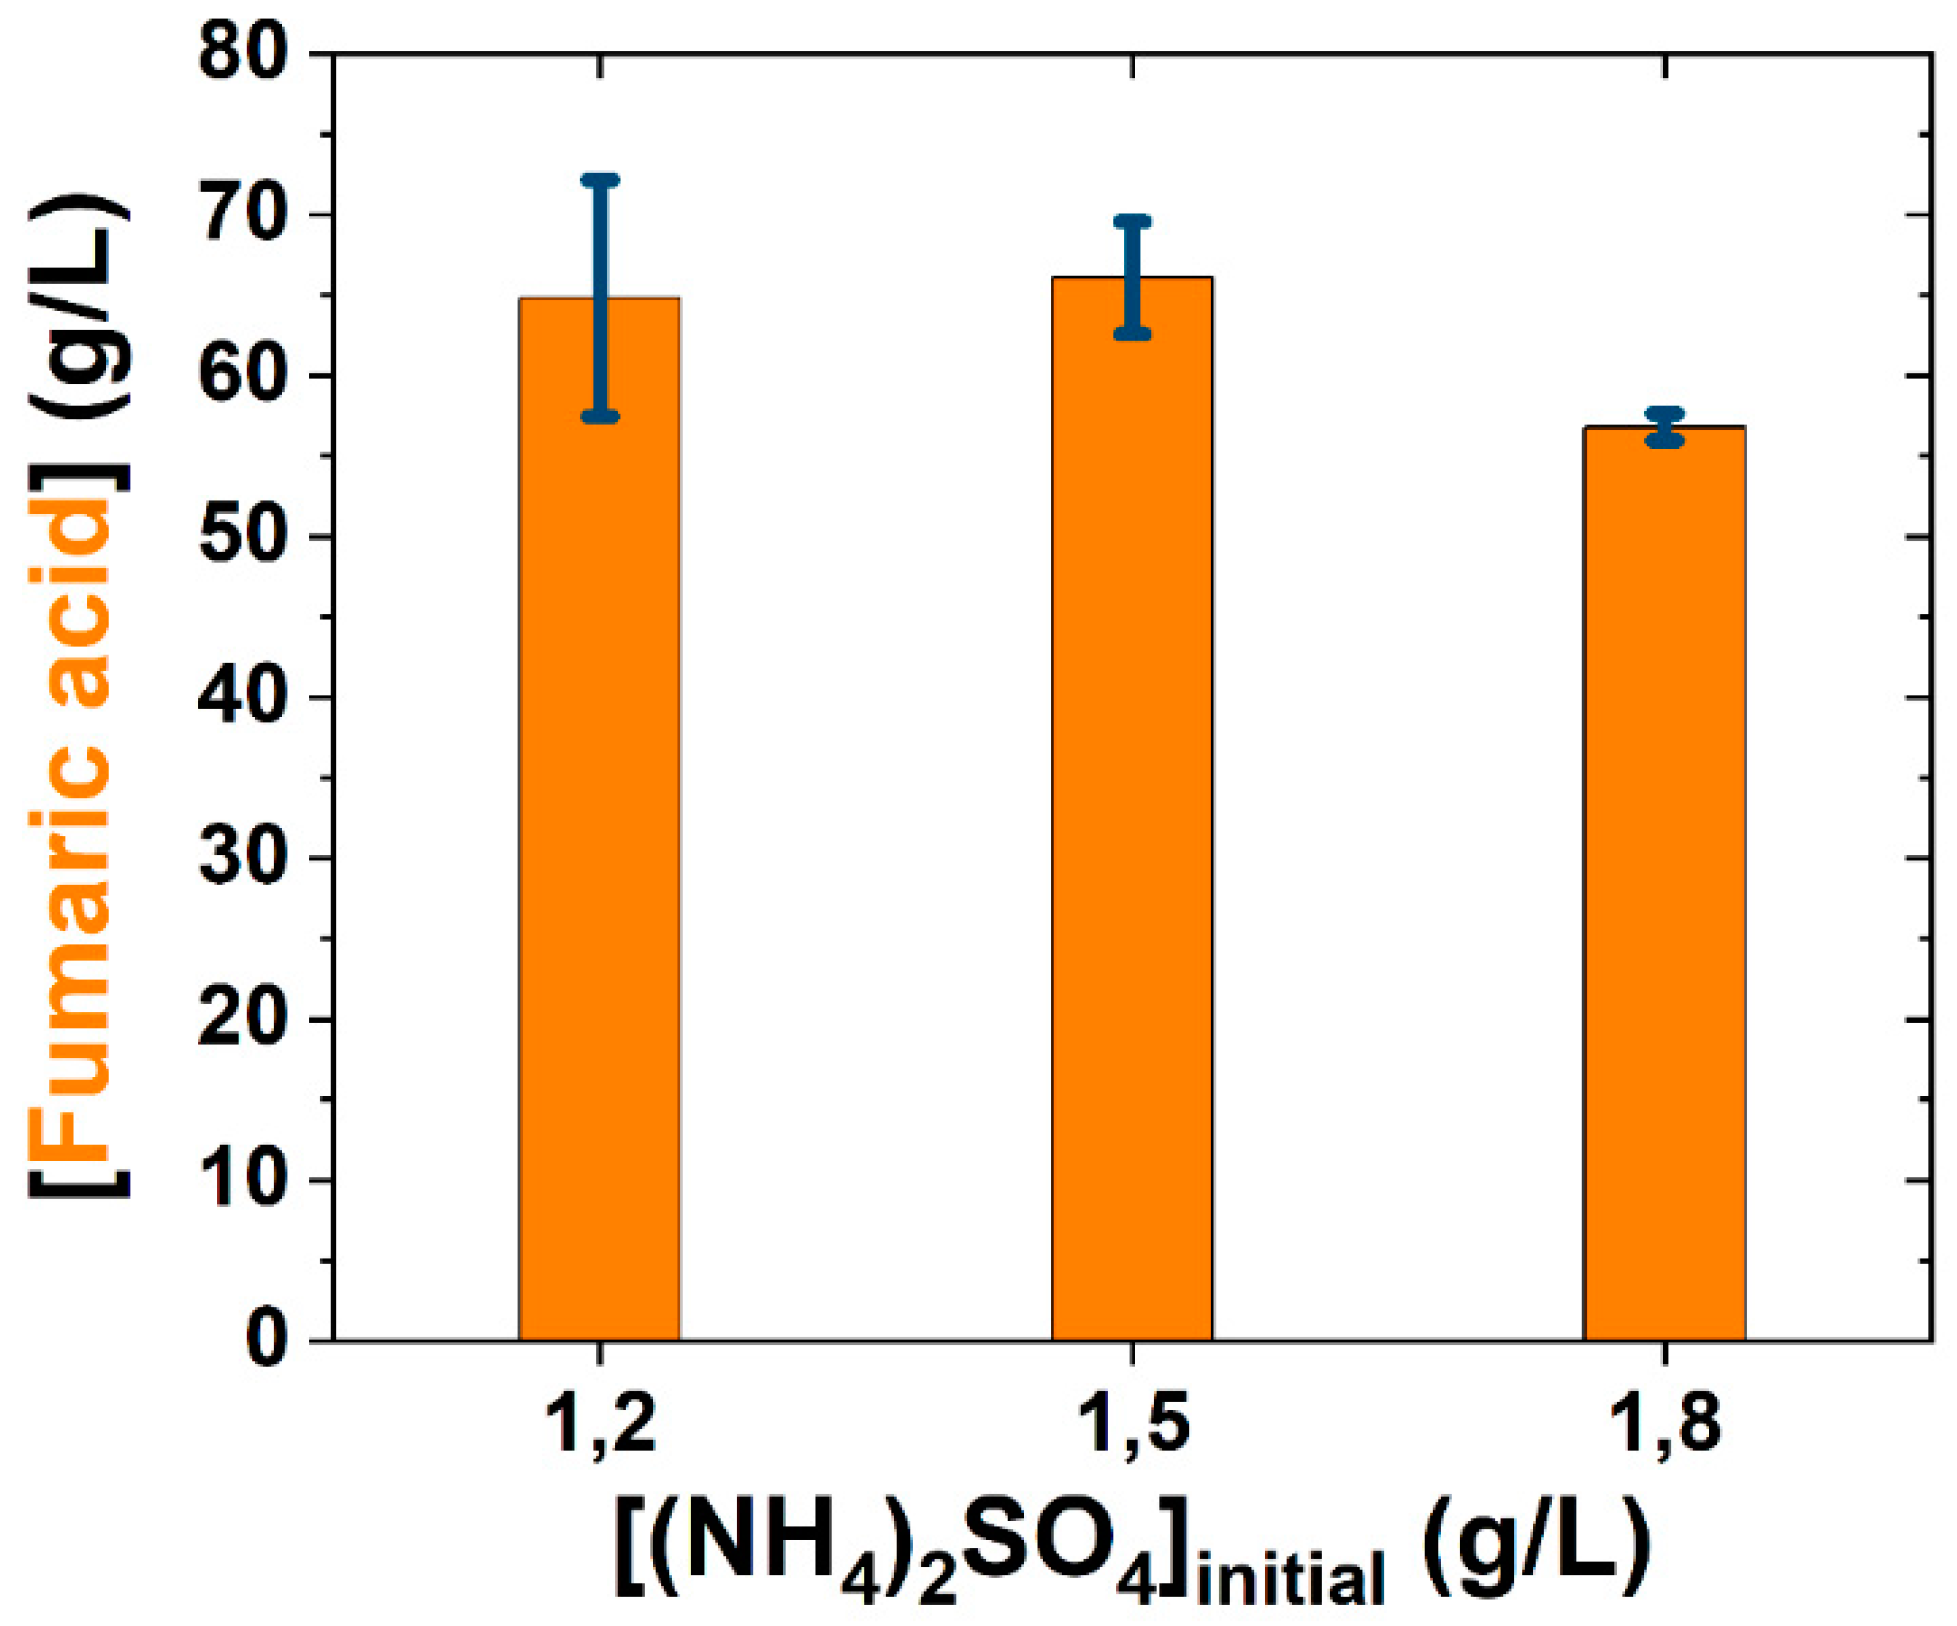
3.1. Medium Simplification

The first objective was to improve the production yield through the modification of the classical production medium [26].
Calcium carbonate concentration was initially studied to solve certain solidification problems found in several runs. The presence of CaCO3 has been confirmed to be essential for fumaric acid production by previous studies [7], because CO2 must be provided to the TCA reductive pathway and pH must be controlled between 7.0 and 5.5, avoiding very acid pH values.
It can be seen how a moderate reduction of CaCO3 composition (from 50 to 35 g/L) led to a similar fumaric acid concentration, even if a decrease of 15 g/L was performed, while the creation of solid deposits was avoided (Figure 1). At the same time, the pH decrease was slow during the process, only reaching pH values lower than 5 at the last hours of the process due to the high fumaric acid concentrations reached.
Furthermore, CaCO3 particle diameter was studied to determine the development of a proper morphology. At the same time, the possible effects of minor components of the salt and the shape of the crystals were analysed. In Figure 2A, the particle size distribution of two different kinds of calcium carbonate obtained by FBRM measurements can be observed, obtaining the average diameter of the particles. These results, combined with those from Figure 2B, show how a smaller particle size enhanced the fumaric acid yield. Depending on the particle size of CaCO3, different pellet sizes (and even morphologies) of R. arrhizus occurred. Using CaCO3, which has the smallest particle size, the best production of fumaric acid was reached.
To discern if the composition or shape and size (or both) were the causes of such behaviour, the examined samples were analysed by SEM-EDS. The results are displayed in Figure 3, showing how carbonate crystallization is possibly carried out on different systems (trigonal in Figure 3A, orthorhombic in Figure 3B) and the existence of evident differences regarding the microcrystal size and shape. It is interesting to observe how the CaCO3 of the class showed in Figure 3B lead to an increase in the fumaric acid production (Figure 3). The final particle size, measured by FDBR, was higher than microcrystals observed by SEM, as they aggregated and formed the particles detected by FBRM.
On the other hand, the composition provided from the SEM-EDS analysis showed that the micro composition of both carbonates was very close. Therefore, the differences observed in fumaric acid production were due to the shape and size of the particles and, apparently, not due to their composition.
In view of these results, the following experiments were performed at a reduced calcium carbonate concentration (35 g/L) using a solid with an average particle diameter of 20.3 μm. The particles were aggregations of microcrystals belonging to the orthorhombic system with a length of approximately 1 μm and width of approximately 0.3 μm.
An additional simplification of the production medium was to remove tartaric acid, since its concentration is very low and, a priori, it does not appear to have a great influence on the process. It was described on the reference medium by Ling and Ng in 1989 [28] but it does not appear elsewhere in the literature [26].
As for the nitrogen sources, removing corn steep liquor (CSL) could negatively affect fumaric acid production and fungi’s metabolic profile, as it has been demonstrated that different nitrogen sources directly affect fungus morphology [5]. Therefore, CSL was removed only in the production medium but not in the inoculum medium, because, in its presence, pellet morphology with an appropriate size is reached and developed in the inoculum stage, while CSL concentration on the production medium does not appear to have an important role on production stage [5,26].
As can be seen in Figure 4, removing tartaric acid and CSL increased the selectivity of fumaric acid production, shifting a fumaric and malic acids coproduction to a fumaric acid production with a much lower presence of malic acid as a by-product.
As it has been demonstrated that limited nitrogen conditions increase fumaric acid production on different substances of fungi and yeasts [5,37], different concentrations of the inorganic nitrogen source ((NH4)2SO4) were tested to find an improved yield of fumaric acid production.
In Figure 5, several final concentrations of fumaric acid are presented when different initial concentrations of ammonium sulphate were used. Lower concentrations of (NH4)2SO4 (not provided) were also tested, However, using initial values under 1.2 g/L modifies the morphology of the fungi change from pellets to clumps, changing the metabolic profile and drastically reducing the fumaric acid production yield (< 10 g/L). Therefore, the final concentration chosen to improve fumaric acid production was 1.2 g/L. This way, the production medium composition was as simple as possible, having an improved result from the reference concentration (1.8 g/L).
Once the modifications of the production medium were applied, the fumaric acid yield was very close or higher than those obtained in the literature in batch processes developed in orbital shaken flasks (Table 2). In Table 2, we compiled the results of similar studies where conceptualization, conditions and execution are comparable. Glucose was used as main substrate, and the broth composition was very similar to the one employed in this work. However, some differences are found concerning the nitrogen source, as these studies also focused on the effect of the nitrogen source and content on the fungal morphology and production. These differences in the media composition, together with slight changes in the working procedures (different inocula procedures and pH-controlling strategies), lead to the results shown in Table 2.
There are two different ways to calculate the maximum theoretical yield of fumaric acid depending on the metabolic pathway: (1) The formation of fumaric acid via the TCA cycle enables a theoretical yield of a maximum of 1 molfumaric acid/molconsumed glucose or 0.64 gfumaric acid/gconsumed glucose. (2) Reductive carboxylation provides a maximum yield of 2 molfumaric acid/molconsumed glucose or 1.29 gfumaric acid/gconsumed glucose [38]. In practice, however, a lower yield will be expected, since an exclusive course of the reductive carboxylation would lead to an energy deficit due to the consumption of ATP during the CO2 fixation. Thus, in the fermentative production of fumaric acid, the oxidative citric acid cycle is also active to maintain the energy balance [39].
In short, after medium simplification, the production yield clearly increased (from 0.26 to 0.46 gFumaric acid/gconsumed glucose). Therefore, the modified broth was employed for the runs which are the basis of the subsequent kinetic study.

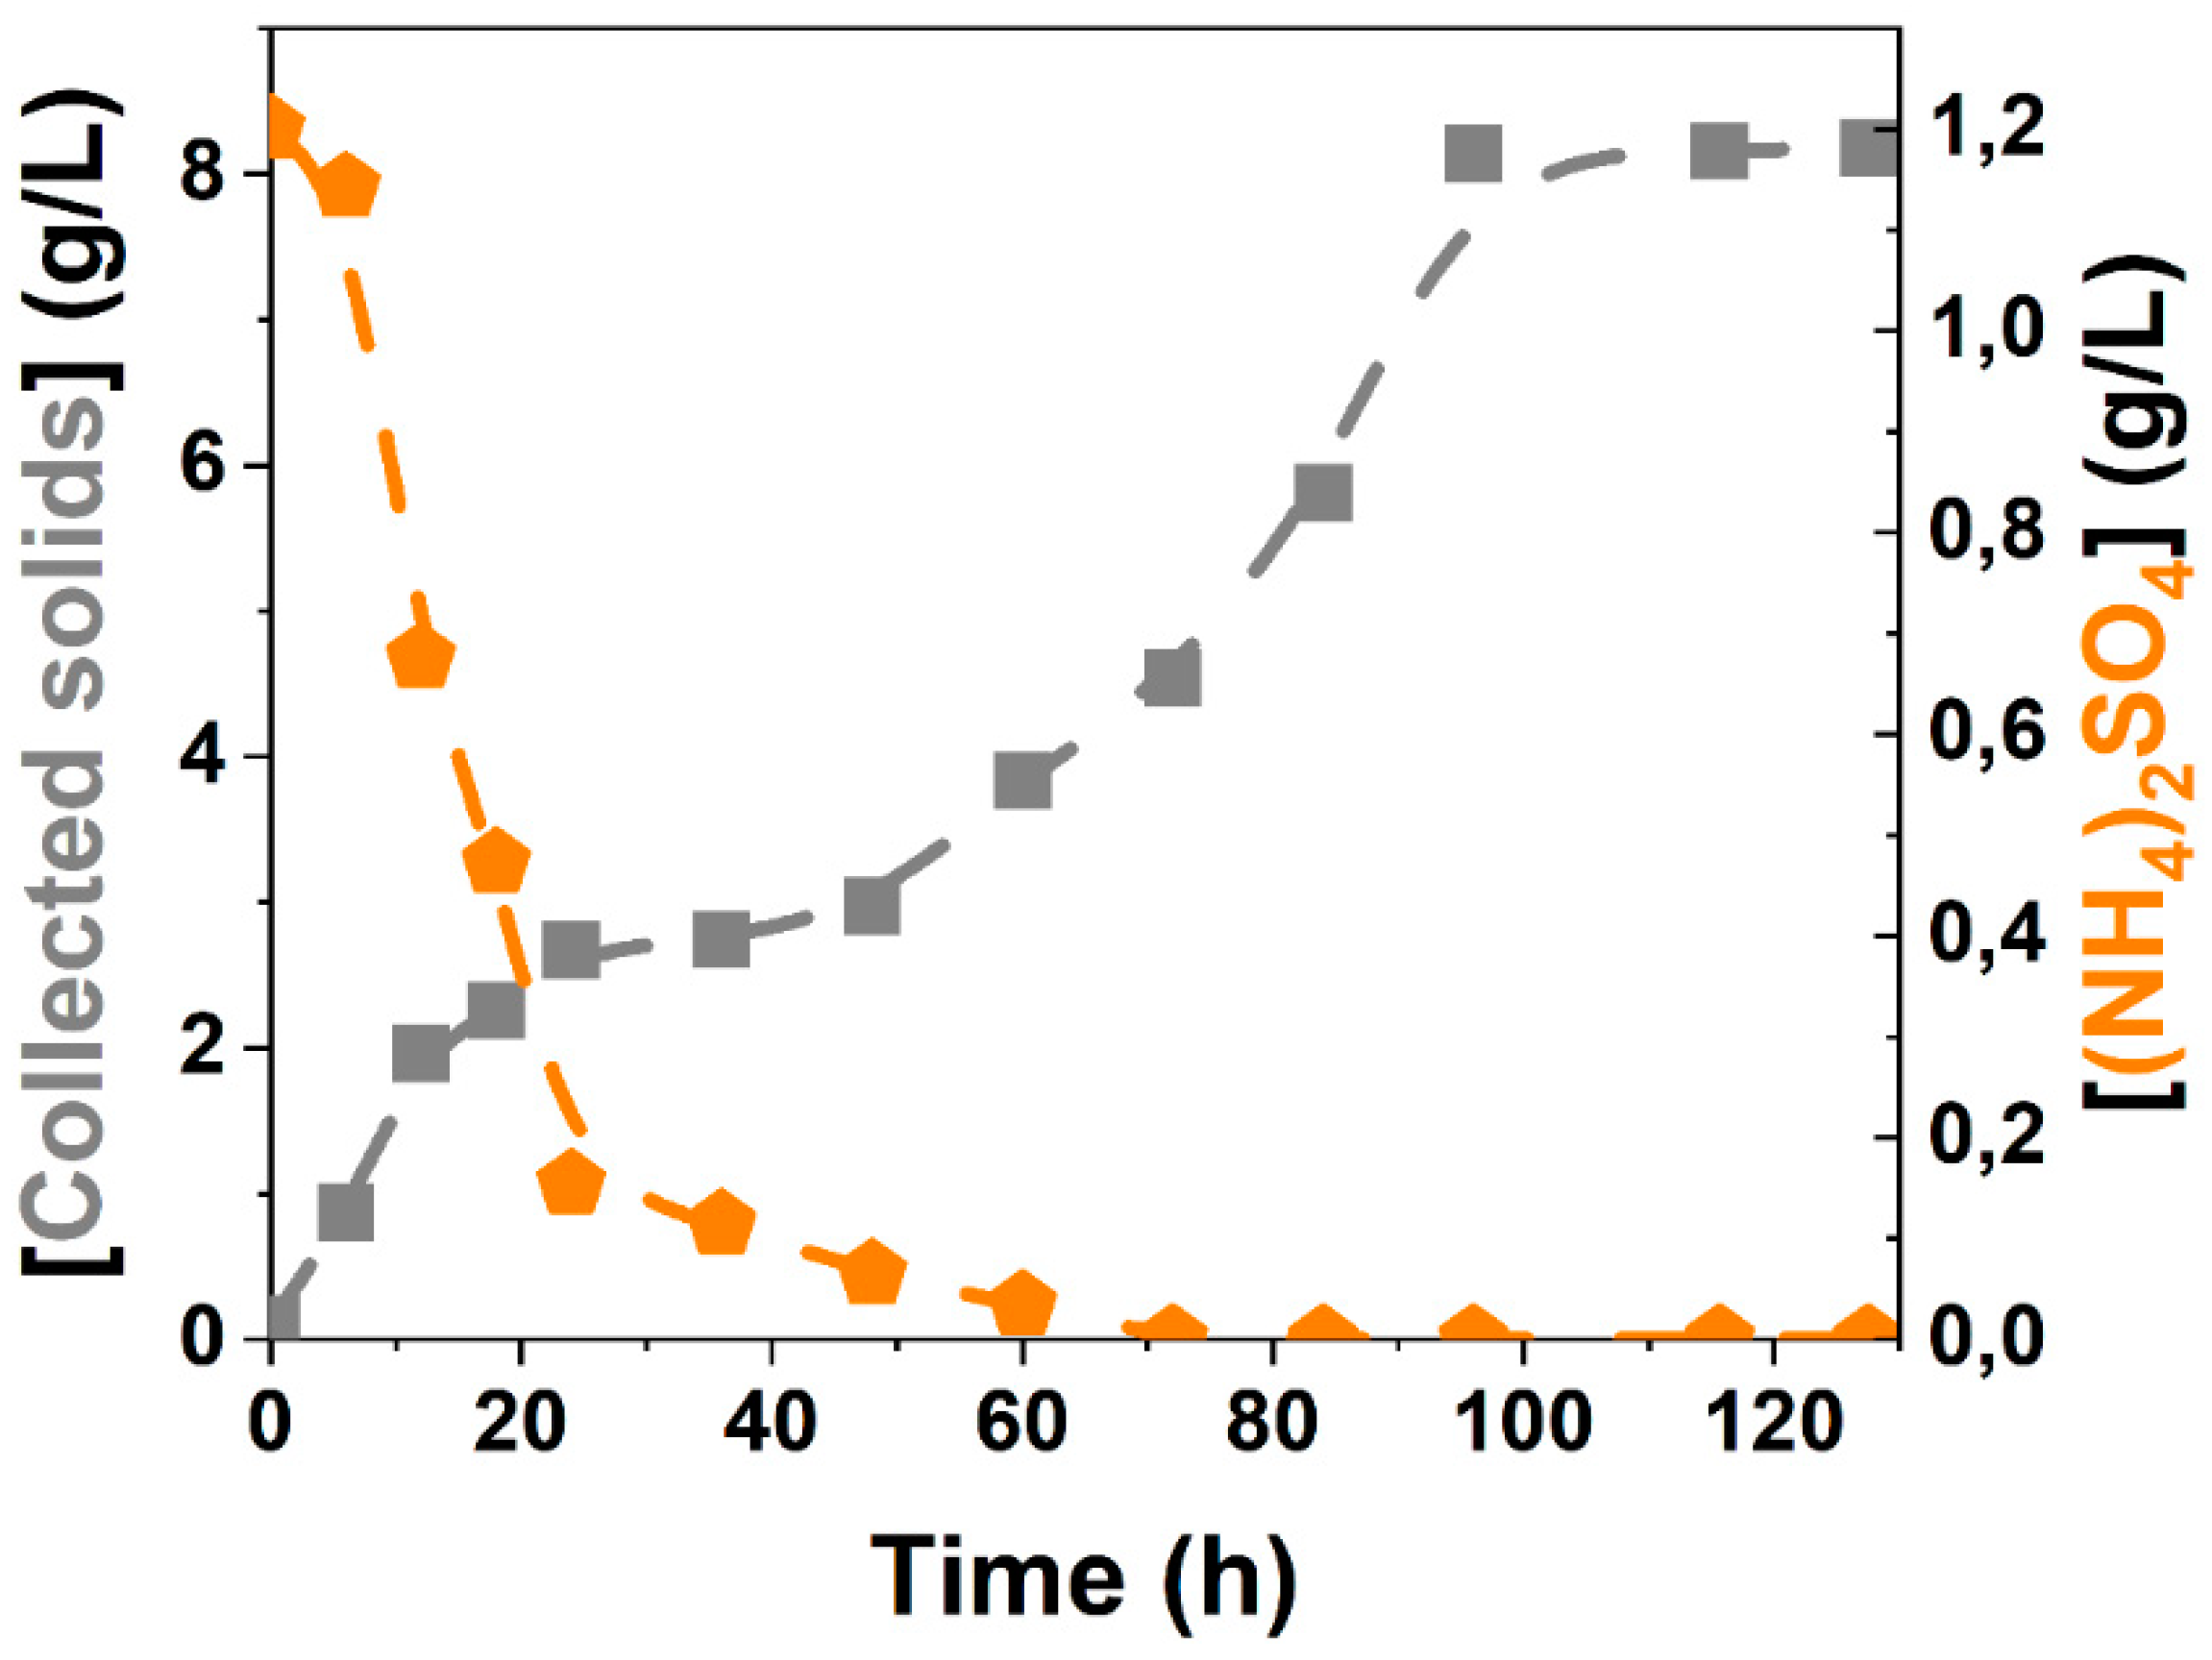
3.2. Kinetic Modelling

The kinetic study was performed by following the concentration of all substances present on the fermentation broth. We proposed an adequate non-structured, non-segregated kinetic model and, finally, fitted a proposed non-structured, non-segregated kinetic model to all retrieved data.
In Figure 6, the average evolution of the relevant substances in the bioprocess, including the biomass, is reflected (runs performed in triplicate). At first glance, an apparent diauxic growth was perceived, with two growing phases in series, as observed by following the dry weight of the solid phases collected during the experiment. Previously, these solids were recognised as biomass [7]. However, the observed behaviour indicates that these collected solids were composed not only of living biomass but also by dead biomass. In addition, these collected solids could also contain a great number of fumaric acid crystals as, due to its very low solubility in water, the acid tends to form crystals above diverse surfaces.
The results shown in Figure 7 indicate that nitrogen source was quickly consumed in the first 72 h, agreeing with the first exponential increase in the collected mass of dry solids. The second increase of the dry weight could be fumaric acid accumulation over the fungal surface as calcium fumarate. At the same time, a certain biomass renovation must have occurred in the context of the stationary phase of growth, although this latter phenomenon should not have affected the total solid mass at a given bioprocess time. Therefore, it is possible to allocate this second growth phase of solids to the fumaric acid accumulation onto mycelium due to the great production yield reached and its low solubility at the operation temperature. In this case, only the first apparent growth could be considered real biomass growth.
To study this hypothesis, a deeper study about nitrogen evolution and biomass composition was conducted. First, we confirmed that no apparent lysis was present by measuring any peptide or protein accumulated in the broth. Thus, a Bradford assay was performed in samples withdrawn during a fermentation process. In this experiment, no significant dissolved protein was measured in the fermentation broth. We observed signals very close to those of the blanks, even below them, suggesting that the soluble protein in the broth was almost absent. In addition, this observation indicates that all nitrogen assimilated by the biomass remained inside the mycelium [42], being recycled within the biomass during the stationary phase.
Second, the fumaric acid accumulation over the mycelium surface was studied through a SEM-EDS analysis. For this purpose, several biomass samples were obtained at several experimental time values and observed, providing high-definition images of hyphae (Figure 8) and an approximate quantification of carbon composition in the biomass. Comparing Figure 8A and Figure 8B, it can be seen how micro crystals were precipitated on the mycelium surface.
However, SEM-EDS provides only morphological and semi-quantitative elemental composition analysis. For more accurate results of biomass elemental composition, an elemental micro-analysis by total combustion was performed on the same biomass samples. The results are compiled in Table 3.
When observing the temporal evolution of the composition of the collected solids, it is evident that the C:N ratio increased as the process proceeded. The nitrogen content on the solid lower increased with time, which confirms the hypothesis that fumaric acid is accumulated in and on the hyphae. This effect can also be observed on the sulphur content, with both (N and S) contents decreasing at the same rate, undoubtedly indicating that the protein quantity was kept constant while the solid composition was enriched only in the C, O and H contents due to the fumaric acid accumulation. For these reasons, the total biomass concentration can be calculated using the assimilated nitrogen content, taking as the value of the solid’s composition at 6 h as reference. It could be assumed that all solid at this time was biomass because the fumaric acid was totally dissolved at the low concentration at this time (lower than 1 g/L). Therefore, the solid collected could be considered living biomass.
Using these composition values, the molecular formula of the biomass was CH1.80O0.68N0.22. From this average molecular formula and considering that all ammonium consumed from the fermentation broth was fixed and converted into living biomass, its concentration can be calculated (Figure 9), increasing the biomass concentration while ammonium sulphate was consumed, and keeping it constant after ammonium sulphate was totally consumed.
This final constant value of the biomass concentration in the stationary phase was proportional to the initial ammonium concentration. Knowing this concentration and the composition of biomass, the concentration of fungal biomass can be calculated, as shown in Figure 9. These are the average biomass values that will be employed when fitting the kinetic model to the experimental data.
Another aspect remarked previously is the scarce presence of by-products. The malic acid concentration was reduced from 26.4 to 7.8 g/L malic acid through medium improvement, becoming a by-product instead of being a co-product.
The fumaric acid production profile suggests a production that is not associated or partially associated with growth. This association will be considered to propose the kinetic model.
Ethanol is a by-product obtained though the pyruvate-acetaldehyde route [7]. In our results, the behaviour of ethanol is complex. At the beginning, ethanol increases in the same way as biomass, which suggests a production associated with growth. However, at certain moment, its concentration starts to decrease, which could be attributed to evaporation or to its consumption by fungi as an alternative carbon source [20]. This behaviour have been previously observed by other authors [20,43].
To determine the nature of the behaviour of the ethanol, a simulation experiment was performed in the same conditions employed for the fermentation kinetic runs. The results shown in Figure 10 allow us to conclude that the ethanol concentration decreases because of evaporation, a fact that must be considered in the kinetic model, in particular, in the mass balance of ethanol.
After these observations, a reaction scheme to develop the kinetic model was proposed, considering the total biomass production and temporal evolutions of the substrates, products and by-products (see points in Figure 11).
Other authors have considered three different reactions: Respiration and biomass production, ethanol production and fumaric acid production [20]. In the present study, we considered only two reactions due to the different processes observed in the evolution of the different substances. In particular, we observed a first reaction, reflected in Equation (1), which comprises respiration, in addition to biomass and ethanol productions. These processes are associated with biomass growth.
The second reaction of our model (Equation (2)) describes the TCA reductive pathway, described in Section 1 for producing malic and fumaric acids.
y GX   Glucose   + y NX   NH 4 +   [ X ]   Biomass   + y EX   Ethanol r 1 = μ m · [ Biomass ] · [ ( NH 4 ) 2 SO 4 ]
y GF Glucose + y CO 2 F CO 2 [ X ] Fumaric   acid   +   y MF   Malic   acid   r 2 = k F · [ Biomass ] · [ Glucose ]
The kinetic model proposed to fit the experimental data is a function of the biomass growth model, as it is usual in non-structured non-segregated kinetic models. An empirical potential model was proposed (Equations (1) and (3)), which is convenient for having only one parameter. The empirical potential model has a growth rate of μm, providing a simple model. Once the biomass production model is chosen, the ammonium sulphate consumption rate is defined depending only on the biomass production, linked through a yield, YNX (Equation (4)). The glucose consumption rate reflects both processes (Equations (1) and (2)), as different terms regarding the glucose consumption to produce biomass (expressed by the yield YGX) and different products (expressed by the yield YGF) must be introduced (Equation (5)). Finally, to complete the kinetic model, the production rate of the different products must be proposed. The fumaric acid production rate is defined with a non-associated growth equation (which was tested to be the best fit), where the production rate is completely independent of the biomass growth, and is constantly produced depending on biomass and glucose concentrations with a kinetic parameter for production (kF), as suggested by Figure 6 (Equations (2) and (6)). Malic and fumaric acids productions evolve almost in parallel, as both of them are produced in the same metabolic pathway (Equation (2)), a reason why, with a certain frequency, Rhizopus sp. produces both on a co-production regime [7]. For this reason, the suggested kinetic model involves both acids in the same reaction, linking their production rates with a yield, YMF (Equations (2) and (7)). Finally, the ethanol rate is defined coupling a kinetic term that is associated with the growth production model through a yield (YEX) and another term considering ethanol evaporation, a phenomenon observed and commented on previously. This evaporation term is only dependent on the ethanol concentration, and has an evaporation kinetic parameter (kE) (Equation (8)).
R X = d [ Biomass ] dt = r 1
R N = d [ ( NH 4 ) 2 SO 4 ] dt = Y NX · r 1
R G = d [ Glucose ] dt = Y GX · r 1 Y GF · r 3
R F = d [ Fumaric   acid ] dt = r 2
R M = d [ Malic   acid ] dt = Y MF · r 2
R E = Y EX · r 1     d [ Ethanol ] dt = Y EX · r 1 k E · [ Ethanol ]
For fitting the proposed kinetic model (Equations (3)–(8)) to the experimental data, coupled non-linear regression and fourth-order Runge-Kutta algorithms implemented in software Aspen Custom Modeler® V11 have been employed, obtaining the value and error interval of the pertinent kinetic parameters, which are compiled in Table 4. The obtained results are represented in Figure 11 (as lines), showing how the proposed model reasonably fits all retrieved kinetic data. Thus, the model seems to be able to predict and simulate all phenomena observed in the process.
Observing the value of the kinetic parameters represented in Table 4, the accurate fitting of the model to the experimental data is also evident, with the model having reasonable values for all parameters with low standard errors. The goodness-of-fit bounty is confirmed when considering the values of the RMSE, F95 and the percentage of variation explained (%VE) (Table 5). The high value of F95 is remarkable, being much higher than the reference value. The value of %VE, which is being very close to 100%, is also appropriate.

4. Conclusions

The fumaric acid production yield was enhanced through media modification, reaching a simpler composition that provides nitrogen-limiting conditions and can be of importance for the further purification of this dicarboxylic acid [34]. The calcium carbonate particle size and shape have shown to be very important parameters on the development of a proper morphology, having direct effects on the production profile and yield.
As dry weight leads to an apparent diauxic growth that is inconsistent with nitrogen mass balance, a new method for quantifying total biomass based on combining elemental microanalysis and ammonium quantification in the broth was developed and applied. On one hand, biased dry weight measurements are due to the presence of calcium fumarate crystals while, on the other, the application of the new method leads to a constant biomass concentration after the nitrogen source is depleted.
Finally, we proposed a simple non-structured, non-segregated kinetic model for fumaric acid production that was successfully fitted to all experimental data obtained in runs performed with the best production medium composition. The model seems to adequately represent the temporal evolution of all relevant chemical substances, including the corrected fungal biomass.

Author Contributions

Conceptualization, V.M.-D., U.P., L.E., A.K., M.L. and V.E.S.; methodology, V.M.-D., U.P., L.E. and A.K.; investigation, V.M.-D., P.I.A.C., L.E. and A.K.; data curation, V.M.-D. and P.I.A.C.; writing—original draft preparation, V.M.-D.; writing—review and editing, M.L. and V.E.S.; supervision, M.L. and V.E.S.; project administration, U.P., M.L. and V.E.S.; funding acquisition, M.L. and V.E.S. All authors have read and agreed to the published version of the manuscript.

Funding

This work was supported by the Spanish Science and Innovation Ministry through a grant for VMD with reference PRE2018-084908 and through the research project with reference CTQ2017-84963-C2-1-R. This funding is thankfully appreciated. This work was also carried out in the framework of the European Research Area Network for Industrial Biotechnology (ERA-IB project “Fumaric Acid for Polymer Applications (FAPA)”) and was funded by the German Federal Ministry of Food and Agriculture, following a decision of the German Bundestag, via the Agency of Renewable Resources (Grant No. 22029515).

Institutional Review Board Statement

Not applicable.

Informed Consent Statement

Not applicable.

Data Availability Statement

All data supporting this paper results are included in this document.

Acknowledgments

We would like to acknowledge the help of Cynthia Hopson and the research group “Development of Processes and Products of Low Environmental Impact” belonging to the Complutense University of Madrid for their collaboration in the lyophilisation process. Likewise, we are very grateful to Patricio Lopez-Exposito and Angeles Blanco, from the research group “Cellulose and Paper” of the same university, for their collaboration on particle size distribution studies. The technical support of Ms. Ana María Vicente (SEM-EDS) and María José Saucedo (Elemental Microanalysis), from the National Center of Electronic Microscopy and the Complutense Microanalysis Facility, respectively, is gratefully acknowledged.

Conflicts of Interest

The authors declare no conflict of interest. The funders had no role in the design of the study; in the collection, analyses, or interpretation of data; in the writing of the manuscript; or in the decision to publish the results.

Abbreviations

Components
CSLCorn Steep Liquor
EEthanol
FFumaric acid
GGlucose
MMalic acid
NAmmonium sulphate
PDAPotato Dextrose Agar medium
XBiomass
Nomenclature
%VEPercentage of variation explained
DOEU. S. Departement Of Energy
dpParticle diameter
F95Parameter of F-test at 95% confident
kEEthanol evaporation parameter
kFFumaric acid production kinetic parameter
RMSERoot Main Square Error
REEthanol evolution rate
RFFumaric acid production rate
RGGlucose consumption rate
RMMalic acid production rate
RNAmmonium sulphate consumption rate
RXBiomass production rate
TCATri-Carboxylic Acid cycle
yCO2FCarbon dioxide-fumaric acid stoichiometric yield
yEXEthanol-biomass stoichiometric yield
YEXEthanol-biomass yield
yGFGlucose-fumaric acid stoichiometric yield
YGFGlucose- fumaric acid yield
yGXGlucose-biomass stoichiometric yield
YGXGlucose-biomass yield
yMFMalic acid-fumaric acid stoichiometric yield
YMFMalic acid-fumaric acid yield
YNXAmmonium sulphate-biomass yield
yNXAmmonium sulphate-biomass stoichiometric yield
μmBiomass specific growth rate

References

  1. Werpy, T.; Petersen, G. Top Value Added Chemicals from Biomass Volume I—Results of Screening for Potential Candidates from Sugars and Synthesis Gas Energy Efficiency and Renewable Energy; PNLL: Richland, WA, USA, 1992. [Google Scholar]
  2. Jiménez-Quero, A.; Pollet, E.; Zhao, M.; Marchioni, E.; Avérous, L.; Phalip, V. Itaconic and fumaric acid production from biomass hydrolysates by Aspergillus strains. J. Microbiol. Biotechnol. 2016, 26, 1557–1565. [Google Scholar] [CrossRef] [PubMed] [Green Version]
  3. Esteban, J.; Ladero, M. Food waste as a source of value-added chemicals and materials: A biorefinery perspective. Int. J. Food Sci. Technol. 2018, 53, 1095–1108. [Google Scholar] [CrossRef]
  4. Martin-Dominguez, V.; Estevez, J.; De Borja Ojembarrena, F.; Santos, V.E.; Ladero, M. Fumaric acid production: A biorefinery perspective. Fermentation 2018, 4, 33. [Google Scholar] [CrossRef] [Green Version]
  5. Zhang, K.; Yu, C.; Yang, S.T. Effects of soybean meal hydrolysate as the nitrogen source on seed culture morphology and fumaric acid production by Rhizopus oryzae. Process. Biochem. 2015, 50, 173–179. [Google Scholar] [CrossRef]
  6. Das, R.K.; Brar, S.K. Enhanced fumaric acid production from brewery wastewater and insight into the morphology of Rhizopus oryzae 1526. Appl. Biochem. Biotechnol. 2014, 172, 2974–2988. [Google Scholar] [CrossRef]
  7. Martin-Dominguez, V.; Bouzas-Santiso, L.; Martinez-Peinado, N.; Santos, V.E.; Ladero, M. Kinetic Modelling of the coproduction process of fumaric and malic acids by Rhizopus arrhizus NRRL 1526. Processes 2020, 8, 188. [Google Scholar] [CrossRef] [Green Version]
  8. Magalhães Júnior, A.I.; Soccol, C.R.; Camara, M.C.; Molina Aulestia, D.T.; de Souza Vandenberghe, L.P.; Cesar de Carvalho, J. Challenges in the production of second-generation organic acids (potential monomers for application in biopolymers). Biomass Bioenergy 2021, 149, 106092. [Google Scholar] [CrossRef]
  9. Das, R.K.; Brar, S.K.; Verma, M. Fumaric Acid; Elsevier Inc.: Amsterdam, The Netherlands, 2016; ISBN 9780128029800. [Google Scholar]
  10. Weißert, R. Multiple Sklerose-Risiken und Nutzen der neuen antiinflammatorischen Substanzen. J. Neurol. Neurochir. Psychiatr. 2014, 16, 95–101. [Google Scholar]
  11. Rhodes, R.A.; Moyer, A.J.; Smith, M.L.; Kelley, S.E. Production of fumaric acid by Rhizopus arrhizus. Appl. Microbiol. 1959, 7, 74–80. [Google Scholar] [CrossRef]
  12. Sebastian, J.; Dominguez, K.V.; Brar, S.K.; Rouissi, T. Fumaric acid production using alternate fermentation mode by immobilized Rhizopus oryzae-a greener production strategy. Chemosphere 2021, 281, 130858. [Google Scholar] [CrossRef]
  13. De la Torre, I.; Martin-Dominguez, V.; Acedos, M.G.; Esteban, J.; Santos, V.E.; Ladero, M. Utilisation/upgrading of orange peel waste from a biological biorefinery perspective. Appl. Microbiol. Biotechnol. 2019, 103, 5975–5991. [Google Scholar] [CrossRef] [PubMed]
  14. Abraham, A.; Moideen, S.K.; Mathew, A.K.; Sr, A.R.; Sindhu, R.; Pandey, A.; Sang, B.-I.; Sukumaran, R.K. Fumaric acid production from sugarcane trash hydrolysate using Rhizopus oryzae NIIST 1. Indian J. Exp. Biol. 2020, 58, 548–556. [Google Scholar]
  15. Papadaki, A.; Papapostolou, H.; Alexandri, M.; Kopsahelis, N.; Papanikolaou, S.; de Castro, A.M.; Freire, D.M.G.; Koutinas, A.A. Fumaric acid production using renewable resources from biodiesel and cane sugar production processes. Environ. Sci. Pollut. Res. 2018, 25, 35960–35970. [Google Scholar] [CrossRef] [PubMed]
  16. Wakai, S.; Arazoe, T.; Ogino, C.; Kondo, A.; Song, P.; Li, S.; Ding, Y.; Xu, Q.; Huang, H.; Peleg, Y.; et al. Future insights in fungal metabolic engineering. Appl. Microbiol. Biotechnol. 2017, 115, 49–53. [Google Scholar] [CrossRef] [PubMed]
  17. Papadaki, A.; Androutsopoulos, N.; Patsalou, M.; Koutinas, M.; Kopsahelis, N.; de Castro, A.M.; Papanikolaou, S.; Koutinas, A.A. Biotechnological production of fumaric acid: The effect of morphology of Rhizopus arrhizus NRRL 2582. Fermentation 2017, 3, 33. [Google Scholar] [CrossRef] [Green Version]
  18. Yu, S.; Huang, D.; Wen, J.; Li, S.; Chen, Y.; Jia, X. Metabolic profiling of a Rhizopus oryzae fumaric acid production mutant generated by femtosecond laser irradiation. Bioresour. Technol. 2012, 114, 610–615. [Google Scholar] [CrossRef]
  19. Liu, Y.; Xu, Q.; Lv, C.; Yan, C.; Li, S.; Jiang, L.; Huang, H.; Ouyang, P. Study of metabolic profile of Rhizopus oryzae to enhance fumaric acid production under low pH condition. Appl. Biochem. Biotechnol. 2015, 177, 1508–1519. [Google Scholar] [CrossRef]
  20. Naude, A.; Nicol, W. Improved continuous fumaric acid production with immobilised Rhizopus oryzae by implementation of a revised nitrogen control strategy. N. Biotechnol. 2018, 44, 13–22. [Google Scholar] [CrossRef] [Green Version]
  21. Liu, H.; Zhao, S.; Jin, Y.; Yue, X.; Deng, L.; Wang, F.; Tan, T. Production of fumaric acid by immobilized Rhizopus arrhizus RH 7-13-9# on loofah fiber in a stirred-tank reactor. Bioresour. Technol. 2017, 244, 929–933. [Google Scholar] [CrossRef]
  22. Troiano, D.; Orsat, V.; Dumont, M.J. Status of filamentous fungi in integrated biorefineries. Renew. Sustain. Energy Rev. 2020, 117, 109472. [Google Scholar] [CrossRef]
  23. Ferreira, J.A.; Lennartsson, P.R.; Edebo, L.; Taherzadeh, M.J. Zygomycetes-based biorefinery: Present status and future prospects. Bioresour. Technol. 2013, 135, 523–532. [Google Scholar] [CrossRef] [PubMed] [Green Version]
  24. Pan, X.; Liu, H.; Liu, J.; Wang, C.; Wen, J. Omics-based approaches reveal phospholipids remodeling of Rhizopus oryzae responding to furfural stress for fumaric acid-production from xylose. Bioresour. Technol. 2016, 222, 24–32. [Google Scholar] [CrossRef] [PubMed]
  25. Roa Engel, C.A.; Van Gulik, W.M.; Marang, L.; van der Wielen, L.A.M.; Straathof, A.J.J. Development of a low pH fermentation strategy for fumaric acid production by Rhizopus oryzae. Enzyme Microb. Technol. 2011, 48, 39–47. [Google Scholar] [CrossRef]
  26. Eidt, L. Nutzung Nachwachsender Rohstoffe für die Biotechnologische Produktion von Fumarsäure. Ph.D. Thesis, Technical University of Braunschweig, Braunschweig, Germany, 2021. [Google Scholar]
  27. Fu, Y.; Xu, Q.; Li, S.; Huang, H.; Chen, Y. A novel multi-stage preculture strategy of Rhizopus oryzae ME-F12 for fumaric acid production in a stirred-tank reactor. World J. Microbiol. Biotechnol. 2009, 25, 1871–1876. [Google Scholar] [CrossRef]
  28. Ling, L.; Ng, T. Fermentation Process for Carboxylic Acids. U.S. Patent 4,877,731, 31 October 1989. [Google Scholar]
  29. Naude, A.; Nicol, W. Fumaric acid fermentation with immobilised Rhizopus oryzae: Quantifying time-dependent variations in catabolic flux. Process Biochem. 2017, 56, 8–20. [Google Scholar] [CrossRef]
  30. Yang, P.B.; Tian, Y.; Wang, Q.; Cong, W. Effect of different types of calcium carbonate on the lactic acid fermentation performance of Lactobacillus lactis. Biochem. Eng. J. 2015, 98, 38–46. [Google Scholar] [CrossRef]
  31. Lopez-Exposito, P.; Negro, C.; Blanco, A. Direct estimation of microalgal flocs fractal dimension through laser reflectance and machine learning. Algal Res. 2019, 37, 240–247. [Google Scholar] [CrossRef]
  32. López Expósito, P.; Blanco Suárez, A.; Negro Álvarez, C. Laser reflectance measurement for the online monitoring of Chlorella sorokiniana biomass concentration. J. Biotechnol. 2017, 243, 10–15. [Google Scholar] [CrossRef]
  33. Bradford, M.M. A rapid and sensitive method for the quantitation of microgram quantities of protein utilizing the principle of protein-dye binding. Anal. Biochem. 1976, 72, 248–254. [Google Scholar] [CrossRef]
  34. Esteban, J.; Ladero, M.; García-Ochoa, F. Kinetic modelling of the solventless synthesis of solketal with a sulphonic ion exchange resin. Chem. Eng. J. 2015, 269, 194–202. [Google Scholar] [CrossRef]
  35. De la Torre, I.; Ladero, M.; Santos, V.E. Production of d-lactic acid by Lactobacillus delbrueckii ssp. delbrueckii from orange peel waste: Techno-economical assessment of nitrogen sources. Appl. Microbiol. Biotechnol. 2018, 102, 10511–10521. [Google Scholar] [CrossRef] [PubMed]
  36. Esteban, J.; Fuente, E.; Blanco, A.; Ladero, M.; Garcia-Ochoa, F. Phenomenological kinetic model of the synthesis of glycerol carbonate assisted by focused beam reflectance measurements. Chem. Eng. J. 2015, 260, 434–443. [Google Scholar] [CrossRef]
  37. Xu, G.; Chen, X.; Liu, L.; Jiang, L. Fumaric acid production in Saccharomyces cerevisiae by simultaneous use of oxidative and reductive routes. Bioresour. Technol. 2013, 148, 91–96. [Google Scholar] [CrossRef] [PubMed]
  38. Kenealy, W.; Zaady, E.; du Preez, J.C. Biochemical aspects of fumaric acid accumulation by Rhizopus arrhizus. Appl. Environ. Microbiol. 1986, 52, 128–133. [Google Scholar] [CrossRef] [PubMed] [Green Version]
  39. Zhang, K.; Zhang, B.; Yang, S.-T. Production of citric, itaconic, fumaric, and malic acids in filamentous fungal fermentations. In Bioprocessing Technologies in Biorefinery for Sustainable Production of Fuels, Chemicals, and Polymers; John Wiley & Sons, Inc.: Hoboken, NJ, USA, 2013; pp. 375–398. [Google Scholar] [CrossRef]
  40. Riscaldati, E.; Moresi, M.; Federici, F.; Petruccioli, M. Direct ammonium fumarate production by Rhizopus arrhizus under phosphorous limitation. Biotechnol. Lett. 2000, 22, 1043–1047. [Google Scholar] [CrossRef]
  41. Kang, S.W.; Lee, H.; Kim, D.; Lee, D.; Kim, S.; Chun, G.T.; Lee, J.; Kim, S.W.; Park, C. Strain development and medium optimization for fumaric acid production. Biotechnol. Bioprocess Eng. 2010, 15, 761–769. [Google Scholar] [CrossRef]
  42. El-Enshasy, H.A. Filamentous fungal cultures-process characteristics, products, and applications. In Bioprocessing for Value-Added Products from Renewable Resources; Elsevier: Amsterdam, The Netherlands, 2007; pp. 225–261. [Google Scholar] [CrossRef]
  43. Fu, Y.Q.; Li, S.; Chen, Y.; Xu, Q.; Huang, H.; Sheng, X.Y. Enhancement of fumaric acid production by Rhizopus oryzae using a two-stage dissolved oxygen control strategy. Appl. Biochem. Biotechnol. 2010, 162, 1031–1038. [Google Scholar] [CrossRef]
Figure 1. Effect of reducing the CaCO3 (dp = 57.77 μm) composition.
Fermentation 08 00064 g001
Figure 2. (a) Particle size distribution on different kinds of CaCO3. (b) Fumaric acid production yield comparison between both kinds of CaCO3.
Fermentation 08 00064 g002
Figure 3. Different crystallization systems and particles shapes on different CaCO3 types: (a) dp = 57.77 μm, (b) dp = 20.31 μm.
Fermentation 08 00064 g003
Figure 4. Effect of removal tartaric acid and CSL.
Fermentation 08 00064 g004
Figure 5. Nitrogen source initial concentration influence on fumaric acid production (5 days).
Fermentation 08 00064 g005
Figure 6. Kinetic evolution of all substances (20 mL shake flask, 200 rpm, 34 °C) (concentration in g/L). () Glucose, () fumaric acid, () (NH4)2SO4, () ethanol, () malic acid, () collected solids.
Fermentation 08 00064 g006
Figure 7. Evolution of the collected solids and nitrogen source during the fermentation process.
Fermentation 08 00064 g007
Figure 8. Comparison between initial (a) and final (b) mycelium surface. Small salt (calcium fumarate) crystals can be observed on the mycelium in micrograph B.
Fermentation 08 00064 g008
Figure 9. Total biomass calculated from the consumed ammonium sulphate.
Fermentation 08 00064 g009
Figure 10. Ethanol evaporation simulation.
Fermentation 08 00064 g010
Figure 11. Evolution of different components in the fermentation process and the proposed kinetic modelling.
Fermentation 08 00064 g011
Table 1. Composition of the culture media.
ComponentInoculum Medium
(g/L) [7]
Production Medium
(g/L) [28]
Glucose40130
(NH4)2SO441.8 1
MgSO4 × 7 H2O0.40.4
ZnSO4 × 7 H2O0.0440.44
KH2PO41.60.3
FeCl3 × 6 H2O0.00750.0075
Tartaric acid-0.0075 2
CaCO3-50 1
Corn steep liquor (CSL)0.5 mL/L0.5 mL/L 2
1 (NH4)2SO4 and CaCO3 concentrations were modified in different experiments; 2 Tartaric acid and CSL contents were removed from the production medium in certain experiments
Table 2. Overview of the fumaric acid yields based on glucose in the fermentative production of fumaric acid using Rhizopus spp.
ReferenceN SourceYield
(gFumaric acid/gconsumed glucose)
Process ConditionspH ControlInoculumOperation Time (h)
[7](NH4)2SO4: 1.8 g/L0.26[Glucose]0 = 130 g/L
200 rpm; 34 °C; pH ≈ 5.5
CaCO3: 50 g/L
(dp = 57.77 μm)
12 h, pH free,
106 spores/mL
120
[40](NH4)2SO4: 0.8 g/L0.33[Glucose]0 = 130 g/L
220 rpm; 32 °C; pH ≈ 5.5
(NH4)2SO4: 2 M
(dp: not specified)
8–10 h, pH controlled,
107 spores/mL
120
[41]CSL: 0.5%0.43[Glucose]0 = 100 g/L
250 rpm; 35 °C; pH ≈ 6.5
CaCO3: 2% w/w
(dp: not specified)
12 h, pH controlled,
107 spores/mL
120
Present study(NH4)2SO4: 1.2 g/L0.46[Glucose]0 = 130 g/L
200 rpm; 34 °C, pH ≈ 5.5
CaCO3: 35 g/L
(dp = 20.31 μm)
12 h, pH free,
106 spores/mL
120
Table 3. Biomass elemental composition during fermentation obtained by microanalysis.
t (h)C % (±0.35%)H % (±0.30%)N % (±0.30%)S % (±0.35%)O % 1C:N
643.046.4710.890.5439.063.95
1244.236.669.770.5038.844.53
1845.056.778.850.4638.875.09
2444.376.778.170.4040.295.43
3645.276.867.310.3440.226.19
4844.946.455.570.2542.798.07
6047.967.046.090.2838.637.87
7246.716.424.550.2242.1010.27
8446.686.324.490.2042.3110.39
9645.385.743.300.1545.4313.75
10844.965.572.950.1346.3915.24
12044.895.372.390.1247.2318.78
1 O percentage values were calculated from the difference from 100 %.
Table 4. Kinetic parameters of the proposed model (Equations (1)–(8)) from the data represented on Figure 6 and Figure 9, and the model represented on Figure 11.
ParameterUnitsValue
µm L g ( NH 4 ) 2 SO 4 · h 1.69∙10−1 ± 3.04∙10−3
kF L · g Fumaric   acid g Biomass · g Glucose · h 5.45∙10−3 ± 2.07∙10−4
YMF g Malic   acid g Fumaric   acid 1.36∙10−1 ± 2.81∙10−2
YEX g Ethanol g Biomass 5.87 ± 9.87∙10−1
kEh−11.13∙10−2 ± 3.9210−3
YNX g ( NH 4 ) 2 SO 4 g Biomass 5.26∙10−1 ± 5.65∙10−3
YGX g Glucose g Biomass 19.75 ± 1.59
YGF g Glucose g Fumaric   acid 1.16 ± 9.19∙10−2
Table 5. Statistical parameters obtained from fitting the proposal model (Equations (1)–(8), Table 4), indicators of the goodness of fit.
ParameterValue
Degrees of freedom82
RMSE3.48
F95823.74
%VE98.30
Publisher’s Note: MDPI stays neutral with regard to jurisdictional claims in published maps and institutional affiliations.

