Article

Identification and Transcriptional Profiling of SNARE Family in Monascus ruber M7 Reveal Likely Roles in Secondary Metabolism

1
Hubei International Scientific and Technological Cooperation Base of Traditional Fermented Foods, College of Food Science and Technology, Huazhong Agricultural University, Wuhan 430070, China
2
Hubei Key Laboratory of Nutritional Quality and Safety of Agro Products, Institute of Quality Standard and Testing Technology for Agro-Products, Hubei Academy of Agricultural Sciences, Wuhan 430064, China
*
Authors to whom correspondence should be addressed.
Fermentation 2022, 8(12), 750; https://doi.org/10.3390/fermentation8120750
Submission received: 28 November 2022 / Revised: 12 December 2022 / Accepted: 13 December 2022 / Published: 16 December 2022
(This article belongs to the Section Microbial Metabolism, Physiology & Genetics)

Abstract

:
Soluble N-ethylmaleimide-sensitive factor attachment protein receptors (SNAREs) are the core components that mediate vesicle fusion, and they play an important role in secondary metabolism of filamentous fungi. However, in Monascus spp., one of the traditional medicinal and edible filamentous fungi, the members and function of SNAREs remain unknown. Here, twenty SNAREs in M. ruber M7 were systematically identified based on the gene structure, amino acid structure and phylogenetic analysis and were classified into four subfamilies. We also compared the expression profiles of twenty MrSNAREs in M. ruber M7 and its deletion mutants, ΔmrpigA and ΔpksCT, which could not produce Monascus pigment and citrinin, respectively. The results indicated that these MrSNAREs showed distinct expression patterns in the three strains. Compared to M. ruber M7, the expression levels of Mrtlg2, Mrbet1, Mrgos1 and Mrsec22 remained higher in ΔmrpigA but lower in ΔpksCT, which could be reason to consider them as potential candidate genes involved in secondary metabolism for further functional characterization. Further, the significant upregulation of Mrpep12 and Mrvtil in ΔpksCT is worthy of attention for further research. Our results provide systematic identification and expression profiling of the SNARE family in Monascus and imply that the functions of MrSNAREs are specific to different secondary metabolic processes.

1. Introduction

Vesicle transport is the basic form involved in the transportation of substances between different cellular compartments in eukaryotic cells [1,2,3]. Usually, this cargo includes protein, lipids and secondary metabolites that are carried out by membranous vesicles; then, unique sets of proteins are recruited to finish the subsequent essential steps, including trafficking, binding, fusion and/or retrieval [4,5]. Among them, correct membrane fusion between the vesicle and target membrane is very important to maintain homeostasis, promote growth and regulate secondary metabolism; this relies on the catalysis and regulation of SNAREs (soluble N-ethylmaleimide-sensitive factor attachment protein receptors) [6,7].
Generally, SNARE proteins are widely present in the membranous organelles of eukaryotes, such as the endoplasmic reticulum, Golgi membranes and vacuoles, as well as in the vesicles produced by these organelles [8,9]. Based on the amino acid sequence characteristics of SNARE motifs, SNAREs are classified as Q-SNAREs (syntaxin, SNAP-25) or R-SNAREs (synaptobrevin), which contain highly conserved glutamine (Q) residues and arginine (R) residues, respectively [10]. The Q-SNARE family can be further classified as Qa-, Qb- or Qc-SNAREs based on the amino acid sequence homologies [11]. Alternatively, depending on the location, SNAREs can be divided as v-SNAREs, which are located in vesicles, or t-SNAREs, which are located in target membranes. Moreover, v-SNAREs usually correspond to R-SNAREs, and t-SNAREs to Q-SNAREs [12]. During vesicle fusion, three Q-SNAREs interact with one R-SNARE to form an extremely stable four-helix bundle, called a SNARE complex or SNAREpin [8,13]. The SNAREpin brings together the vesicle and the target membrane, thereby facilitating their fusion and release of the vesicle’s contents [14].
Since the first SNARE was identified in 1993 [15], a variety of SNARE protein-coding genes have been identified in different organisms based on genome-wide identification, such as 36 SNAREs in Homo sapiens, 68 SNAREs in Arabidopsis thaliana and 24 SNAREs in Saccharomyces cerevisiae [13,16,17]. In filamentous fungi, SNAREs exhibit an important regulatory role in their metabolic activities [18]. For example, deletion of Cfvam7 (vacuole membrane-located Qc-SNARE gene) in Colletotrichum fructicola results in defects in vegetative growth, conidiation, appressorium formation and cell wall integrity [19]. Further, some SNAREs are responsible for physiological processes, stress resistance and pathogenicity [20]. The deletion of FoSyn1 (Qa-SNARE) leads to a decrease in the tolerance of Falciphora oryzae to cadmium [21]. Most notably, diverse reports propose that SNAREs also show a major role in fungal secondary metabolism [22,23]. In Fusarium graminearum, deletion of Qc-SNARE(FgSyn8) significantly reduces the production of deoxynivalenol, and deletion of MoSyn8 in Magnaporthe oryzae reduces melanin pigmentation [18,24].
Monascus spp. are famous edible and medicinal filamentous fungi widely applied in Southeast Asian countries for nearly 2000 years [25]. Their rice-based fermentation product, Hongqu, is a highly accepted fermentation starter, natural food colorant and folk medicine; it can produce abundant beneficial secondary metabolites, such as Monascus pigments (MPs), monacolin K and γ-aminobutyric acid [26,27]. However, some Monascus strains can produce citrinin (CIT), a nephrotoxic mycotoxin contaminant in Hongqu and related products [28,29]. Therefore, reducing or eliminating the CIT yield and increasing MPs production by Monascus is the core problem of industrial mass production. In addition to fermentation condition optimization and strain breeding [30,31], clarifying the understanding of the vesicle transport mechanism of Monascus may provide a new idea, but the function of the SNARE family in Monascus is still unclear. On this basis, a comprehensive genome-wide analysis of SNARE genes in M. ruber M7 (MrSNAREs) was performed in this study to explore their potential roles in secondary metabolism. Firstly, the characterizations, gene structures and classifications of all the identified MrSNAREs were compared. Then, the MrSNARE expression profiles of three Monascus strains were analyzed and compared by real-time quantitative PCR (RT-qPCR), which included M. ruber M7 (wildtype, producing MPs and CIT), ∆mrpigA (MPs biosynthetic gene deletion mutant, producing CIT but MPs-free) [32,33] and ∆pksCT (CIT biosynthetic gene deletion mutant, producing MPs but CIT-free) [34,35]. Finally, the differentially expressed MrSNAREs that might be linked to MPs and CIT synthesis were preliminarily discussed. Collectively, this study could provide a data basis for future studies involved in vesicle-transport-system-regulated secondary metabolism in filamentous fungi.

2. Materials and Methods

2.1. Microbial Strains and Culture Conditions

The wildtype strain Monascus ruber M7 was stored in our laboratory; it can produce MPs and CIT simultaneously. The MPs and CIT biosynthetic gene clusters have been analyzed in previous study; based on the results, two mutants, ΔmrpigA and ΔpksCT, were constructed by our research group. In detail, ΔmrpigA is an MPs-free mutant strain in which the MPs polyketide synthases gene (mrpigA) has been partly disrupted [33], ΔpksCT is a CIT-free mutant strain in which the CIT polyketide synthases gene (pksCT) has been partly disrupted [35]. These three strains were cultured in potato dextrose agar (PDA) slant medium at 28 °C.

2.2. Genome-Wide Identification of SNARE Genes in Monascus ruber M7

The amino acid sequences of SNARE genes from Aspergillus nidulans and Saccharomyces cerevisiae were obtained from the SNARE database (Snare-WebInterface snareMainPage (mpg.de), accessed on 17 December 2020) to identify the homologous SNARE genes in the M. ruber M7 genome (Index of /blast/executables/blast+/LATEST (nih.gov), accessed on 30 December 2020). In order to verify the quantity of SNARE homolog genes in M. ruber M7 (MrSNAREs), the amino acid sequences of candidate MrSNAREs were obtained by SoftBerry’s FGENESH program (http://linux1.softberry.com/berry.phtml?topic=fgenesh&group=programs&subgroup=gfind, accessed on 3 January 2021) and then retrieved by NCBI’s BLAST program (https://blast.ncbi.nlm.nih.gov, accessed on 18 May 2021).

2.3. Characterization and Phylogenetic Analysis of Identified MrSNAREs

The gene structures of all identified MrSNAREs were analyzed by SoftBerry’s FGENESH program (http://linux1.softberry.com/berry.phtml?topic=fgenesh&group=programs&subgroup=gfind, accessed on 3 January 2021), and their visualizations were performed by the Gene Structure Display Server (http://gsds.gao-lab.org/, accessed on 15 June 2021). The compute pI/MW tool in the ExPASy database (http://web.expasy.org/compute_pi/, accessed on 18 May 2021) was used to calculate the biochemical parameters of MrSNAREs. The conversed domains such as the SNARE motif and transmembrane domain (TM) of MrSNAREs were annotated by NCBI’s CDD program (http://www.ncbi.nlm.nih.gov/Structure/cdd/wrpsb.cgi, accessed on 18 May 2021) and the SMART database (SMART: Main page (embl-heidelberg.de), accessed on 18 May 2021). Then, the schematic diagram was prepared by IBS (IBS—Database Visualization (http://ibs.biocuckoo.org/dbvisualization.php#, accessed on 29 September 2021). The properties of the SNARE motif were aligned by MEGA7 software and were adjusted through GeneDoc. Based on this alignment, a phylogenetic tree was constructed with the neighbor-joining method and 1000 bootstrap replications.

2.4. MPs and CIT Production Analysis

M. ruber M7, ΔpksCT and ΔmrpigA were inoculated in PDA slant medium and cultured at 28 °C for 12 days. First, the three strains were inoculated on PDA plate medium at 28 °C for 7 d to observe phenotypic characterization. Then, the conidia of M. ruber M7, ΔpksCT and ΔmrpigA were washed with sterile water and collected in a sterile centrifuge tube. After that, 200 μL of conidia suspension at a concentration of 105 cfu/mL was inoculated onto a PDA plate containing cellophane at 28 °C for 11 days. Three replicates were taken for each test sample.
The mycelium and medium were sampled on the 3rd, 7th and 11th days and were dried at 45 °C to measure MPs and CIT production. In detail, dried sample powder (0.1 g) was mixed with 80% methanol solution (4 mL) and ultrasonicated for 30 min. Then, the suspension was centrifuged at 5000 rpm for 10 min; the supernatant was collected and filtered through a 0.22 μm nylon filter membrane. Total MPs production was detected by UV spectrophotometer (HITACHI U-3900, Hitachi, Ltd., Chiyoda-ku, Tokyo, Japan) based on the reference method with minor modification [36,37]. The extracts were diluted to an appropriate multiple, and absorbance values were measured at 380, 470 and 520 nm, which are the maximal absorption wavelengths of yellow (YP), orange (OP) and red (RP) pigments, respectively. MPs production was expressed in units of absorbance (U/g). CIT production analysis was performed on a Waters ACQUITYH UPLC I-CLASS system (Waters, Milford, MA, USA). The analytical column was an ACQUITY UPLC BEH C18 (2.1 mm × 100 mm, 1.7 μm; Waters, Milford, MA, USA) maintained at 40 °C. Chromatographic separation was achieved with gradient elution using a complex gradient: mobile phase A was 0.1% formic acid in water, and mobile phase B was acetonitrile. The UPLC gradient program was as follows: 10% B→70% B at 0.01–10.00 min; 70% B→90% B at 10.01–12.00 min; 90% B→10% B at 12.01–15.00 min. The flow rate was 0.3 mL/min with a sample injection volume of 2.0 μL.

2.5. Gene Expression Analysis by Real-Time Quantitative PCR

The mycelium of M. ruber M7, ΔpksCT and ΔmrpigA incubated on PDA medium were collected for total RNA extraction on the 3rd and 7th days by using a TransZol Up Plus RNA Kit (TransGen Biotech, Beijing, China). Three biological replicates were taken for each test sample. RNA integrity was visualized by 0.8% agarose gel electrophoresis. RNA concentration and purity (OD260/OD280 ratio > 1.95) were determined with a NanoVolume N-60 Spectroscope (Implen, Munich, Germany). For each sample, the total RNA was reverse transcribed to complementary cDNA using a HiScript® II 1st Strand cDNA Synthesis Kit (+gDNA wiper) (Vazyme, R212-02, Nanjing, China). The real-time quantitative PCR (RT-qPCR) reaction was performed by an AceQ® qPCR SYBR Green Master Mix (Vazyme, Q111-02, Nanjing, China) following the manufacturer’s instructions. The RT-qPCR program was performed as follows: 95 °C for 10 min, followed by 40 cycles at 95 °C for 10 s and 60 °C for 30 s. Automated thermal cycling and data acquisition were performed on a Qtower2.2 system (Analytik Jena AG, Jena, Germany) and qPCRsoft1.1 software. The β-actin gene was taken as an internal reference, and the primers used in these analyses are listed in Table S1. The 2−ΔΔCt method was applied to calculate the fold change of gene transcript levels.

2.6. Statistical Analysis

Results are expressed as mean ± standard deviation (SD). SPSS 25.0 (Armonk, NY, USA) was utilized for analysis of variance (ANOVA). A heatmap was generated by MetaboAnalyst version 5.0 (https://www.metaboanalyst.ca, accessed on 24 August 2022).

3. Results

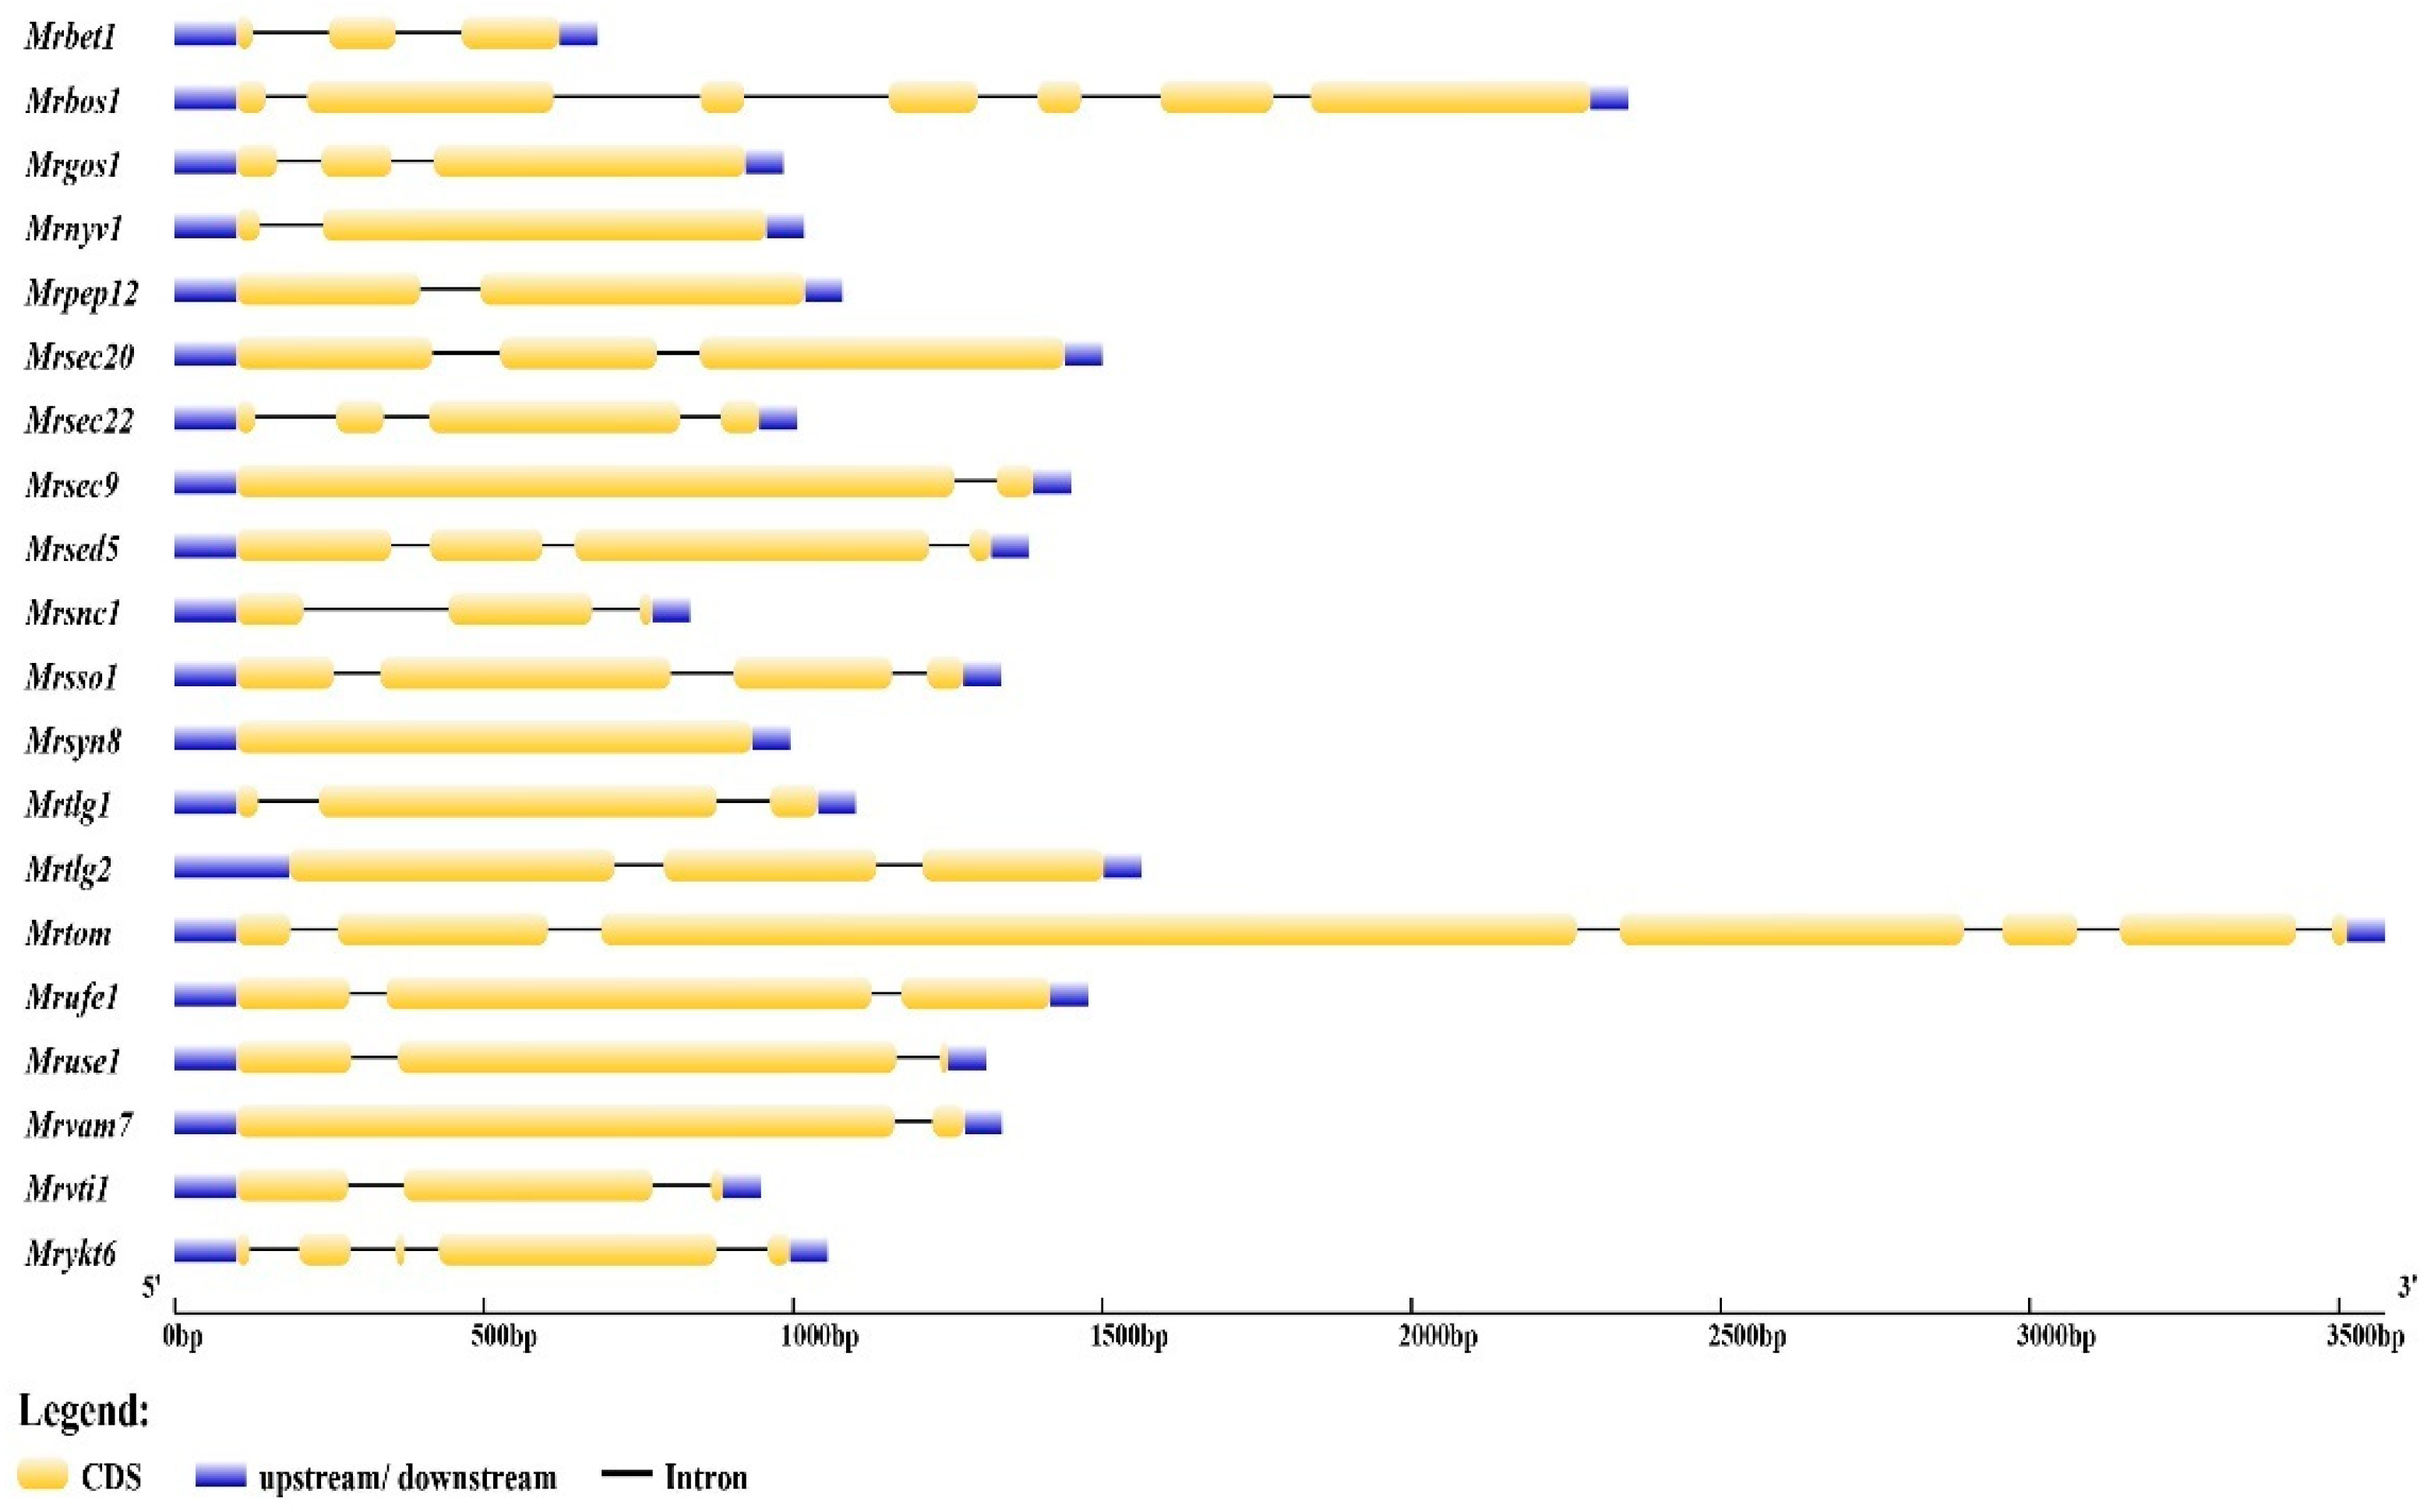
3.1. Monascus ruber M7 Has 20 SNARE-Encoding Genes

There were 20 putative SNARE genes identified in the M. ruber M7 genome, and all of the putative genes were named according to the closest ortholog of A. nidulans and S. cerevisiae (Table 1). Generally, the identity of SNARE genes between M. ruber M7 and A. nidulans (29–88%) was higher than that with S. cerevisiae (22–67%). The results of gene structure analysis indicated that the putative MrSNAREs possessed 1 to 4 exons, of which, Mrsyn8 had one exon, Mrpep12, Mrvam7, Mrsec9 and Mrnyv1 had two exons, nine genes (Mrbet1, Mrgos1, Mrsec20, Mrsnc1, Mrtlg1, Mrtlg2, Mrufe1, Mruse1 and Mrvti1) had three exons, Mrsec22, Mrsed5 and Mrsso1 had four exons, Mrykt6 had five exons, and Mrbos1 and Mrtom had seven exons (Figure 1). Sequence analysis showed that the size of the encoded SNARE proteins ranged from 97 to 998 amino acids (aa) (Table 1). Further, their isoelectric points (pIs) ranged from 4.46 (Mrtlg1) to 9.83 (Mrbos1), and their molecular weights (MWs) ranged from 10,397.74 Da (Mrbet1) to 107,978.53 Da (Mrtom).

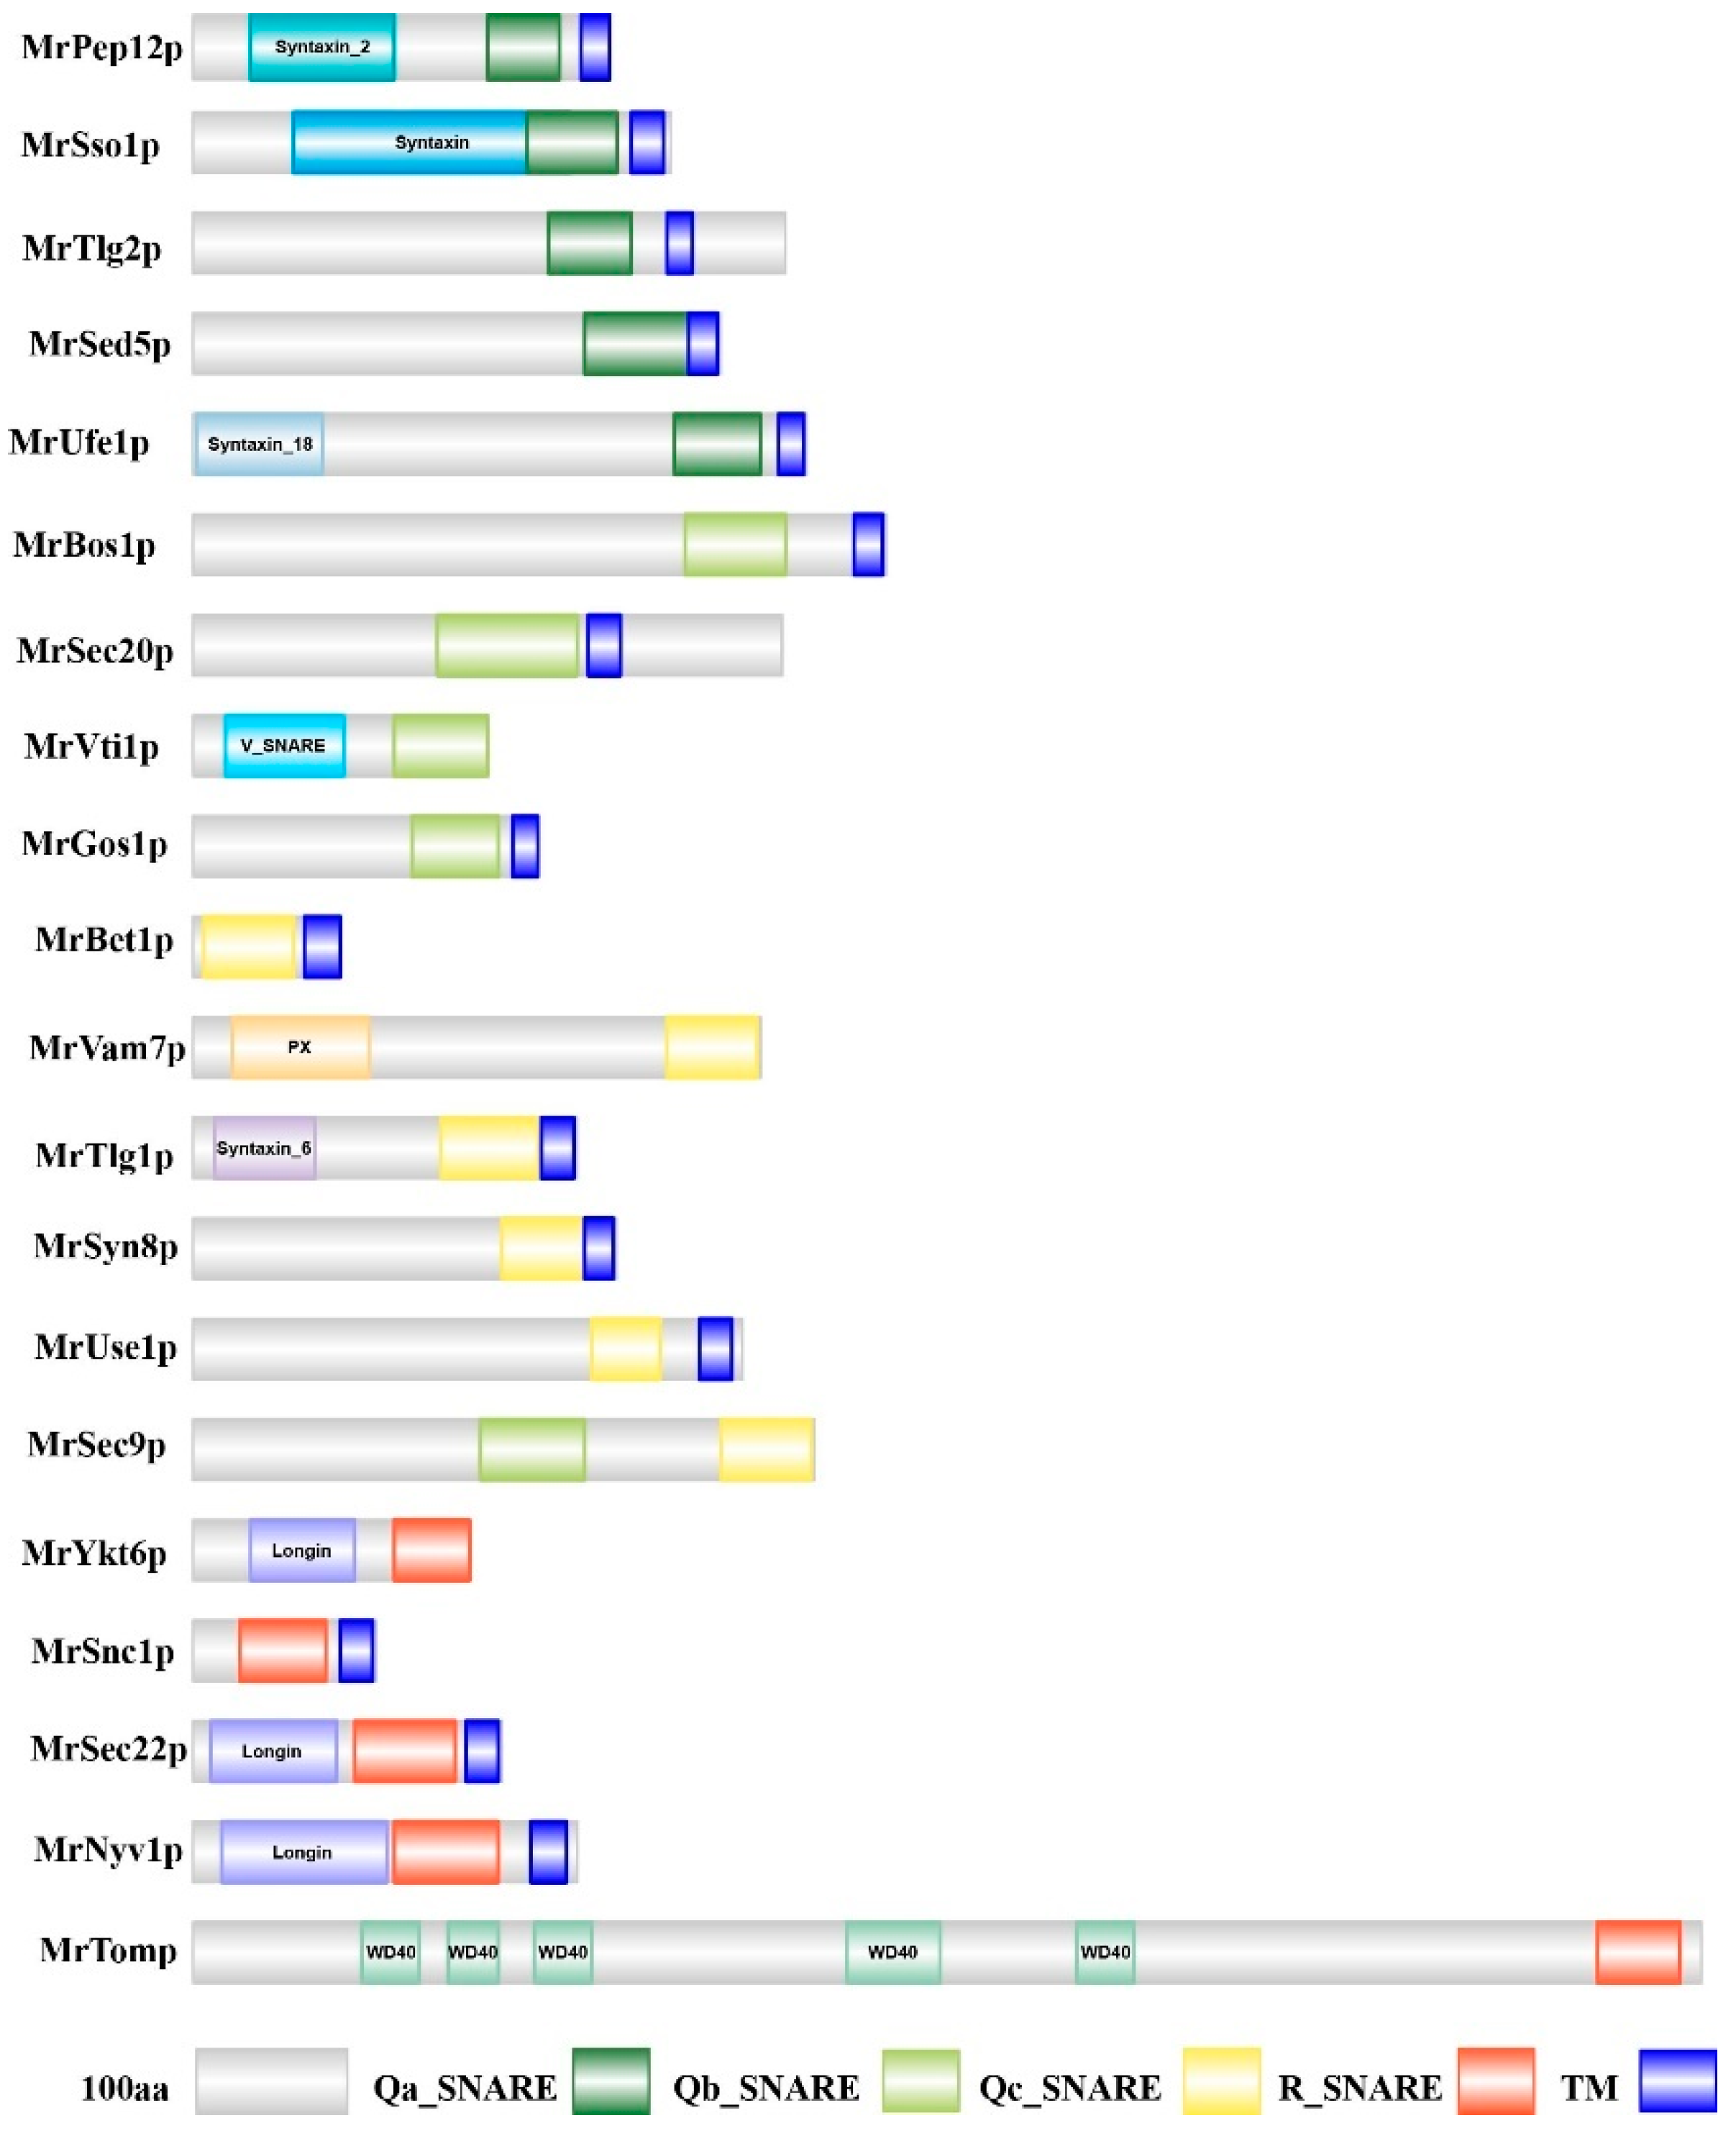
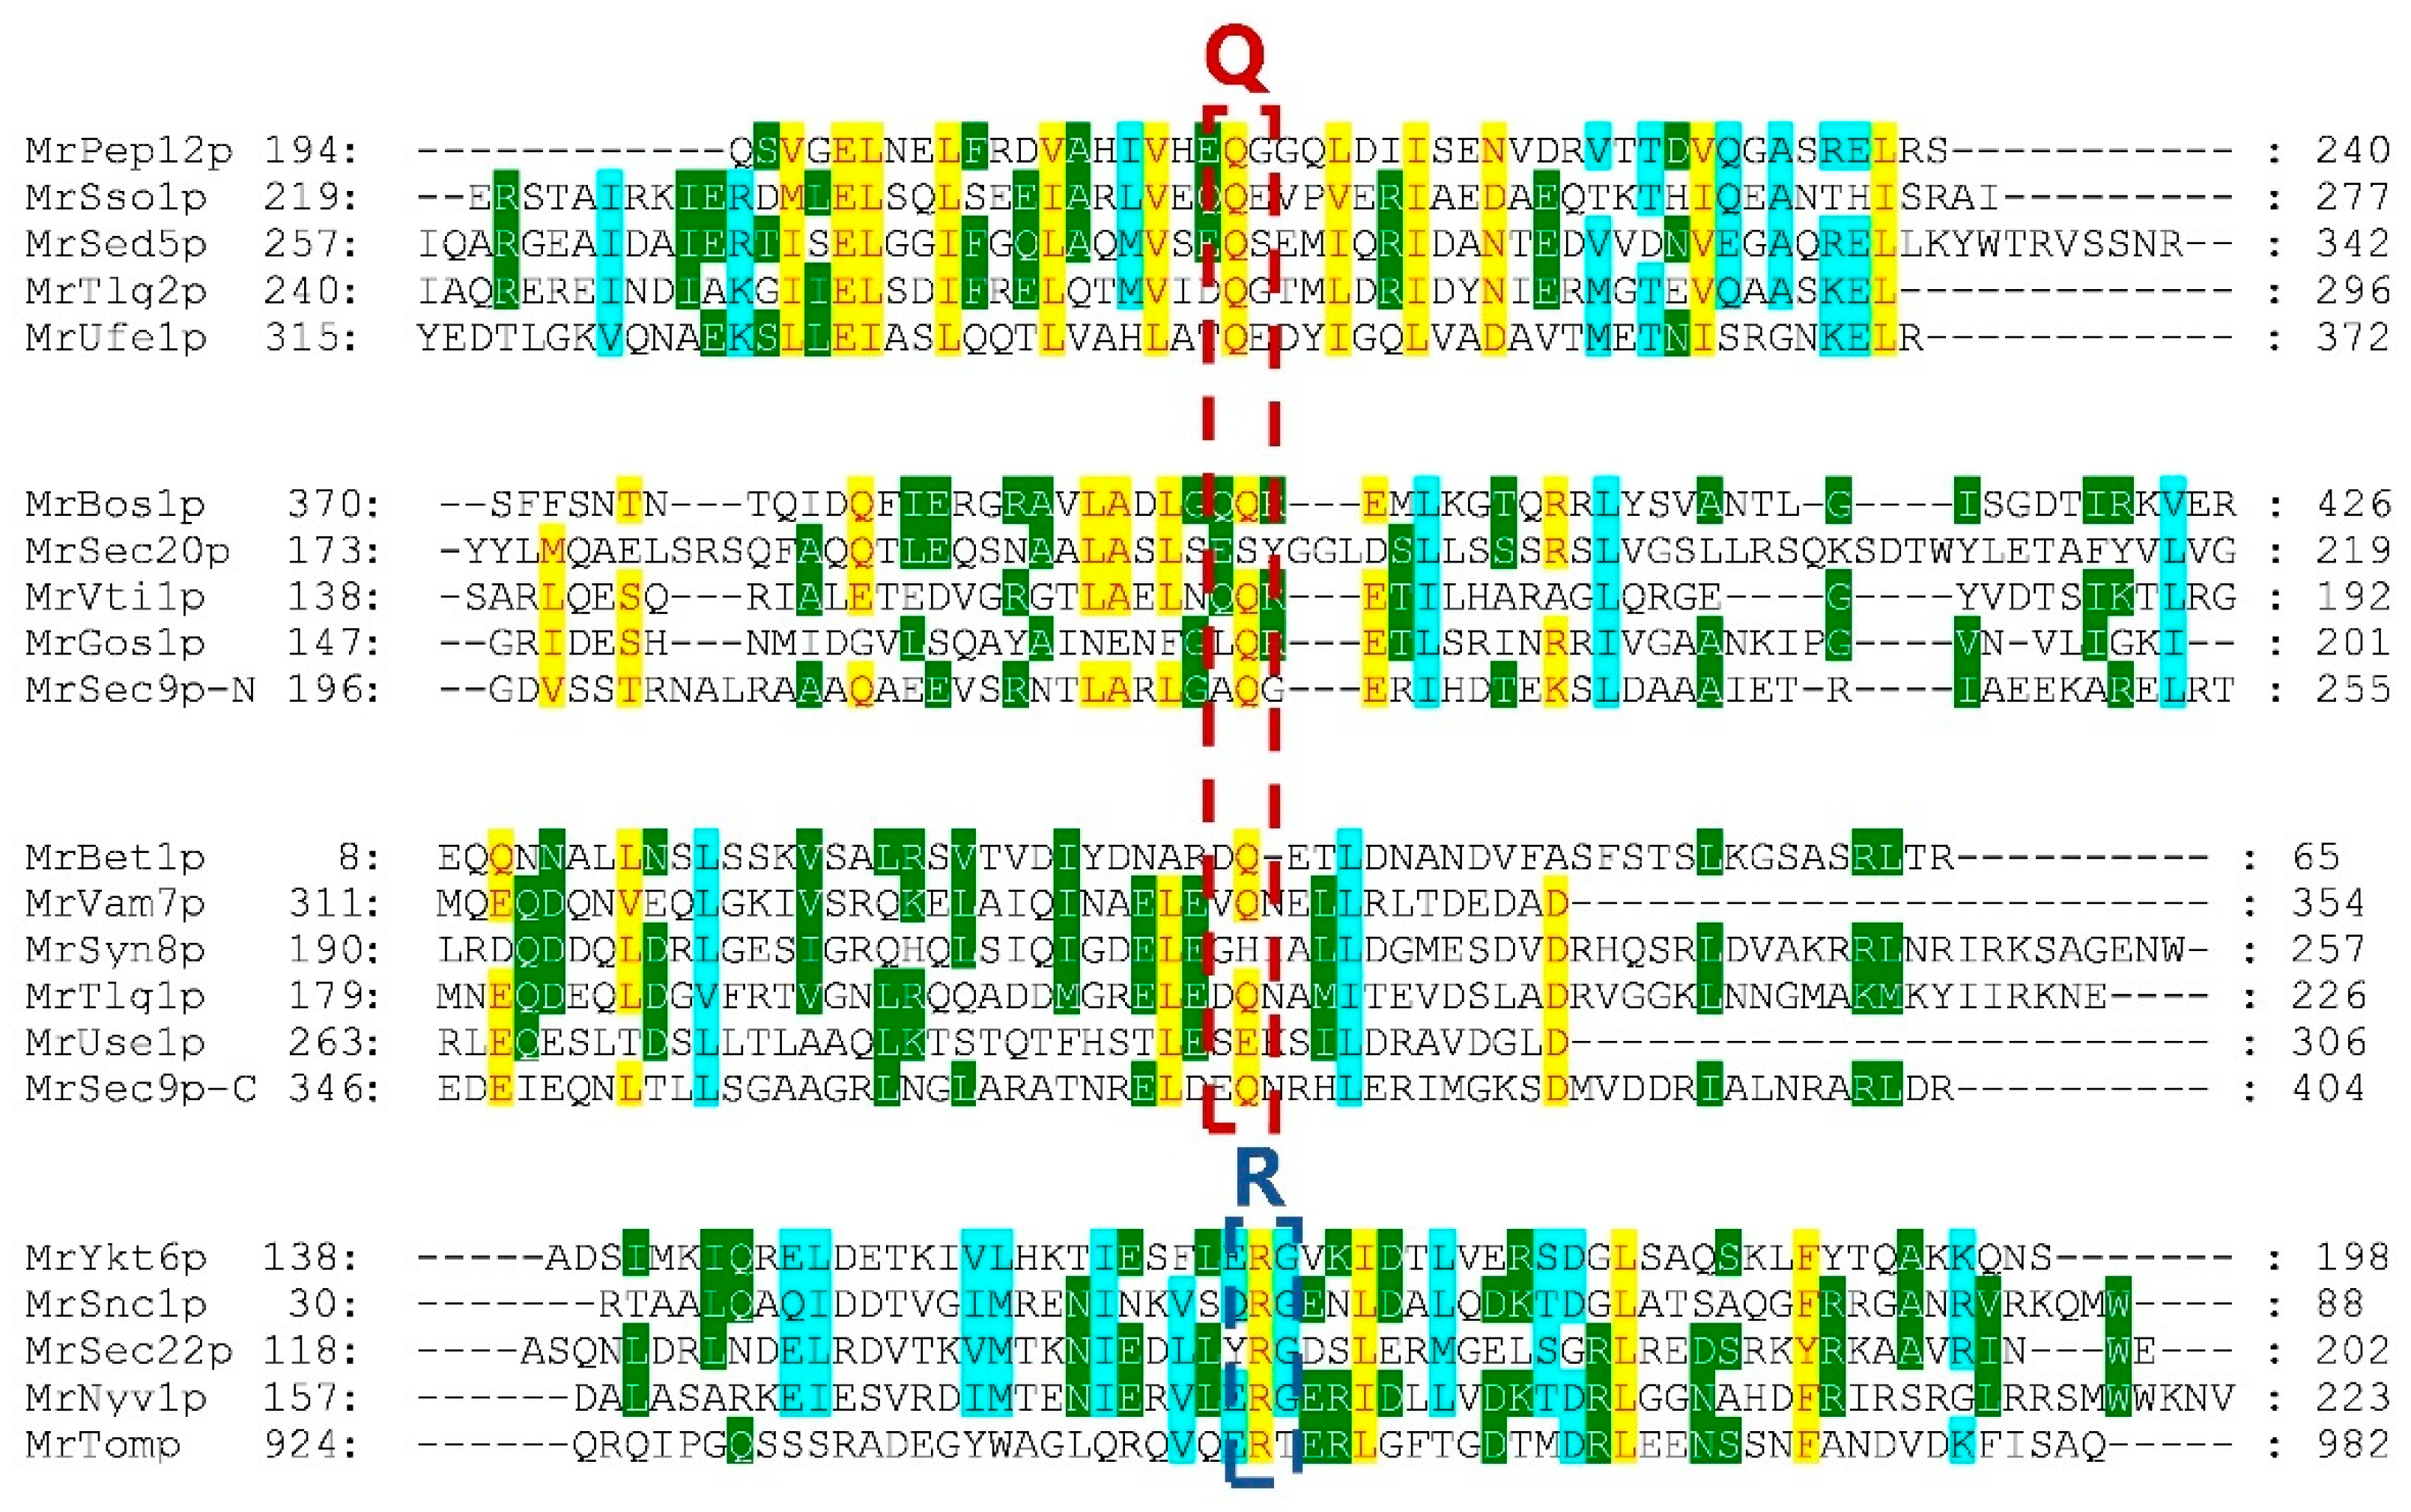
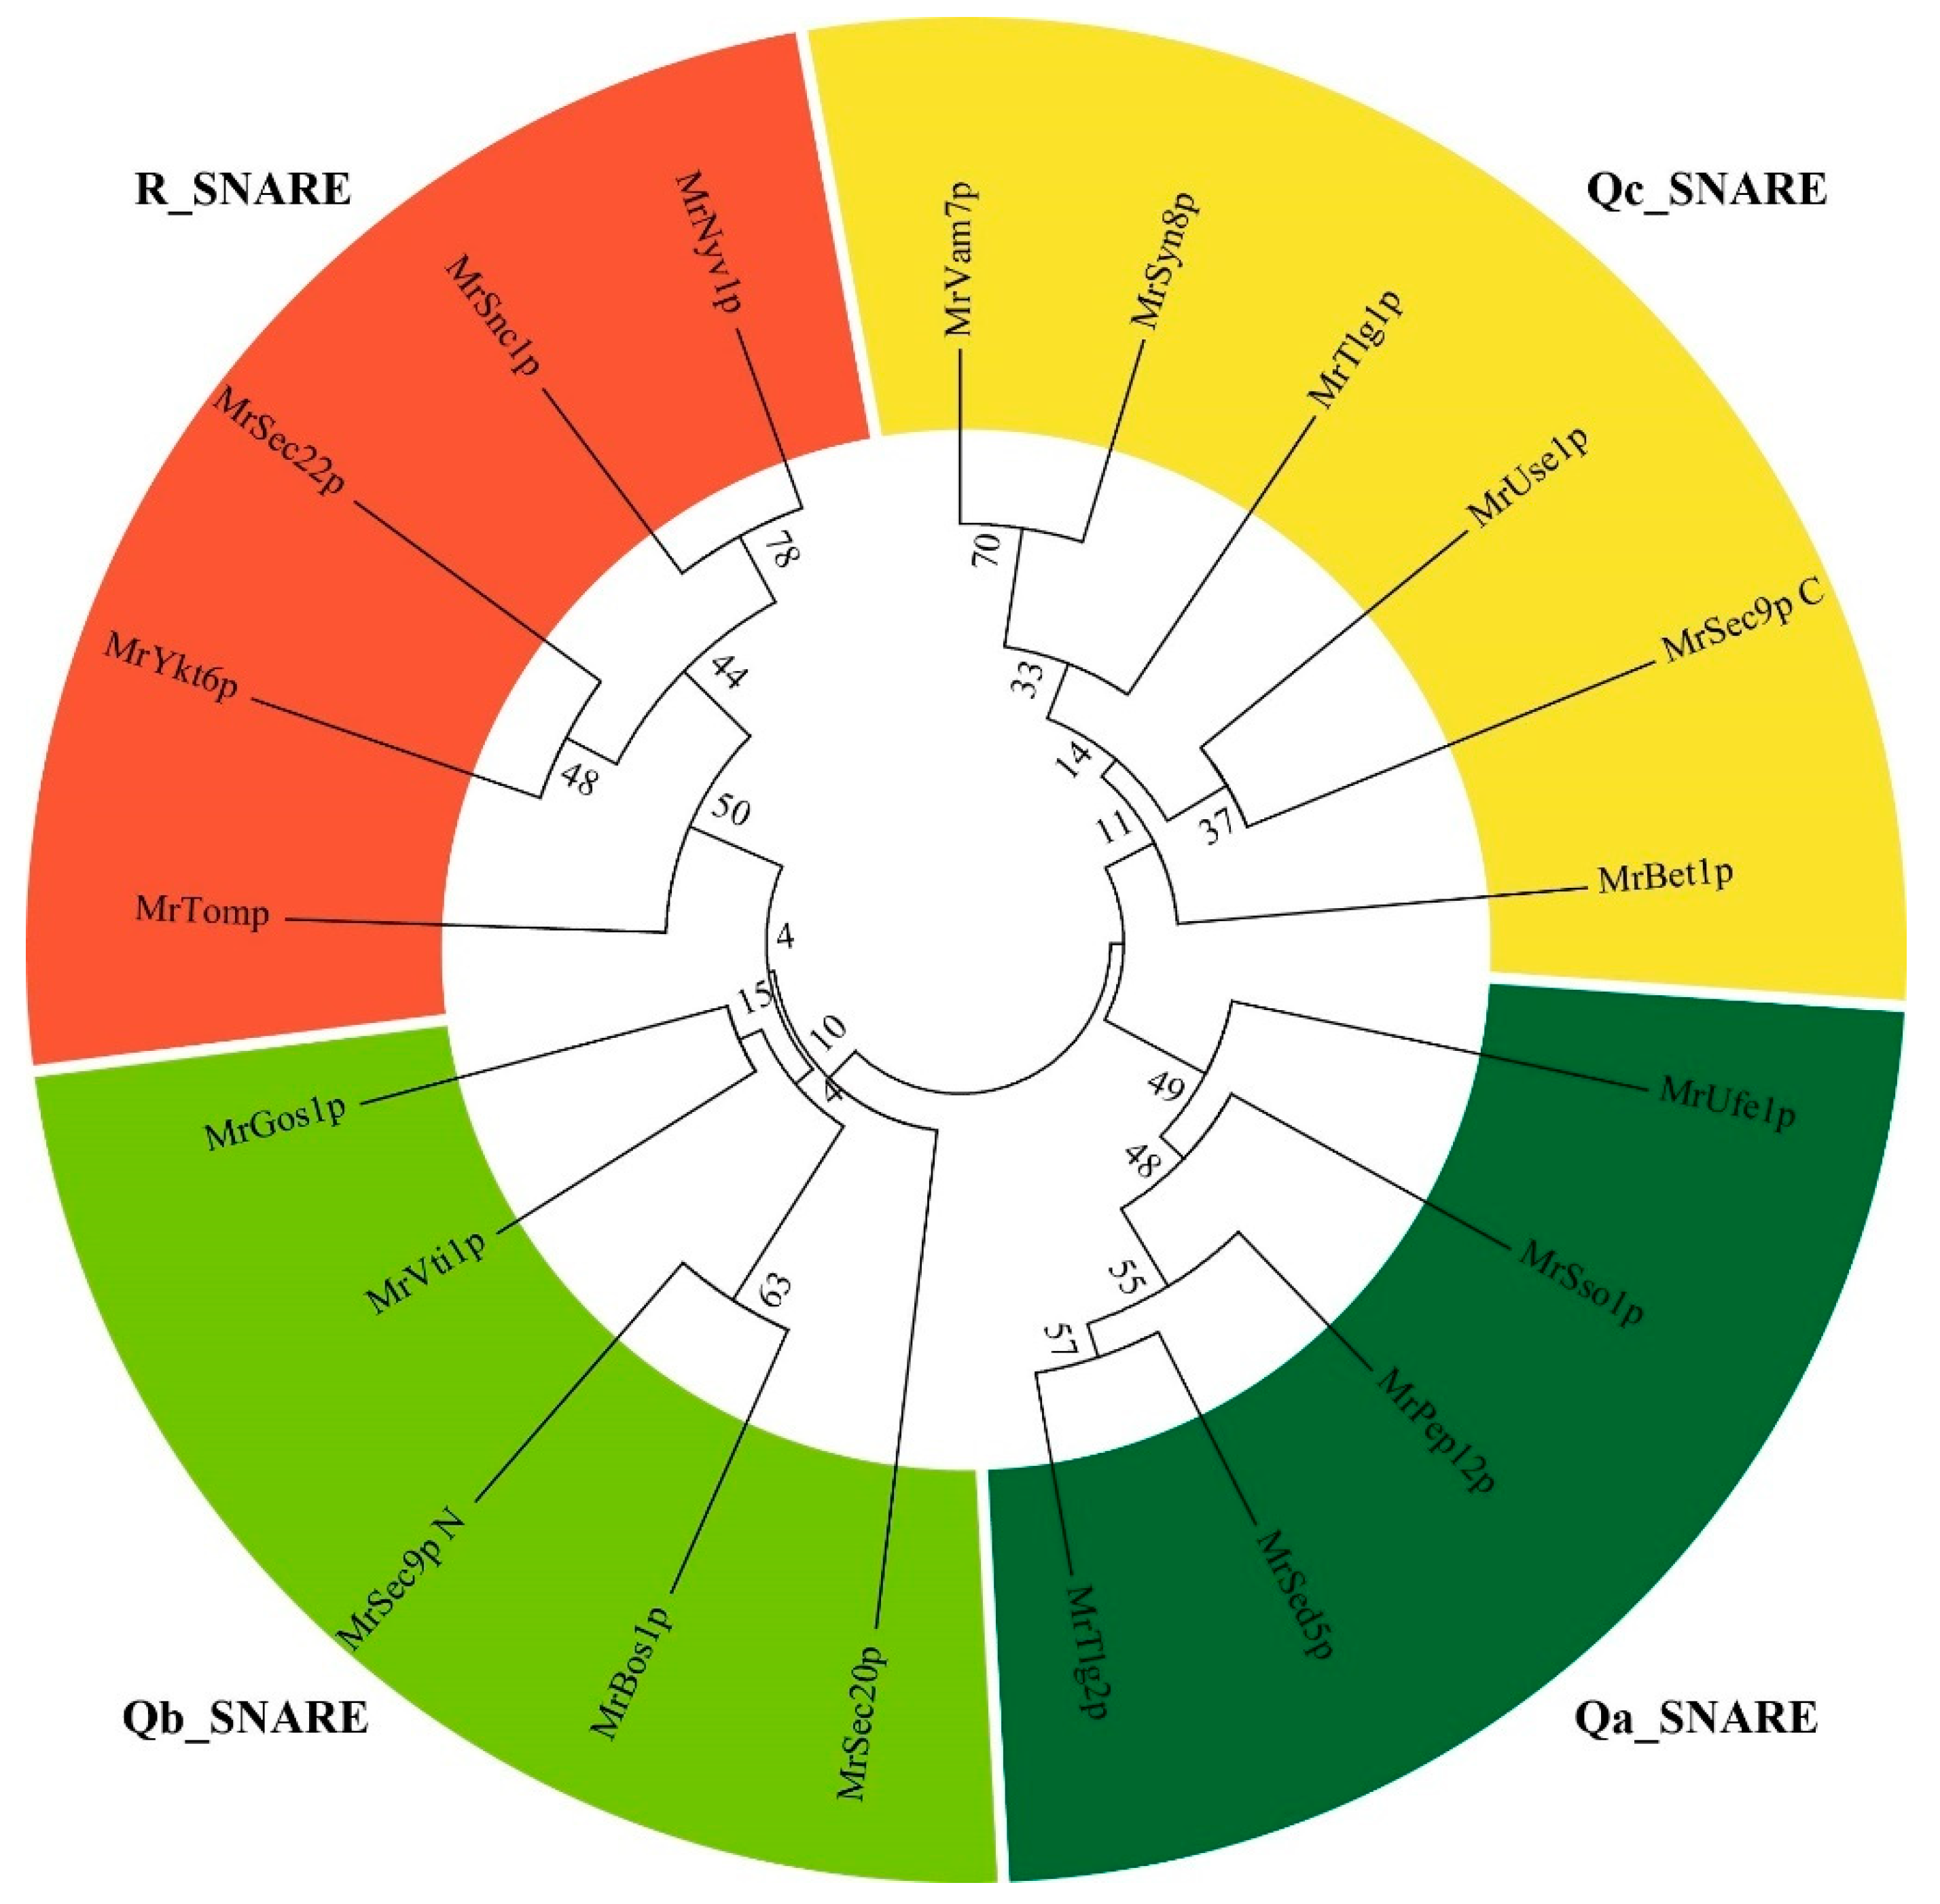
3.2. Classification of SNARE Genes in Monascus ruber M7

The conserved domains of MrSNAREs were analyzed, and the results showed that the MrSNAREs were mainly classified as Qa-, Qb-, Qc- and R-SNAREs (Figure 2). In detail, Qa-SNAREs were composed of five members (MrSso1p, MrPep12p, MrSed5p, MrTlg2p and MrUfe1p), which belonged to syntaxin proteins; Qb-SNAREs were composed of five members (MrBos1p, MrGos1p, MrVti1p, MrSec20p and MrSec9N), which belonged to SNAP-25 N-terminal motif homologous proteins; Qc-SNAREs were composed of five members (MrBet1p, MrSyn8p, MrTlg1p, MrUse1p and MrSec9C), which belonged to SNAP-25 C-terminal motif homologous proteins; and R-SNAREs were composed of five members (MrSnc1p, MrSec22p, MrNyv1p, MrYkt6p and MrTomp), which belonged to synaptobrevin proteins (Figure 2). Ordinarily, the glutamine residues were highly conserved among most Qa-SNAREs, and the arginine residues were highly conserved among all R-SNAREs (Figure 3), while the glutamine residues of one Qb-SNARE (MrSec20p) and two Qc-SNAREs (MrSyn8p and MrUse1p) were replaced by serine (S), histidine (H) or glutamic acid (E) (Figure 3). In addition, phylogenetic analysis indicated that the SNAREs displayed the same four categories described previously (Figure 4). Consistent with the results of multiple sequence alignment, this verifies the conservation and typicality of MrSNAREs.

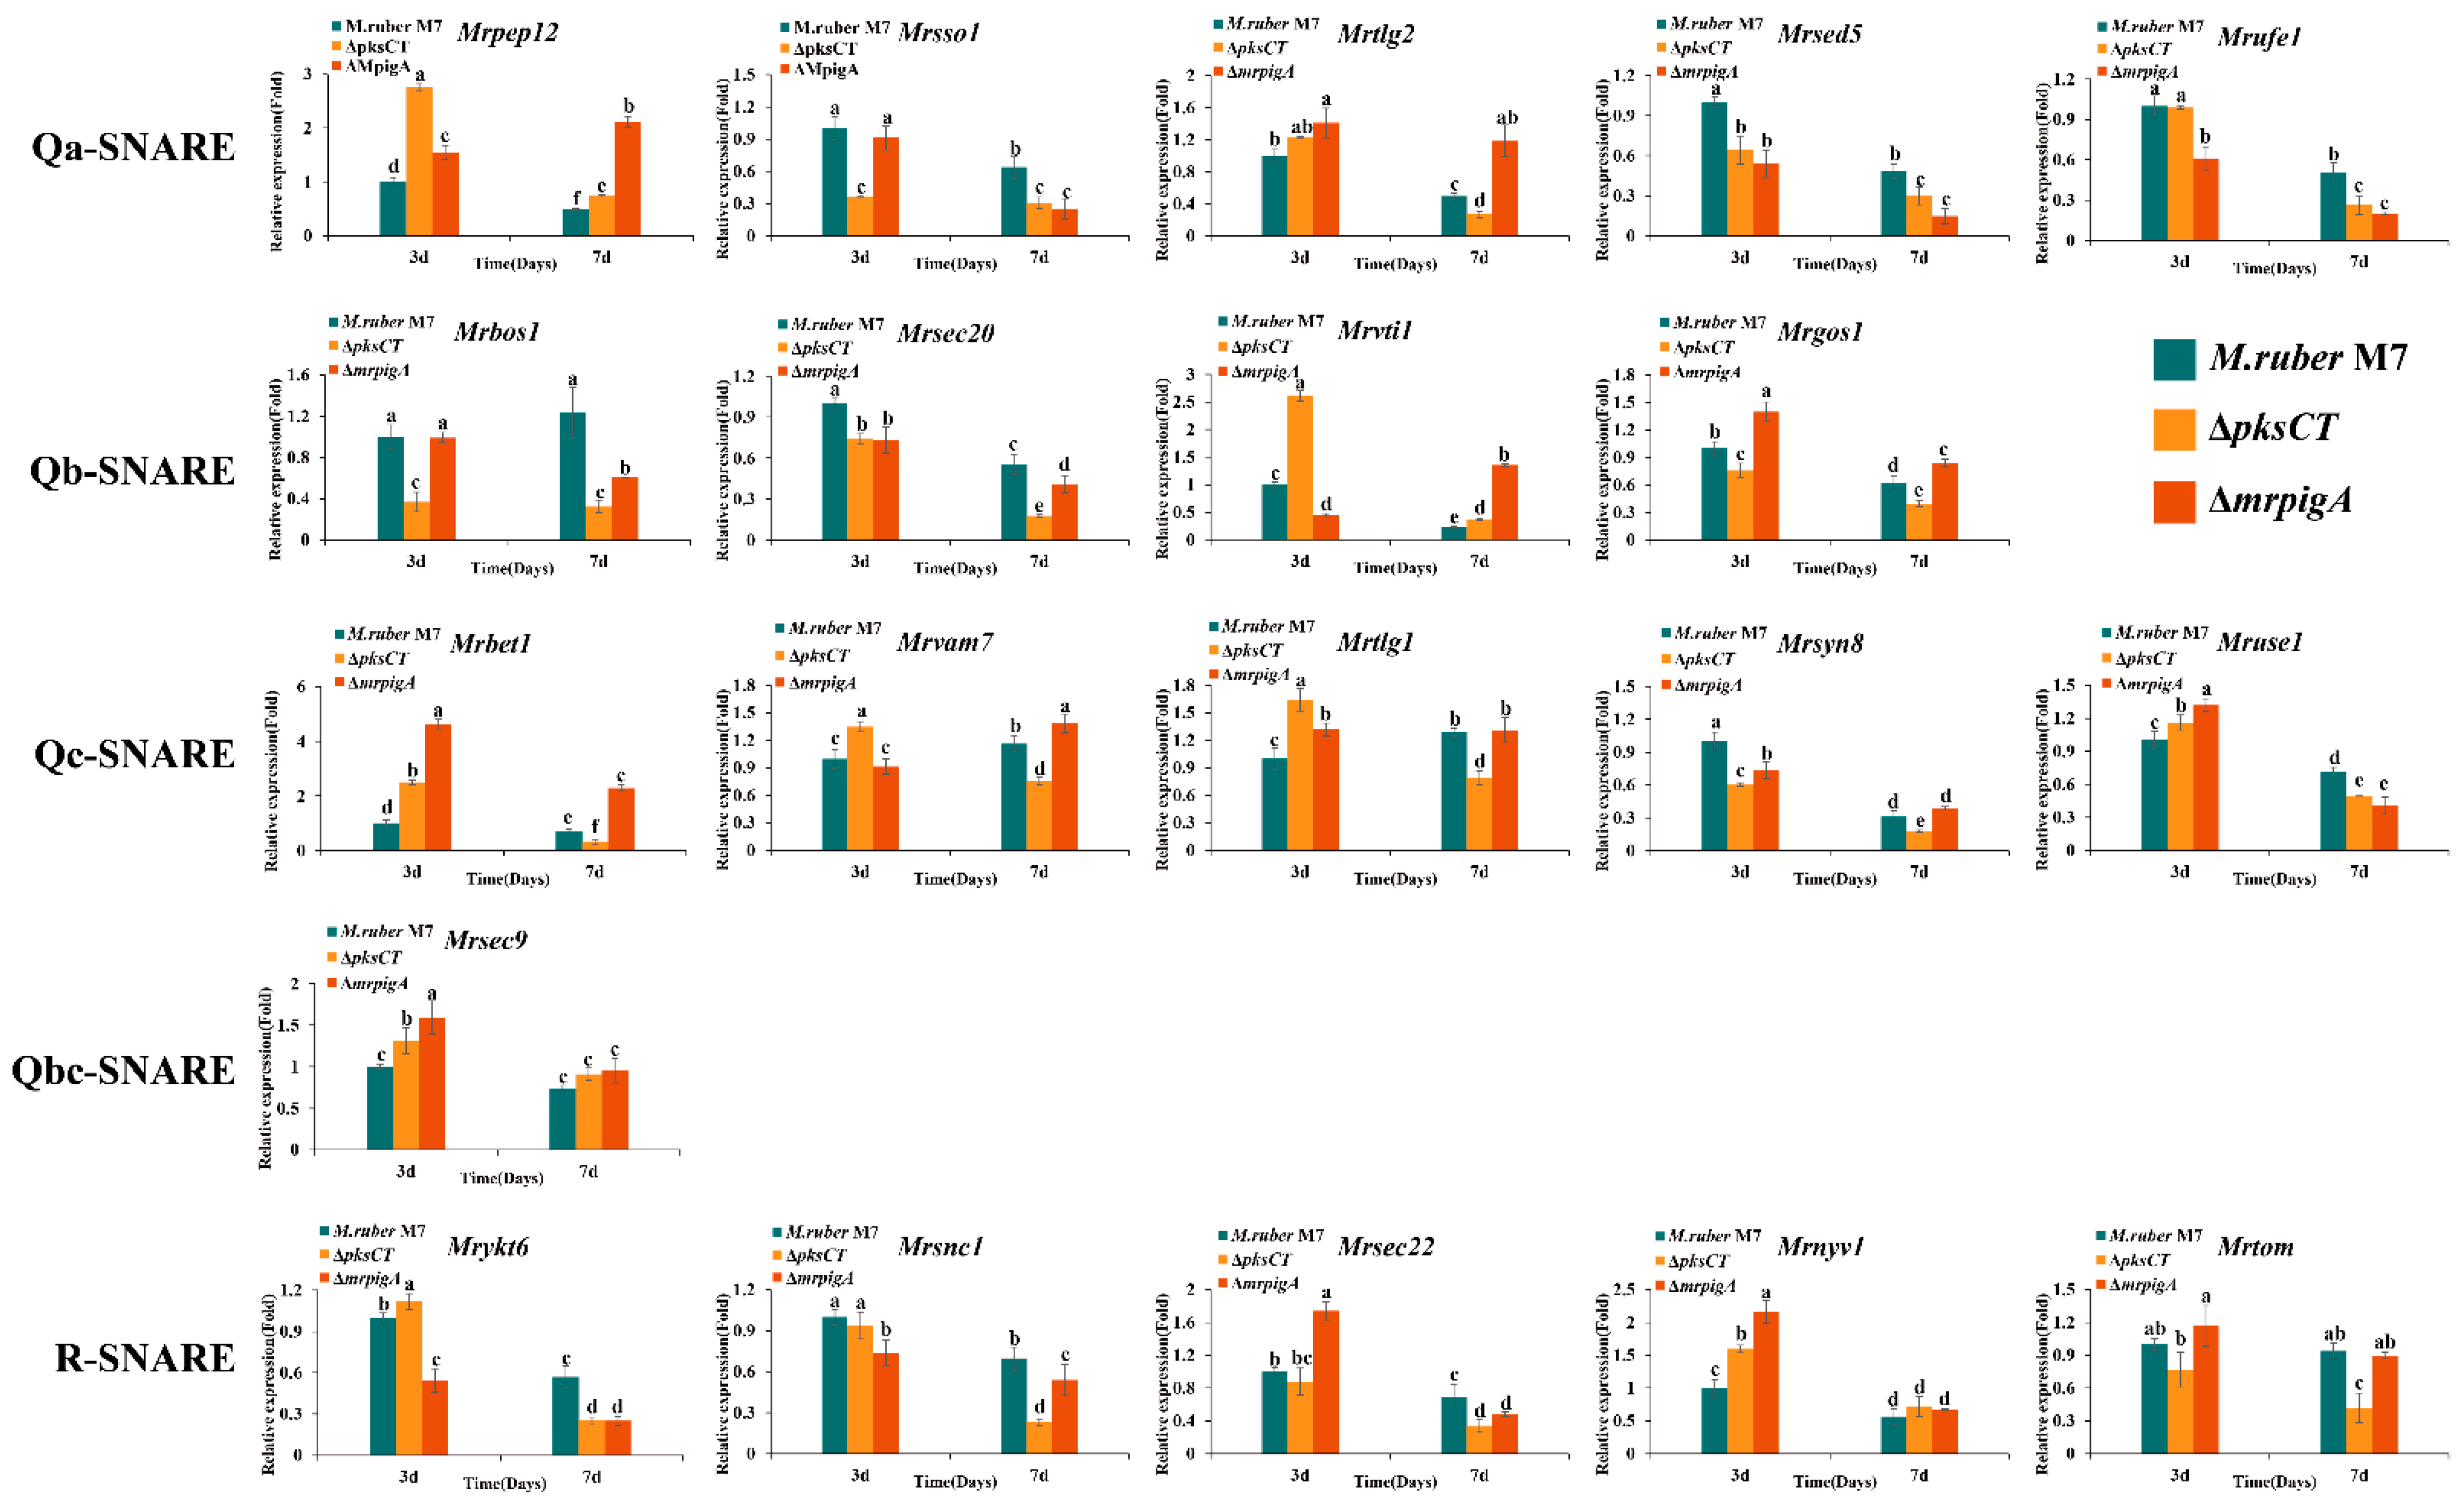
3.3. Expression Profiles of 20 MrSNAREs in Three Monascus Strains

The transcriptional profiles of the 20 predicted MrSNAREs in the wildtype and two mutants, ΔpksCT and ΔmrpigA, were firstly analyzed (Figure 5). The expression levels of M. ruber M7 on the 3rd day were taken as the control. Generally, compared with the 3rd day, the expression levels of most of MrSNAREs were significantly downregulated (p < 0.05) on the 7th day. The expression patterns of different SNARE subfamilies had no obvious trend. Compared with M. ruber M7, for Qa-SNAREs, Mrpep12 was significantly upregulated (p < 0.05) in ΔpksCT and ΔmrpigA, while Mrsso1, Mrsed5 and Mrufe1 were significantly downregulated in the two mutants; Mrtlg2 kept a higher expression level in ΔmrpigA on the 3rd and 7th days. For Qb-SNAREs, only Mrvti1 was significantly upregulated (p < 0.05) in ΔpksCT; the rest were all significantly downregulated; Mrgos1 kept significantly higher expression in ΔmrpigA, but the rest were similar to or lower than M. ruber M7. For Qc-SNAREs, most of them were significantly upregulated in the two mutants, except Mrsyn8. In addition, Mrsec9, the only Qbc-SNARE, was also significantly upregulated in the two mutants. Finally, regarding R-SNAREs, the expression trend of Mrtom and Mrykt6 were quite the opposite in ΔpksCT and ΔmrpigA, but the rest were similar. Above all, the expression of Qb-SNAREs was very different in the two mutants.

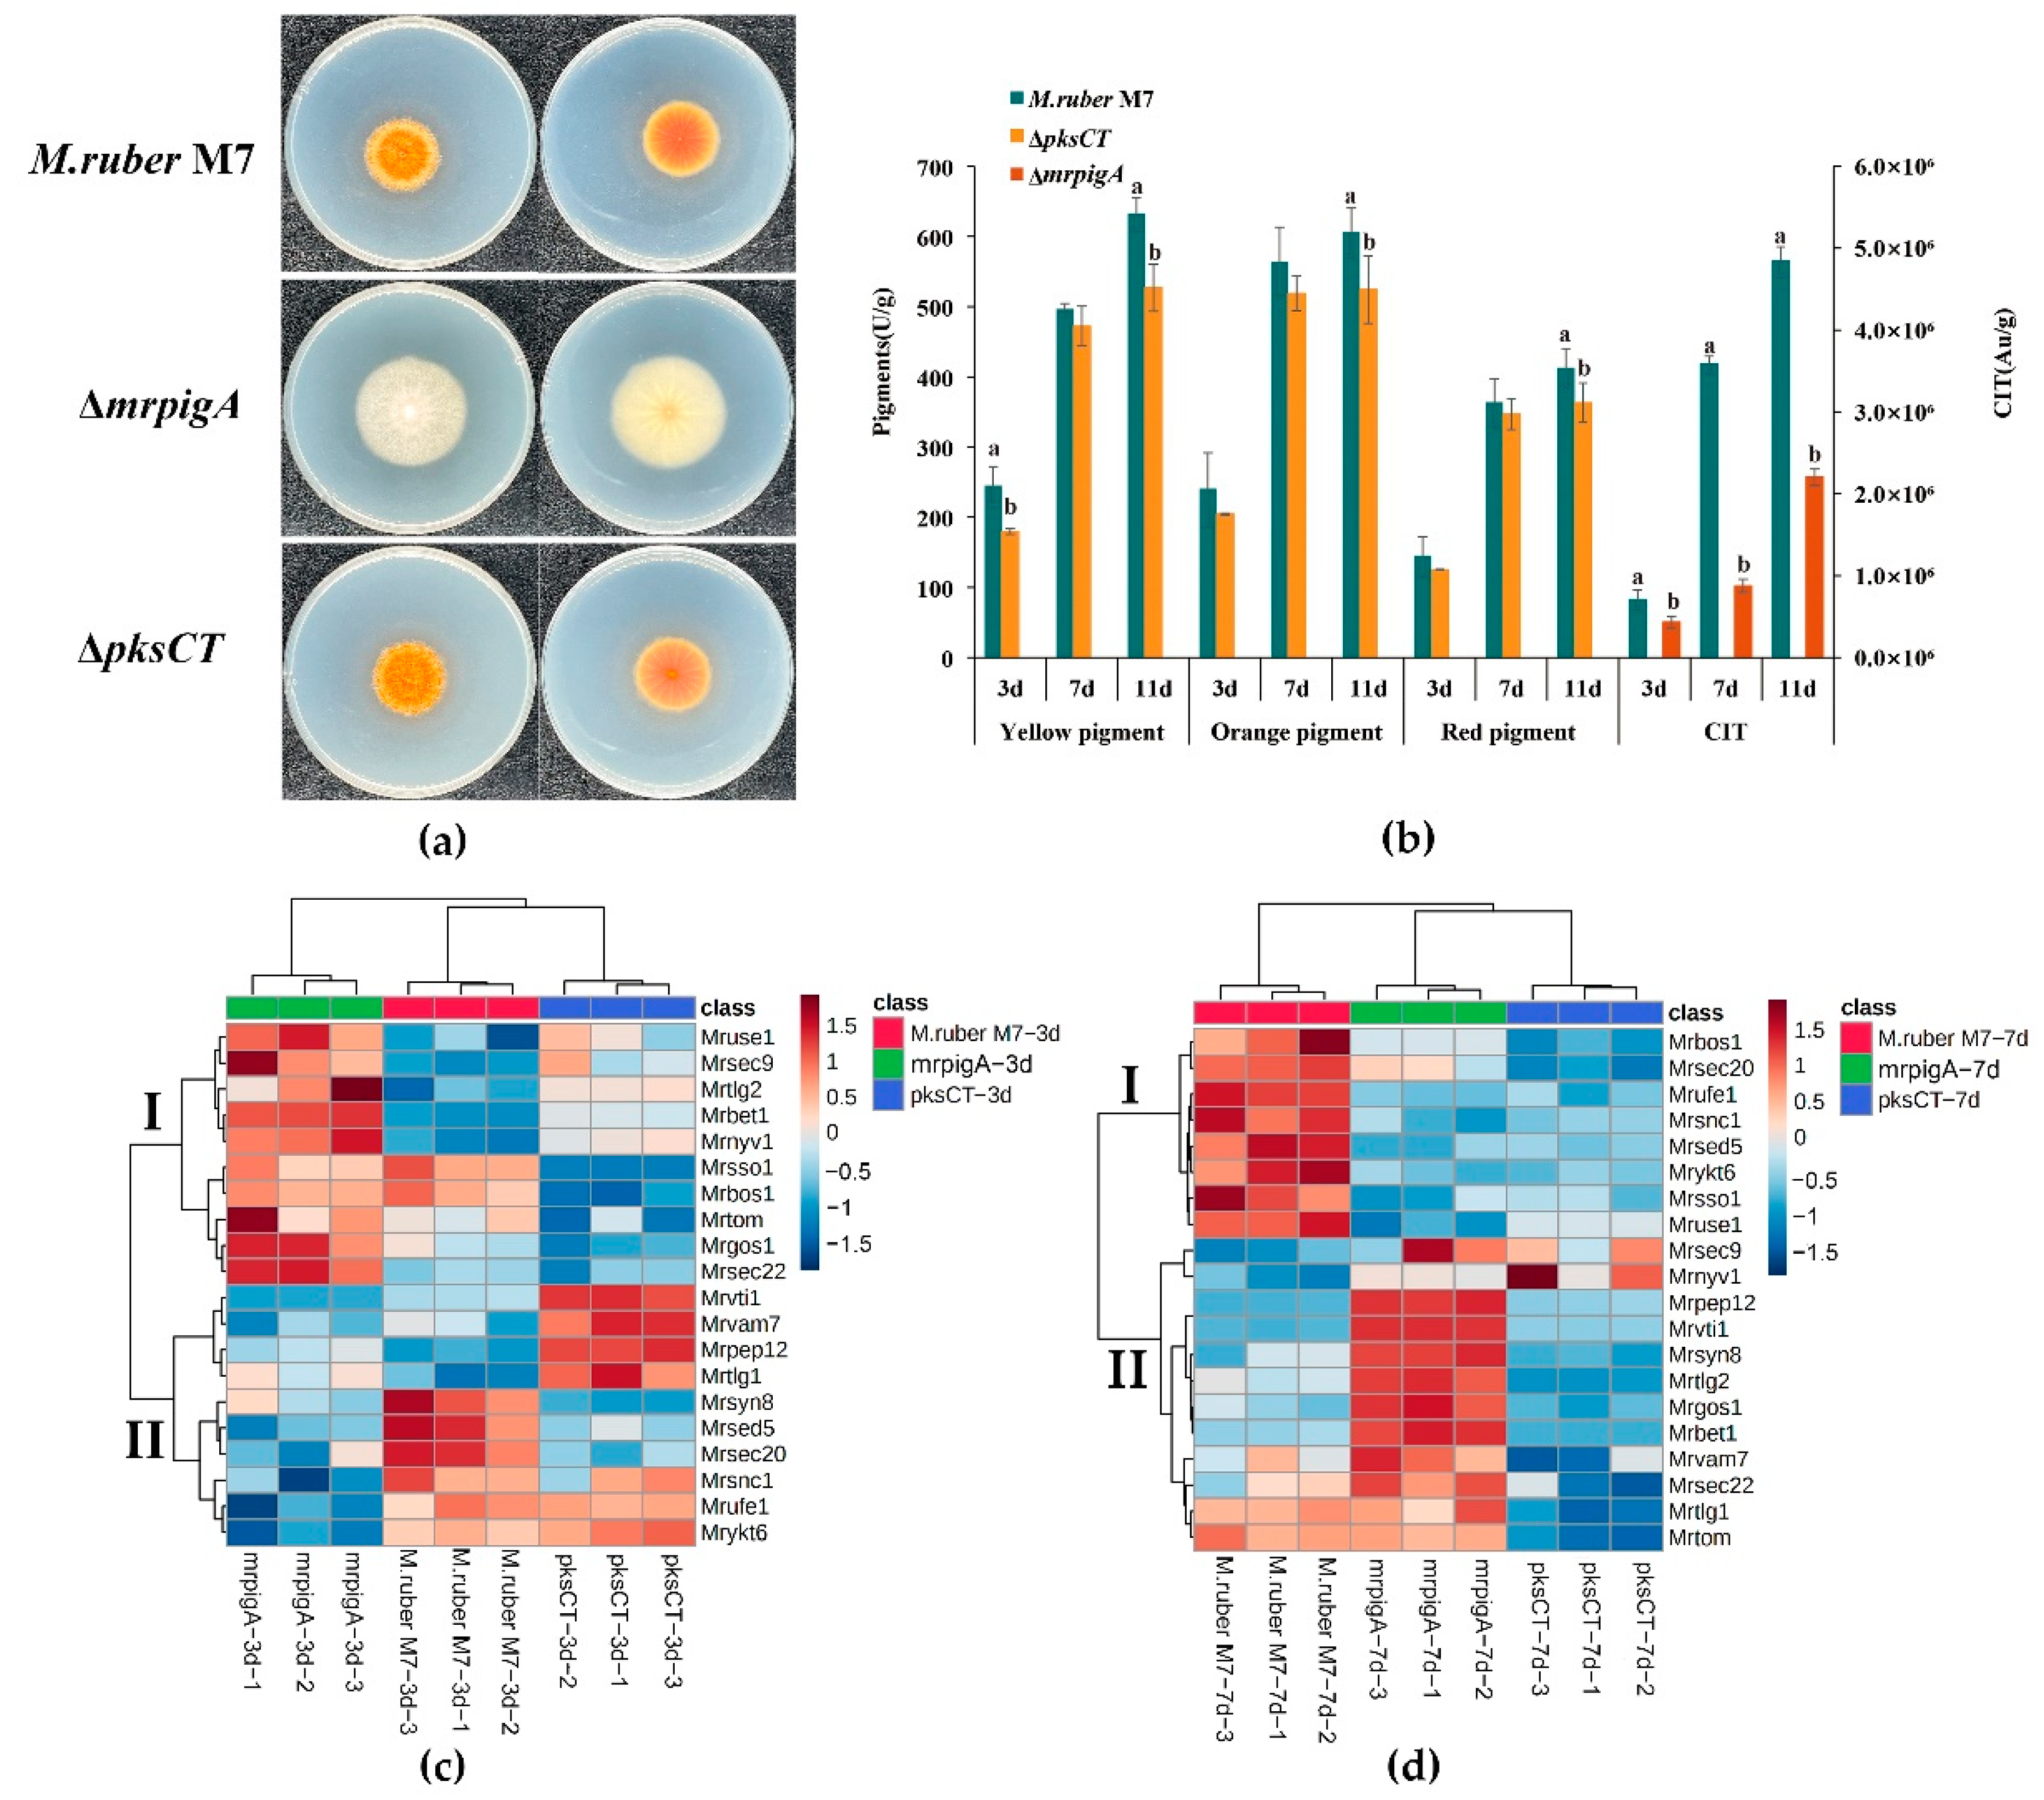
3.4. Analysis of Potential MrSNAREs Related to MPs and CIT Synthesis

Firstly, the phenotypic characterization and main secondary metabolite production of the wildtype and two mutants, ΔpksCT and ΔmrpigA, were compared. After being cultured on PDA medium for 7 days, the colony color and size of M. ruber M7 and ΔpksCT were similar, but the colony of ΔmrpigA turned from orange to white, and the colony size was obviously larger than that of M. ruber M7 (Figure 6a). Figure 6b shows that ΔmrpigA had no MPs and lower CIT yield compared with M. ruber M7; correspondingly, ΔpksCT had no CIT and lower MPs yield compared with M. ruber M7. For example, the content of CIT in ΔmrpigA was about 45% of that in M. ruber M7, and the contents of YP, OP and RP in ΔpksCT were about 83, 86 and 87% of that in M. ruber M7 on the 11th day. These results confirmed the remarkable differences in the secondary metabolite types of the three tested strains.
Subsequently, the expression patterns of MrSNAREs in M. ruber M7, ΔmrpigA and ΔpksCT were further analyzed by cluster analysis. In detail, Figure 6c shows the different expressions of MrSNAREs on the 3rd day among the three strains; the color (from blue to red) indicates the relative intensity change from low to high. It is obvious that there was a clear preference for the expression of MrSNAREs in different secondary metabolic processes. Different MrSNAREs gathered in two main clusters: Cluster I contained the MrSNAREs with higher expression levels in ΔmrpigA, while Cluster II included the MrSNAREs that had higher expression levels in ΔpksCT. This result further indicates the striking differences between MrSNAREs expression in the two mutants. Similarly, the expression patterns of MrSNAREs in the wildtype and two mutants on the 7th day also gathered in two main clusters: Cluster I contained the MrSNAREs that had higher expression levels in the wildtype, and Cluster II included the MrSNAREs that had higher expression levels in ΔmrpigA. Further, Figure 6d was generated by the results of M. ruber M7-7d-1, which was used as control. It is obviously that the difference between the two mutants was becoming smaller, so they were classified as one group when compared with the wildtype. Most of the MrSNAREs (12/20) gathered in the bottom part of Figure 6d were still active in ΔmrpigA, but only four members were active in ΔpksCT. Furthermore, the expression levels of Mrtlg2, Mrbet1, Mrgos1 and Mrsec22 on the 3rd and 7th days remained higher in ΔmrpigA but lower in ΔpksCT, which suggested a reverse response to MPs and CIT synthesis. The expression level of Mrvtil, Mrvam7, Mrpep12 and Mrtlg1 remained higher in ΔpksCT but lower in ΔmrpigA only on the 3rd day, while the expression level of these four genes was quite the opposite on the 7th day.

4. Discussion

SNAREs play a central role in achieving precise material transport between membrane vesicles and have been shown to have important functions in regulating of secondary metabolites. Usually, more than 20 SNARE genes can be identified in most filamentous fungi genomes, and they perform conserved functions during specific vesicle transport pathways [38]. Further, duplicate members of SNARE genes have been reported in S. cerevisiae, such as Sso2 (Sso1 duplicate gene), Snc2 (Snc1 double gene), Vam3 (Pep12 duplicate gene) and Spo20 (Sec9 duplicate gene) [39,40]. In this study, 20 SNARE genes were identified in the M. ruber M7 genome; the most remarkable difference was the absence of Sft1 homologs. A previous study reported that deletion of Sft1 in S. cerevisiae can be compensated for by Bet1 overexpression, indicating that Bet1 in M. ruber M7 could perform the function of Sft1 [41]. Therefore, the 20 SNAREs seemed to fulfill the requirements of vesicular trafficking of M. ruber M7.
In the current study, Mrtom, a large gene organized in seven exons that span 2997 bp, was identified in the M. ruber M7 genome. Although its gene structure and amino acid structure were different from those of other MrSNAREs, its C-terminal still contained the SNARE motif, suggesting that it could act as SNAREs in M. ruber M7. Further, the glutamine residues (Q-site) of Sec20, Syn8 and Use1 were replaced by serine (S), histidine (H) and glutamic (E), respectively. Similar divergences were noted previously in most fungi, as well as in plants and animals [42,43]. These results suggested that the function of these special SNARE genes may be inconsistent across organisms.
Previous studies have illustrated that MPs and CIT share the same initial synthetic pathway but have independent biosynthetic gene clusters [44,45]; this is not enough to reveal the puzzling interaction between the synthesis of MPs and CIT. Recently, the study of compartmentalized biosynthesis of fungal natural products has been a hot topic, which depends on highly ordered subcellular compartmentalization and trafficking of biosynthetic enzymes and their intermediates though vesicles [46]. It is well-known that SNAREs are the core component mediating vesicle trafficking and have a significant role in the secondary metabolism in filamentous fungi. Our study indicates that the expression profiles of SNAREs in ΔpksCT and ΔmrpigA are significantly different, suggesting that MrSNAREs may be involved in the specific regulation of MPs and CIT biosynthesis. Therefore, further investigation of the functions of MrSNAREs could help to reveal whether SNARE could provide reverse regulation of the production of MPs and citrinin and could provide a new strategy for the construction of engineered Monascus strains with high yield of MPs and low or no yield of CIT.
Additionally, the heatmap of expression profiles of all identified MrSNAREs was performed by MetaboAnalyst, which is a widely accepted tool to deal with metabolomics data [47]. In our study, we extended its application to the cluster analysis of the results of relative expression levels of MrSNAREs; then, we arranged the clustering results in Microsoft Office Excel 2019 and applied a graded color scale from the conditional formatting gallery. The result show good classification, and the most-differentially expressed genes can be easily found (Table S2). Thus, MetaboAnalyst is also helpful for statistical analysis of qRT-PCR results.

5. Conclusions

The comprehensive characterization of the SNARE family by genome-wide analysis in Monascus spp. is performed for the first time in this study. Here, we identify and characterize 20 SNARE genes in Monascus ruber M7 (MrSNAREs), which we could divide into four groups based on conserved motifs and phylogenetic relationships. The expression profiles of these MrSNAREs are compared in M. ruber M7, ΔpksCT and ΔmrpigA; three strains have significant differences in their kinds of secondary metabolites. The expression patterns of 20 MrSNAREs show obvious distinct distributions in these three strains. Mrtlg2, Mrbet1, Mrgos1 and Mrsec22 could be considered potential candidate genes involved in the regulation of MPs and CIT synthesis for further functional characterization. Taken together, these results promote the understanding of the SNARE family and provide new insights into their function in secondary metabolism of filamentous fungi.

Supplementary Materials

The following supporting information can be downloaded at: https://www.mdpi.com/article/10.3390/fermentation8120750/s1, Table S1: RT-qPCR primers used in this study; Table S2: Expression profiles of all identified MrSNAREs in M. ruber M7, ΔmrpigA and ΔpksCT.

Author Contributions

Conceptualization, J.L.; methodology, J.L. and C.M.; investigation, C.M.; writing—original draft preparation, J.L. and C.M.; writing—review and editing, J.L. and Y.Z.; visualization, J.L. and C.M.; supervision, Y.Z. and F.C.; funding acquisition, Y.Z. and F.C. All authors have read and agreed to the published version of the manuscript.

Funding

This research was funded by the Major Programs (No. 31730068 and No. 31330059 to FC) and the Young Scientist Program (No. 31701583 to JL) of the National Natural Science Foundation of China.

Institutional Review Board Statement

Not applicable.

Informed Consent Statement

Not applicable.

Data Availability Statement

Not applicable.

Conflicts of Interest

The authors declare no conflict of interest.

References

  1. Behnia, R.; Munro, S. Organelle identity and the signposts for membrane traffic. Nature 2005, 438, 597–604. [Google Scholar] [CrossRef] [PubMed]
  2. Spang, A. The life cycle of a transport vesicle. Cell Mol. Life Sci. 2008, 65, 2781–2789. [Google Scholar] [CrossRef] [PubMed]
  3. Higuchi, Y. Membrane traffic related to endosome dynamics and protein secretion in filamentous fungi. Biosci. Biotechnol. Biochem. 2021, 85, 1038–1045. [Google Scholar] [CrossRef] [PubMed]
  4. Gillingham, A.K.; Munro, S. Transport carrier tethering—How vesicles are captured by organelles. Curr. Opin. Cell Biol. 2019, 59, 140–146. [Google Scholar] [CrossRef]
  5. Margiotta, A. Membrane fusion and snares: Interaction with ras proteins. Int. J. Mol. Sci. 2022, 23, 8067. [Google Scholar] [CrossRef]
  6. Koike, S.; Jahn, R. SNARE proteins: Zip codes in vesicle targeting? Biochem. J. 2022, 479, 273–288. [Google Scholar] [CrossRef]
  7. Heo, P.; Coleman, J.; Fleury, J.B.; Rothman, J.E.; Pincet, F. Nascent fusion pore opening monitored at single-SNAREpin resolution. Proc. Natl. Acad. Sci. USA 2021, 118, e2024922118. [Google Scholar] [CrossRef]
  8. Hong, W.; Lev, S. Tethering the assembly of SNARE complexes. Trends Cell Biol. 2014, 24, 35–43. [Google Scholar] [CrossRef]
  9. Van den Bogaart, G.; Lang, T.; Jahn, R. Chapter Six—Microdomains of Snare Proteins in the Plasma Membrane, in Current Topics in Membranes; Bennett, V., Ed.; Academic Press: Cambridge, MA, USA, 2013; pp. 193–230. [Google Scholar]
  10. Fasshauer, D.; Sutton, R.B.; Brunger, A.T.; Jahn, R. Conserved structural features of the synaptic fusion complex: SNARE proteins reclassified as Q- and R-SNAREs. Proc. Natl. Acad. Sci. USA 1998, 95, 15781–15786. [Google Scholar] [CrossRef] [Green Version]
  11. Jahn, R.; Scheller, R.H. SNAREs—Engines for membrane fusion. Nat. Rev. Mol. Cell Biol. 2006, 7, 631–643. [Google Scholar] [CrossRef]
  12. Han, J.; Pluhackova, K.; Böckmann, R.A. The multifaceted role of snare proteins in membrane fusion. Front. Physiol. 2017, 8, 5. [Google Scholar] [CrossRef] [PubMed] [Green Version]
  13. Hong, W. SNAREs and traffic. BBA-Mol. Cell Res. 2005, 1744, 120–144. [Google Scholar] [CrossRef] [PubMed] [Green Version]
  14. Chen, Y.A.; Scheller, R.H. SNARE-mediated membrane fusion. Nat. Rev. Mol. Cell Biol. 2001, 2, 98–106. [Google Scholar] [CrossRef] [PubMed]
  15. Söllner, T.; Whiteheart, S.W.; Brunner, M.; Erdjument-Bromage, H.; Geromanos, S.; Tempst, P.; Rothman, J.E. SNAP receptors implicated in vesicle targeting and fusion. Nature 1993, 362, 318–324. [Google Scholar] [CrossRef] [PubMed]
  16. Burri, L.; Lithgow, T. A complete set of SNAREs in yeast. Traffic 2004, 5, 45–52. [Google Scholar] [CrossRef]
  17. Pratelli, R.; Sutter, J.U.; Blatt, M.R. A new catch in the SNARE. Trends Plant Sci. 2004, 9, 187–195. [Google Scholar] [CrossRef]
  18. Adnan, M.; Islam, W.; Noman, A.; Hussain, A.; Anwar, M.; Khan, M.U.; Akram, W.; Ashraf, M.F.; Raza, M.F. Q-SNARE protein FgSyn8 plays important role in growth, DON production and pathogenicity of Fusarium graminearum. Microb. Pathog. 2020, 140, 103948. [Google Scholar] [CrossRef]
  19. Li, S.; Zhang, S.; Li, B.; Li, H. The SNARE protein cfvam7 is required for growth, endoplasmic reticulum stress response, and pathogenicity of Colletotrichum fructicola. Front. Microbiol. 2021, 12, 736066. [Google Scholar] [CrossRef]
  20. Li, B.; Gao, Y.; Mao, H.Y.; Borkovich, K.A.; Ouyang, S.Q. The SNARE protein FolVam7 mediates intracellular trafficking to regulate conidiogenesis and pathogenicity in Fusarium oxysporum f. sp. lycopersici. Environ. Microbiol. 2019, 21, 2696–2706. [Google Scholar] [CrossRef] [Green Version]
  21. Su, Z.Z.; Dai, M.D.; Zhu, J.N.; Liu, X.H.; Li, L.; Zhu, X.M.; Wang, J.Y.; Yuan, Z.L.; Lin, F.C. Dark septate endophyte Falciphora oryzae-assisted alleviation of cadmium in rice. J. Hazard. Mater. 2021, 419, 126435. [Google Scholar] [CrossRef]
  22. Adnan, M.; Islam, W.; Zhang, J.; Zheng, W.; Lu, G.D. Diverse role of SNARE protein Sec22 in vesicle trafficking, membrane fusion, and autophagy. Cells 2019, 8, 337. [Google Scholar] [CrossRef] [PubMed] [Green Version]
  23. O’Mara, S.P.; Broz, K.; Boenisch, M.; Zhong, Z.; Dong, Y.; Kistler, H.C. The Fusarium graminearum t-SNARE Sso2 is involved in growth, defense, and don accumulation and virulence. Mol. Plant Microbe Interact. 2020, 33, 888–901. [Google Scholar] [CrossRef] [PubMed]
  24. Qi, Z.; Liu, M.; Dong, Y.; Zhu, Q.; Li, L.; Li, B.; Yang, J.; Li, Y.; Ru, Y.; Zhang, H.; et al. The syntaxin protein (MoSyn8) mediates intracellular trafficking to regulate conidiogenesis and pathogenicity of rice blast fungus. New Phytol. 2016, 209, 1655–1667. [Google Scholar] [CrossRef] [PubMed] [Green Version]
  25. Chen, W.; He, Y.; Zhou, Y.; Shao, Y.; Feng, Y.; Li, M.; Chen, F. Edible filamentous fungi from the species Monascus: Early traditional fermentations, modern molecular biology, and future genomics. Compr. Rev. Food Sci. Food Saf. 2015, 14, 555–567. [Google Scholar] [CrossRef] [Green Version]
  26. Chen, W.; Feng, Y.; Molnár, I.; Chen, F. Nature and nurture: Confluence of pathway determinism with metabolic and chemical serendipity diversifies Monascus azaphilone pigments. Nat. Prod. Rep. 2019, 36, 561–572. [Google Scholar] [CrossRef]
  27. Zhang, C.; Chen, M.; Zang, Y.; Wang, H.; Wei, X.; Zhu, Q.; Yang, X.; Sun, B.; Wang, C. Effect of arginine supplementation on Monacolin K yield of Monascus purpureus. J. Food Compos. Anal. 2022, 106, 104252. [Google Scholar] [CrossRef]
  28. Hou, Y.; Liu, J.; Shao, Y.; Peng, X.; Zhang, D.; Hu, L.; Chen, F.; Zhou, Y. Evaluation of the underestimation of citrinin content in Hongqu using hydrolysis treatments and UPLC-FLD. Food Control 2021, 130, 108245. [Google Scholar] [CrossRef]
  29. Righetti, L.; Dall’Asta, C.; Bruni, R. Risk assessment of ryr food supplements: Perception vs. reality. Front. Nutr. 2021, 8, 792529. [Google Scholar] [CrossRef]
  30. Liu, W.; An, C.; Shu, X.; Meng, X.; Yao, Y.; Zhang, J.; Chen, F.; Xiang, H.; Yang, S.; Gao, X.; et al. A dual-plasmid crispr/cas system for mycotoxin elimination in polykaryotic industrial fungi. ACS Synth. Biol. 2020, 9, 2087–2095. [Google Scholar] [CrossRef]
  31. Ning, Z.Q.; Cui, H.; Xu, Y.; Huang, Z.B.; Tu, Z.; Li, Y.P. Deleting the citrinin biosynthesis-related gene, ctnE, to greatly reduce citrinin production in Monascus aurantiacus Li AS3.4384. Int. J. Food Microbiol. 2017, 241, 325–330. [Google Scholar] [CrossRef]
  32. Xie, N. Identification and Exploration of Pigment Gene Cluster and Metabolic Pathway in Monascus ruber M-7. Ph.D. Thesis, Huazhong Agricultural University, Wuhan, China, 2013; pp. 52–57. [Google Scholar]
  33. Chen, W.; Chen, R.; Liu, Q.; He, Y.; He, K.; Ding, X.; Kang, L.; Guo, X.; Xie, N.; Zhou, Y.; et al. Orange, red, yellow: Biosynthesis of azaphilone pigments in Monascus fungi. Chem. Sci. 2017, 8, 4917–4925. [Google Scholar] [CrossRef] [PubMed] [Green Version]
  34. He, Y. Construction of a High-Efficiency Gene Knockout System of Monascus ruber M7 and Analysis of the Biosynthetic Pathway of Citrinin. Ph.D. Thesis, Huazhong Agricultural University, Wuhan, China, 2015; pp. 113–118. [Google Scholar]
  35. He, Y.; Cox, R.J. The molecular steps of citrinin biosynthesis in fungi. Chem. Sci. 2016, 7, 2119–2127. [Google Scholar] [CrossRef] [PubMed] [Green Version]
  36. Li, W.; Li, Y.; Yu, W.; Li, A.; Wang, Y. Study on production of yellow pigment from potato fermented by Monascus. Food Biosci. 2022, 50, 102088. [Google Scholar] [CrossRef]
  37. Huang, Z.; Hu, T.; Liu, H.; Xie, H.; Tian, X.; Wu, Z. Biosynthesis and polyketide oxidation of Monascus red pigments in an integrated fermentation system with microparticles and surfactants. Food Chem. 2022, 394, 133545. [Google Scholar] [CrossRef] [PubMed]
  38. Li, X.; Xiong, D.; Tian, C. Genome-wide identification, phylogeny and transcriptional profiling of SNARE genes in Cytospora chrysosperma. J. Phytopathol. 2021, 169, 471–485. [Google Scholar] [CrossRef]
  39. Khurana, G.K.; Vishwakarma, P.; Puri, N.; Lynn, A.M. Phylogenetic analysis of the vesicular fusion SNARE machinery revealing its functional divergence across Eukaryotes. Bioinformation 2018, 14, 361–368. [Google Scholar] [CrossRef]
  40. Grissom, J.H.; Segarra, V.A.; Chi, R.J. New perspectives on snare function in the yeast minimal endomembrane system. Genes 2020, 11, 899. [Google Scholar] [CrossRef]
  41. Tsui, M.; Banfield, D. Yeast Golgi SNARE interactions are promiscuous. J. Cell Sci. 2000, 113, 145–152. [Google Scholar] [CrossRef]
  42. Dilcher, M.; Veith, B.; Chidambaram, S.; Hartmann, E.; Schmitt, H.D.; von Mollard, G.F. Use1p is a yeast SNARE protein required for retrograde traffic to the ER. EMBO J. 2003, 22, 3664–3674. [Google Scholar] [CrossRef] [Green Version]
  43. Kádková, A.; Radecke, J.; Sørensen, J.B. The SNAP-25 protein family. Neuroscience 2019, 420, 50–71. [Google Scholar] [CrossRef]
  44. Li, L.; Xu, N.; Chen, F. Inactivation of mrpigH gene in Monascus ruber M7 results in increased Monascus pigments and decreased citrinin with mrpyrG selection marker. J. Fungi 2021, 7, 1094. [Google Scholar] [CrossRef] [PubMed]
  45. Wang, J.; Huang, Y.; Shao, Y. From traditional application to genetic mechanism: Opinions on Monascus research in the new milestone. Front. Microbiol. 2021, 12, 659907. [Google Scholar] [CrossRef] [PubMed]
  46. Du, L.; Li, S. Compartmentalized biosynthesis of fungal natural products. Curr. Opin. Biotechnol. 2021, 69, 128–135. [Google Scholar] [CrossRef] [PubMed]
  47. Pang, Z.; Zhou, G.; Ewald, J.; Chang, L.; Hacariz, O.; Basu, N.; Xia, J. Using MetaboAnalyst 5.0 for LC–HRMS spectra processing, multi-omics integration and covariate adjustment of global metabolomics data. Nat. Protoc. 2022, 17, 1735–1761. [Google Scholar] [CrossRef]
Figure 1. Exon–intron structure of MrSNAREs. Blue boxes represent upstream and downstream untranslated regions; yellow boxes represent the CDS; and black lines represent the introns.
Fermentation 08 00750 g001
Figure 2. Identification of conserved domains of MrSNAREs. Dark green cylinders represent the Qa_motif, light green cylinders represent the Qb_motif, yellow cylinders represent the Qc_motif, red cylinders represent the R_motif, and blue cylinders represent the TM domain.
Fermentation 08 00750 g002
Figure 3. Identification of conserved residues of MrSNAREs. Red dotted boxes represent the conserved glutamine residue (Q), blue dotted boxes represent the conserved arginine residue (R).
Fermentation 08 00750 g003
Figure 4. Phylogenetic analysis of 20 SNAREs identified in M. ruber M7. Dark green indicates Qa_SNAREs, light green indicates Qb_SNAREs, yellow indicates Qc_SNAREs, and red indicates R_SNAREs.
Fermentation 08 00750 g004
Figure 5. Expression profiles of the identified MrSNAREs in M. ruber M7, ΔpksCT and ΔmrpigA. Error bars represent means ± SD, n = 3. Y-axis indicates the relative expression level of the genes. Different lowercase letters indicate the gene expression level is significantly different (p < 0.05).
Fermentation 08 00750 g005
Figure 6. Analysis of potential SNARE genes involved in MPs and CIT synthesis. (a) Colony morphology of M. ruber M7, ΔmrpigA and ΔpksCT on PDA plate after cultivating at 28 °C for 7 days. (b) MPs and CIT produced by M. ruber M7, ΔmrpigA and ΔpksCT. Different lowercase letters indicate the gene expression level is significantly different (p < 0.05). (c) Heatmap based on relative expression levels of MrSNAREs on the 3rd day; the expression level of M. ruber M7-3d-1 is the control. (d) Heatmap based on the relative expression levels of MrSNAREs on the 7th day; the expression level of M. ruber M7-7d-1 is the control.
Fermentation 08 00750 g006
Table 1. Physicochemical parameters of identified MrSNAREs.
Gene NameGenBankLength of CDS (bp)Protein Length (aa)Molecular Weight (Da)Isoelectric PointA. nidulans IdentityS. cerevisiae Identity
Mrpep12OP620680.182227330,719.095.02Pep12 (76%)Pep12 (29%)
Mrsso1OP620682.194231334,792.645.18Sso (39%)Sso1 (25%)
Mrtlg2OP620686.1104134645,169.386.75Tlg2 (78%)Tlg2 (33%)
Mrsed5OP620683.1116438738,021.889.04Sed5 (88%)Sed5 (37%)
Mrufe1OP620691.1120940244,159.327.21Ufe1 (49%)Ufe1 (34%)
Mrbos1OP620676.1136545451,257.339.83-Bos1 (29%)
Mrsec20OP620689.1116138643,724.395.52Sec20 (58%)Sec20 (26%)
Mrvti1OP620690.160320022,885.515.63Vti1 (79%)Vti1 (41%)
Mrgos1OP620693.168422725,819.339.75Gos1 (86%)Gos1 (35%)
Mrbet1OP620679.12949710,397.745.16Bet1 (29%)Bet1 (22%)
Mrvam7OP620681.1111637141,239.489.42Vam7 (66%)Vam7 (26%)
Mrtlg1OP620685.175625127,983.684.46Tlg1 (70%)Tlg1 (27%)
Mrsyn8OP620684.183427730,575.955.04Syn8 (65%)Syn8 (24%)
Mruse1OP620687.1108035940,026.025.14Use1 (58%)-
Mrsec9OP620692.1122140644,644.996.71Sec9 (63%)Sec9 (40%)
Mrykt6OP620694.160320022,882.076.83Ykt6 (57%)Ykt6 (53%)
Mrsnc1OP620677.136011913,012.989.39Snc (71%)Snc1 (59%)
Mrsec22OP620678.157617123,645.998.35Sec22 (79%)Sec22 (49%)
Mrnyv1OP620695.175622327,838.059.21Nyv1 (82%)Nyv1 (39%)
MrtomOP620688.12994988107,978.536.98Tomosyn (67%)Sro7 (30%)
Publisher’s Note: MDPI stays neutral with regard to jurisdictional claims in published maps and institutional affiliations.

