
Effects of Fermentation on the Physicochemical Properties and Aroma of Lamb Liver Paste
 , ,
, ,
Abstract
:
1. Introduction
2. Materials and Methods
2.1. Preparation of Fermented Lamb Liver Paste (Basic Recipe and Process Flow)
2.2. Experimental Design Grouping of Mutton Liver Paste during Storage
2.3. Indicator Measurement
2.3.1. Microbial Analysis
2.3.2. Determination of Physical and Chemical Indicators
2.4. Analysis of Volatile Compounds
2.5. Data Analysis
3. Results
3.1. The Total Number of Colonies and the Number of Lactic Acid Bacteria
3.2. pH Value
3.3. Aw Value
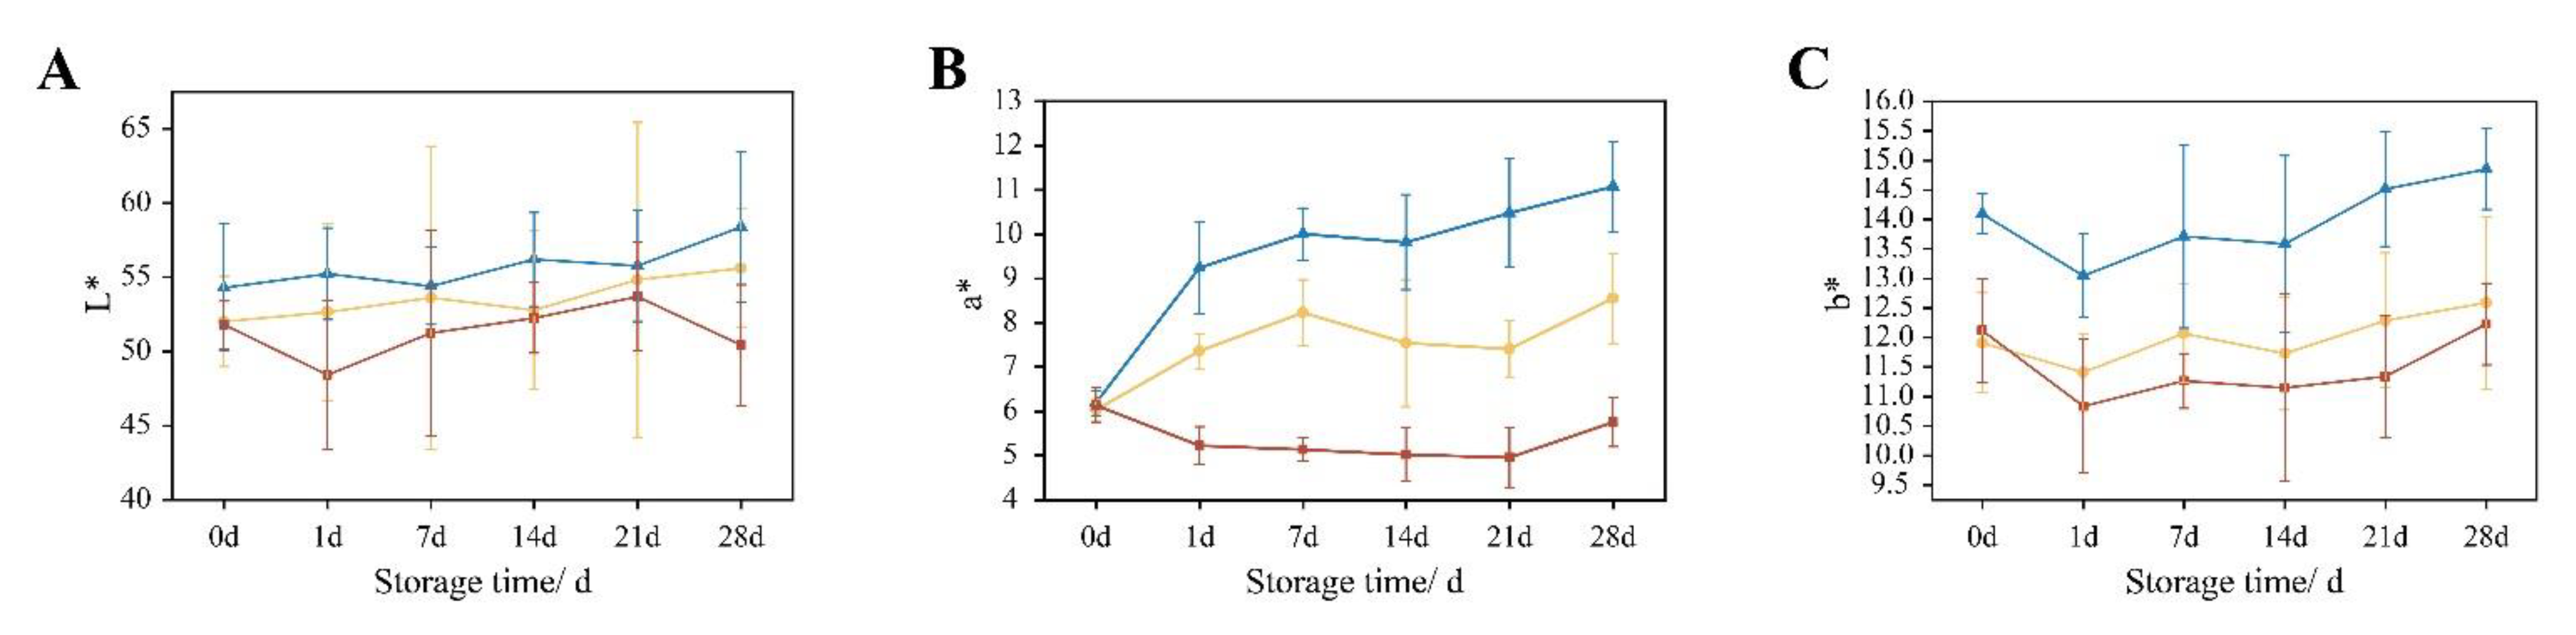
3.4. Chromatic Properties
3.5. Texture
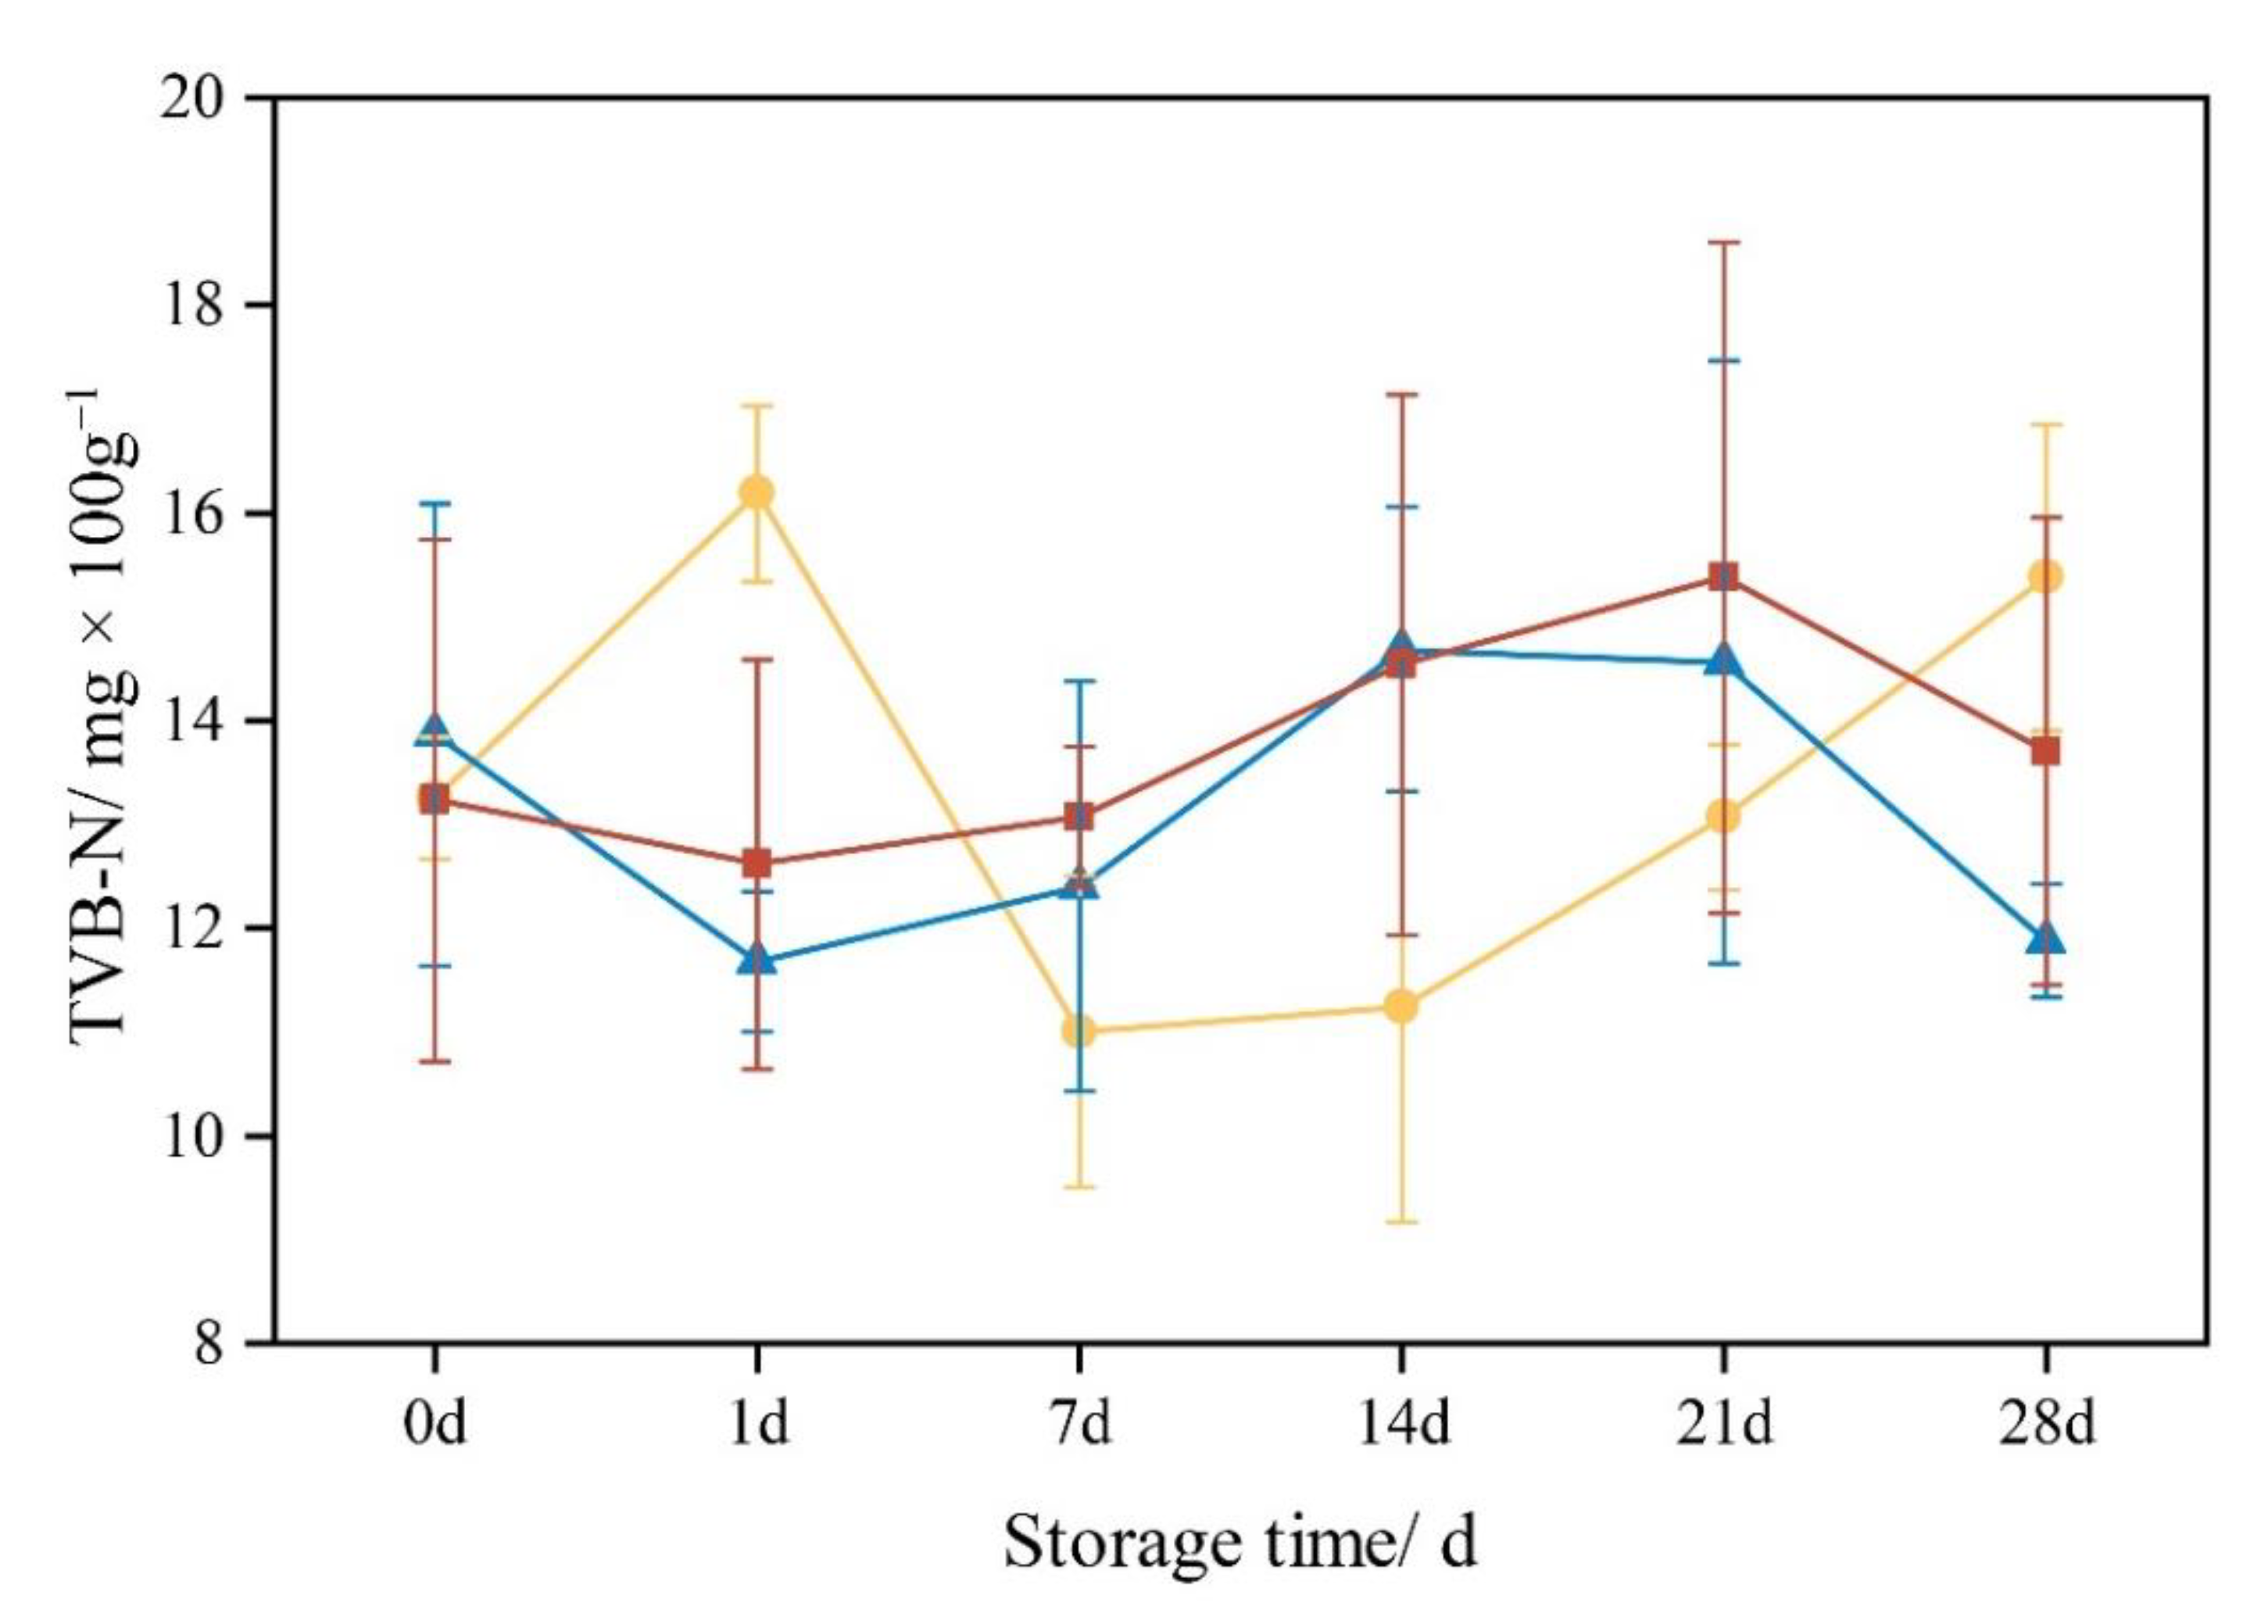
3.6. TVB-N Value
3.7. TBARS Value
3.8. Basic Nutritional Indicators
3.8.1. Moisture Content
3.8.2. Protein Content
3.8.3. Fat Content
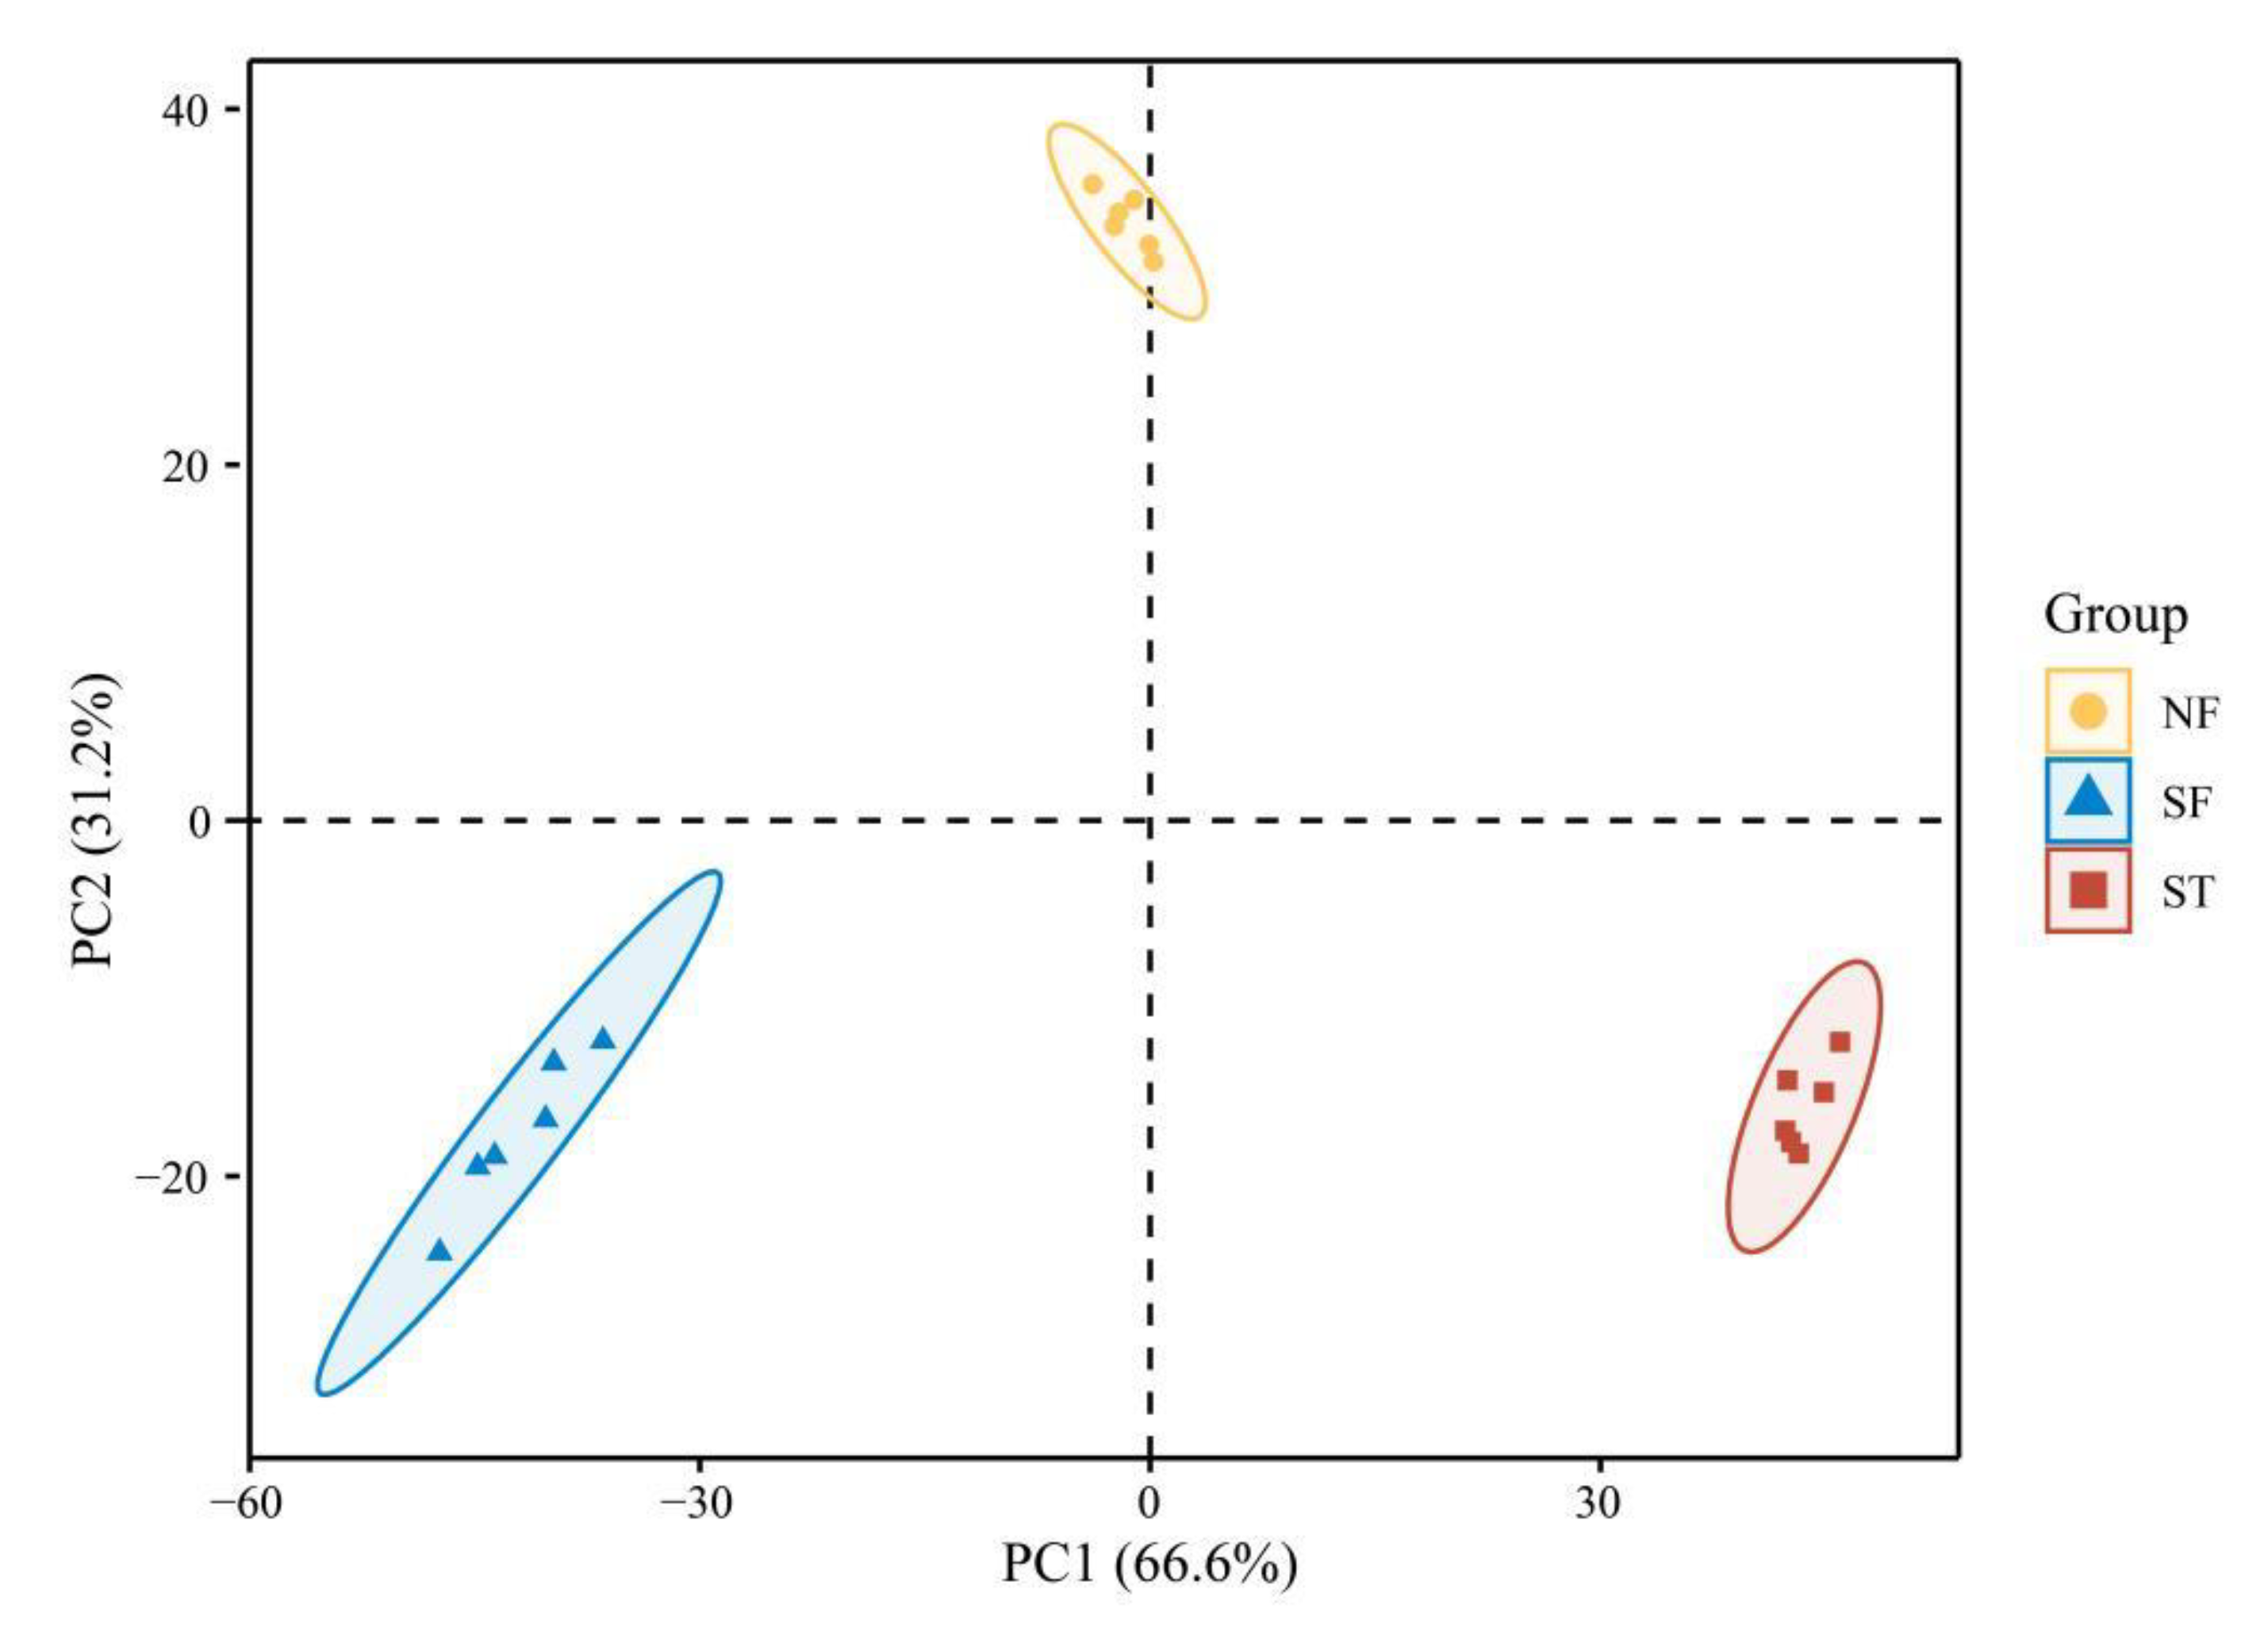
3.9. Volatile Profile
4. Discussion
5. Conclusions
Supplementary Materials
Author Contributions
Funding
Institutional Review Board Statement
Informed Consent Statement
Data Availability Statement
Conflicts of Interest
References
- Kozeniecki, M.; Ludke, R.; Kerner, J.; Patterson, B. Micronutrients in Liver Disease: Roles, Risk Factors for Deficiency, and Recommendations for Supplementation. Nutr. Clin. Pract. 2020, 35, 50–62. [Google Scholar] [CrossRef] [PubMed] [Green Version]
- Hou, Y.; Hu, S.; Li, X.; He, W.; Wu, G. Amino Acid Metabolism in the Liver: Nutritional and Physiological Significance. Adv. Exp. Med. Biol. 2020, 1265, 21–37. [Google Scholar] [PubMed]
- Tanumihardjo, S.A. Vitamin A: Biomarkers of nutrition for development. Am. J. Clin. Nutr. 2011, 94, 658S–665S. [Google Scholar] [CrossRef] [PubMed] [Green Version]
- Trefts, E.; Gannon, M.; Wasserman, D.H. The liver. Curr. Biol. 2017, 27, 1147–1151. [Google Scholar] [CrossRef] [PubMed]
- Cornelius, C.E. A review of new approaches to assessing hepatic function in animals. Vet. Res. Commun. 1987, 11, 423–441. [Google Scholar] [CrossRef] [PubMed]
- Wang, J.; Ji, H. Influence of Probiotics on Dietary Protein Digestion and Utilization in the Gastrointestinal Tract. Curr. Protein Pept. Sci. 2019, 20, 125–131. [Google Scholar] [CrossRef]
- Ordóñez, J.A.; Hierro, E.M.; Bruna, J.M.; de la Hoz, L. Changes in the components of dry-fermented sausages during ripening. Crit. Rev. Food Sci. Nutr. 1999, 39, 329–367. [Google Scholar] [CrossRef]
- Berdagué, J.L.; Monteil, P.; Montel, M.C.; Talon, R. Effect of starter cultures on the formation of flavor compounds in dry sausage. Meat Sci. 1993, 35, 275–287. [Google Scholar] [CrossRef]
- Ardö, Y. Flavour formation by amino acid catabolism. Biotechnol. Adv. 2006, 24, 238–242. [Google Scholar] [CrossRef]
- Casaburi, A.; Aristoy, M.C.; Cavella, S.; Di Monaco, R.; Ercolini, D.; Toldrá, F.; Villani, F. Biochemical and sensory characteristics of traditional fermented sausages of Vallo di Diano (Southern Italy) as affected by the use of starter cultures. Meat Sci. 2007, 76, 295–307. [Google Scholar] [CrossRef]
- Antara, N.S.; Sujaya, I.N.; Yokota, A.; Asano, K.; Tomita, F. Effects of indigenous starter cultures on the microbial and physicochemical characteristics of Urutan, a Balinese fermented sausage. J. Biosci. Bioeng. 2004, 98, 92–98. [Google Scholar] [CrossRef] [PubMed]
- Xing, T.K.; Shi, T.; Michael, G. Effect of starter cultures on taste-active amino acids and survival of Escherichia coli in dry fermented beef sausages. Eur. Food Res. Technol. 2018, 244, 2203–2212. [Google Scholar]
- García-Díez, J.; Saraiva, C. Use of Starter Cultures in Foods from Animal Origin to Improve Their Safety. Int. J. Environ. Res. Public Health 2021, 18, 2544. [Google Scholar] [CrossRef]
- GOST 12319-77; The Standard Applies to Canned Meat “Liver Pate”, Packed in Cans, Hermetically Sealed and Sterilized. Russian Gost. 2012. Available online: https://www.russiangost.com/ (accessed on 9 October 2022).
- Perea-Sanz, L.; Peris, D.; Belloch, C.; Flores, M. Debaryomyces hansenii metabolism of sulfur amino acids as precursors of volatile sulfur compounds of interest in meat products. J. Agric. Food Chem. 2019, 67, 9335–9343. [Google Scholar] [CrossRef] [PubMed]
- Luo, Y.; Zhao, L.; Xu, J.; Su, L.; Jin, Z.; Su, R.; Jin, Y. Effect of fermentation and postcooking procedure on quality parameters and volatile compounds of beef jerky. Food Sci. Nutr. 2020, 8, 2316–2326. [Google Scholar] [CrossRef]
- Omana, D.A.; Moayedi, V.; Xu, Y.; Betti, M. Alkali-aided protein extraction from chicken dark meat: Textural properties and color characteristics of recovered proteins. Poult. Sci. 2010, 89, 1056–1064. [Google Scholar] [CrossRef]
- Liang, C.; Zhang, D.; Zheng, X.; Wen, X.; Yan, T.; Zhang, Z.; Hou, C. Effects of Different Storage Temperatures on the Physicochemical Properties and Bacterial Community Structure of Fresh Lamb Meat. Food Sci. Anim. Resour. 2021, 41, 509–526. [Google Scholar] [CrossRef]
- Gong, S.; Jiao, C.; Guo, L. Antibacterial mechanism of beetroot (Beta vulgaris) extract against Listeria monocytogenes through apoptosis-like death and its application in cooked pork. LWT-Food Sci. Technol. 2022, 165, 113711. [Google Scholar] [CrossRef]
- Luo, Y.; Wang, B.; Liu, C.; Su, R.; Hou, Y.; Yao, D.; Zhao, L.; Su, L.; Jin, Y. Meat quality, fatty acids, volatile compounds, and antioxidant properties of lambs fed pasture versus mixed diet. Food Sci. Nutr. 2019, 7, 2796–2805. [Google Scholar] [CrossRef] [Green Version]
- Mokhtar, S.; Mostafa, G.; Taha, R.; Eldeep, G.S.S. Effect of different starter cultures on the biogenic amines production as a critical control point in fresh fermented sausages. Eur. Food Res. Technol. 2012, 235, 527–535. [Google Scholar] [CrossRef]
- Zang, J.; Xu, Y.; Xia, W.; Regenstein, J.M.; Yu, D.; Yang, F.; Jiang, Q. Correlations between microbiota succession and flavor formation during fermentation of Chinese low-salt fermented common carp (Cyprinus carpio L.) inoculated with mixed starter cultures. Food Microbiol. 2020, 90, 103487. [Google Scholar] [CrossRef] [PubMed]
- Cenci-Goga, B.T.; Karama, M.; Sechi, P.; Iulietto, M.F.; Novelli, S.; Selvaggini, R.; Barbera, S. Effect of a novel starter culture and specific ripening conditions on microbiological characteristics of nitrate-free dry-cured pork sausages. J. Anim. Sci. 2016, 15, 358–374. [Google Scholar] [CrossRef] [Green Version]
- Wang, X.; Zhang, Y.; Ren, H.; Zhan, Y. Comparison of bacterial diversity profiles and microbial safety assessment of salami, Chinese dry-cured sausage and Chinese smoked-cured sausage by high-through put sequencing. LWT-Food Sci. Technol. 2018, 90, 108–115. [Google Scholar] [CrossRef]
- Cano-Garcia, L.; Belloch, C.; Flores, M. Impact of Debaryomyces hansenii strains inoculation on the quality of slow dry-cured fermented sausages. Meat Sci. 2014, 96, 1469–1477. [Google Scholar] [CrossRef] [Green Version]
- Kim, S.; Lee, J.Y.; Jeong, Y.; Kang, C.-H. Antioxidant Activity and Probiotic Properties of Lactic Acid Bacteria. Fermentation 2022, 8, 29. [Google Scholar] [CrossRef]
- Yan, F.; Polk, D.B. Probiotics and Probiotic-Derived Functional Factors-Mechanistic Insights into Applications for Intestinal Homeostasis. Front. Immunol. 2020, 11, 1428. [Google Scholar] [CrossRef]
- Rui, L. Energy metabolism in the liver. Compr. Physiol. 2014, 4, 177–197. [Google Scholar]
- Koshland, D.E.; Haurowitz, F. Protein. Encyclopedia Britannica. 2022. Available online: https://www.britannica.com/science/protein (accessed on 18 October 2022).
- Stadtman, E.R.; Levine, R.L. Free radical-mediated oxidation of free amino acids and amino acid residues in proteins. Amino Acids 2003, 25, 207–218. [Google Scholar] [CrossRef]
- Yu, H.; Xie, T.; Xie, J.; Chen, C.; Ai, L.; Tian, H. Aroma perceptual interactions of benzaldehyde, furfural, and vanillin and their effects on the descriptor intensities of Huangjiu. Food Res. Int. 2020, 129, 108808. [Google Scholar] [CrossRef]
- Högnadóttir, A.; Rouseff, R.L. Identification of aroma active compounds in orange essence oil using gas chromatography-olfactometry and gas chromatography-mass spectrometry. J. Chromatogr. A 2003, 998, 201–211. [Google Scholar] [CrossRef]
- Bai, S.; Wang, Y.; Luo, R.; Shen, F.; Bai, H.; Ding, D. Formation of flavor volatile compounds at different processing stages of household stir-frying mutton Sao Zi in the northwest of China. LWT-Food Sci. Technol. 2020, 139, 110735. [Google Scholar] [CrossRef]
- Petronilho, S.; Lopez, R.; Ferreira, V.; Coimbra, M.A.; Rocha, S.M. Revealing the Usefulness of Aroma Networks to Explain Wine Aroma Properties: A Case Study of Portuguese Wines. Molecules 2020, 25, 272. [Google Scholar] [CrossRef] [PubMed]
- Kołakowski, J.; Karkucińska, A.; Dabrowska, R. Calponin inhibits actin-activated MgA.TPase of myosin subfragment 1 (S1) without displacing S1 from its binding site on actin. Eur. J. Biochem. 1997, 243, 624–629. [Google Scholar] [CrossRef] [PubMed]
- Wang, H.; Xia, X.; Yin, X.; Liu, H.; Chen, Q.; Kong, B. Investigation of molecular mechanisms of interaction between myofibrillar proteins and 1-heptanol by multiple spectroscopy and molecular docking methods. Int. J. Biol. Macromol. 2021, 193 Pt A, 672–680. [Google Scholar] [CrossRef]
- Jin, Y.; Yuan, X.; Liu, J.; Wen, J.; Cui, H.; Zhao, G. Inhibition of cholesterol biosynthesis promotes the production of 1-octen-3-ol through mevalonic acid. Food Res. Int. 2022, 158, 111392. [Google Scholar] [CrossRef] [PubMed]
- Peng, W.; Lin, Z.; Wang, L.; Chang, J.; Gu, F.; Zhu, X. Molecular characteristics of Illicium verum extractives to activate acquired immune response. Saudi J. Biol. Sci. 2016, 23, 348–352. [Google Scholar] [CrossRef] [Green Version]
- Yang, W.; Wu, T.; Tu, S.; Qin, Y.; Shen, C.; Li, J.; Choi, M.K.; Duan, F.; Zhang, Y. Redundant neural circuits regulate olfactory integration. PLoS Genet. 2022, 18, 1010029. [Google Scholar] [CrossRef]
- Sun, J. D-Limonene: Safety and clinical applications. Altern. Med. Rev. 2007, 12, 259–264. [Google Scholar]
- Lopes, G.R.; Petronilho, S.; Ferreira, A.S.; Pinto, M.; Passos, C.P.; Coelho, E.; Rodrigues, C.; Figueira, C.; Rocha, S.M.; Coimbra, M.A. Insights on Single-Dose Espresso Coffee Capsules’ Volatile Profile: From Ground Powder Volatiles to Prediction of Espresso Brew Aroma Properties. Foods 2021, 10, 2508. [Google Scholar] [CrossRef]
- Scandiffio, R.; Geddo, F.; Cottone, E.; Querio, G.; Antoniotti, S.; Gallo, M.P.; Maffei, M.E.; Bovolin, P. Protective Effects of (E)-β-Caryophyllene (BCP) in Chronic Inflammation. Nutrients 2020, 12, 3273. [Google Scholar] [CrossRef]
- Takemoto, Y.; Kishi, C.; Sugiura, Y.; Yoshioka, Y.; Matsumura, S.; Moriyama, T.; Zaima, N. Distribution of inhaled volatile β-caryophyllene and dynamic changes of liver metabolites in mice. Sci. Rep. 2021, 11, 1728. [Google Scholar] [CrossRef] [PubMed]


| Groups | 0 d | 1 d | 7 d | 14 d | 21 d | 28 d | |
|---|---|---|---|---|---|---|---|
| Hardness/g | NF-group | 1770.55 ± 67.60 Bb | 1963.21 ± 26.12 Aa | 1621.91 ± 119.71 Bb | 1592.06 ± 45.13 Bc | 1367.97 ± 47.51 Cc | 1353.04 ± 52.84 Cb |
| SF-group | 1963.45 ± 37.48 ABa | 2054.15 ± 55.98 Aa | 2017.42 ± 47.64 Aa | 1870.76 ± 25.70 Bb | 1472.28 ± 12.69 Cb | 1409.58 ± 26.61 Cb | |
| ST-group | 1844.84 ± 41.44 Cab | 1964.04 ± 13.45 BCa | 2097.47 ± 55.96 Ba | 2056.36 ± 92.52 Ba | 2262.87 ± 27.78 Aa | 2348.97 ± 73.99 Aa | |
| Elasticity | NF-group | 0.18 ± 0.01 Ab | 0.18 ± 0.01 Aa | 0.15 ± 0.01 Ab | 0.16 ± 0.03 Aab | 0.17 ± 0.05 Aa | 0.13 ± 0.02 Aa |
| SF-group | 0.30 ± 0.05 Aa | 0.19 ± 0.02 Ba | 0.14 ± 0.01 Bb | 0.12 ± 0.02 Bb | 0.14 ± 0.04 Ba | 0.18 ± 0.04 Ba | |
| ST-group | 0.18 ± 0.01 Ab | 0.18 ± 0.02 Aa | 0.18 ± 0.01 Aa | 0.17 ± 0.01 Aa | 0.18 ± 0.01 Aa | 0.19 ± 0.02 Aa | |
| Cohesiveness | NF-group | 0.14 ± 0.02 Ab | 0.12 ± 0.01 ABa | 0.09 ± 0.01 BCb | 0.08 ± 0.01 Cb | 0.08 ± 0.00 Cb | 0.08 ± 0.01 Cb |
| SF-group | 0.19 ± 0.02 Aa | 0.12 ± 0.01 Ba | 0.10 ± 0.01 Cab | 0.09 ± 0.00 Cb | 0.09 ± 0.01 Cb | 0.08 ± 0.00 Cb | |
| ST-group | 0.15 ± 0.01 Ab | 0.12 ± 0.00 Ba | 0.12 ± 0.00 Ba | 0.13 ± 0.01 ABa | 0.12 ± 0.00 Ba | 0.13 ± 0.01 ABa | |
| Adhesion | NF-group | 261.05 ± 8.48 Ab | 227.93 ± 3.04 Bc | 152.57 ± 10.05 CDc | 160.30 ± 11.51 Cb | 127.43 ± 14.35 DEb | 107.15 ± 8.17 Eb |
| SF-group | 374.55 ± 8.42 Aa | 268.12 ± 5.58 Ba | 199.36 ± 4.94 Cb | 167.51 ± 2.11 Db | 121.36 ± 1.52 Eb | 116.24 ± 1.62 Eb | |
| ST-group | 256.90 ± 1.39 CDb | 242.28 ± 5.13 Db | 251.53 ± 2.21 Da | 283.36 ± 8.57 ABa | 274.28 ± 1.60 BCa | 296.84 ± 14.48 Aa | |
| Chewiness | NF-group | 49.89 ± 1.76 Aab | 41.09 ± 1.41 Aa | 23.47 ± 3.33 Bb | 23.35 ± 5.25 Bb | 22.53 ± 8.58 Bb | 14.85 ± 1.19 Bb |
| SF-group | 58.71 ± 7.13 Aa | 49.99 ± 7.10 Aa | 28.51 ± 0.28 Bab | 21.34 ± 2.02 BCb | 15.79 ± 3.52 Cb | 15.68 ± 0.81 Cb | |
| ST-group | 44.91 ± 0.92 Ab | 41.87 ± 1.98 Aa | 41.24 ± 8.24 Aa | 51.39 ± 8.47 Aa | 42.42 ± 2.02 Aa | 41.85 ± 7.55 Aa |
| Volatile Flavor Compounds | Groups | 0 d | 1 d | 7 d | 14 d | 21 d | 28 d |
|---|---|---|---|---|---|---|---|
| Pentanal | NF | 7.42 ± 0.85 Db | 24.62 ± 0.82 Cb | 32.24 ± 3.18 Ba | 21.44 ± 2.67 Cb | 31.19 ± 1.55 Ba | 40.94 ± 3.08 Aa |
| SF | 7.29 ± 0.41 Cb | 27.01 ± 1.80 Ba | 34.88 ± 3.03 Aa | 26.00 ± 3.28 Ba | 2.36 ± 0.24 Db | 3.25 ± 0.38 Db | |
| ST | 20.08 ± 2.68 Aa | 4.44 ± 0.57 Cc | 15.93 ± 1.05 Bb | 16.51 ± 1.50 Bc | 1.77 ± 0.10 Db | 2.16 ± 0.32 Db | |
| Hexanal | NF | 146.18 ± 15.29 Cb | 492.83 ± 20.58 Ab | 84.92 ± 7.92 Da | 380.33 ± 38.01 Bb | 18.46 ± 1.22 Ea | 16.23 ± 1.97 Eb |
| SF | 112.24 ± 8.49 Dc | 540.75 ± 21.68 Ba | 662.09 ± 63.30 Aa | 451.44 ± 39.54 Ca | 15.76 ± 1.45 Eb | 18.13 ± 1.78 Eab | |
| ST | 413.27 ± 18.15 Aa | 64.47 ± 2.09 Cc | 272.52 ± 28.61 Bb | 274.21 ± 15.69 Ba | 17.15 ± 2.36 Dab | 19.36 ± 2.01 Da | |
| Heptanal | NF | 25.54 ± 1.63 Cb | 8.44 ± 1.09 Db | 41.82 ± 5.19 Aa | 31.50 ± 3.09 Bb | 5.36 ± 0.58 Db | 4.18 ± 0.36 Db |
| SF | 21.81 ± 1.48 Bc | 40.55 ± 2.82 Aa | 42.22 ± 3.03 Aa | 39.10 ± 6.23 Aa | 4.74 ± 0.65 Cb | 4.78 ± 0.77 Cb | |
| ST | 38.99 ± 2.97 Aa | 9.67 ± 1.10 Cb | 21.46 ± 1.45 Bb | 22.01 ± 1.29 Bc | 7.70 ± 0.52 Ca | 7.57 ± 1.13 Ca | |
| Octanal | NF | 43.54 ± 3.30 Cb | 81.70 ± 4.87 Bb | 106.83 ± 16.95 Aa | 91.79 ± 7.27 Bb | 14.16 ± 2.07 Da | 18.82 ± 2.26 Da |
| SF | 40.62 ± 5.38 Bb | 137.87 ± 20.03 Aa | 125.30 ± 15.41 Aa | 130.46 ± 10.86 Aa | 6.44 ± 0.53 Cb | 8.42 ± 0.87 Cb | |
| ST | 72.43 ± 12.41 Aa | 7.11 ± 1.08 Cc | 51.21 ± 3.38 Bb | 49.14 ± 3.46 Bc | 12.92 ± 1.13 Ca | 9.94 ± 0.79 Cb | |
| Nonanal | NF | 126.47 ± 15.31 Cb | 168.31 ± 17.91 Aa | 158.63 ± 12.55 Ba | 145.30 ± 12.91 Cb | 34.67 ± 1.82 Db | 30.51 ± 3.23 Db |
| SF | 127.41 ± 10.25 Cb | 145.92 ± 15.58 Cb | 165.23 ± 6.47 Ba | 184.53 ± 18.41 Aa | 27.10 ± 3.70 Dc | 30.52 ± 3.48 Db | |
| ST | 167.78 ± 13.44 Aa | 55.53 ± 6.50 Cc | 91.29 ± 10.52 Bb | 94.32 ± 7.34 Bc | 42.44 ± 4.37 Ca | 43.65 ± 3.68 Ca | |
| Benzaldehyde | NF | 60.94 ± 4.13 Cb | 112.34 ± 14.23 Ba | 130.81 ± 15.94 Aa | 99.75 ± 5.07 Bb | 38.25 ± 3.93 Db | 32.26 ± 2.68 Db |
| SF | 36.13 ± 3.74 Bc | 118.83 ± 14.76 Aa | 113.52 ± 5.31 Ab | 115.86 ± 7.56 Aa | 34.12 ± 2.09 Bb | 34.69 ± 4.06 Bb | |
| ST | 97.58 ± 9.94 Aa | 59.12 ± 6.16 Cb | 83.73 ± 5.10 Bc | 85.84 ± 5.34 Bc | 51.45 ± 4.55 Ca | 48.79 ± 6.37 Ca | |
| Tetradecanal | NF | 1.77 ± 0.18 Ec | 4.72 ± 0.40 Db | 7.30 ± 0.62 Ba | 5.72 ± 0.25 Cb | 12.41 ± 0.87 Aa | 6.25 ± 0.55 Cb |
| SF | 6.88 ± 0.48 Ba | 7.42 ± 0.67 Aa | 4.57 ± 0.57 Cb | 7.61 ± 0.52 Aa | 4.98 ± 0.52 Cb | 6.30 ± 0.60 Bb | |
| ST | 1.77 ± 0.18 Db | 5.10 ± 0.66 Cb | 4.56 ± 0.66 Cb | 4.35 ± 0.39 Cc | 12.14 ± 1.54 Aa | 8.81 ± 1.23 Ba | |
| 2-Undecenal | NF | 10.16 ± 1.00 Ca | 55.30 ± 5.80 Bb | 89.24 ± 11.83 Aa | 65.28 ± 6.48 Bb | 2.90 ± 0.27 Ca | 2.36 ± 0.30 Ca |
| SF | 13.65 ± 1.03 Ca | 92.88 ± 8.53 Aa | 77.12 ± 4.86 Bb | 85.07 ± 13.86 Ba | 2.32 ± 0.13 Cb | 2.39 ± 0.33 Ca | |
| ST | 10.01 ± 1.42 Ba | 3.88 ± 0.23 Cc | 18.31 ± 1.68 Ac | 19.21 ± 2.47 Ac | 1.86 ± 0.19 Cc | 1.91 ± 0.20 Cb | |
| 2-Octenal | NF | 45.60 ± 3.01 Db | 168.06 ± 15.66 Bb | 212.57 ± 10.47 Aa | 146.82 ± 10.09 Cb | 12.18 ± 0.70 Ea | 14.16 ± 1.19 Ea |
| SF | 37.79 ± 2.31 Cb | 216.19 ± 22.17 Aa | 222.56 ± 15.11 Aa | 168.40 ± 14.09 Ba | 9.86 ± 0.58 Db | 11.00 ± 1.84 Db | |
| ST | 102.38 ± 9.95 Aa | 18.30 ± 1.21 Cc | 93.61 ± 4.96 Bb | 90.52 ± 8.31 Bc | 8.77 ± 0.67 Cc | 11.58 ± 0.34 Cb | |
| 2-Nonenal | NF | 2.85 ± 0.21 Db | 5.95 ± 0.54 Bb | 7.05 ± 1.08 Ab | 6.01 ± 0.49 Bb | 7.13 ± 0.31 Aa | 4.04 ± 0.17 Ca |
| SF | 2.60 ± 0.29 Db | 10.97 ± 0.88 Ba | 23.27 ± 3.46 Aa | 6.68 ± 0.52 Ca | 1.84 ± 0.28 Db | 3.57 ± 0.26 Db | |
| ST | 6.62 ± 0.68 Ba | 1.49 ± 0.14 Dc | 2.89 ± 0.24 Cc | 2.97 ± 0.28 Cc | 7.44 ± 0.76 Aa | 1.71 ± 0.21 Dc | |
| 2-Decenal | NF | 14.38 ± 0.84 Db | 62.14 ± 3.81 Ca | 117.49 ± 6.83 Aa | 82.98 ± 8.66 Bb | 7.39 ± 0.73 Da | 6.49 ± 0.75 Da |
| SF | 15.83 ± 2.52 Db | 63.46 ± 2.84 Ba | 46.77 ± 4.38 Cb | 99.53 ± 8.95 Aa | 5.14 ± 0.34 Eb | 5.70 ± 0.33 Eb | |
| ST | 38.45 ± 4.53 Aa | 8.19 ± 1.00 Cb | 28.32 ± 1.55 Bc | 29.78 ± 3.33 Bc | 5.79 ± 0.49 Cb | 4.99 ± 0.24 Cb | |
| 2,4-Decadienal | NF | 3.86 ± 0.39 Dc | 15.30 ± 1.79 Cb | 26.54 ± 2.53 Ba | 35.84 ± 4.29 Aa | 28.55 ± 1.54 Bb | 25.66 ± 4.09 Ba |
| SF | 4.73 ± 0.57 Db | 30.18 ± 2.57 Ca | 25.08 ± 2.05 Ca | 31.94 ± 2.91 Ba | 36.25 ± 5.58 Aa | 29.43 ± 2.05 Ca | |
| ST | 9.32 ± 0.39 Aa | 4.52 ± 0.63 Cc | 8.22 ± 0.68 Bb | 7.51 ± 0.43 Bb | 4.56 ± 0.77 Cc | 4.04 ± 0.31 Cb | |
| 2,4-Dodecadienal | NF | 18.98 ± 0.98 Bb | 89.33 ± 7.75 Aa | 53.79 ± 4.28 Ba | 82.05 ± 6.75 Ab | 5.47 ± 0.61 Da | 3.36 ± 0.21 Db |
| SF | 19.27 ± 1.99 Bb | 12.24 ± 1.76 Cb | 11.75 ± 1.50 Cc | 118.49 ± 8.87 Aa | 3.27 ± 0.25 Db | 3.32 ± 0.25 Db | |
| ST | 62.12 ± 2.93 Aa | 9.22 ± 0.84 Cb | 38.86 ± 5.48 Bb | 38.38 ± 4.03 Bc | 5.62 ± 0.75 Ca | 5.11 ± 0.35 Ca | |
| 1-Hexanol | NF | 9.59 ± 0.76 Ba | 3.78 ± 0.38 Db | 11.34 ± 1.07 Aa | 7.47 ± 1.03 Ca | 2.89 ± 0.20 Ea | 2.14 ± 0.19 Ea |
| SF | 2.96 ± 0.10 Cb | 4.40 ± 0.30 Ba | 3.82 ± 0.36 Bb | 5.17 ± 0.44 Ab | 3.08 ± 0.23 Ca | 0.98 ± 0.46 Db | |
| ST | 1.38 ± 0.22 Bc | 2.06 ± 0.34 Ac | 2.12 ± 0.22 Ac | 2.15 ± 0.28 Ac | 2.34 ± 0.31 Ab | 1.39 ± 0.20 Bb | |
| 1-Heptanol | NF | 3.75 ± 0.29 Cc | 19.05 ± 2.20 Bb | 27.14 ± 2.97 Aa | 16.08 ± 1.87 Bb | 3.83 ± 0.43 Ca | 1.76 ± 0.18 Cc |
| SF | 12.06 ± 1.25 Ca | 25.44 ± 2.56 Ba | 23.68 ± 3.67 Ba | 46.03 ± 3.55 Aa | 2.88 ± 0.19 Db | 3.00 ± 0.19 Db | |
| ST | 5.27 ± 1.04 Bb | 17.58 ± 1.56 Ab | 3.30 ± 0.55 Cb | 3.26 ± 0.24 Cc | 3.63 ± 0.37 Ca | 3.99 ± 0.63 Ca | |
| 1-Octanol | NF | 6.35 ± 0.37 Db | 15.24 ± 1.63 Ba | 18.52 ± 2.35 Aa | 12.58 ± 1.73 Cb | 7.13 ± 0.21 Da | 4.78 ± 0.41 Da |
| SF | 6.06 ± 0.66 Cb | 15.99 ± 1.33 Ba | 19.37 ± 1.25 Aa | 15.96 ± 1.71 Ba | 3.28 ± 0.28 Db | 2.44 ± 0.22 Db | |
| ST | 9.88 ± 0.62 Aa | 3.41 ± 0.24 Cb | 7.92 ± 0.93 Bb | 7.83 ± 0.91 Bc | 1.85 ± 0.11 Dc | 1.86 ± 0.19 Dc | |
| 1-Octen-3-ol | NF | 78.13 ± 2.42 Cab | 109.64 ± 6.39 Aa | 89.92 ± 5.07 Ba | 60.79 ± 4.45 Db | 7.96 ± 0.77 Eb | 6.77 ± 0.71 Eb |
| SF | 72.55 ± 4.8 Cb | 91.86 ± 10.26 Ab | 84.32 ± 8.81 Ba | 76.48 ± 4.86 Ca | 10.45 ± 0.67 Da | 10.66 ± 1.05 Da | |
| ST | 85.34 ± 7.21 Aa | 19.50 ± 1.85 Cc | 51.85 ± 3.94 Bb | 47.36 ± 3.87 Bc | 7.31 ± 0.91 Db | 9.31 ± 1.31 Da | |
| Benzaldehyde, 4-(1-methyl lethyl)- | NF | 24.14 ± 2.46 Ab | 15.39 ± 1.17 Bb | 11.68 ± 0.73 Cb | 8.17 ± 1.17 Dc | 7.56 ± 0.35 Db | 6.54 ± 0.58 Dc |
| SF | 31.69 ± 2.50 Ca | 101.55 ± 10.90 Aa | 83.26 ± 11.65 Ba | 16.57 ± 2.12 Da | 15.98 ± 2.35 Da | 15.48 ± 1.19 Da | |
| ST | 15.34 ± 0.66 Bc | 19.08 ± 0.90 Ab | 14.19 ± 0.80 Bb | 13.75 ± 1.24 Bb | 18.45 ± 2.00 Aa | 15.89 ± 1.82 Ba | |
| 2-Heptanone | NF | 2.82 ± 0.16 Db | 6.97 ± 0.65 Aa | 4.99 ± 0.44 Ba | 3.19 ± 0.44 Db | 2.56 ± 0.24 Db | 3.50 ± 0.24 Cb |
| SF | 2.86 ± 0.20 Cb | 6.10 ± 0.86 Aa | 5.45 ± 0.71 Aa | 4.43 ± 0.48 Ba | 2.86 ± 0.19 Cab | 2.62 ± 0.34 Cc | |
| ST | 4.42 ± 0.53 Ba | 3.86 ± 0.55 Cb | 4.16 ± 0.34 Bb | 3.79 ± 0.38 Cab | 3.33 ± 0.45 Ca | 5.51 ± 0.32 Aa | |
| 2-Nonanone | NF | 4.21 ± 0.35 Cb | 10.79 ± 0.40 Ba | 4.37 ± 0.38 Cb | 37.34 ± 3.70 Aa | 3.01 ± 0.31 Ca | 3.64 ± 0.38 Ca |
| SF | 4.73 ± 0.68 Bb | 5.78 ± 0.33 Ab | 5.44 ± 0.32 Aa | 3.86 ± 0.34 Cb | 1.63 ± 0.19 Eb | 2.36 ± 0.27 Db | |
| ST | 13.77 ± 1.44 Aa | 3.70 ± 0.33 Bc | 2.41 ± 0.21 Ca | 2.50 ± 0.15 Cb | 2.46 ± 0.25 Cb | 2.47 ± 0.17 Cb | |
| 2-Tridecanone | NF | 16.31 ± 2.13 Aa | 10.73 ± 1.03 Ca | 11.46 ± 0.89 Ca | 12.15 ± 1.02 Bb | 9.58 ± 0.58 Ca | 9.40 ± 0.94 Ca |
| SF | 17.94 ± 3.11 Aa | 8.72 ± 0.32 Bb | 6.64 ± 0.57 Bb | 17.60 ± 0.69 Aa | 1.76 ± 0.16 Cc | 2.39 ± 0.25 Cb | |
| ST | 3.92 ± 0.28 Ab | 2.60 ± 0.13 Bc | 2.09 ± 0.21 Dc | 2.06 ± 0.18 Dc | 2.65 ± 0.13 Bb | 2.44 ± 0.24 Cb | |
| Ethyl octanoate | NF | 6.89 ± 0.56 Db | 10.40 ± 1.07 Ab | 8.71 ± 0.88 Cb | 7.66 ± 0.76 Db | 10.02 ± 1.00 Ba | 10.05 ± 1.19 Bb |
| SF | 11.31 ± 1.00 Ba | 116.18 ± 9.85 Aa | 106.08 ± 14.01 Aa | 12.17 ± 0.85 Ba | 10.29 ± 0.76 Ba | 12.54 ± 1.65 Ba | |
| ST | 12.36 ± 1.30 Aa | 5.14 ± 0.48 Cb | 3.09 ± 0.29 Bb | 3.13 ± 0.17 Bc | 3.97 ± 0.39 Bb | 6.41 ± 0.62 Bc | |
| Ethyl nonanoate | NF | 5.73 ± 0.51 Bc | 3.77 ± 0.31 Cc | 11.17 ± 0.70 Aa | 5.38 ± 0.36 Bc | 2.25 ± 0.13 Dc | 2.13 ± 0.21 Da |
| SF | 6.73 ± 0.52 Db | 11.74 ± 1.08 Ba | 7.13 ± 1.04 Db | 14.10 ± 1.33 Aa | 7.64 ± 0.60 Db | 9.93 ± 0.81 Ca | |
| ST | 9.42 ± 0.57 Ba | 8.42 ± 0.68 Db | 7.26 ± 0.61 Db | 7.05 ± 0.56 Db | 10.47 ± 1.00 Aa | 8.50 ± 1.18 Cb | |
| Ethyl tridecanoate | NF | 17.15 ± 1.52 Cb | 18.58 ± 2.26 Cb | 23.86 ± 1.31 Ba | 20.60 ± 1.95 Ca | 26.21 ± 2.73 Aa | 22.42 ± 2.48 Ba |
| SF | 30.55 ± 3.33 Aa | 23.34 ± 1.86 Ca | 18.94 ± 0.75 Cb | 22.21 ± 2.14 Ca | 22.84 ± 3.34 Cab | 25.11 ± 3.45 Ba | |
| ST | 14.43 ± 1.02 Cb | 18.26 ± 1.68 Bb | 12.05 ± 1.39 Dc | 12.18 ± 0.85 Db | 20.44 ± 1.18 Bb | 21.20 ± 1.61 Aa | |
| Phenol | NF | 10.92 ± 0.82 Cb | 3.60 ± 0.11 Dc | 67.85 ± 7.38 Aa | 16.75 ± 0.90 Bb | 7.51 ± 0.84 Db | 11.42 ± 1.12 Ca |
| SF | 27.03 ± 2.96 Ba | 15.13 ± 0.90 Cb | 17.51 ± 0.97 Cb | 20.69 ± 2.92 Ca | 69.03 ± 6.81 Aa | 7.31 ± 0.67 Db | |
| ST | 8.49 ± 0.89 Bb | 19.91 ± 2.43 Aa | 5.49 ± 0.75 Cc | 5.61 ± 0.55 Cc | 7.73 ± 0.38 Bb | 5.33 ± 0.88 Cc | |
| D-Limonene | NF | 20.07 ± 2.83 Ab | 16.36 ± 1.69 Cb | 13.27 ± 1.24 Cb | 13.52 ± 1.12 Cb | 18.83 ± 2.10 Bb | 20.61 ± 1.55 Ab |
| SF | 30.01 ± 3.60 Aa | 14.45 ± 0.57 Db | 11.73 ± 0.42 Db | 15.89 ± 0.63 Ca | 23.65 ± 1.49 Ba | 23.32 ± 1.25 Bb | |
| ST | 15.90 ± 1.58 Cb | 28.29 ± 2.23 Aa | 16.29 ± 1.70 Ca | 16.50 ± 2.23 Ca | 22.94 ± 2.51 Ba | 29.50 ± 3.64 Aa | |
| Caryophyllene | NF | 37.72 ± 5.8 Cb | 34.58 ± 3.23 Db | 35.88 ± 1.94 Da | 29.96 ± 2.68 Db | 48.19 ± 5.27 Aa | 44.27 ± 3.31 Bb |
| SF | 69.13 ± 5.06 Aa | 33.70 ± 2.69 Db | 19.17 ± 2.87 Eb | 43.10 ± 4.25 Ca | 32.26 ± 3.37 Db | 51.46 ± 6.40 Ba | |
| ST | 33.36 ± 2.74 Bb | 48.43 ± 5.83 Aa | 21.31 ± 3.01 Cb | 22.20 ± 1.49 Cc | 44.45 ± 4.27 Aa | 49.58 ± 3.63 Aab | |
| 3-Ethyl-2-methyl-1,3-hexadiene | NF | 7.15 ± 0.73 Cb | 21.53 ± 1.69 Aa | 23.63 ± 2.41 Aa | 17.29 ± 1.82 Bb | 16.85 ± 1.64 Bb | 1.99 ± 0.12 Db |
| SF | 7.77 ± 0.35 Cb | 20.54 ± 3.02 Ba | 24.07 ± 3.43 Ba | 20.59 ± 1.98 Ba | 27.28 ± 1.44 Aa | 2.56 ± 0.26 Da | |
| ST | 13.71 ± 1.55 Ba | 12.19 ± 0.60 Bb | 11.67 ± 1.69 Bb | 12.87 ± 1.29 Bc | 14.85 ± 1.06 Ab | 2.54 ± 0.33 Ca | |
| Oxime-, methoxy-phenyl- | NF | 5.15 ± 0.25 Da | 20.62 ± 10.00 Bb | 33.58 ± 5.09 Ab | 19.75 ± 1.10 Bb | 12.80 ± 1.27 Cc | 2.02 ± 0.16 Da |
| SF | 5.48 ± 0.51 Ea | 31.65 ± 3.70 Aa | 20.60 ± 2.20 Bc | 11.00 ± 1.24 Dc | 16.16 ± 0.47 Cb | 2.04 ± 0.30 Fa | |
| ST | 2.47 ± 0.14 Db | 14.82 ± 0.86 Ca | 51.84 ± 10.70 Aa | 48.70 ± 7.11 Aa | 25.12 ± 3.61 Ba | 1.54 ± 0.18 Db | |
| Anethole | NF | 25.04 ± 3.31 Db | 27.23 ± 3.86 Da | 32.26 ± 2.46 Ca | 33.09 ± 2.01 Bb | 31.64 ± 2.35 Cab | 39.78 ± 3.98 Aa |
| SF | 50.17 ± 7.23 Aa | 10.29 ± 1.20 Cb | 6.65 ± 0.65 Cc | 39.67 ± 4.36 Ba | 35.05 ± 2.42 Ba | 37.36 ± 2.72 Ba | |
| ST | 26.89 ± 2.45 Bb | 26.06 ± 1.91 Ba | 17.86 ± 2.10 Cb | 18.89 ± 1.60 Cc | 30.51 ± 2.28 Ab | 27.59 ± 1.38 Bb | |
| Pentadecane | NF | 6.52 ± 0.78 Aa | 4.25 ± 0.39 Ca | 4.17 ± 0.48 Ca | 3.89 ± 0.19 Cb | 5.78 ± 0.85 Bb | 5.33 ± 0.61 Ba |
| SF | 7.30 ± 0.68 Aa | 4.94 ± 0.47 Ca | 4.57 ± 0.24 Ca | 5.13 ± 0.50 Ca | 5.48 ± 0.60 Bb | 5.51 ± 0.43 Ba | |
| ST | 4.50 ± 0.62 Bb | 4.65 ± 0.60 Ba | 3.30 ± 0.33 Cb | 3.54 ± 0.25 Cb | 7.03 ± 0.83 Aa | 5.25 ± 0.31 Ba |
Publisher’s Note: MDPI stays neutral with regard to jurisdictional claims in published maps and institutional affiliations. |
© 2022 by the authors. Licensee MDPI, Basel, Switzerland. This article is an open access article distributed under the terms and conditions of the Creative Commons Attribution (CC BY) license (https://creativecommons.org/licenses/by/4.0/).
Share and Cite
Liu, T.; Zhang, T.; Yang, L.; Zhang, Y.; Kang, L.; Yang, L.; Zhai, Y.; Jin, Y.; Zhao, L.; Duan, Y. Effects of Fermentation on the Physicochemical Properties and Aroma of Lamb Liver Paste. Fermentation 2022, 8, 676. https://doi.org/10.3390/fermentation8120676
Liu T, Zhang T, Yang L, Zhang Y, Kang L, Yang L, Zhai Y, Jin Y, Zhao L, Duan Y. Effects of Fermentation on the Physicochemical Properties and Aroma of Lamb Liver Paste. Fermentation. 2022; 8(12):676. https://doi.org/10.3390/fermentation8120676
Chicago/Turabian StyleLiu, Ting, Taiwu Zhang, Lirong Yang, Yanni Zhang, Letian Kang, Le Yang, Yujia Zhai, Ye Jin, Lihua Zhao, and Yan Duan. 2022. "Effects of Fermentation on the Physicochemical Properties and Aroma of Lamb Liver Paste" Fermentation 8, no. 12: 676. https://doi.org/10.3390/fermentation8120676