Article

Improved Sugar Recovery of Alkaline Pre-Treated Pineapple Leaf Fibres via Enzymatic Hydrolysis and Its Enzymatic Kinetics

by
Noor Idayu Nashiruddin
1,
Noor Hidayah Abd Rahman
1,*,
Roshanida A. Rahman
1,2,*,
Rosli Md. Illias
1,2,
Nazlee Faisal Ghazali
1,
Bassam Abomoelak
3 and
Hesham Ali El Enshasy
1,2,4
1
Faculty of Chemical and Energy Engineering, Universiti Teknologi Malaysia, Skudai 81310, Malaysia
2
Institute of Bioproduct Development, Universiti Teknologi Malaysia, Skudai 81310, Malaysia
3
Arnold Palmer Pediatric Gastroenterology Clinic, Orlando Health, Orlando, FL 32806, USA
4
City of Scientific Research and Technology Applications (SRTA), New Burg Al-Arab, Alexandria 21934, Egypt
*
Authors to whom correspondence should be addressed.
Fermentation 2022, 8(11), 640; https://doi.org/10.3390/fermentation8110640
Submission received: 19 September 2022 / Revised: 1 November 2022 / Accepted: 11 November 2022 / Published: 14 November 2022

Abstract

:
The biofibre complex structure in pineapple leaf fibres (PALFs) can be disrupted using the alkaline pre-treatment method with sodium hydroxide (NaOH). Nonetheless, the pre-treated structures have an impact on the bioconversion of PALFs into sugar. Thus, the impact necessitates precise reaction conditions, which are required for the enzymatic hydrolysis of PALFs. In this study, the Box–Behnken design (BBD) was utilised to achieve maximum sugar yield from PALFs. The optimised enzymatic hydrolysis conditions were 229 µg/mL of cellulase, a reaction temperature of 45 °C, and a hydrolysis time of 69 h. Resultantly, an 84% increase in sugar yield was observed, from 17.26 mg/mL to 108.74 mg/mL after the optimisation process. Moreover, a significant influence (p = 0.0009) of the enzymatic hydrolysis on hydrolysis time and temperature was observed. Additionally, the kinetic study analysis of NaOH pre-treatment and the enzymatic hydrolysis process were investigated. The kinetics of enzyme concentrations on total reducing sugar (TRS) production using an insoluble substrate were investigated based on modified Michaelis–Menten and Chrastil models. The result of the models is in good agreement with the experimental data, as the PALF hydrolysis process was reasonably well predicted. This study provides valuable information for predicting the sugar yield of the PALF bioconversion.

1. Introduction

From 2016 to 2020, Malaysia produced 1505.3 metric tonnes of pineapples, which makes pineapple leaf fibres (PALFs) among the country’s most abundant agricultural waste in the growing pineapple industry [1]. Nevertheless, the abundance of pineapples produces residues, which results in landfilling and environmental issues. Thus, PALF was identified as a promising biomass source candidate for bioproduct conversion in the renewable energy sector. Typically, the bioconversion process of PALF to reduced sugar involves two main steps, which are the pre-treatment and hydrolysis processes. During the alkaline or acid pre-treatment process, the lignocellulosic biomass structure is disrupted, and the polysaccharides are converted to reducing sugar through the hydrolysis process. Although the acid hydrolysis process can be utilised for the pre-treatment step, the enzymatic hydrolysis process was recognised as a more promising approach in multiple biomass conversion processes into sugar [2]. The enzymatic hydrolysis can be completed with no corrosion issues under moderate conditions. Moreover, the process requires less energy, which offers a lower processing cost than acid hydrolysis [3]. Additionally, several studies have reported that enzymatic hydrolysis improves the bioconversion of lignocellulosic material into fermentable sugar by combining the pre-treatment process [4,5,6,7].
Generally, the enzymatic hydrolysis process is difficult to carry out due to the complex structure of lignocellulosic biomass. Therefore, several hydrolytic enzymes are usually required in performing the enzymatic hydrolysis [8,9]. To improve the sugar yield, the optimisation of the enzymatic hydrolysis can be achieved by using a structured procedure, such as the Box–Behnken Design (BBD) as part of the response surface methodology (RSM). The BBD is known as a higher-order regression model that does not contain a fractional factorial embedded within the design. Furthermore, the BBD only requires three levels of each factor. The BBD defines a mid-level between a low and high level of the factors, which reduces an extreme axial point. Moreover, the BBD is preferred over other designs due to the effectiveness of the experimental model as it is interpreted through the number of coefficients divided by the run numbers [10]. In terms of its application, the use of BBD has been applied in rice straw and wheat straw hydrolysis processes to estimate the optimum conditions for enzymatic reactions [6,7].
An important parameter in determining the optimal amount of reducing sugar in the hydrolysis reaction is enzyme loading. The amount of reducing sugar produced can be enhanced by applying a relatively high enzyme concentration. Despite that, the continuous increase in enzyme dosage does not always significantly increase sugar production. Qi et al. reported that when cellulase concentrations of 10 and 30 FPU/g substrates were used, the reducing sugar yield amounts were 72.65% and 90.94%, respectively [7]. Nonetheless, the continuous increase of the cellulase concentration to 50 FPU/g exhibits a plateau trend in the amount of sugar yield (90.07%). Hence, the enzyme loading process in the enzymatic hydrolysis reaction should be optimised to obtain the maximum yield of reducing sugar.
Another parameter that influences enzymatic activity during the hydrolysis process is temperature. One reported work reveals that the optimal temperature of cellulase to hydrolyse the substrate in an enzymatic hydrolysis process was between 40 and 50 °C [8]. According to several studies, the optimum temperature between 43 and 45 °C produces the highest reducing sugar yield in the enzymatic hydrolysis of lignocellulosic biomass [4,11]. Interestingly, in another study, the amount of the reducing sugar continued to increase when the temperature rose to 60 °C [10]. Thermal inactivation caused by an increase in temperature for a certain period can eventually influence the efficiency of enzymatic hydrolysis [12]. The temperatures ranging from 40 to 60 °C were identified as contributing to the high reducing sugar production. However, the production of reducing sugar also depends on the source of the enzymes, whether the enzyme is mesophilic or thermophilic.
Hydrolysis time also has a considerable effect on the enzymatic hydrolysis process. Particularly, the hydrolysis time allows substrates to be completely converted into their products. The two main aspects that influence the hydrolysis rate are enzymatic activity and substrate accessibility. In previous studies, the increment in hydrolysis yield was observed for wheat straw and narrow-leaf cattail at 24 h and 72 h, respectively. On the contrary, when the hydrolysis time was extended to 96 h, the yield amount decreased [7,13]. Other similar findings were also investigated in the relation to the effect of hydrolysis time. For example, the conversion of potato peel residues and sweet sorghum bagasse was at the optimum level after 48 h of reaction [4,14]. Meanwhile, the hydrolysis reactions of Cistus ladanifer and Cytisus striatus reported the highest reducing sugar yield after 72 h of reaction [10].
A high conversion rate is an important aspect that should be highlighted during the conversion of polysaccharides into monomeric sugar. Hence, the understanding of hydrolysis kinetics is essential in determining the mechanism of the bioconversion process. The bioconversion of polysaccharides may face a difficult issue if the hydrolysis reaction occurs heterogeneously between soluble enzymes and insoluble substrates. Factors that cause the modelling of the enzymatic hydrolysis process to be difficult include the activity of enzymes, enzyme-substrate interaction, and substrate complexity [15]. Thus, an improvised classical Michaelis–Menten (MM) model can be utilised. The MM model determines the initial reaction velocity (v0) as a function of initial enzyme loading (E0) rather than substrate concentration [16]. The enzymatic kinetic property of the heterogenous system has been studied by several researchers using the modified MM model in the bioconversion process of cellulose from corn stover, sugarcane, and wheat straw [17,18,19]. Moreover, the modified MM model should be applied if the enzymatic hydrolysis is a diffusion-limited type process as it depends on the heterogenous rate-limiting reaction of the substrate-enzyme complex [18]. Additionally, the Chrastil model is a diffusion-limited type of process. The model is used to determine additional structural and kinetic characteristics of a heterogeneous reaction system. Particularly, the Chrastil kinetic model investigates the dependence of enzymatic reactions on the heterogenous rate-limiting factors such as adsorption and diffusion processes [15].
The optimisation of reducing sugar production from the hydrolysis of PALF hydrolysate is crucial because it has potential as a prebiotic for improving probiotic growth [20] and as a precursor for biofuel production via fermentation of pineapple leaf lignocellulosic hydrolysate [21]. In this study, the optimum operating conditions were determined for the bioconversion of the pre-treated PALFs into reducing sugar. The influence of enzyme concentration, temperature, and hydrolysis time on the reducing sugar yield was studied using BBD. The optimised conditions that were developed for the bioconversion of PALFs greatly improved the TRS yield. Then, the pre-treated PALF hydrolysis reaction kinetics were evaluated using different initial enzyme concentrations. The improvised models of classical MM and the Chrastil model proposed for the diffusion-limited enzymatic reaction were employed and evaluated to analyse the experimental data.

2. Materials and Methods

2.1. Sample Preparation Process

Pineapple leaves were obtained from the Pineapple Cannery of Malaysia Sdn. Bhd., Malaysia. The pineapple leaves were hard-pressed using a two-roll mill machine to eliminate the water content of around 90%. The PALFs were physically separated from the semi-dried leaves. Next, the PALFs were thoroughly rinsed with water. They were dried in an oven for 24 h at 105 °C until reaching a steady weight value. The PALF was cut into smaller sizes and ground using a mortar and pestle. Then, the sample was stored in a dry place for further analysis. The composition of the PALF was investigated using the technique proposed by Nashiruddin et al. [22]. According to the composition analysis, the contents of cellulose, hemicellulose, and lignin in the PALF were 72.76 ± 0.01, 17.15 ± 0.04, and 4.76 ± 0.02% (w/w). From these components, the monosaccharides present in the PALF biomass were glucose from the cellulose part, xylose, arabinose, and D-glucuronic acid from the hemicellulose part. The enzyme used for the enzymatic hydrolysis process was fungal cellulase from the Aspergillus species (C2605), which was purchased from Sigma-Aldrich (Merck, Darmstadt, Germany). All chemicals used in this study were of pure and analytical grade.

2.2. Alkaline Pre-Treatment Process

The PALFs were pre-treated using an alkaline pre-treatment method, according to our previous report [22]. The 1% (w/v) PALF samples were soaked in a 2.43% (w/v) sodium hydroxide (NaOH) solution in a 250-mL beaker. The samples were treated for 57.15 min at 87 °C with shaking at 100 rpm. Subsequently, they were neutralised and thoroughly rinsed with distilled water. The pH solution of the samples was measured using a pH metre (Mettler Toledo, Columbus, OH, USA) to confirm it reached a neutral pH of 7. The samples were then air-dried in a 60 °C oven until they reached their constant weight and were stored properly.

2.3. Optimisation of Enzymatic Hydrolysis Operating Parameters

The 10% (w/v) pre-treated PALFs were dissolved in a 0.05 M sodium acetate buffer (pH 4.8) containing various enzyme loading per g of PALF (15 to 25 µg/g). An incubator shaker was used to incubate the enzymatic mixture for 24 to 72 h. The process was carried out at 155 rpm using different temperatures (40 to 60 °C). Then, 5 mL were taken from each sample at 24-h intervals to determine the TRS content.
The BBD from Design Expert Software 6.0.4 (Stat-Ease Inc., Minneapolis, MN, USA) was used to establish the optimum enzymatic hydrolysis conditions. The operating ranges for enzyme loading per g of PALF (15 to 25 µg/g), hydrolysis times (24 to 72 h), and temperatures (40 to 60 °C) were determined for the enzymatic hydrolysis optimisation process. Subsequently, the parameters were studied at low (−1), centre (0), and high (1) levels. By equating the reducing sugar yield as an output with independent variables (enzyme loading, temperature, and hydrolysis time), a statistical model can be obtained as follows Equation (1):
Y i = β o + β i x i + β i i x i 2 + β i j x i x j
where Y i is the dependent variable, β o , β i , β i i , and β i j are the regression coefficients, x i is the independent variable i , and x j is the independent variable j .
The experiments were performed for 17 runs, as shown in Table 1. The relationship between the coded values and actual values is described according to Equation (2):
x i = X i X i 0 / X i  
where x i is the independent variable of the coded value, X i   is the independent variable actual of the value, X i 0 is the independent variable of the actual value at the centre point, and X i is the step change value.
The analysis of variance (ANOVA) and lack of fit (LOF) presented in Table 2 were used to estimate the statistical parameters. The regression analysis of the data obtained for studying TRS yield optimisation resulted in the following second-order polynomial model (Equation (3)):
Y = 93.40 + 4.57 X 1 4.97 X 2 + 6.74 X 3 1.30 X 1 2 9.88 X 2 2 1.55 X 3 2 2.88 X 1 X 2 + 2.74 X 2 X 3 7.70 X 2 X 3 2.23 X 1 2 X 2 4.66 X 1 X 2 2

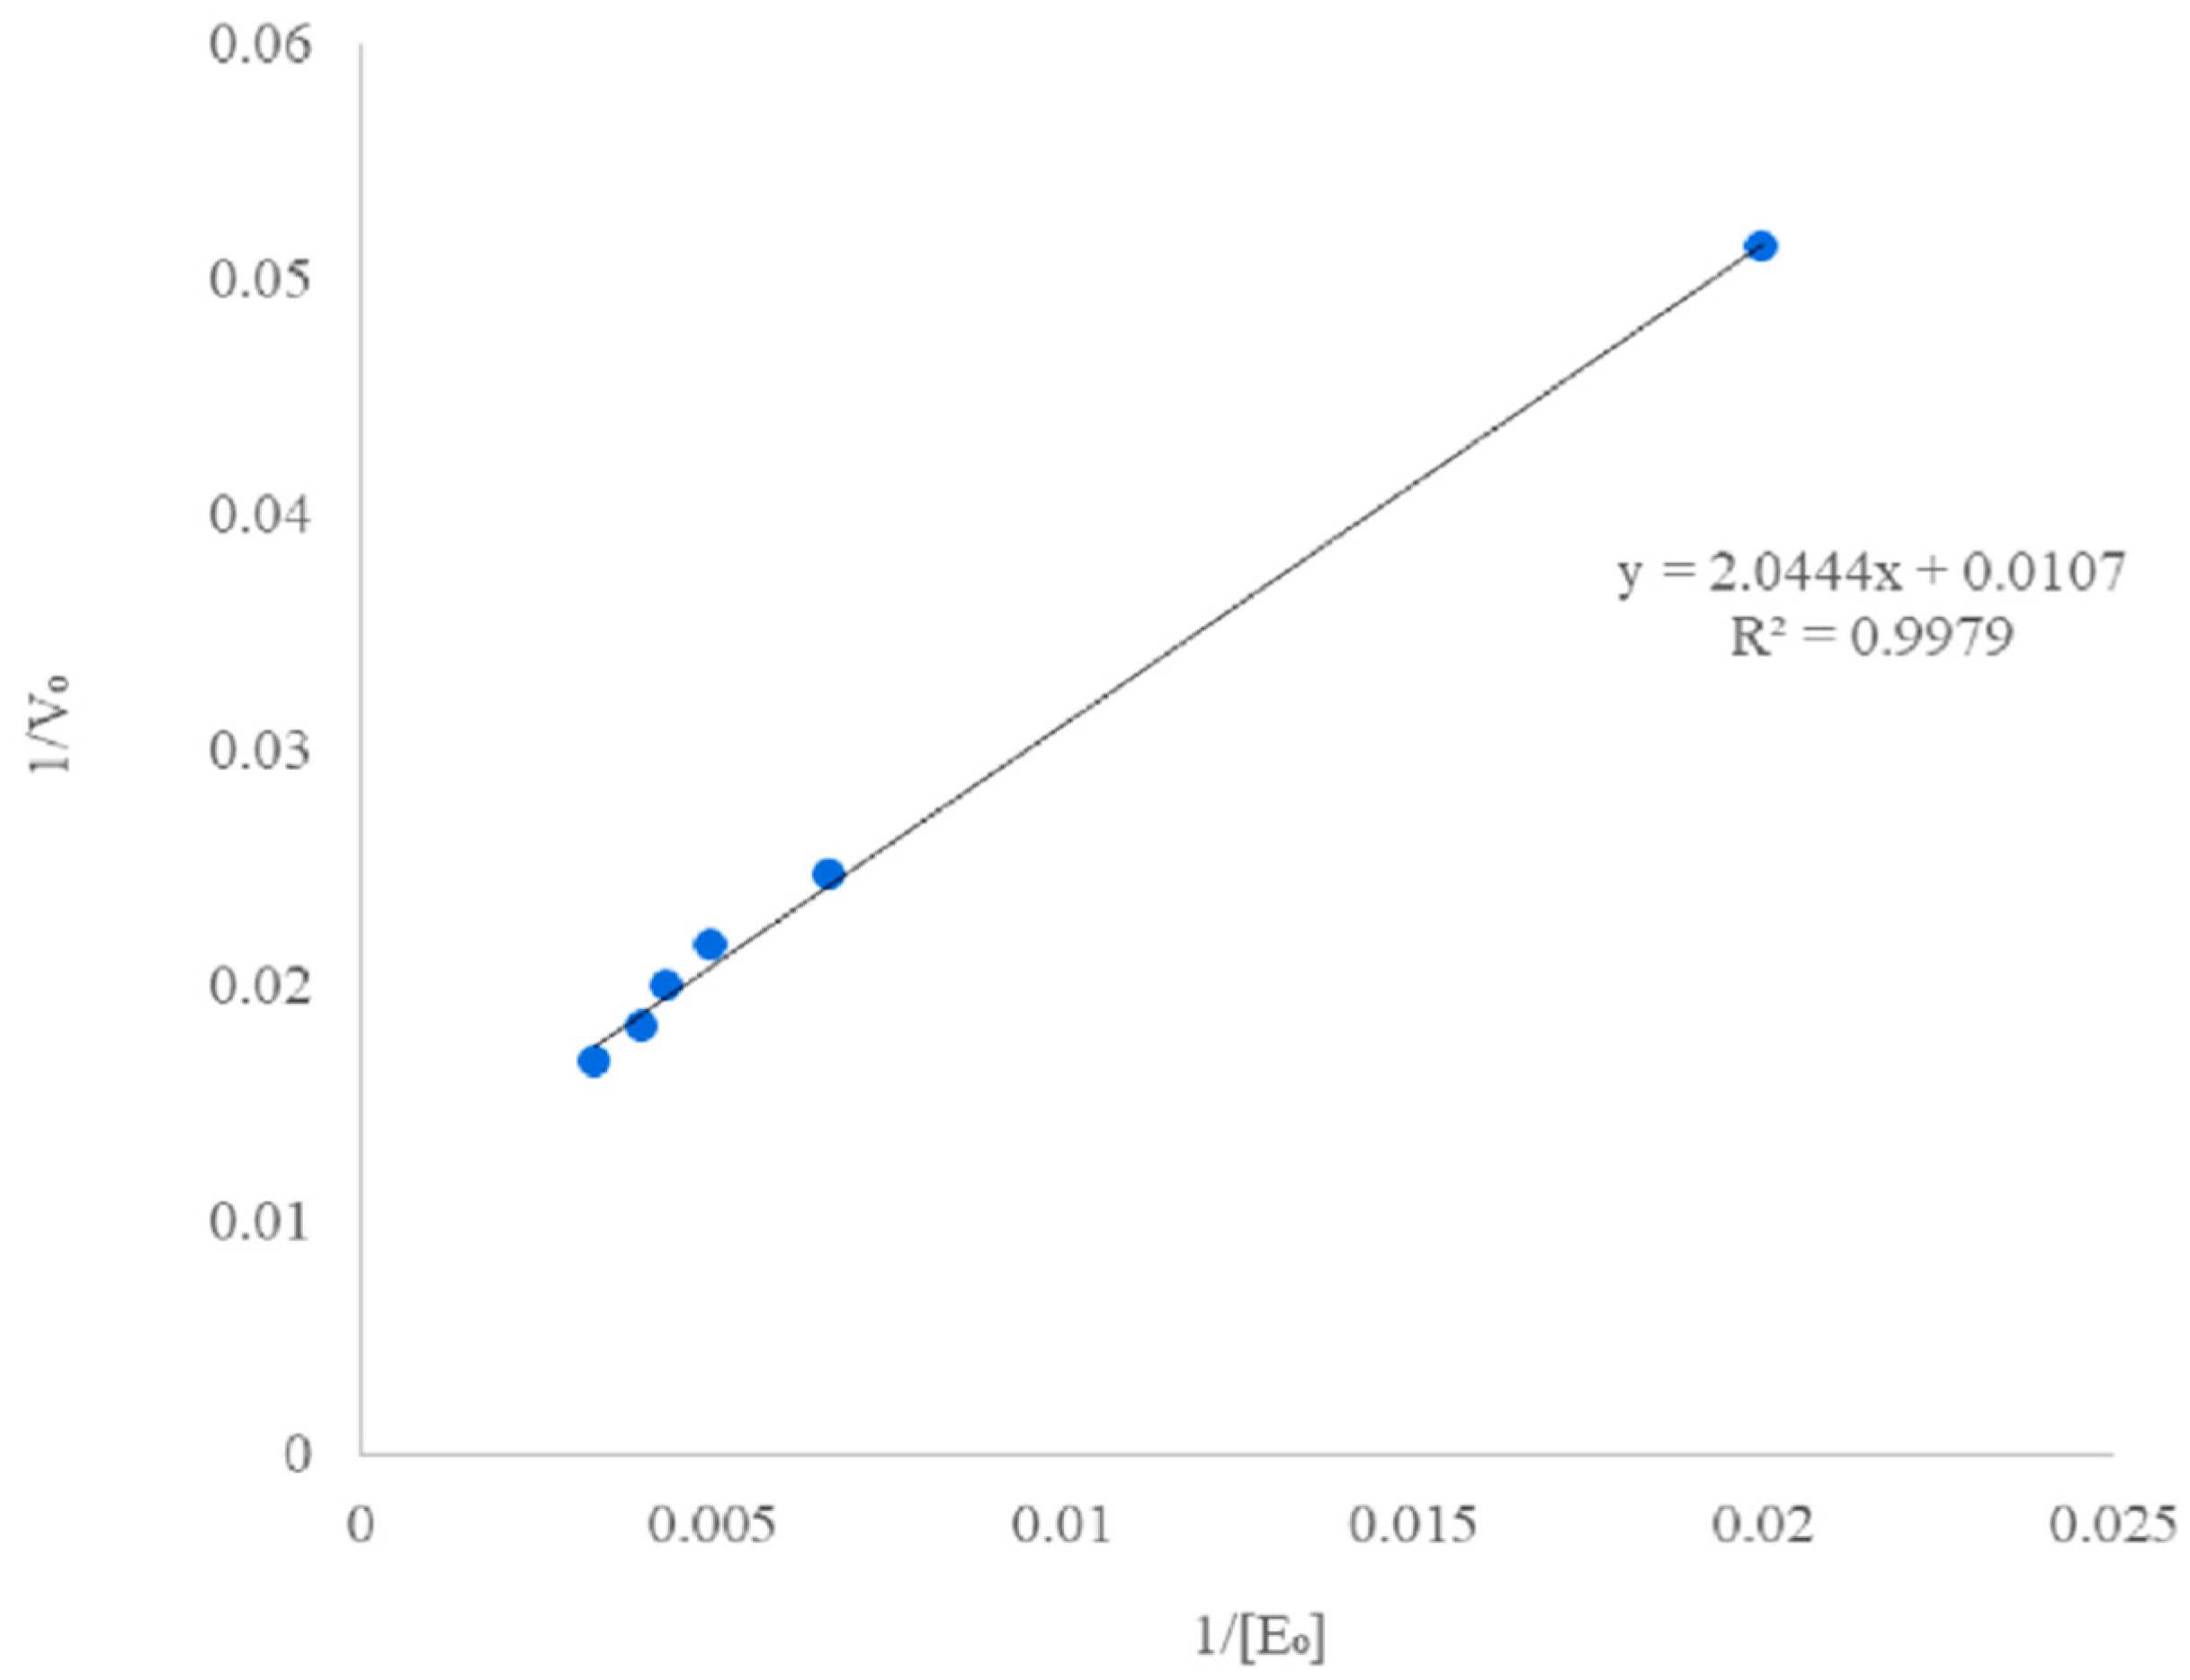
2.4. Kinetics Study of Enzymatic Reactions

The enzymatic hydrolysis reaction was conducted using various concentrations of the enzyme, as reported by Carillo et al. [17]. The pre-treated PALF were hydrolysed in a 0.05 M sodium acetate buffer (pH 4.8) with different enzyme loadings per g of PALF (0.5, 15.0, 20.0, 22.9 (from enzymatic hydrolysis optimisation), 25.0, and 30.0 µg/g). They were incubated in an incubator shaker at 155 rpm for 72 h at 45 °C. The experiments were run in triplicate, and the hydrolysis rates were calculated from the product formation curve.

2.5. Quantification of Total Reducing Sugar (TRS)

The response variable from the optimisation of enzymatic hydrolysis was the TRS concentration. After PALF hydrolysis using cellulase, 3 mL of the sample reaction was taken out at different time intervals. The enzyme mixture was boiled for 10 min to deactivate the enzyme activity. The TRS amount produced from the enzymatic hydrolysis was determined using the 3,5-dinitrosalicylic acid (DNS) procedure [23,24] with glucose as the standard. The specific sugar detected from the hydrolysis of PALF in this study is glucose. An equal amount (1 mL) of sample reaction and DNS reagent was mixed and boiled for 5 min at boiling water (>100 °C). The absorption of the reaction mixture was determined at 575 nm using a spectrometer.

2.6. Kinetics Modelling: Estimation of the Parameters

A modified Michaelis–Menten model was applied in this study as we used PALF as a heterogenous substrate and cellulase as a soluble enzyme. The substrate turnover rate at maximum enzyme saturation (Vemax) and the half-saturation constant (Ke) were determined by performing a linear regression analysis on the experimental data using Equation (4):
v 0 = V e m a x E 0 K e + E 0
where v0 is the initial hydrolysis velocity, Vemax is the maximum velocity at the initial concentration of adsorption sites on the substrate, and Ke is the half-saturation constant for that initial concentration.
The TRS amount at 60 min was chosen as an estimation value. The estimation value was carried out as vo is undefined when t→0 (division by zero) [17]. Non-linear regression analysis was used to define the model variables, which were derived from experimental production curves based on Equation (5):
P = P [ 1 exp k E 0 t ] n
where P and P are the products at time t and at equilibrium, respectively. In Fick’s law, is the rate constant that changes with the diffusion coefficient, E0 is the initial enzyme concentration, and n is a structural diffusion resistance constant. The parameter n represents the characteristics of the reaction order.
If the system has low diffusion resistance, then n tends to approach unity. On the other hand, when the system is constrained by diffusion resistance, n tends to be small (n = 0.5 to 0.6) [20].

3. Results

3.1. Optimisation of the Enzymatic Hydrolysis Process

The parameters that influence reducing sugar production were analysed using BBD. The data obtained for enzymatic hydrolysis are summarised in Table 3. The enzyme loading was adjusted between 15.0 and 25.0 µg/g. The temperature was varied between 40 and 60 °C, while the hydrolysis time was varied from 24 to 72 h. The analysis of variance (ANOVA) was utilised to examine the adequacy of the developed model (Table 2).

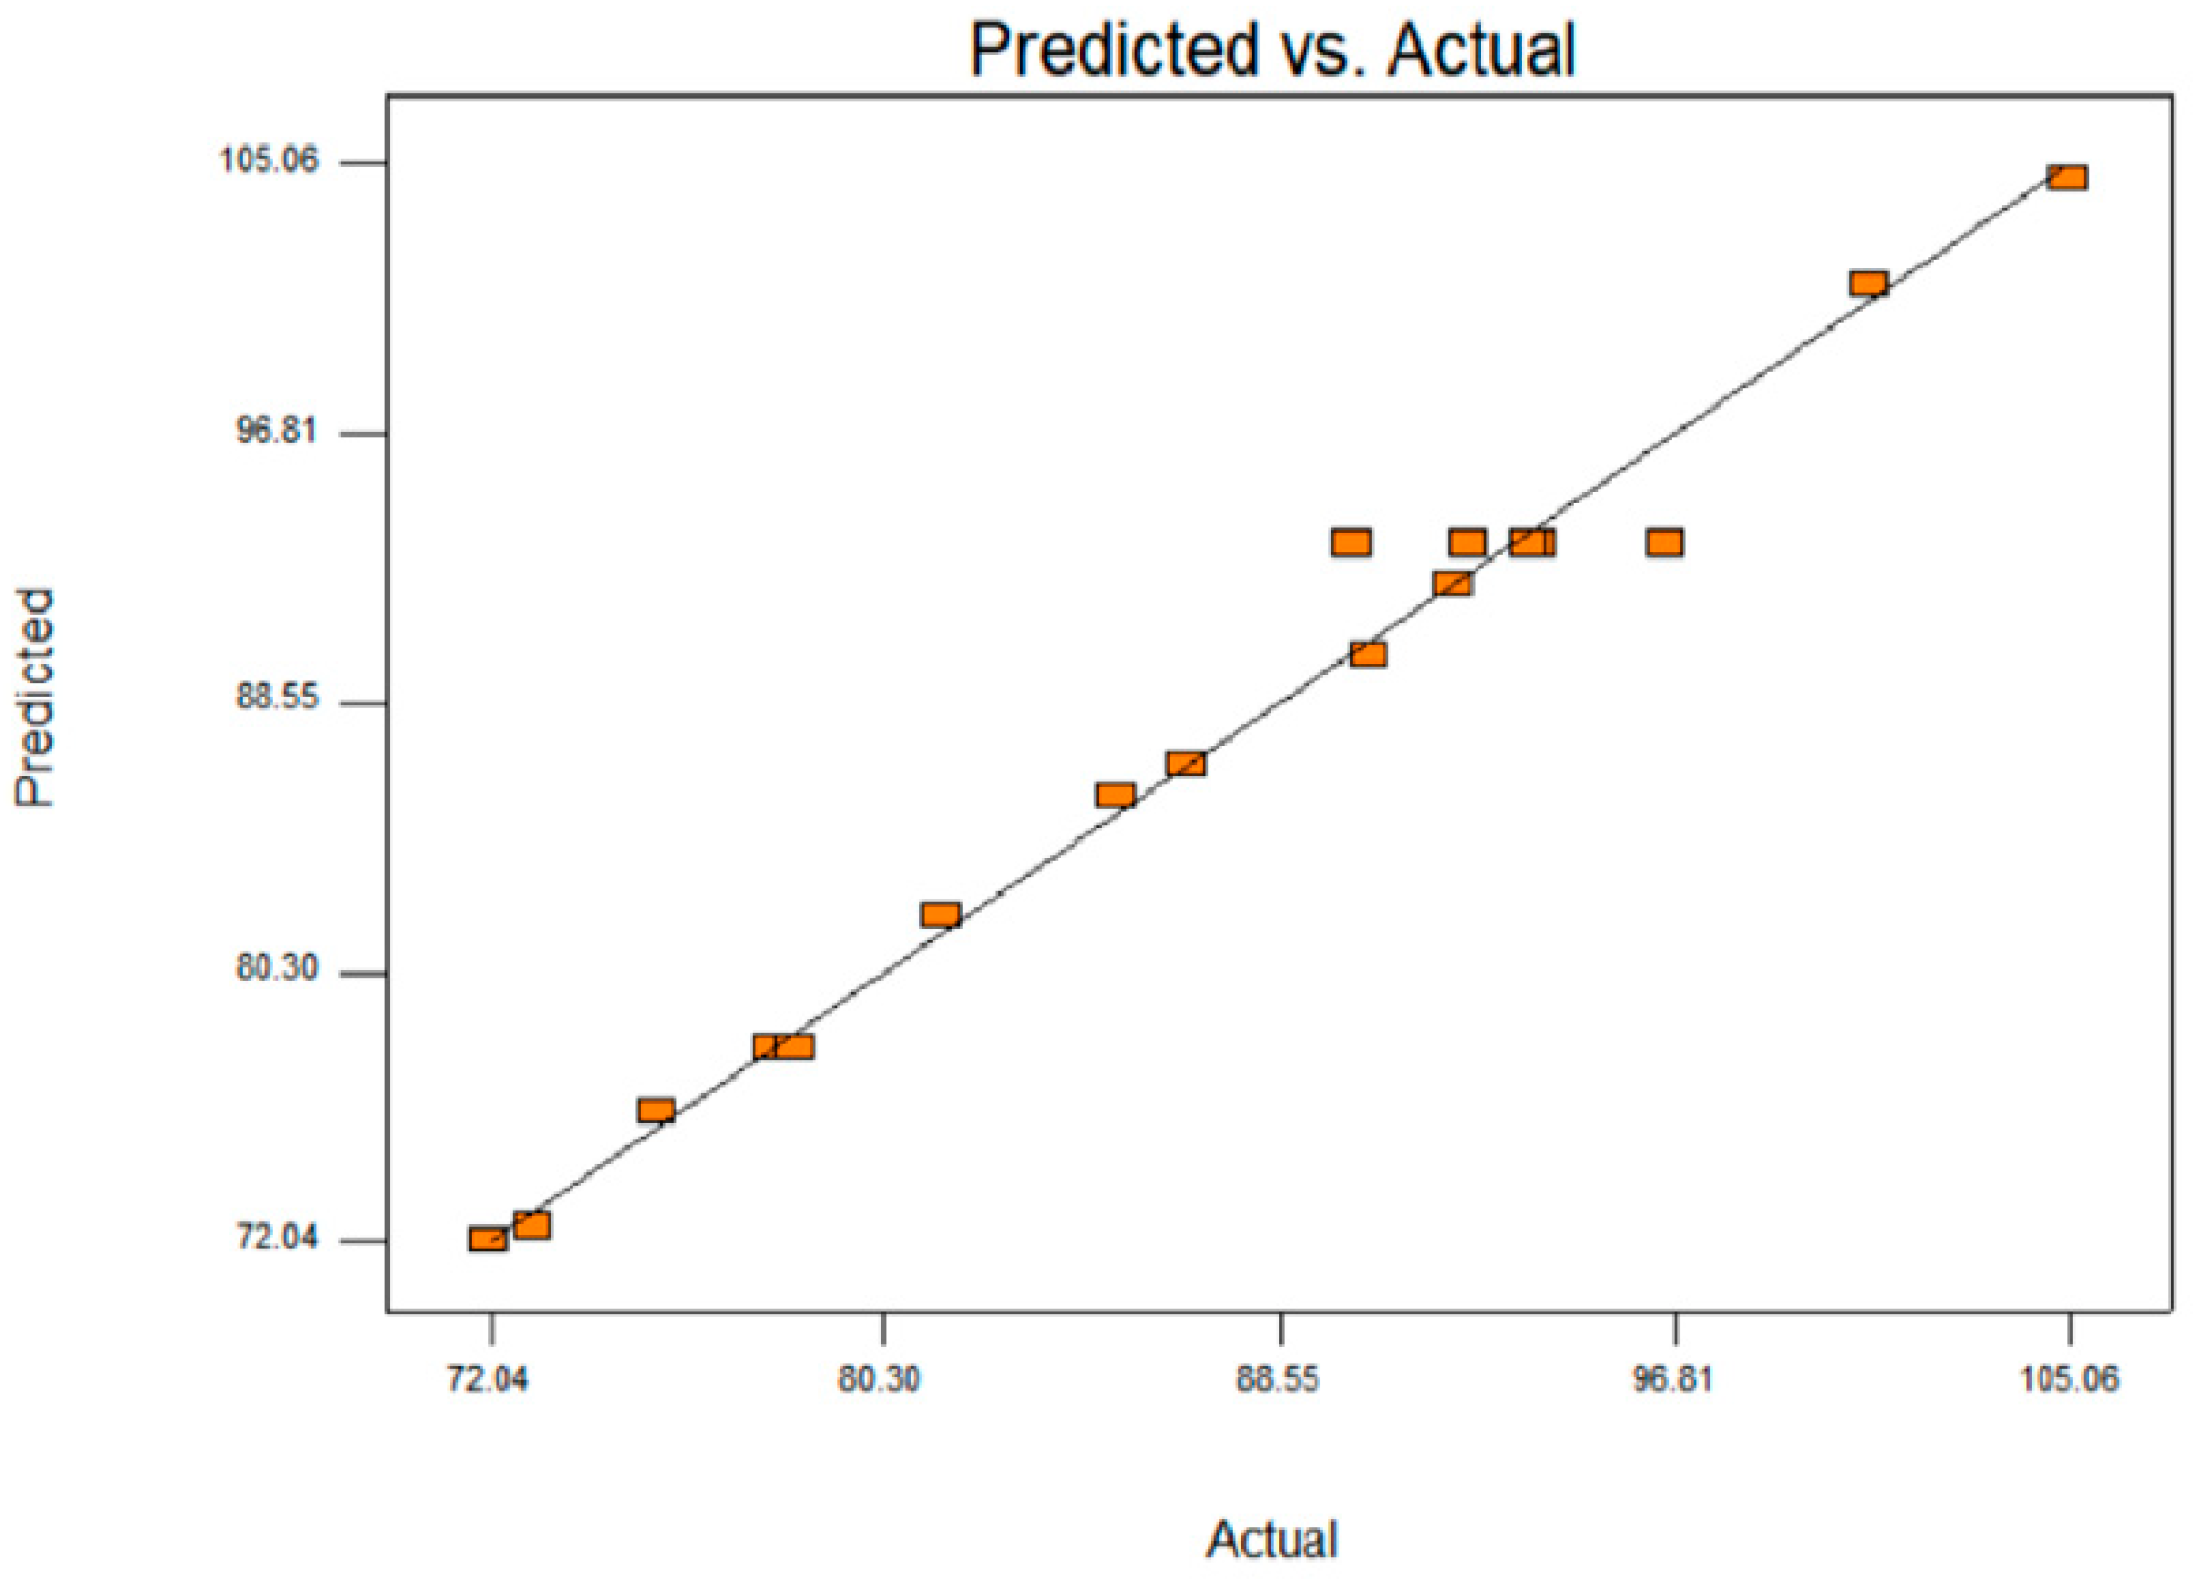
3.2. ANOVA and Statistical Data Analysis

As shown in Table 3, the ANOVA analysis was performed to determine the influence of the variables and interactions among all the independent variables. The results of the ANOVA analysis consist of 17 cycles obtained from Table 2. The F value calculated for the model was 27.82, with a prob > F value of 0.0009. The results indicate that the model terms are statistically significant. Subsequently, the accuracy of the model was checked using the coefficient of determination, R2. The R2 value calculated for the reducing sugar yield was 0.98, which represents 98% of the variability in the response. Therefore, the high value of R2 reveals that the experimental and projected data are highly correlated. Additionally, the expected versus actual data for TRS was depicted in Figure 1.
Next, the lack-of-fit (LOF) test was estimated to be insignificant to ensure that the developed model satisfactorily fits the data. As shown in Table 2, the results of the LOF test for all the responses were insignificant. The prob > F value obtained was 0.6057 (p > 0.05), which reveals the significance of the correlation between all the variables and responses. Table 2 presents the p values of each variable, which suggests that all three variables (enzyme loading (X1), temperature (X2), and time (X3)) produce a significant (p < 0.05) influence on TRS yield amount. Furthermore, the interaction of X22, X1 X2, X2X3, and X1X22 significantly affects the amount of TRS yield.
From Equation (3), the X1X2, X2X3, X12X2, and X1X22 interactions have negative values. Hence, the negative values suggest that a maximum TRS yield was observed at the centre point. Moreover, if one of the variables increases while the others decrease above the centre point, the reducing sugar yield amount will not be affected. The negative values observed in the regression coefficient for the square terms (X12, X22, X32) indicate that the optimum response at the centre level decreases the TRS yield amount. The occurrence of this observation could be due to the increase or decrease of parameter levels from the centre points.

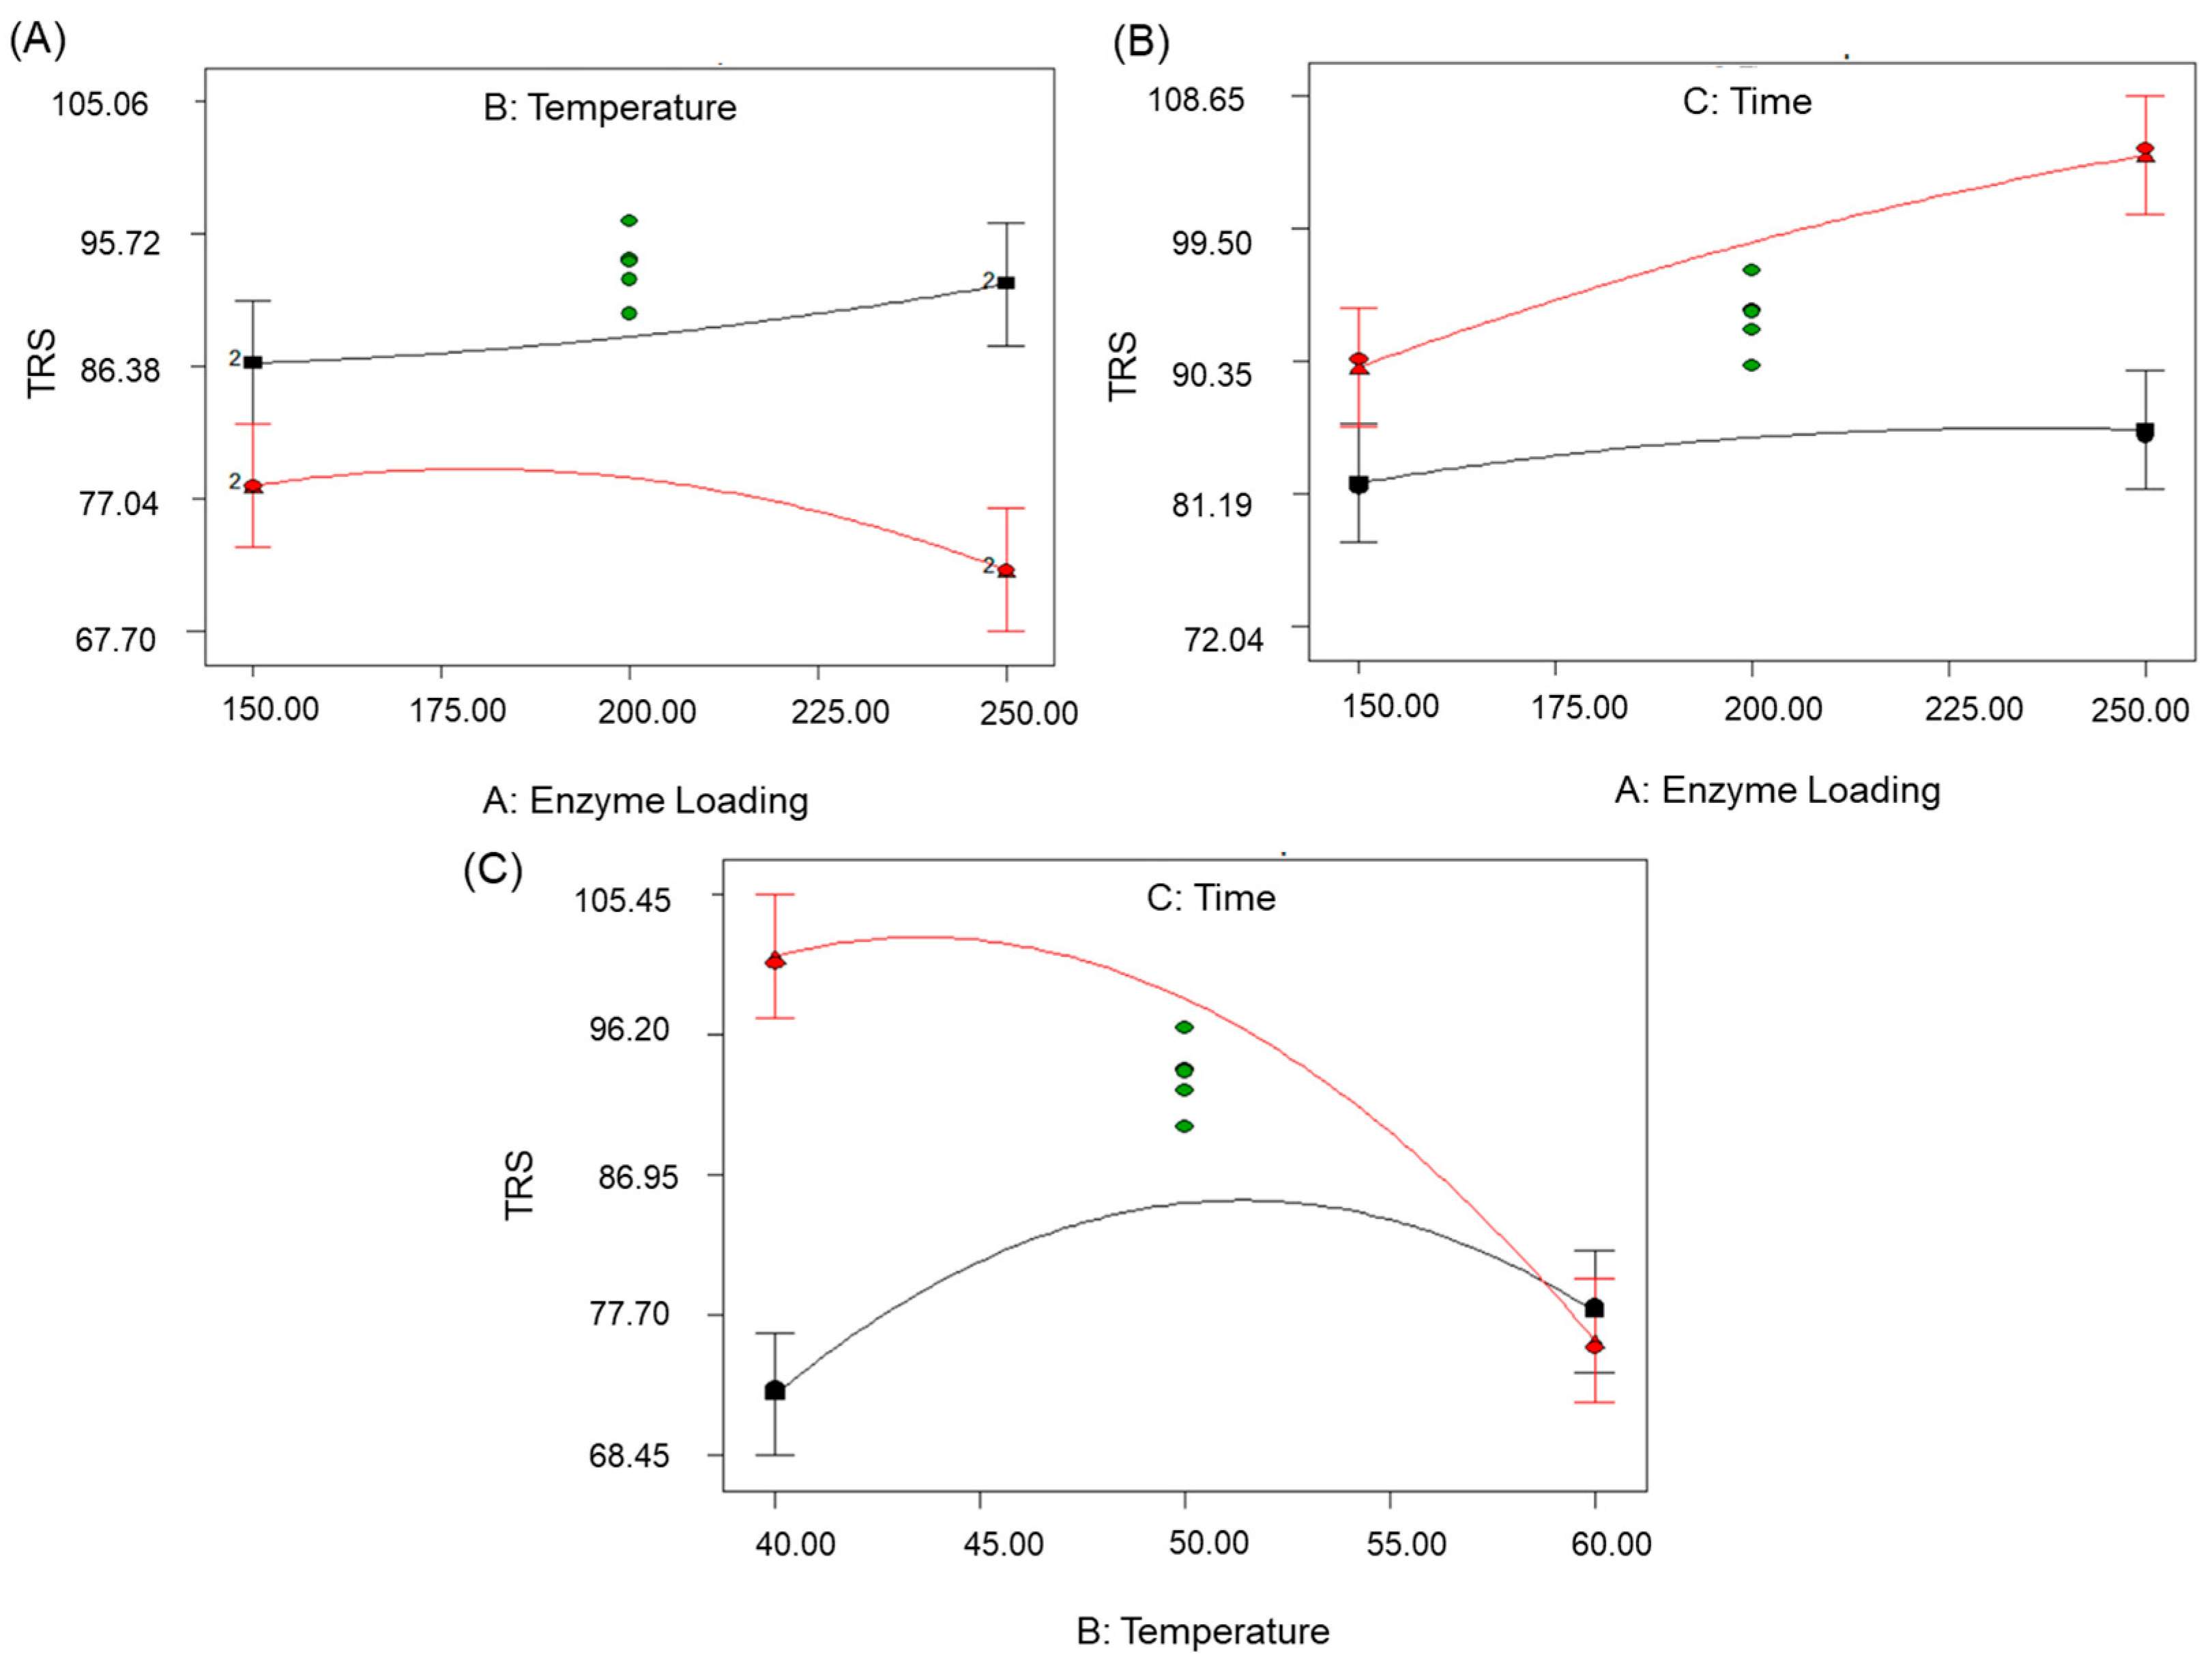
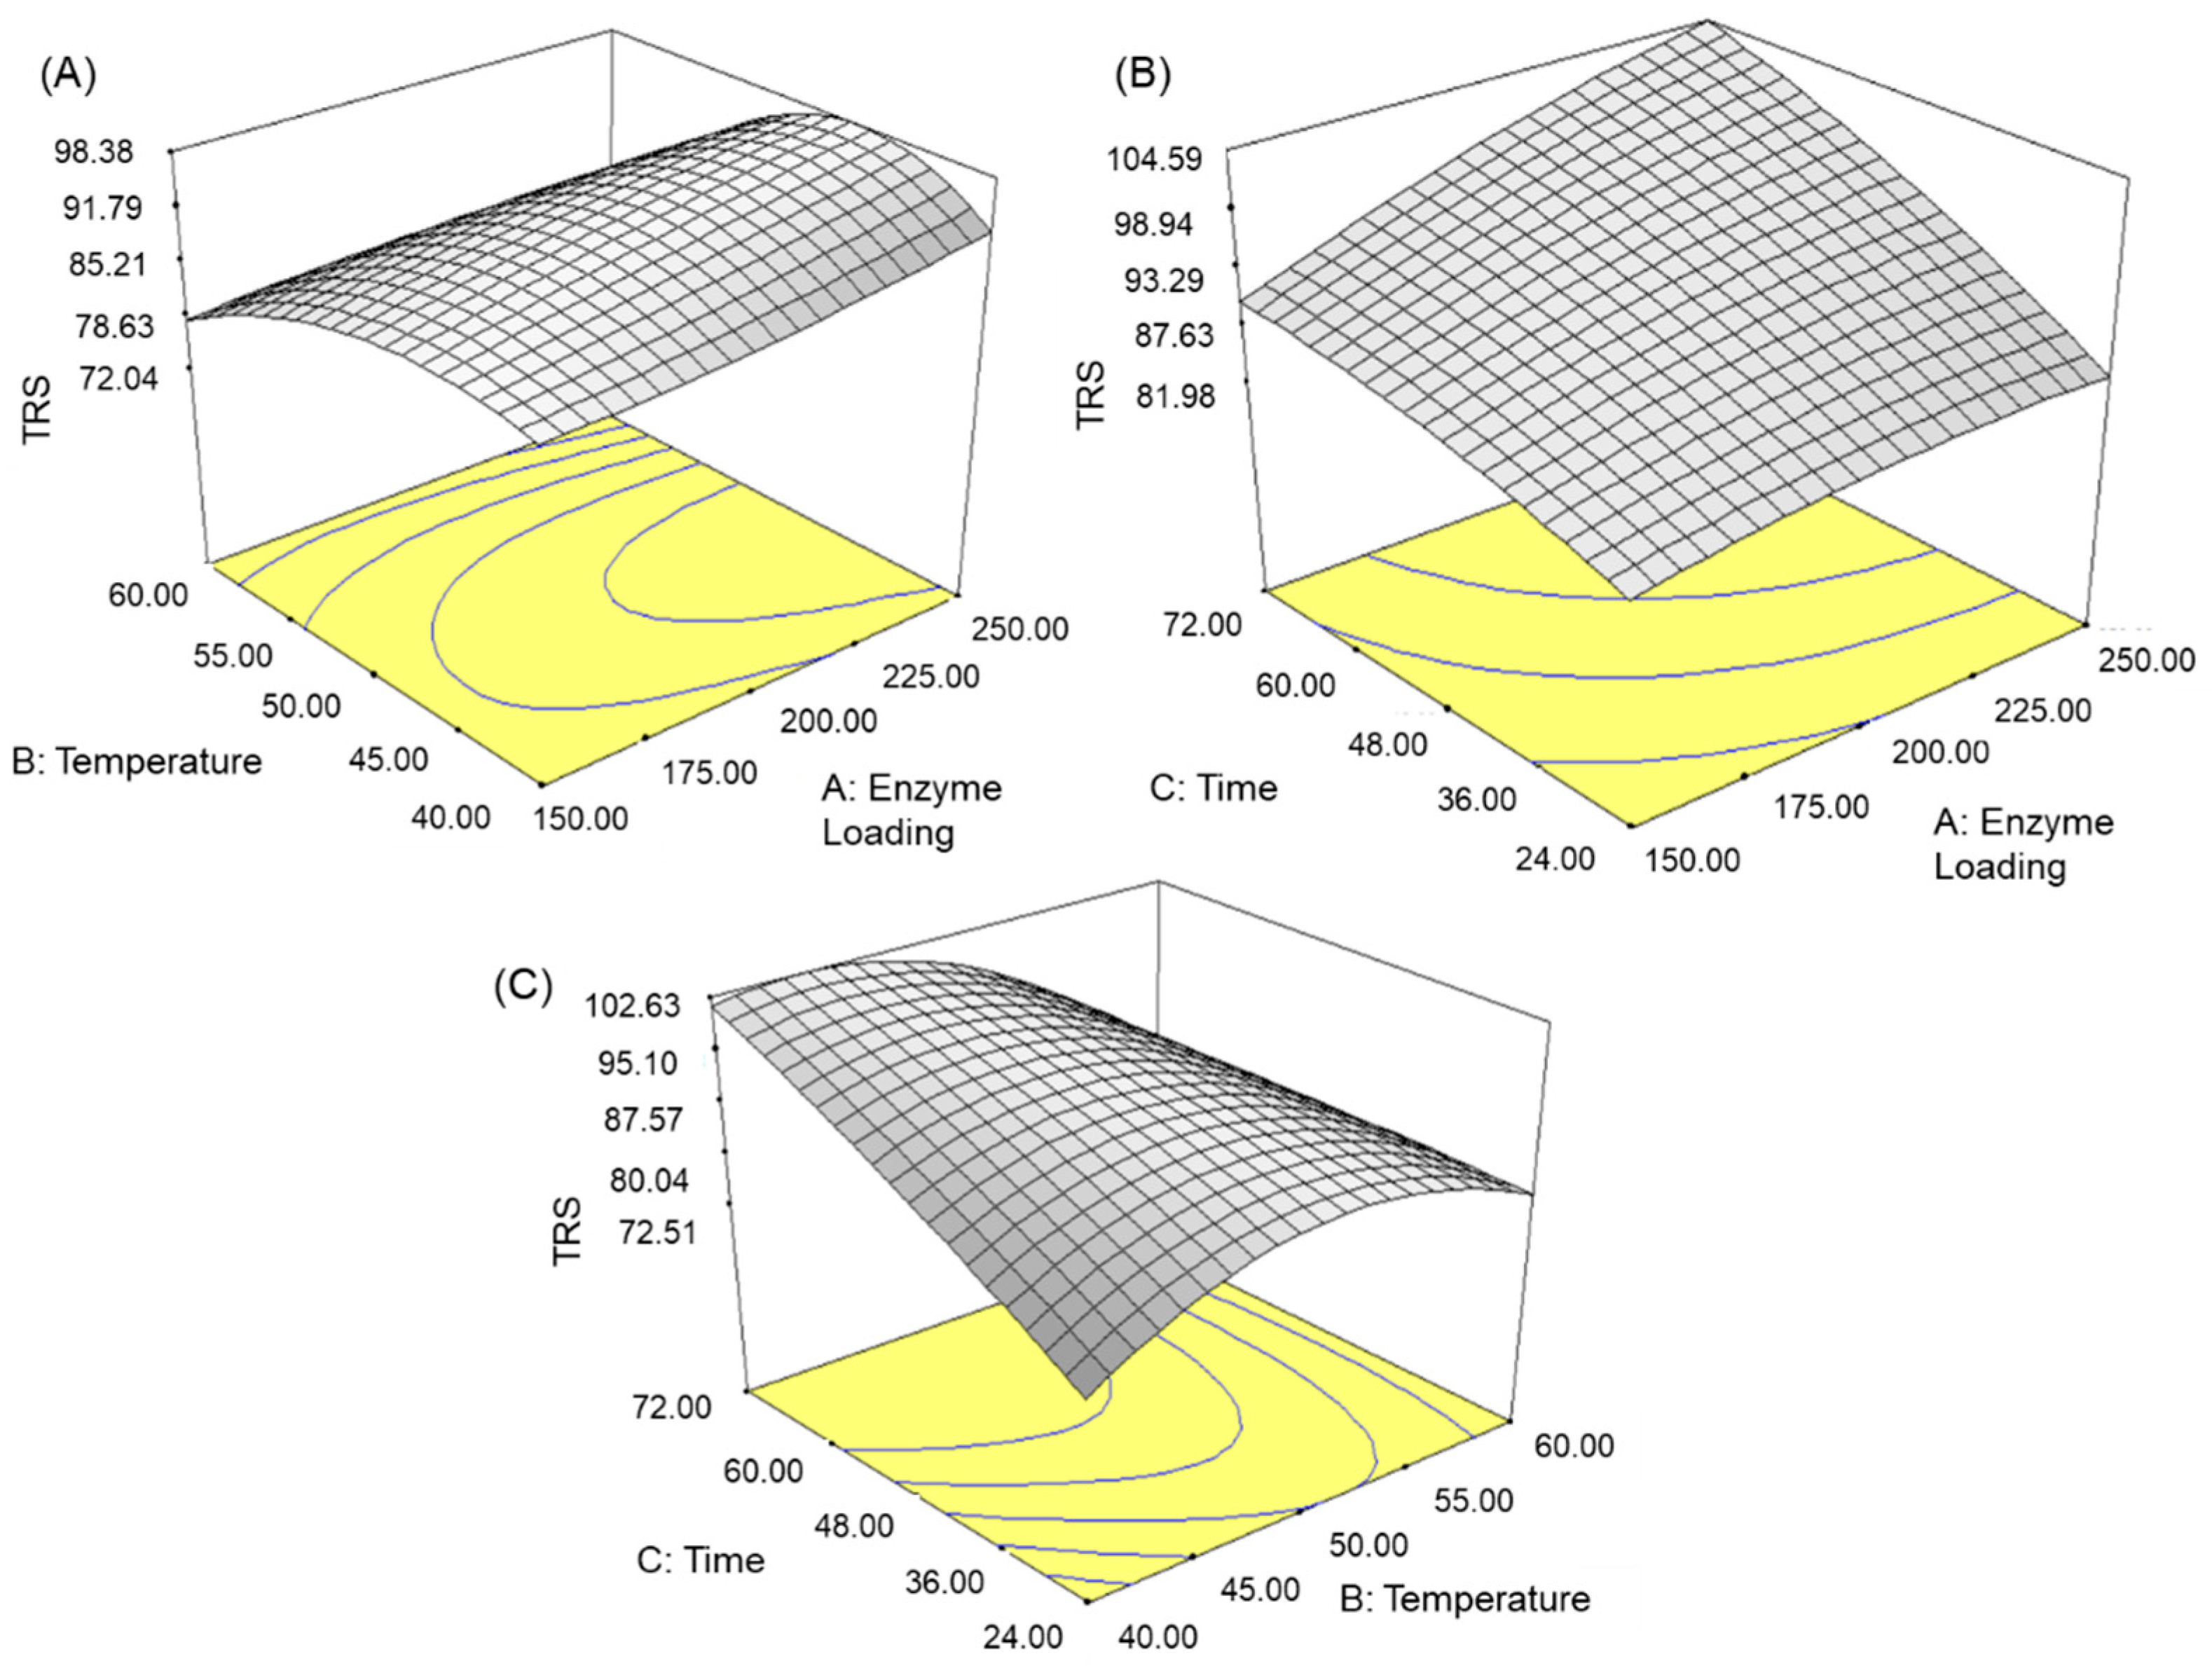
3.3. Effect of Variables on TRS Yield

The study on the correlations between response and independent variables was visualised using interactive graphs and 3D response plots. The graphs were plotted based on the relationships between two independent variables, while another parameter remained constant under optimum conditions.
Figure 2 and Figure 3 illustrate the interactions of enzyme loading, hydrolysis time, and temperature on the TRS yield. In Figure 2C, the interaction of the two parameters, hydrolysis time and temperature, at the centre point of 20.0 µg/g enzyme loading was depicted. On the contrary, Figure 2A,B does not exhibit any interaction of the enzyme loading with the temperature and time of 48 h and 50 °C at the centre point, respectively. Meanwhile, Figure 3A reveals a higher TRS yield amount based on the higher enzyme activity (up to 22.5 µg/g), the temperature at around 45 °C, and the hydrolysis time of 60 h. In Figure 3B and Figure 3C, they indicate that the prolonged hydrolysis time of 72 h had less of an effect on the TRS yield amount in the enzymatic hydrolysis process. The effect on the TRS yield amount was noticed to be smaller when the temperature was increased to 40 °C and the enzyme loading was lower (<15.0 µg/g). From the interactive level of the ANOVA test (Table 2), the interactions of X1X2 and X2X3 were significant. Hence, the results imply that the interactions between (i) enzyme loading and temperature and (ii) temperature and time may have a substantial effect on the amount of TRS yield. For the interaction of X1X3, it was observed to be insignificant. Nonetheless, this factor cannot be fully eliminated from the model hierarchy.
In Figure 3A, increased enzyme loading was observed to greatly improve cellulose conversion at the optimum temperature (>45 °C). On the other hand, Figure 3C illustrates that the cellulose conversion ratio improves with the extended hydrolysis time at the optimum temperature of more than 45 °C. Additionally, the figure reveals that the TRS yield was considerably affected by the interaction between temperature and time. The influence factors on the TRS yield were proven through the interaction between these two variables in Figure 2C and the p-value (0.0009) in the ANOVA test.

3.4. Validation of Optimisation Conditions

The expected hydrolysis conditions for the highest TRS yield amount (105.57 mg/mL) were measured, in which enzyme loading: X1 = 22.9 µg/g, temperature: X2 = 45 °C, and time: X3 = 69.06 h. Thus, the models employed in this study established the ideal operating conditions for the enzymatic hydrolysis process. Resultantly, the model produces a high output of TRS yield. Nonetheless, an additional experimental procedure was performed to verify the expected TRS yield amount at the optimum hydrolysis conditions. The actual experimental value obtained for TRS was 108.74 mg/mL. The result was observed to be near the estimated value (105.57 mg/mL) and has a predicted error of ±2.91 mg/mL. Therefore, the validation data carried out in this study was significant. Subsequently, the validation data was further used in the kinetic analysis of enzymatic hydrolysis.

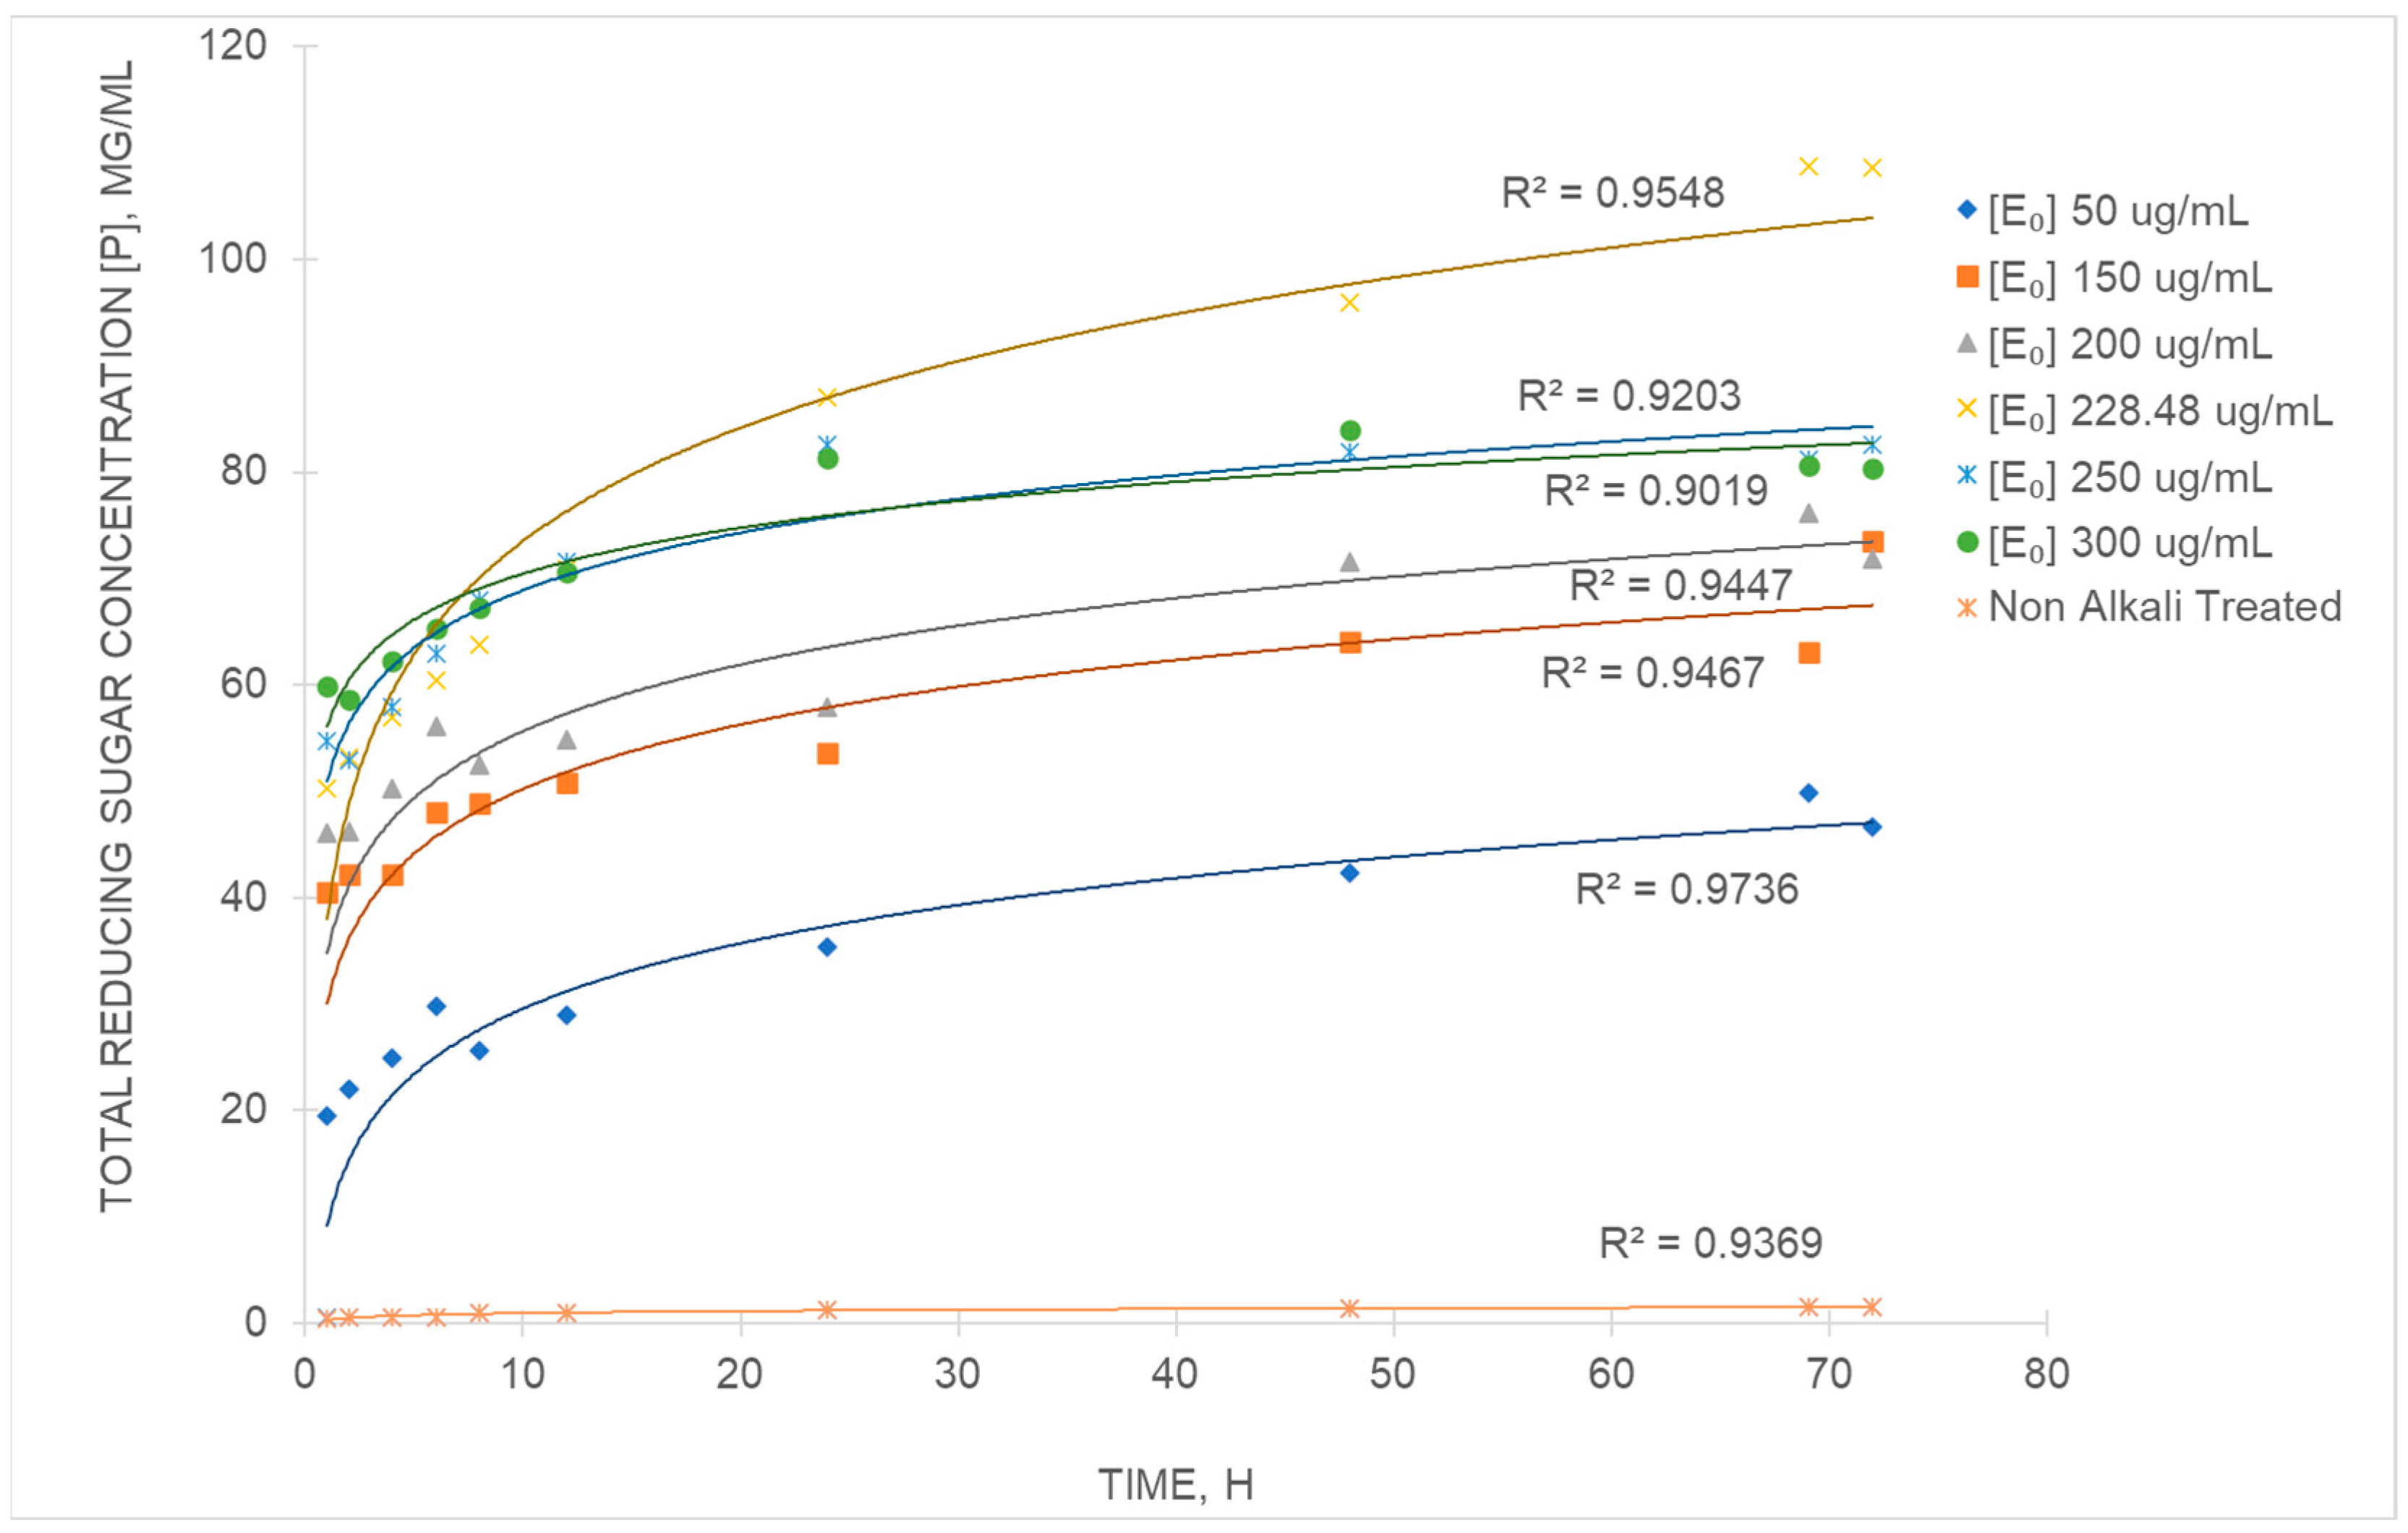
3.5. Kinetic Study of the Enzymatic Hydrolysis

The experimental findings in Figure 4 reveal the influence of the NaOH pre-treatment process and enzyme concentration on TRS yield during the enzymatic hydrolysis process. The effect of the NaOH pre-treatment process on the substrate surface was highlighted for all enzyme concentrations in all-time curves using the Chrastil model. It was demonstrated that the TRS yield increases with time when the enzyme concentration increases from 0.5 to 22.9 µg/g. Additionally, the hydrolysis processes of untreated and pre-treated PALF by NaOH was compared. At the same cellulase concentration (22.9 µg/g), the pre-treated PALF observed a 93% higher TRS yield amount than the untreated PALF.
The Chrastil model used in Equation (4) was implemented to obtain the product formation results. The diffusion properties of the enzyme system were determined by analysing the curves and the parameters n (structural diffusion resistance constant) and k (rate constant). The results in Table 4 demonstrate excellent agreement of the experimental values for each enzyme concentration. In Figure 4, the experimental result of R2 > 0.90 was successfully achieved, which was indicated by the non-linear regression graph. Moreover, the reaction order characteristics were measured using the parameter n. The changes in the structural diffusion resistance coefficient were observed for n at various enzyme concentrations. Hence, if n tends to approach unity (0.9 to 1.0), then the diffusion resistance becomes negligible, and the reaction is a first-order reaction. Nonetheless, when n is small (0.5 to 0.6), the system was constrained by diffusion resistance. Additionally, the increasing value of rate constant k was observed from 1.30 × 10⁻³ mg/mL.h (untreated PALF) to 5.77 × 10⁻³ mg/mL.h (pre-treated with NaOH).
Table 4 investigates the diffusion-limited system by summarising the kinetic variables, which were determined by the regression analysis in Equation (4). Figure 5 illustrates the experimental results of the initial hydrolysis rate and enzyme concentration. The kinetic parameters of the modified MM model were obtained using Equation (3), which gave a maximum rate of Vemax = 93.45 mg/mL and a half-saturation constant of Ke = 191.05 mg/mL. According to the obtained kinetic parameters, the correlations between the initial enzyme concentration and the hydrolysis rate can be constructed as continuous graphs. Additionally, the modified MM model enables a reasonable PALF kinetic hydrolysis behaviour estimation even when the diffusion and structural features were neglected. Moreover, using the modified MM model, the kinetic analysis of enzyme concentration and TRS production depicts a good correlation (R2 = 0.99). Nevertheless, the sole use of the modified MM model was unable to determine whether the enzymatic system is limited by the diffusion process.

4. Discussion

Generally, the lignocellulosic biomass structure, which includes PALF, is primarily constituted of hemicellulose, cellulose, and lignin. In the production of reducing sugar, the disruption of the lignocellulosic cell wall was a crucial factor in optimising the yield amount of reducing sugar from cellulose. Moreover, the enzymatic approach applied after the pre-treatment process for lignin removal can be developed to become a potential green technology. Hence, the enzymatic approach offers the elimination of excessively strong acids or alkalis during the hydrolysis process. Furthermore, this study was conducted to improve the enzymatic hydrolysis of the PALF cellulose. From the ANOVA analysis, the most significant parameter observed in TRS yield amount was hydrolysis time (X3), followed by temperature (X2), and enzyme loading (X1). Nonetheless, when compared to the other parameters, the hydrolysis time of the enzymatic hydrolysis process can have a greater effect on the TRS yield amount. Similar results were reported on these parameters, which have a substantial effect on the reducing sugar yield of potato peel residues and Ayous cellulose, respectively [4,24]. Nevertheless, the enzymatic hydrolysis process of alkaline pre-treated corn stover powder reported by Zhang and Wu was also affected by biomass loading [25]. The study demonstrated a significant (p < 0.05) result for TRS yield, while temperature revealed an insignificant (p > 0.05) effect on TRS yield. Therefore, it was concluded that the results obtained may vary depending on the type of lignocellulosic biomass used and the choice of pre-treatment process.
Based on the observation of the optimisation analysis study, the combined effect of a 72-h reaction time and 20.0 µg/g enzyme loading at 50 °C resulted in the highest TRS yield of 105.06 mg/mL from PALFs. After validation of the optimisation process, the TRS yield depicts a tremendous increase of up to 84% from the initial TRS value. The increment of the TRS yield amount reveals that the optimisation process using BBD was successful in improving the enzymatic hydrolysis process of PALF. Furthermore, the dominant effect of hydrolysis time observed in this study was probably due to the longer time required for cellulase to reach the cellulose molecules within the pre-treated PALF structure. The dominant effect of hydrolysis time was assumed when the mass transfer hindrance was high. Hence, the TRS yield amount observed in this study increased when the hydrolysis time was increased from 24 h to 72 h. Moreover, Liu et al. reported that a specific duration was required since enzymatic hydrolysis is a heterogeneous reaction [26]. Additionally, the enzymatic hydrolysis process usually involves cellulase adsorption, the formation of substrate–cellulase complexes, and saccharide dissolution.
For heterogeneous hydrolysis reactions, the Chrastil model was implemented to determine whether the enzyme system was limited by the diffusion process. Carillo et al. described that when the n value changes, alterations occur in the substrate-enzyme system structure and diffusion system [17]. In this study, the pre-treated PALFs displayed a higher n value (0.41) when compared to the untreated PALFs (0.35). The higher n value indicates that the pre-treated PALFs have less resistance to the diffusion process. Therefore, it can be concluded that the NaOH pre-treatment process enhances the movement of molecules in pre-treated PALF. The enhancement movement of molecules was due to the swelling effect and hydrolysis of hemicellulose and lignin. Furthermore, the increase in enzyme concentration produces a decrease in the n value from 0.79 to 0.31. The decrease in the n value suggests that the diffusion resistance increases, which was possibly caused by molecular steric factors induced by enzyme molecules. Lee and Fan interpreted this phenomenon by assuming that the initially adsorbed enzymes produce a single layer on the surface of the fibre [27]. Additionally, the excessive enzyme molecules were absorbed, which built an additional layer. Likewise, the adsorbed enzymes on the first layer could directly contribute to the hydrolysis process by restricting enzyme diffusion through the structure of the substrate. Hence, the adsorbed enzymes on the first layer increased the diffusion resistance.
The reduction in k values at higher enzyme concentrations was due to the critical role of hydrolysis inhibition mechanisms in product formation [28]. The reduced accessibility towards cellulose was due to the increase in enzyme concentration, which increased limiting diffusion, thus the catalytic activity of the enzyme decreased. In this work, the pre-treatment process of PALF using NaOH enhances the catalytic activity of the hydrolysis process. The improved catalytic activity results in the formation of a more accessible substrate for the hydrolysis process. Additionally, the enzymes were made to be more favourable to the substrate. Nevertheless, the k value obtained in this study decreased (4.98 × 10⁻⁴ mg/mL.h). The decrease in k value was caused by the increase in enzyme concentration due to the limiting substrate saturation, specifically when 30.0 µg/g enzyme was used.

5. Conclusions

The enzymatic hydrolysis conditions of the pre-treated PALF were optimised using BBD to maximise the TRS yield amount. The optimisation process was carried out by manipulating the enzyme loading, temperature, and hydrolysis time. Hence, the highest TRS yield amount achieved was 108.74 mg/mL through control of the enzyme loading, temperature, and hydrolysis time. Additionally, the optimisation of the enzymatic hydrolysis conditions greatly improved the TRS yield from its initial value before optimisation. Furthermore, the kinetic evaluation was investigated using modified MM and Chrastil models for a limited diffusion system of enzymatic hydrolysis. The kinetic results using the modified MM and Chrastil models demonstrated good agreement with the experimental data. In the heterogeneous enzymatic hydrolysis of PALF, the interaction of cellulase and substrate was found to be highly dependent on the substrate’s accessibility to cellulase molecules. Therefore, the optimisation and kinetics data obtained in this study provide essential information for the yield amount prediction in the bioconversion of PALF to sugar. Since PALF is a potential source for bioproduct formation, the obtained PALF hydrolysate could be used as a promising carbon source for probiotic growth and biofuel production.

Author Contributions

N.I.N.: Formal analysis, Investigation, Methodology, Validation, Writing-original draft, Data curation; N.H.A.R.: Software, Validation, Visualisation, Writing—review and editing; R.A.R.: Conceptualisation, Funding acquisition, Project administration, Resources, Supervision; R.M.I.: Resources, Funding acquisition; N.F.G.: Resources; B.A.: Resources; H.A.E.E.: Resources, Funding acquisition. All authors have read and agreed to the published version of the manuscript.

Funding

The authors acknowledged the financial support from Universiti Teknologi Malaysia (UTM) through Professional Development Research University (PDRU) Grant (Q.J130000.21A2.05E98), UTM Iconic Grants (Q.J130000.4354.09G57 and Q.J130000.21A2.05E80) and Industrial Grants (R.J130000.7609.4C284 and R.J130000.7609.4C187) in supporting this research work.

Institutional Review Board Statement

Not applicable.

Informed Consent Statement

Not applicable.

Data Availability Statement

All research data were presented in this contribution.

Conflicts of Interest

The authors declare no conflict of interest.

References

  1. FAO. Crop and Livestocks Product; FAO: Rome, Italy, 2021. [Google Scholar]
  2. El-Zawawy, W.K.; Ibrahim, M.M.; Abdel-Fattah, Y.R.; Soliman, N.A.; Mahmoud, M.M. Acid and Enzyme Hydrolysis to Convert Pretreated Lignocellulosic Materials into Glucose for Ethanol Production. Carbohydr. Polym. 2011, 84, 865–871. [Google Scholar] [CrossRef]
  3. Sun, Y.; Cheng, J. Hydrolysis of Lignocellulosic Materials for Ethanol Production: A Review. Bioresour. Technol. 2002, 83, 1–11. [Google Scholar] [CrossRef]
  4. Taher, I.B.; Fickers, P.; Chniti, S.; Hassouna, M. Optimization of Enzymatic Hydrolysis and Fermentation Conditions for Improved Bioethanol Production from Potato Peel Residues. Biotechnol. Prog. 2017, 33, 397–406. [Google Scholar] [CrossRef] [PubMed]
  5. Umagiliyage, A.L.; Choudhary, R.; Liang, Y.; Haddock, J.; Watson, D.G. Laboratory Scale Optimization of Alkali Pretreatment for Improving Enzymatic Hydrolysis of Sweet Sorghum Bagasse. Ind. Crops Prod. 2015, 74, 977–986. [Google Scholar] [CrossRef] [Green Version]
  6. Singh, A.; Bishnoi, N.R. Enzymatic Hydrolysis Optimization of Microwave Alkali Pretreated Wheat Straw and Ethanol Production by Yeast. Bioresour. Technol. 2012, 108, 94–101. [Google Scholar] [CrossRef] [PubMed]
  7. Qi, B.; Chen, X.; Shen, F.; Su, Y.; Wan, Y. Optimization of Enzymatic Hydrolysis of Wheat Straw Pretreated by Alkaline Peroxide Using Response Surface Methodology. Ind. Eng. Chem. Res. 2009, 48, 7346–7353. [Google Scholar] [CrossRef]
  8. Maitan-Alfenas, G.P.; Visser, E.M.; Guimarães, V.M. Enzymatic Hydrolysis of Lignocellulosic Biomass: Converting Food Waste in Valuable Products. Curr. Opin. Food Sci. 2015, 1, 44–49. [Google Scholar] [CrossRef]
  9. Ayyachamy, M.; Gupta, V.K.; Cliffe, F.E.; Tuohy, M.G. Enzymatic Saccharification of Lignocellulosic Biomass BT-Laboratory Protocols in Fungal Biology: Current Methods in Fungal Biology; Gupta, V.K., Tuohy, M.G., Ayyachamy, M., Turner, K.M., O’Donovan, A., Eds.; Springer: New York, NY, USA, 2013; pp. 475–481. [Google Scholar]
  10. Ferreira, S.; Duarte, A.P.; Ribeiro, M.H.L.; Queiroz, J.A.; Domingues, F.C. Response Surface Optimization of Enzymatic Hydrolysis of Cistus Ladanifer and Cytisus Striatus for Bioethanol Production. Biochem. Eng. J. 2009, 45, 192–200. [Google Scholar] [CrossRef]
  11. Kaur, S.; Sarkar, B.C.; Sharma, H.K.; Singh, C. Optimization of Enzymatic Hydrolysis Pretreatment Conditions for Enhanced Juice Recovery from Guava Fruit Using Response Surface Methodology. Food Bioproc. Tech. 2009, 2, 96–100. [Google Scholar] [CrossRef]
  12. Pandiyan, K.; Tiwari, R.; Singh, S.; Nain, P.K.S.; Rana, S.; Arora, A.; Singh, S.B.; Nain, L. Optimization of Enzymatic Saccharification of Alkali Pretreated Parthenium Sp. Using Response Surface Methodology. Enzym. Res. 2014, 2014, 764898. [Google Scholar] [CrossRef]
  13. Ruangmee, A.; Sangwichien, C. Response Surface Optimization of Enzymatic Hydrolysis of Narrow-Leaf Cattail for Bioethanol Production. Energy Convers. Manag 2013, 73, 381–388. [Google Scholar] [CrossRef]
  14. Saini, J.K.; Anurag, R.K.; Arya, A.; Kumbhar, B.K.; Tewari, L. Optimization of Saccharification of Sweet Sorghum Bagasse Using Response Surface Methodology. Ind. Crops Prod. 2013, 44, 211–219. [Google Scholar] [CrossRef]
  15. Carvalho, M.L.; Sousa, R.; Rodríguez-Zúñiga, U.F.; Suarez, C.A.G.; Rodrigues, D.S.; Giordano, R.C.; Giordano, R.L.C. Kinetic Study of the Enzymatic Hydrolysis of Sugarcane Bagasse. Braz. J. Chem. Eng. 2013, 30, 437–447. [Google Scholar] [CrossRef] [Green Version]
  16. Bailey, C.J. Enzyme Kinetics of Cellulose Hydrolysis. Biochem. J. 1989, 262, 1001. [Google Scholar] [CrossRef] [Green Version]
  17. Carrillo, F.; Lis, M.J.; Colom, X.; López-Mesas, M.; Valldeperas, J. Effect of Alkali Pretreatment on Cellulase Hydrolysis of Wheat Straw: Kinetic Study. Process. Biochem. 2005, 40, 3360–3364. [Google Scholar] [CrossRef]
  18. Pratto, B.; de Souza, R.B.A.; Sousa, R.; da Cruz, A.J.G. Enzymatic Hydrolysis of Pretreated Sugarcane Straw: Kinetic Study and Semi-Mechanistic Modeling. Appl. Biochem. Biotechnol. 2016, 178, 1430–1444. [Google Scholar] [CrossRef]
  19. Kadam, K.L.; Rydholm, E.C.; McMillan, J.D. Development and Validation of a Kinetic Model for Enzymatic Saccharification of Lignocellulosic Biomass. Biotechnol. Prog. 2004, 20, 698–705. [Google Scholar] [CrossRef]
  20. Lin, S.-H.; Chou, L.-M.; Chien, Y.-W.; Chang, J.-S.; Lin, C.-I. Prebiotic Effects of Xylooligosaccharides on the Improvement of Microbiota Balance in Human Subjects. Gastroenterol. Res. Pract 2016, 2016, 5789232. [Google Scholar] [CrossRef] [Green Version]
  21. Sajjanshetty, R.; Kulkarni, N.S.; Shankar, K.; Jayalakshmi, S.K.; Sreeramulu, K. Enhanced Production and In-Situ Removal of Butanol during the Fermentation of Lignocellulosic Hydrolysate of Pineapple Leaves. Ind. Crops Prod. 2021, 173, 114147. [Google Scholar] [CrossRef]
  22. Nashiruddin, N.I.; Mansor, A.F.; Rahman, R.A.; Ilias, R.M.; Yussof, H.W. Process Parameter Optimization of Pretreated Pineapple Leaves Fiber for Enhancement of Sugar Recovery. Ind. Crops Prod. 2020, 152, 112514. [Google Scholar] [CrossRef]
  23. Ghose, T.K. Measurement of Cellulase Activities. Methods Mol. Biol. 1987, 59, 257–268. [Google Scholar] [CrossRef]
  24. Miller, G.L. Use of Dinitrosalicylic Acid Reagent for Determination of Reducing Sugar. Anal. Chem. 1959, 31, 426–428. [Google Scholar] [CrossRef]
  25. Zhang, H.; Wu, J. Statistical Optimization of Sodium Hydroxide Pretreatment and Enzymatic Hydrolysis of Corn Stover Powder for Enhancing Sugar Production Using Response Surface Methodology. Biomass Convers. Biorefin. 2021. [Google Scholar] [CrossRef]
  26. Liu, S.; Wang, Q. Response Surface Optimization of Enzymatic Hydrolysis Process of Wet Oxidation Pretreated Wood Pulp Waste. Cellul. Chem. Technol. 2016, 50, 803–809. [Google Scholar]
  27. Lee, Y.H.; Fan, L.T. Kinetic Studies of Enzymatic Hydrolysis of Insoluble Cellulose: (II). Analysis of Extended Hydrolysis Times. Biotechnol. Bioeng. 1983, 25, 939–966. [Google Scholar] [CrossRef]
  28. Lee, Y.-H.; Fan, L.T. Kinetic Studies of Enzymatic Hydrolysis of Insoluble Cellulose: Analysis of the Initial Rates. Biotechnol. Bioeng. 1982, 24, 2383–2406. [Google Scholar] [CrossRef]
Figure 1. Predicted vs. actual amount of TRS from PALF hydrolysis process.
Fermentation 08 00640 g001
Figure 2. Interaction of (A) enzyme loading and temperature at 48-h hydrolysis time, (B) enzyme loading and hydrolysis time at 50 °C, and (C) hydrolysis time and temperature using 200 µg/mL enzyme.
Fermentation 08 00640 g002
Figure 3. The surface response plots depict the effects of enzyme loading, temperature, and time of the hydrolysis process on the TRS yield amount. The surface response plots were obtained with (A) a constant time of 48 h, (B) a constant temperature of 50 °C, and (C) a constant enzyme loading of 20.0 µg/g.
Fermentation 08 00640 g003
Figure 4. Enzymatic hydrolysis at 45 °C of treated PALF at various enzyme loadings (NaOH pre-treatment conditions: 2.43% (w/v) NaOH, a temperature of 87.22 °C, and a hydrolysis time of 57.15 min). The symbols represent experimental values, while the line curves represent the non-linear regression generated from the Chrastil model using Equation (4). Eo = initial enzyme concentration.
Fermentation 08 00640 g004
Figure 5. Effect of initial enzyme concentration on pre-treated PALF initial hydrolysis rate (NaOH pre-treatment conditions: 2.43% (w/v) NaOH, the temperature of 87.22 °C, and the hydrolysis time of 57.15 min). Experimental values were plotted based on Equation (3).
Fermentation 08 00640 g005
Table 1. Range and levels of independent process variables for enzymatic hydrolysis optimisation.
FactorCoded Name−101
Enzyme loading (µg/g)X1150200250
Temperature (°C)X2405060
Time (h)X3244872
Table 2. ANOVA data for the enzymatic hydrolysis response parameter.
SourceSum of SquaresDFMean SquareF ValueProb > F
Model1498.2611136.2127.820.0009significant
X1-Enzyme loading83.45183.4517.040.0091
X2-Temperature99.00199.0020.220.0064
X3-Time363.021363.0274.150.0003
X127.1417.141.460.2811
X22411.011411.0183.950.0003
X3210.12110.122.070.2101
X1X233.12133.126.760.0482
X1X329.98129.986.120.0562
X2X3237.161237.1648.440.0009
X12X29.9219.922.030.2138
X1X2243.52143.528.890.0307
Residual24.4854.90
Lack of fit1.7811.780.310.6057Not significant
Pure error22.7045.68
Table 3. Box–Behnken experimental data and corresponding TRS values for various combinations of three independent variables in the enzymatic hydrolysis process.
CycleVariablesResponse
Enzyme Loading (µg/g)Temperature (°C)Time (h)TRS (mg/mL)
1200 (0)50 (0)48 (0)93.78
2200 (0)60 (1)72 (1)75.56
3250 (1)60 (1)48 (0)72.04
4150 (−1)50 (0)72 (1)90.45
5150 (−1)40 (−1)48 (0)86.64
6150 (−1)50 (0)24 (−1)81.51
7200 (0)60 (1)24 (−1)78.43
8200 (0)50 (0)48 (0)90.10
9200 (0)40 (−1)24 (−1)72.98
10250 (1)50 (0)24 (−1)85.17
11150 (−1)60 (1)48 (0)77.99
12250 (1)40 (−1)48 (0)92.20
13200 (0)40 (−1)72 (1)100.91
14200 (0)50 (0)48 (0)93.96
15250 (1)50 (0)72 (1)105.06
16200 (0)50 (0)48 (0)92.51
17200 (0)50 (0)48 (0)96.65
Table 4. Parameters based on empirical data regression.
Initial Enzyme Concentration, [Eo] (µg/g)k (mg/mL.h)nR2
PALFs pre-treated with NaOH
0.5

1.2 × 10⁻²

0.79

0.9736
15.08.0 × 10−30.620.9467
20.06.13 × 10−30.510.9447
22.95.77 × 10−30.410.9548
25.05.34 × 10−30.390.9203
30.04.98 × 10−40.310.9019
Untreated PALF
22.9

1.30 × 10⁻³

0.35

0.9369
Publisher’s Note: MDPI stays neutral with regard to jurisdictional claims in published maps and institutional affiliations.

