Article

Optimization of Ethanolic Extraction of Enantia chloranta Bark, Phytochemical Composition, Green Synthesis of Silver Nanoparticles, and Antimicrobial Activity

by
Mbarga M. J. Arsene
1,2,*,
Podoprigora I. Viktorovna
1,2,
Marukhlenko V. Alla
3,
Morozova A. Mariya
3,
Goriainov V. Sergei
2,4,
Esparza Cesar
3,
Anyutoulou K. L. Davares
1,
Kezimana Parfait
5,
Kamgang N. Wilfrid
6,
Tuturov S. Nikolay
6,
Manar Rehailia
5,
Smolyakova A. Larisa
1,
Souadkia Sarra
1,
Senyagin N. Alexandr
1,2,
Ibrahim Khelifi
1,
Khabadze S. Zurab
7,
Karnaeva S. Amina
7,
Todua M. Iia
7,
Pikina P. Alla
8,
Ada A. Gabin
9,
Ndandja T. K. Dimitri
9,
Kozhevnikova A. Liudmila
7 and
Pilshchikova V. Olga
7
add Show full author list remove Hide full author list
1
Department of Microbiology V.S. Kiktenko, Peoples’ Friendship University of Russia (RUDN University), 117198 Moscow, Russia
2
Research Institute of Molecular and Cellular Medicine, Peoples’ Friendship University of Russia (RUDN University), 6 Miklukho-Maklaya Street, 117198 Moscow, Russia
3
Department of Pharmaceutical and Toxicological Chemistry, Peoples’ Friendship University of Russia (RUDN University), 117198 Moscow, Russia
4
Research and Educational Resourse Center Pharmacy, Peoples’ Friendship University of Russia (RUDN University), 117198 Moscow, Russia
5
Department of Agrobiotechnology, Peoples’ Friendship University of Russia (RUDN University), 117198 Moscow, Russia
6
Department of Pediatric Dentistry and Orthodontics, Peoples’ Friendship University of Russia (RUDN University), 117198 Moscow, Russia
7
Department of Therapeutic Dentistry, Peoples’ Friendship University of Russia (RUDN University), 117198 Moscow, Russia
8
Department of Microbiology and Virology, Pirogov Russian National Research Medical University, 117997 Moscow, Russia
9
Department of Nervous Diseases and Neurosurgery, Peoples’ Friendship University of Russia (RUDN University), 117198 Moscow, Russia
*
Author to whom correspondence should be addressed.
Fermentation 2022, 8(10), 530; https://doi.org/10.3390/fermentation8100530
Submission received: 20 September 2022 / Revised: 4 October 2022 / Accepted: 4 October 2022 / Published: 11 October 2022

Abstract

:
In this study, using the Box–Behnken model, we optimized the ethanolic extraction of phytochemicals from Enantia chloranta bark for the first time, assessed the composition with HPLC-MS/MS, performed the green synthesis of silver nanoparticles (AgNPs) and characterized them with UV-Vis spectrophotometry, photon cross-correlation spectroscopy, energy-dispersive X-ray fluorescence spectrometry, and Fourier transform infrared spectroscopy. The antibacterial and antibiotic-resistance reversal properties of optimized extract (O-ECB) and AgNPs were assessed on various microorganisms (15 Gram−, 7 Gram+, and 2 fungi) using the well diffusion method and microbroth dilution assay. The mechanism of action was investigated on growth kinetic and proton pumps of Escherichia coli. The in vivo antimicrobial activity and toxicity were assessed on Galleria mellonella larvae. The optimal mass yield (14.3%) related to the highest antibacterial activity (31 mm vs. S. aureus ATCC 6538) was obtained with the following operating conditions: % EtOH—100%; ratio m/v—20 g/mL; and extraction time—6 h. All the compounds identified in O-ECB were alkaloids and the major constituents were palmatine (51.63%), columbamine +7,8-dihydro-8-hydroxypalmatine (19.21%), jatrorrhizine (11.02%), and pseudocolumbamine (6.33%). Among the minerals found in O-ECB (S, Si, Cl, K, Ca, Mn, Fe, Zn, and Br), Br, Fe, and Cl were the most abundant with mean fluorescence intensities of 4.6529, 3.485,4, and 2.5942 cps/uA, respectively. The synthesized AgNPs revealed a strong absorption plasmon band between 430 and 450 nm and an average hydrodynamic diameter ×50 of 59.74 nm, and the presence of Ag was confirmed by a characteristic peak in the spectrum at the silver Kα line of 22.105 keV. Both O-ECB and AgNPs displayed noteworthy and broad-spectrum antimicrobial activities against 20/24 and 24/24 studied microorganisms, respectively, with recorded minimal inhibitory concentrations (MICs) ranging from 8 to ≥1024 µg/mL and 2 to 64 µg/mL. O-ECB and AgNPs showed antibiofilm properties and significantly enhanced the efficacy of conventional antibiotics against selected multidrug-resistant bacteria, and the mechanistic investigations revealed their interference with bacterial growth kinetic and the inhibition of H+-ATPase proton pumps. LD50s were 40 mg/mL and 0.6 mg/mL for O-ECB and AgNPs, respectively. In conclusion, the current study provides a strong experimental baseline to consider Enantia chlorantha bark and their green synthetized AgNPs as potent antimicrobial compounds in this era of antimicrobial resistance.

1. Introduction

In recent years, interest in metallic nanostructures such as silver nanoparticles (AgNPs) has increased considerably [1,2]. AgNPs are used in various fields, including medicine, food and healthcare, and for consumer and industrial purposes, due to their unique physical and chemical properties [1,3]. These include optical, electrical, thermal, high electrical conductivity, and biological properties [3]. Due to their peculiar properties, they have been used for several applications, including as antibacterial agents, in industrial, household, and healthcare-related products, in consumer products, medical device coatings, optical sensors, and cosmetics, in the pharmaceutical industry and food industry, in diagnostics, orthopedics, and drug delivery, and as anticancer agents, and have ultimately enhanced the tumor-killing effects of anticancer drugs [1,2,3]. The synthesis of AgNPs is commonly performed by chemical reduction using inorganic and organic reducing agents such as poly(ethyleneglycol), sodium borohydride, N-dimethylformamide, hydrazine, and the surfactant template approach [1,2]. Other physical techniques such as photochemical methods, microwave processing, electron irradiation, laser ablation, and gamma irradiation are also employed [1]. However, more eco-friendly methods such as green routes using microorganisms, enzymes, and plant extracts are increasingly suggested to replace chemical methods [1,4,5,6,7]. Additionally, biogenic synthesized AgNPs seem to be more stable and cost-effective [1]. Several plants, medicinal or not, such as Azadirachta indica [4,5], Citrus medica, Tagetes lemmonii, Tarenna asiatica [6], Rosa canina [8] and Syzygium cumini [7] have already been used to synthesize and stabilize metallic biogenic AgNPs. A thorough survey of the literature indicated that very few works have been completed on the use of Enantia chlorantha in nanotechnology. E. chlorantha is a well-known medicinal plant in Cameroon and other countries of Central Africa and the coast of West Africa. E. chlorantha is commonly known as yellow wood, but is also called by a variety of names in indigenous languages: Mfol (Bulu), Awopa, Osu pupa or Dokitaigbo (Yoruba), Epoue (Baka), Peye (Badjoue), Osomolu (Ikale), Erenba-vbogo (Benin), Erumeru (Nigeria), Kakerim (Boki), Mpouley (Mabea), and Njie (Douala) [9,10]. This plant from the Magnoliales order and the Annonaceae family can reach a circumference of 70 cm and may grow up to 30 m high with crowded foliage and a spreading crown [9]. Its fluted stem is converted by a bark with a brown fissured external part and pale cream inner part. The latter carries geometrically elliptic leaves with an average length ranging from 0.14 to 0.15 m and a width of 0.05 to 0.14 m [9]. In Cameroon, E. chlorantha is highly prized in the traditional pharmacopoeia and used in the treatment of several infections [10]. Several authors have reported the healing properties of this plant against various infections such as malaria, typhoid fever, jaundice, dysentery, wounds, high blood pressure, urinary infection, leprosy spots, and convulsions [9,10,11]. Its yellow, dried, or fresh bark has been reported to have antioxidant, antipyretic, antiviral, antifungal, and antibacterial properties [9,10,11]. These multiple properties have been attributed to its composition, which mainly includes alkaloids such as protoberberines (berberine, canadine, palmatine, jatrorrhizine, columbamine, and pseudocolumbamine), phenanthrene alkaloids (atherosperminine and argentinine) and aporphines (7-hydroxidehydronuciferine and 7-hydroxidehydronornuciferine) [9,12,13].
In this context of the increasing spread of antimicrobial resistance, it is becoming increasingly imperative to search for new antimicrobials which are essential to address this worldwide issue [14,15,16,17]. Several solutions such as phage therapy, probiotics, antimicrobial peptides, vaccines, and nanostructures are regularly suggested; however, the least expensive and most ecofriendly means to date remain the use of medicinal plants either as they are or in the phytofabrication of nanoparticles [16,17].
Given the above-mentioned reported properties of E. chlorantha, the present work aims to optimize the ethanolic extraction of active compounds from the bark of this plant, assess its phytochemical composition, perform the green synthesis of silver nanoparticles (AgNPs), conduct in vitro and in vivo antimicrobial studies, and investigate the mechanism of action, the impact on biofilm formation, and its toxicity.

2. Materials and Methods

2.1. Material

2.1.1. Vegetal Materials

The vegetal material used in this study was the bark of Enantia chlorantha. Freshly harvested bark was bought from the Nkoabang Market (VH7M+FJ Yaoundé, Cameroon), dried at room temperature in the shade for 7 days, and then packaged in hermetically sealed plastics and shipped in December 2020 to the Laboratory of Microbiology of the Faculty of Medicine of the RUDN University, Moscow, Russia. The plant material remained in the airtight package at room temperature in a cupboard awaiting further processing.

2.1.2. Microbial Strains and Their Profile of Susceptibility to Antibiotics

In this study, we used 22 bacteria including 15 Gram-negative and 7 Gram-positive samples, and 2 fungi samples (Candida albicans ATCC 10,231 and a clinical C. albicans). All the microorganisms were provided by the Laboratory of Microbiology and virology of RUDN University; they are the same as those used in our previous studies [18,19,20] and their antibiotic susceptibility profile is provided in the Supplementary Material (Table S1).

2.1.3. Galleria Mellonella

Galleria mellonella larvae were obtained commercially from https://ecobaits.ru/ (ECO BAITS, Moscow, Russia; Accessed 18 June 2021) and stored at 15 °C prior to use. Dead larvae and those with dark spots or showing signs of melanization were discarded.

2.1.4. Chemicals

Silver nitrate (AgNO3) was purchased from PanReac AppliChem (Chicago, IL, USA), and dimethyl sulfoxide (DMSO) was obtained commercially from BDH Laboratories, VWR International Ltd., USA. All the media (BHIB: brain heart infusion broth; MHA: Mueller–Hinton agar; SDB: sabouraud dextrose broth) were procured from HiMedia™ Laboratories Pvt. Ltd., India, and all other reagents and chemicals used were of analytical grade.

2.2. Method

2.2.1. Experimental Design for Extraction, Modelling, Validation of Model, and Optimization

The Box–Behnken design (BBD) was used to scrutinize the extraction process. Table 1 presents the factors and their coded levels used for the BBD. The extraction was carried out with a hydroethanolic solution (X1: 0–100% v/v) mixed with the dried powder of Enantia chloranta bark at a ratio of (X2: 10–20 g/100) and time of (X3: 6–24 h). For each experiment, in a conical flask, we mixed 100 mL of hydroethanolic solution (at X1%) with the required mass of powder of E. chlorantha bark to obtain the ratio X2. The flask was covered and was shaken at 300 rpm for X3 h at 37 °C in a shaker incubator (Heidolph Inkubator 1000 coupled with Heidolph Unimax 1010, Schwabach, Germany). The mixture was filtered using Whatman filter paper №1 and concentrated at 40 °C in a rotary evaporator (IKA RV8) equipped with a water bath IKA HB10 (IKA Werke, Staufen, Germany) and a vacuum pumping unit IKA MVP10 (IKA Werke, Staufen, Germany). The extract was collected when the volume was small enough to avoid losses and placed in Petri dishes previously weighed and then incubated open at 40 °C until complete evaporation (this operation was carried out because total drying of the solution in the flask would make it difficult to completely recover the crude extract). The final dried crude extracts were weighed. Extraction volume and mass yield constituting 2 of the 3 responses of the BBD were determined using the formulas in Equations (1) and (2):
Volume   yield   ( % ) = Volume   of   the   extract   after   filtration   ( mL ) Initial   solvent   volume   ( mL ) × 100
Mass   yield   ( % ) = Mass   of   extracted   plant   residues   ( g )   Mass   of   plant   raw   sample ( g ) × 100
The 3rd response was the inhibition diameter of the crude extract (100 mg/mL) against Staphylococcus aureus ATCC 6538, since this bacterium was shown to be highly sensitive to E. chlorantha bark in our previous study where we screened the antibacterial activity of several plants from Cameroon [21]. The inhibition diameters were obtained using the well diffusion method, as described below.
The BBD consisted of 15 trials; each trial was performed in triplicate, and the average responses were reported (volume yield, mass yield, and inhibition diameter).
The mathematical models describing the relation between the factors and the responses were second-order polynomial equations with linear, quadratic, and interaction terms (Equation (3)):
Y = β 0 + i = 0 k β i x i + i = 0 k β i i x i 2 + i < j k β i j x i x j + ε
where Y is the response, xi and xj are the variables, β0 is the constant term, βi is the coefficient of the linear terms, βii is the quadratic coefficient terms, and βij is the coefficient of the interaction terms.
The coefficients of the models and statistical analyses (ANOVA) were obtained using the Minitab version 18 software (Minitab, Ltd., Brandon Court, Unit E1-E2 Progress Way, Coventry, CV3 2TE, UK). The level of significance was declared at p = 0.05.
The validation of the models was performed by calculating the absolute average deviation (AAD) (Equation (4)), the bias factor (Bf) (Equation (5)), and the accuracy factor (Af) (Equation (6)).
A A D = [ i = 1 N ( | Y i , exp Y i , cal | Y i , exp ) ] N
B f i = 10 1 N i = 0 N l o g ( Y i , cal Y i , exp )
A f i = 10 1 N i = 0 N | l o g ( Y i , cal Y i , exp ) | ,
where Yi,exp is the experimental response and Yi,cal the calculated response, and N is the number of experiments used in the calculation.
The linear (Equation (7)), interaction (Equation (8)), and quadratic contribution (Equation (9)) of each factor were obtained as follows:
For linear terms (7),
Contribution   ( % ) = | β i | i = 1 k | β i | + i = 1 k | β i i | + i < j k | β i , j |
For quadratic terms (8),
Contribution   ( % ) = | β i i | i = 1 k | β i | + i = 1 k | β i i | + i < j k | β i , j |
For interaction terms (9),
Contribution   ( % ) = | β i j | i = 1 k | β i | + i = 1 k | β i i | + i < j k | β i j |
Lastly, the optimization was performed using the software Minitab 18 with the conditions fixed to simultaneously maximize the volume and mass yield and inhibition diameter.

2.2.2. HPLC-MS/MS Analysis

Sample Preparation

Next, 1.0 mg of a sample was placed in an Eppendorf, 1.0 mL of a mixture of methanol: water (70:30) was added, and extraction was carried out in an ultrasonic bath for 30 min. The complete dissolution of a sample was noted, and it was transferred to a chromatographic vial for analysis.

Analysis Conditions

The extract was analyzed by 6030 series HPLC-MS/MS (Agilent, Santa Clara, CA, USA). HPLC (Agilent 1290), consisting of a binary pump, an autosampler, and a thermostatted column compartment, was performed with Shim-pack FC-ODS C18, 150 × 2.0 mm × 3.0 µm. The flow rate was 0.25 mL/min. The sample cooler and the column temperature were set at 5 °C and 30 °C, respectively. The injection volume was 10 μL. Gradient elution was performed with (A) 0.1% (v/v) formic acid and (B) acetonitrile. The gradient of mobile phase B was used: 5% (5 min); 30% (30 min); 70% (40 min); 90% (45 min); 5% (47 min); 5% (50 min). Mass spectrometric detection was achieved with an ESI source operating in positive mode using nitrogen as the nebulizer gas. Mass Hunter software was used to operate the mass spectrometer (Agilent, USA). The parameters of the mass spectrometer were set as follows: nebulizer gas flow—3 L/min; drying gas—10 L/min; drying gas temperature—320 °C; fragmentor voltage—135 V; capillary voltage—4000 V; collision-induced dissociation pressure—230 kPa. The identification of extract components was performed with MS and MS/MS data, and compared with the previously reported results in the literature. Quantification was accomplished using the area normalization method (the ionization coefficients of the compounds were taken as equal to 1).

2.3. Green Synthesis of Silver Nanoparticles

Various concentrations (0, 0.625, 1.25, 2.5, 5, and 10 mM) of aqueous solution of silver nitrate (AgNO3) were prepared and used for the synthesis of silver nanoparticles exactly as we described in our previous study [18]. After mixing 1 mL of the freshly prepared aqueous extract of Enantia chloranta bark with 9 mL of AgNO3, the mixtures were shaken (200 rpm) in the dark for 24 h at 37 °C for the bioreduction process.

2.4. Characterization of Green-Synthetized AgNPs

The first step in characterization was visual observation. The color change in the solution from pale yellow to reddish-brown indicated the reduction of Ag + ions to Ag0 nanoparticles. We further analyzed the AgNPs with UV-Vis spectrophotometry, photon cross-correlation spectroscopy, energy dispersive X-ray fluorescence spectrometry, and Fourier transform infrared spectroscopy (FTIR).
UV–vis spectra were recorded with a PerkinElmer Lambda 950 spectrophotometer from 350 to 800 nm at a resolution of 1 nm and the extract-free AgNO3 solution was used as a blank.
Particle hydrodynamic size and distribution were investigated with a Nanophox instrument with UVette cuvettes (Sympatec GmbH, Clausthal-Zellerfeld, Germany), measurements were integrated to produce a single distribution with the PCCS Windox 5 software (Version 4.0, Sympatec GmbH, Clausthal-Zellerfeld, Germany), and the size distributions were obtained using the non-negative least squares algorithm. Standard latex samples (20 ± 2 nm) (Sympatec GmbH) and blank samples were analyzed before the measurements to ensure the high accuracy of the measurements.
An EDX-7000 Shimadzu energy-dispersive X-ray fluorescence (XRF) spectrometer was used with the following settings: range of measured elements—11Na–92U; X-ray generator—a tube with an Rh anode, air-cooled; voltage—4–50 kV; current—1–1000 μA; irradiated area—a circle of 10 mm in diameter; a silicon drift detector (SDD); counting method—a digital counting filter; the content of elements according to the value of intensity; automatic change of filters emitting the wavelengths of the corresponding elements; chamber size—300 mm × 275 mm × 100 mm. The X-ray fluorescence spectrum for each measurement was recorded with the same device settings: mylar film; collimator width—10 mm; exposure time—100 s; atmosphere—air; number of repeated measurements for one sample n = 3. To process the obtained results, we used OriginPro 2017 software (Version 94E, Origin-Lab Co., Northampton, MA, USA). The results obtained using the XRF method were presented in values of irradiation intensity expressed in cps/µA.
FTIR measurements were performed on AgNPs (centrifugated at 13,200 rpm for 1 h, pellet-recovered and washed 2 times with ethanol, then 3 times with distilled water and dried) and E. chlorantha bark crude dried extract using an Agilent Cary 630 FTIR spectrophotometer with a diamond ATR accessory (Agilent Technologies, Palo Alto, CA, USA). The spectral range was 4000–750 cm−1. The resolution was less than 2 cm−1, the correctness of the wavenumber was 0.05 cm−1, and the reproducibility of the wavenumber was 0.005 cm−1. The thickness of the absorbing layer was 1.5 nm (the clamping device guarantees the setting of optimal and reproducible pressure). Standard Agilent MicroLab Expert software was used to control the device, measure the data, and evaluate the quality of the obtained spectra, and the FTIR spectra were visualized in the wave number in the coordinates (cm, 1; transmission, %). All subsequent mathematical transformations of the spectral data array were performed using OriginPro 2017 software (Version 94E, Origin-Lab Co., Northampton, MA, USA).

2.5. Antimicrobial Activity

2.5.1. Inoculum Preparation

The different strains were cultured at 37 °C for 18–24 h in 10 mL of BHI broth for bacteria, or the same volume of sabouraud dextrose broth for fungi. After incubation, the culture media containing the cells were centrifugated (7000× g, 4 °C, 10 min), washed twice with sterile saline, and aseptically prepared in 5 mL of sterile saline to achieve a concentration equivalent to McFarland 0.5 using a DEN1 McFarland Densitometer (Grant-bio, Grant instruments Ltd., Cambridge, UK).

2.5.2. Preparation of Antimicrobial Solutions

From the Enantia chlorantha bark, the dried crude extract was simply dissolved in DMSO (5%, v/v) to achieve a stock solution concentration of 1024 µg/mL. Regarding the AgNPs, the solution containing silver nanoparticles green-synthetized with 1 mM of AgNO3 was centrifugated at 13,200 rpm for 1 h and the pellet was recovered, washed 2 times with ethanol then 3 times with distilled water, dried (at 42 °C until constant weight), then diluted to obtain the concentration of 1024 µg/mL. All the stock solutions were used to prepare the different concentrations used in the analytical process and were sterilized via microfiltration (0.22 µm) prior usage.

2.5.3. Assessment of Antimicrobial Activity and Dose-Dependent Effect Using Well Diffusion Method

We performed the well diffusion method as described in our previous study [21] without any modification. Briefly, after pouring 15 mL of sterile MHA (for bacteria) or SDA (For C. albicans) into Petri dishes, we spread 100 μL of each microorganism. Then, 20 μL of extract or AgNP (at 200,100; 50, and 10 µg/mL) was introduced into 20 μL wells that had been previously dug. All the trials were performed in triplicate. The sterile DMSO 5% used for extract preparation and sterile distilled water used for AgNP preparation were used as negative controls. After incubation at 37 °C for 24 h, the inhibition diameters were measured.

2.5.4. Determination of Minimum Inhibitory Concentration (MIC), Minimum Bactericidal Concentration (MBC), and Minimum Fungicidal Concentration (MFC)

MIC is the lowest concentration of antibacterial agent that completely inhibits the bacterial growth, while MBC (or MFC) is the lowest concentration that kills 99.99% of the microorganism tested. We assessed the MIC, MBC, and MFC of the extract and AgNPs using the microbroth dilution method in a sterile U-bottom 96-well microplate, as in our previous study [19], without any modification. Briefly, the wells of a U-bottom 96-well microplate were filled with 100 µL of sterile BHIB or SDB. Then, 100 µL of extract or AgNPs (1024 µg/mL) was added to the first row. Then, 100 µL of 5% DMSO and distilled water was added into the wells of columns 11 and 12, respectively. Serial dilutions were performed by transferring 100 μL from the wells of the first row to the wells of the second row, and so forth. Then, 10 μL of each inoculum was added in all wells of a single column. Finally, the plates were covered and incubated at 37 °C for 24 h. After incubation, MIC was considered the lowest concentration of the tested material that inhibited the visible growth of the bacteria. MBC and MFC were determined by subculturing the wells without visible growth (with concentrations ≥ MIC) on MHA plates. Inoculated agar plates were incubated at 37 °C for 24 h. MBC was considered the lowest concentration that did not yield any bacterial growth on agar.

2.5.5. Tolerance Level

As described by [22], the tolerance level of the tested bacterial strains against the extract or AgNPs was determined using the formula (Equation (10)):
Tolerance   = MBC   ( or   MFC ) MIC  
The tolerance level was interpreted as follows: MBC (or MFC)/MIC ≥ 16 indicates that the antibacterial efficacy should be considered as bacteriostatic, whereas MBC (or MFC)/MIC ≤ 4 indicates bactericidal activity.

2.5.6. Impact of Extract and AgNPs on Biofilm Formation

The antibiofilm activity was tested on Staphylococcus aureus ATCC 6538 and Escherichia coli ATCC 25,922, which are known to be biofilm producers [19,23]. The microtiter dish biofilm formation assay described by [24] was used. Briefly, 190 µL of the BHIB prepared with the extract or AgNPs to achieve different concentrations (equivalent to MIC/8, MIC/4, MIC/2, MIC, and 2MIC) was introduced in sextuplet (3 wells for the test and 3 as the specific negative control) in the sterile 96-well microtiter plate. BHIB free of extract and AgNPs was also used as a negative control. The test wells were inoculated with 10 µL of inoculum (See Section 2.5.1). After 48 h of incubation at 37 °C, the medium was removed from the wells and replaced with 200 µL of 1% (w/v) crystal violet solution for 90 s. The wells were rinsed three times with distilled water before drying at 37 °C. The biofilm-bound crystal violet was solubilized in 200 µL of 99% ethanol. The OD450 was measured and used to calculate the inhibition percentage, as in Equation (11) [24].
Inhibition ( % ) = OD   in   control OD   in   treatment OD   in   control × 100

2.5.7. Acute Toxicity Test and In Vivo Antimicrobial Activity

The toxicity was evaluated before the antimicrobial activity in vivo to avoid injecting the larvae with concentrations higher than lethal doses. The acute toxicity test was performed with the larval form of Galleria mellonella exactly as in our previous study [13]. Only the larvae with 0.2 to 0.5 g of weight were used. In brief, after preparing AgNPs and extract concentrations and distributing the larvae into groups of 20 larvae/group, 20 µL of each dilution was injected through the base of the last left proleg using a 0.3 mL Terumo® Myjector® U-100 insulin syringe (VWR, Russia). A control group of 20 larvae injected with 20 μL sterile physiological water was also included (“Not injected”). Larvae were incubated in the dark for 24 h at 37 °C and dead larvae were counted. Percentage survival was plotted as a function of the concentration of AgNPs using the spline cubic model in the statistical software XLSTAT 2020 (Addinsof Inc., New York, NY, USA), and the median lethal dose (LD50) was calculated. The mean weight of each group of larvae was used to extrapolate the LD50 in g/kg body weight using Equation (12):
LD 50   ( g / kg   body   weight ) = V o l u m e   administered   ( mL ) × LD 50 ( mg / mL ) × 10 3 Body   weight   ( kg )
Thereafter, the G. mellonella larvae were used to assess the in vivo antimicrobial activity of the extract and AgNPs against S. aureus ATCC 6538 and E. coli ATCC 25,922 as described in our previous study [19], with slight modifications. Larvae were randomly assigned to groups of 20. The microorganisms were prepared in physiological water (turbidity equivalent to 0.5 of McFarland) with non-lethal doses of antimicrobials (MIC/8, MIC/4, MIC/2, MIC, 2MIC). Then, 15 µL of each solution containing microorganisms and non-lethal antimicrobial solution was injected into the hemocoels of the larva via the last left proleg using a Terumo® Myjector® U-100 insulin syringe (VWR, Russia). Larvae were incubated at 37 °C in sterile Petri dishes and the number of surviving individuals was recorded daily for 5 days. The group injected with sterile physiological water was used as a negative control. The larvae were considered dead when they became unresponsive to touch and appeared black.

2.5.8. Modulation of Common Antibiotics with Extract and AgNPs, and Antibiotic Resistance Reversal Activity

The antibiotic resistance reversal activity of Enantia chlorantha bark extract (ECB) and AgNPs was tested with ampicillin, cefazoline, and nitrofurantoin in resistant bacteria (Table S1) using the checkerboard method, exactly as described in our previous study [20], and the fractional inhibitory concentration (FIC) index was calculated. Briefly, after determining the individual MICs of antibiotics (MIC-ATB), plant material extract (MIC-ECB), and AgNPs (MIC-AgNPs) on the test strain, the combination of extract or AgNPs with antibiotics was performed in the ratio of 50:50 and the new MICs were determined (MIC’-ATB, MIC’-ECB, and MIC’-AgNPs) using the microdilution method, as described above. The FIC was calculated as follows Equation (13):
FIC = FICA + FICB ,
  FICA = MIC ATB MIC   ATB
FICB = MIC   AgNPs   ( or   ECB ) MIC   AgNPs   ( or   ECB ) .
FIC ≤ 0.5 means synergy; 0.5 ≤ FIC ≤ 1, shows the addition of effects; 1 ≤ FIC ≤ 4 shows indifference; and FIC > 4 shows antagonism.
Impact of AgNPs and O-ECB on E. coli growth kinetic and H+-ATPase proton pumps:
Action on growth kinetic:
The impact of AgNPs and the extract on the growth kinetic was investigated on E. coli ATCC 25,922 in order to identify the phase in which the antibacterial effect is exerted. This test was performed with the same protocol applied by [25]. We used the extracts or AgNPs at MIC/4, MIC/2, MIC, and 2MIC, and the OD450 was measured at 0, 0.5, 1, 2, 4, 6, 8, 10, 12, 14, 24, and 48 h. BHIB with DMSO and inoculum was used as a negative control. OD versus time curves were used to present the results.
Action on H+ ATPase-mediated proton pumping:
The ability of E. chlorantha bark extract and AgNPs to inhibit E. coli ATCC 25,922 H+-ATPase-mediated pumping was carried out as described by [25]. We monitored the acidification of the external medium through pH measurement using a pH meter. The recorded pH values were used to plot the pH evolution curve as a function of time [pH = f (time)]. Any inhibition of the acidification of the medium in the presence of the extract or AgNPs has been assigned to the inhibitory effect of the H+-ATPase pumps.

3. Results

3.1. Mathematical Modeling and Optimal Conditions for Ethanolic Extraction

The optimization of any process is necessary to take maximum advantage of the added value produced by the studied process. In our context, we decided to optimize the ethanolic extraction process of Enantia chlorantha to obtain the best extraction yield and to identify the optimal conditions which would allow the best antimicrobial effect of this plant. To achieve this, we assessed the influence of three factors (percentage of ethanol, m/v ratio, and extraction time) on the three measured extraction parameters (volume yield, mass yield, and inhibition diameter of Staphylococcus aureus ATCC 6538). We remind the reader that the inhibition diameter of S. aureus ATCC 6538 constituted a response for two main reasons: on the one hand, this strain appeared very sensitive to E. chlorantha bark in the screening that we performed elsewhere [21], and on the other hand, it was reported that the diameter inhibition was directly related to the quality and quantity of the active compounds present in the antimicrobial solution tested [26].
Table 1 shows the raw results obtained after running the matrix of the three-factor Box–Behnken experiments with 15 trials. It can be seen from this table that the volume yield varied from 84 to 96%, the mass yield from 7.3 to 13.1%, and the diameter of inhibition from 8 to 27 mm.
To better appreciate the results obtained, the ANOVA and the modeling were carried out using Minitab 18 software.
Table 2 presents the analysis of variance for the regression models of the volume yield, mass yield, and inhibition diameter of S. aureus ATCC 6538. The validation parameters for the models are reported in Table 3.
The significance of the model terms and model equations were validated with respect to the p-value (p = 0.05). With p values of 0.001 and 0.002, the models of the three responses were highly significant. Overall, the linear coefficients were highly significant (p ˂ 0.0001) for all the responses, while the squares were significant for volume yield (p = 0.042) and mass yield (p = 0.011), and the two-way interaction was not significant for any response. More specifically, for volume yield, the significant terms were the ratio m/v (X2, p ˂ 0.0001), the square of the percentage of ethanol (X1 * X1, p = 0.020), the square of the percentage of ratio m/v (X2 * X2; p = 0.038), and the interaction between the percentage of ethanol and the ratio m/v (X1 * X2; p = 0.019). Regarding the mass yield, the linear terms (X1 and X2) and the square (X1 * X1) were significant (p ˂0.05). Only the linear terms (X1 and X2) were significant for the inhibition diameter of S. aureus ATCC 6538. The model validation terms, lack of fit, coefficient of determination (R2), adjusted R2 (adj-R2), AAD, Bf, and Af are presented in Table 3. The lack of fit for both models was not significant (p > 0.05), hence revealing that no considerable improvement was achieved by the inclusion of the statistically parametric values.
The coefficients of determination (R2) were 0.9805, 0.9849, and 0.9755 for volume yield, mass yield, and inhibition diameters, respectively. This indicates that the mathematical models can explain 98.05%, 98.49%, and 97.55% of the experimental observations as functions of independent variables, respectively. In addition, the adj-R2 of all the models (0.9455, 0.9576, and 0.9314, respectively, in the same order as above) were within close range of their respective coefficient of determination, indicating that the variability of each response can be explained by the independent variables involved in the process. Muala et al. [27] reported that R2 should at least be 80% for model fit; therefore, the empirical models of volume yield, mass yield, and inhibition diameter fit the actual data models. As suggested in the study of Muala et al. [27], in addition to R2, other validation model terms such as absolute average deviation (AAD), bias factor (Bf), and accuracy factor (Af) are of great interest to be considered. They measure the relative average deviation of predicted and observed responses. An AAD of 0 and a bias factor and an accuracy factor of 1 indicate model adequacy. In this study, all the validation terms fell within the accepted range of model validity, which affirms the validity of the model (Table 3). The empirical equations developed for volume yield (Equation (16)), mass yield (Equation (17)), and inhibition diameter (Equation (18)) are as follows:
Volume   yield   ( % ) = 93.33 + 0.5 X 1 4.625 X 2 + 0.375 X 3 1.542 X 1 2 1.292   X 2 2 0.292 X 3 2 1.5 X 1 X 2 + 0.25 X 2 X 3
Mass   yield   ( % ) = 8.73 + 2.425 X 1 + 0.525 X 2 0.025 X 3 + 1.121 X 1 2 0.329   X 2 2 0.471 X 3 2 + 0.525 X 1 X 2 + 0.025 X 1 X 3 0.125 X 2 X 3
D   ( mm ) = 17.0 + 7.25 X 1 + 1.875 X 2 0.125 X 3 + 1.375 X 1 2 0.375   X 2 2 + 1.125 X 3 2 X 1 X 2 0.5 X 1 X 3 0.75 X 2 X 3

3.1.1. Singular Influence of Factors on the Responses

The influence of each factor (percentage of alcohol, ratio m/v, and extraction time) involved in the extraction process on the responses (volume yield, mass yield, and inhibition diameter of S. aureus ATCC 6538) was visualized thanks to the main individual effect plots (Figures S1–S3). As shown in Figure S1, an increase in the ratio m/v significantly (p ˂ 0.0001; Table 2) induces a decrease in volume yield. This could be explained by the fact that a very large amount of powder of Enantia chlorantha bark causes saturation of the solvent, and easily clogs the mesh of the filter during filtration, which requires several changes of filters and results in a loss of volume. In addition, the higher the percentage of ethanol, the greater the mass yield (Figure S2) and antimicrobial activity against the S. aureus ATCC 6538 test strain. The low antimicrobial activity of the extracts with the lowest levels of ethanol could be ascribed to the insoluble nature of metabolites extracted with ethanol as a solvent opposite to water (Level −1; 0%). Indeed, Onivogui et al. [28] reported that most bioactive compounds endowed with antimicrobial activity such as flavonoids, polyphenols, tannins, and alkaloids are generally insoluble in water. In a study conducted by Mouafo et al. [29], it was also highlighted that ethanol extracted more antimicrobial compounds from plant materials opposite to water. A similar conclusion was also stated by Evbuomwan et al. [30]. Finally, although the m/v ratio has a significant influence on both the mass yield (p = 0.016) and the diameter of inhibition (p = 0.018) (Table 2), Figures S2 and S3 show that the singular action of these two factors is positive but moderate.

3.1.2. Effect of Interactions between Factors on the Volume Yield, Mass Yield, and Inhibition Diameter of S. aureus ATCC 6538

The influence of the combinations of % EtOH–ratio m/v, % EtOH–time and ratio m/v-time on the volume yield (Figure S4), mass yield (Figure S5), and inhibition diameter (Figure S6) were visualized using an interaction plot in Minitab 18 software. As observed above, with the singular impact of the m/v ratio on the volume yield, this factor even combines with the percentage of ethanol, and the extraction time negatively affects the volume yield (Figure S4). This highly significant influence (p = 0.019, Table 2) is better illustrated in the contour plot showing the evolution of the volume yield as a function of the ratio m/v and the percentage of ethanol (Figure S7). Indeed, the highest volume yield (>96%) is reached when the percentage of ethanol approaches 100% and when the m/v ratio approaches its minimum, which is 10/100. Moreover, as shown in Figure S4, regardless of the time taken for extraction, when combined with the percentage of ethanol, there is no variation in the volume yield (on average 94%). Regarding the mass yield and the inhibition diameter of Enantia chlorantha bark extract against S. aureus ATCC 6538, the m/v ratio combined with the percentage of ethanol as well as the percentage of ethanol combined with the extraction time both positively affected both responses, but not significantly (p > 0.005, Table 2). As for the ratio m/v–extraction time interaction, it did not vary either the mass yield or the inhibition diameter.
Based on the volume yield, these results suggest that the extraction time can be set at its minimum level (−1, 6 h) without any significant impact on the result of the extraction process; however, these low variations in volume yield should consequently be considered in the optimization (by setting it at 95%, for example), so that the optimization takes greater account of the other responses.

3.1.3. Determination of Optimal Conditions

Composite desirability was carried out to find the composite optimum by maximizing the mass yield and inhibition diameter without optimizing the volume yield (Table 4). We, therefore, performed the extraction at the composite optimum (% EtOH—100%; ratio m/v—20 g/mL; and extraction time—6 h). The experimental values of mass yield, inhibition diameter of Staphylococcus aureus ATCC 6538, and volume yield obtained at the optimal conditions were 14.3%, 31 mm and 93%, respectively. Compared with the predicted response of 13,595% and 28,625 mm for mass yield and inhibition diameter, the experimental data were in conformity. In other studies with the same plant, mass yields of 12% were obtained with 70% ethanol and an m/v ratio of 16 g/100 mL for 48 h [31,32]. In the same vein, comparing the results of this study to those of our previous work [21], where we performed the extraction with 80% ethanol and 10 g/100 mL for 24 h, we obtained a mass yield of 9.3%, which is less than 35% of the current mass yield. This improvement in yield and time saving could be highly significant if the extraction of the active compounds of this plant was to be carried out on a large scale, since numerous therapeutic virtues have been attributed to it in several studies (see the minireview of [9], who gathered in a single document all of the benefits reported on this plant). Finally, although the difference in results can be attributed to the different extraction conditions, the settings reported in this study are highly recommended since they can save valuable time while obtaining superior extraction performance and the extraction of an optimum quantity of active compounds, materialized here by the inhibition diameter of the extracts against S. Aureus ATCC 6538.

3.2. Phytochemical and Mineral Composition of the Optimized Extract (O-ECB)

The HPLC–MS/MS chromatogram of the optimized ethanolic extract of Enantia chlorantha bark (O-ECB) recorded a total of 11 peaks (Figure S8) corresponding to the bioactive compounds that were recognized by relating their peak retention time, peak area (%), height (%), and mass spectral fragmentation (m/z, MS and m/z, MS/MS) patterns to those of the known compounds (Table 5). The compounds identified were exclusively protoberberine alkaloids among which the major constituents were palmatine (51.63%), columbamine +7,8-dihydro-8-hydroxypalmatine (19.21%), jatrorrhizine (11.02%), and pseudocolumbamine (6.33%). Four (4) compounds (compounds 1, 2, 3, and 6) were not clearly identified and seem to have never been reported in the literature.
In addition, the X-ray fluorescence spectrum made it possible to qualitatively assess the microelement present in O-ECB. As shown in Table 6, the minerals found were sulfur (S), silicon (Si), chlorine (Cl), potassium (K), calcium (Ca), manganese (Mn), iron (Fe), zinc (Zn), and bromine (Br). The highest mean fluorescence intensities were recorded for Br (4.6529 cps/uA), Fe (3.4854 cps/uA), and Cl (2.5942 cps/uA), which could mean that these minerals are the most abundant in O-ECB. Similarly, the elemental composition of the AgNP solution is provided in Table S2.

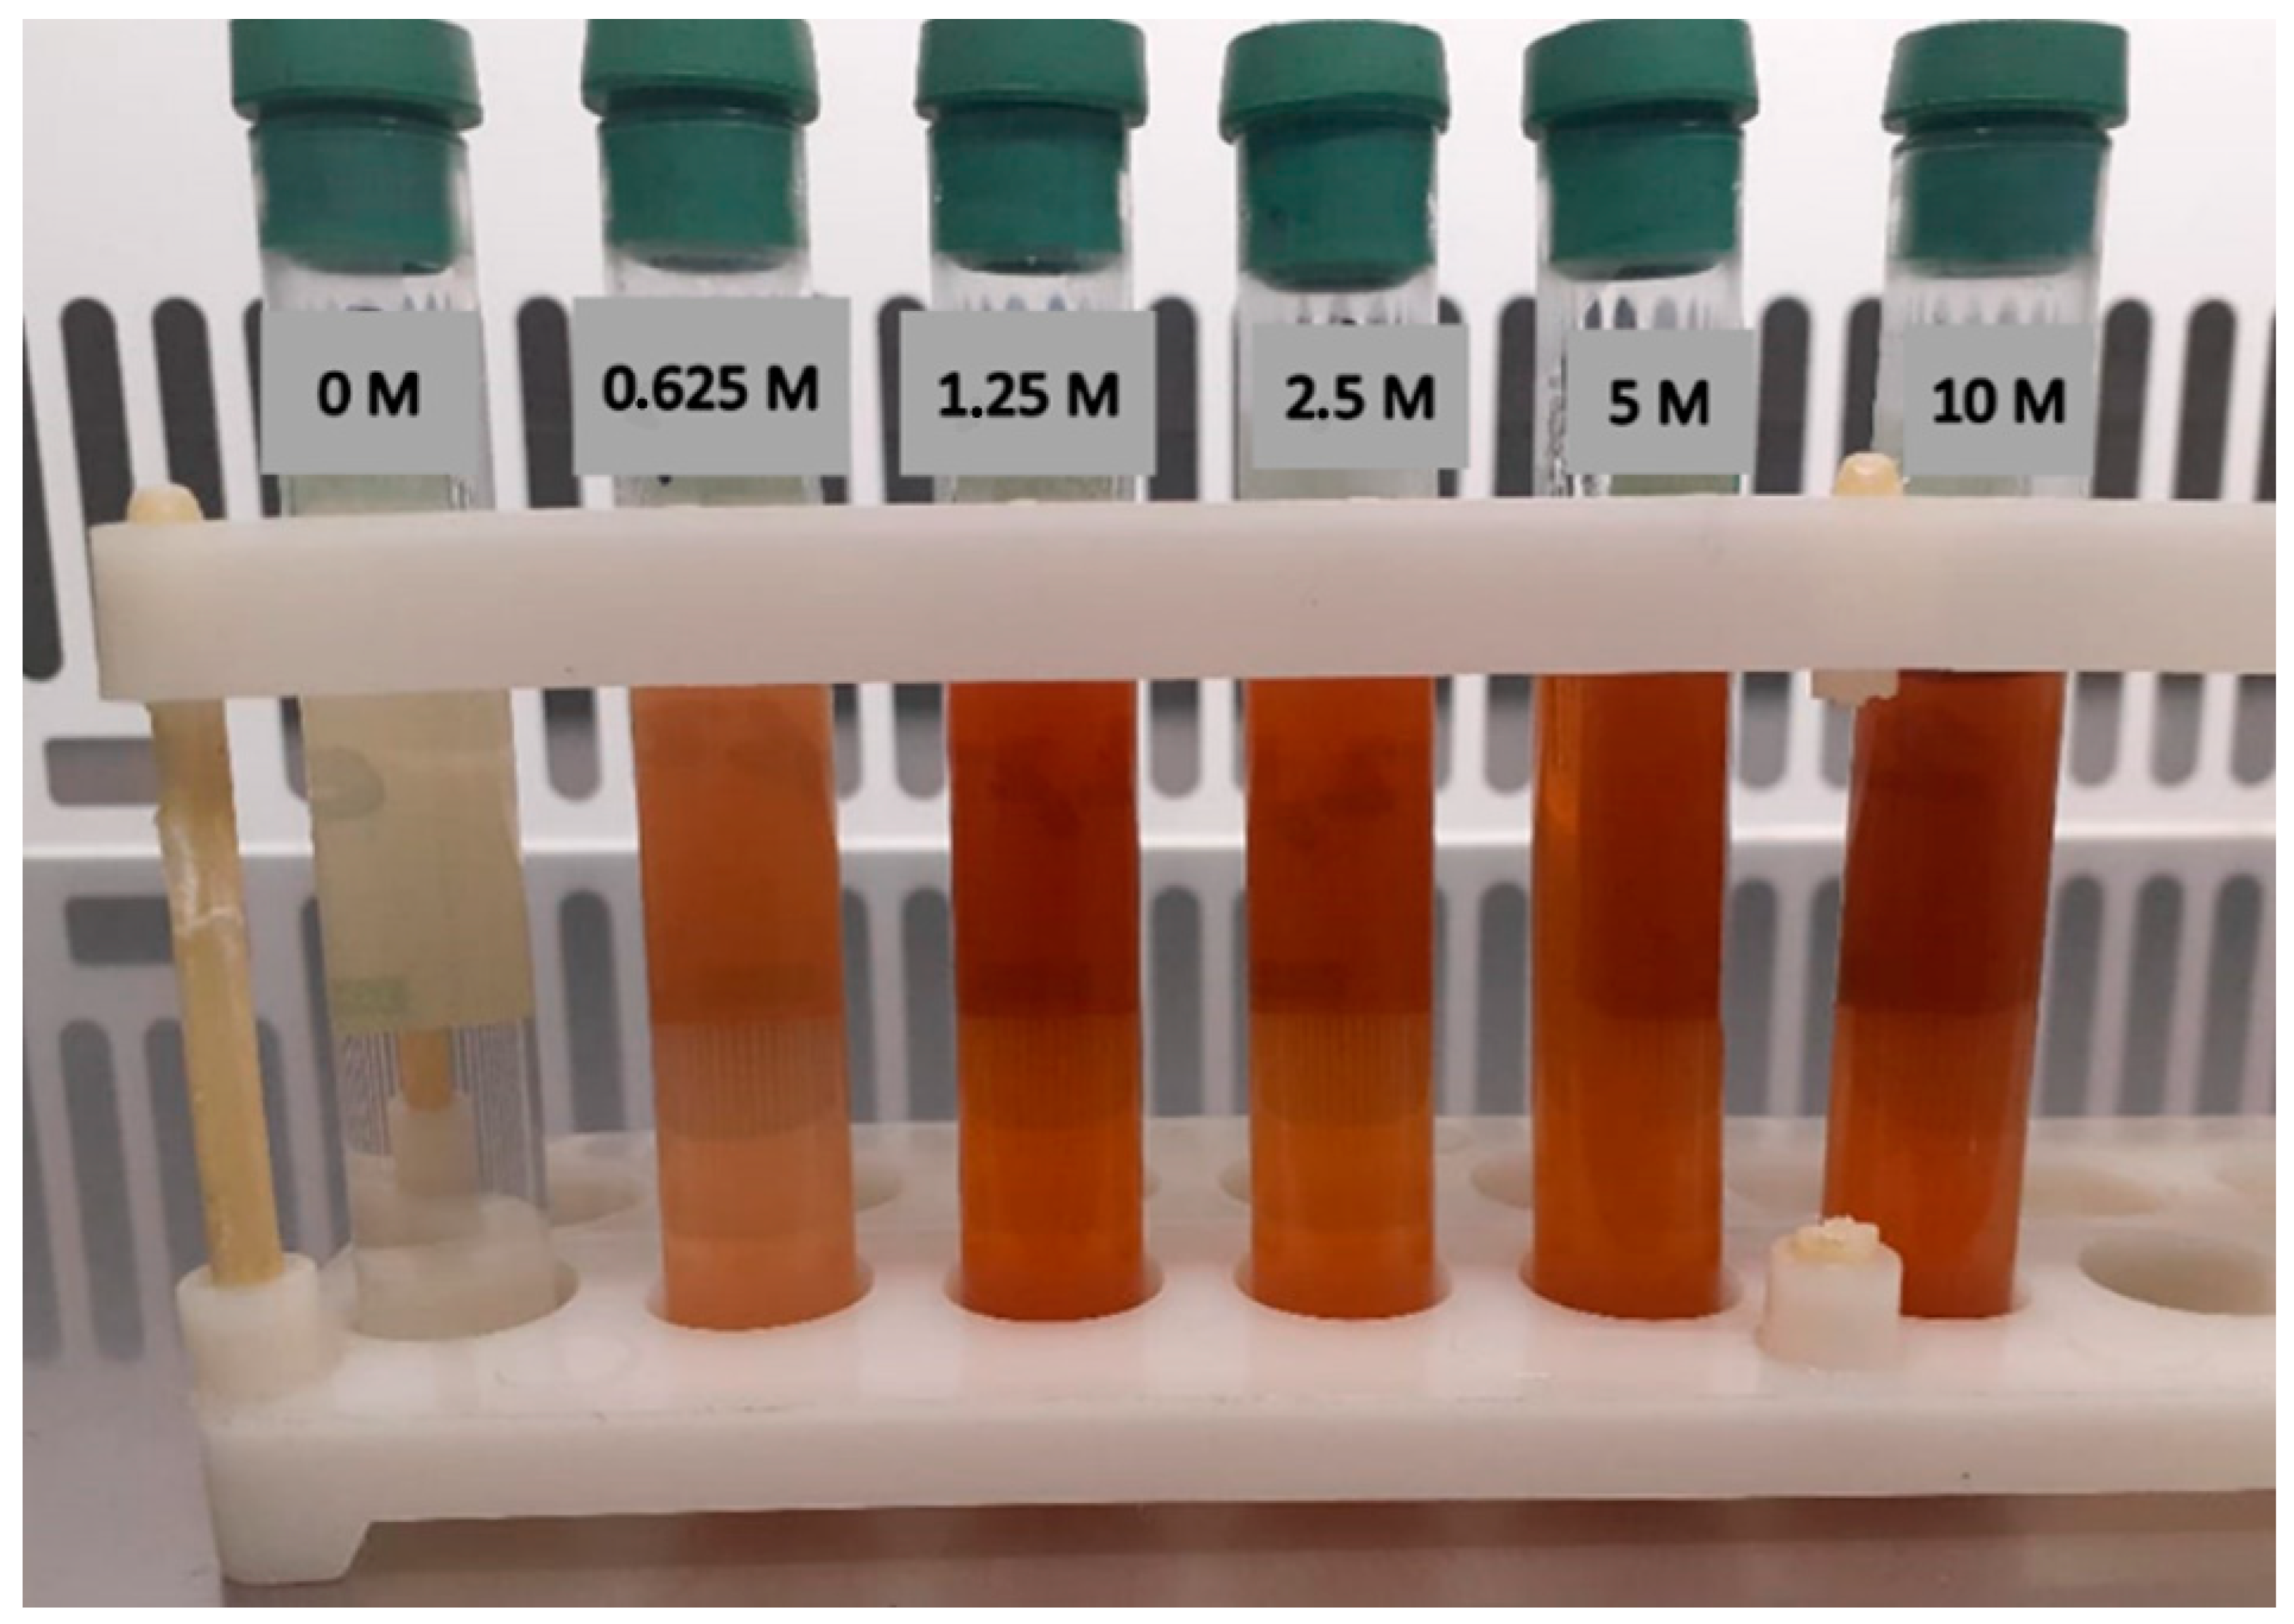
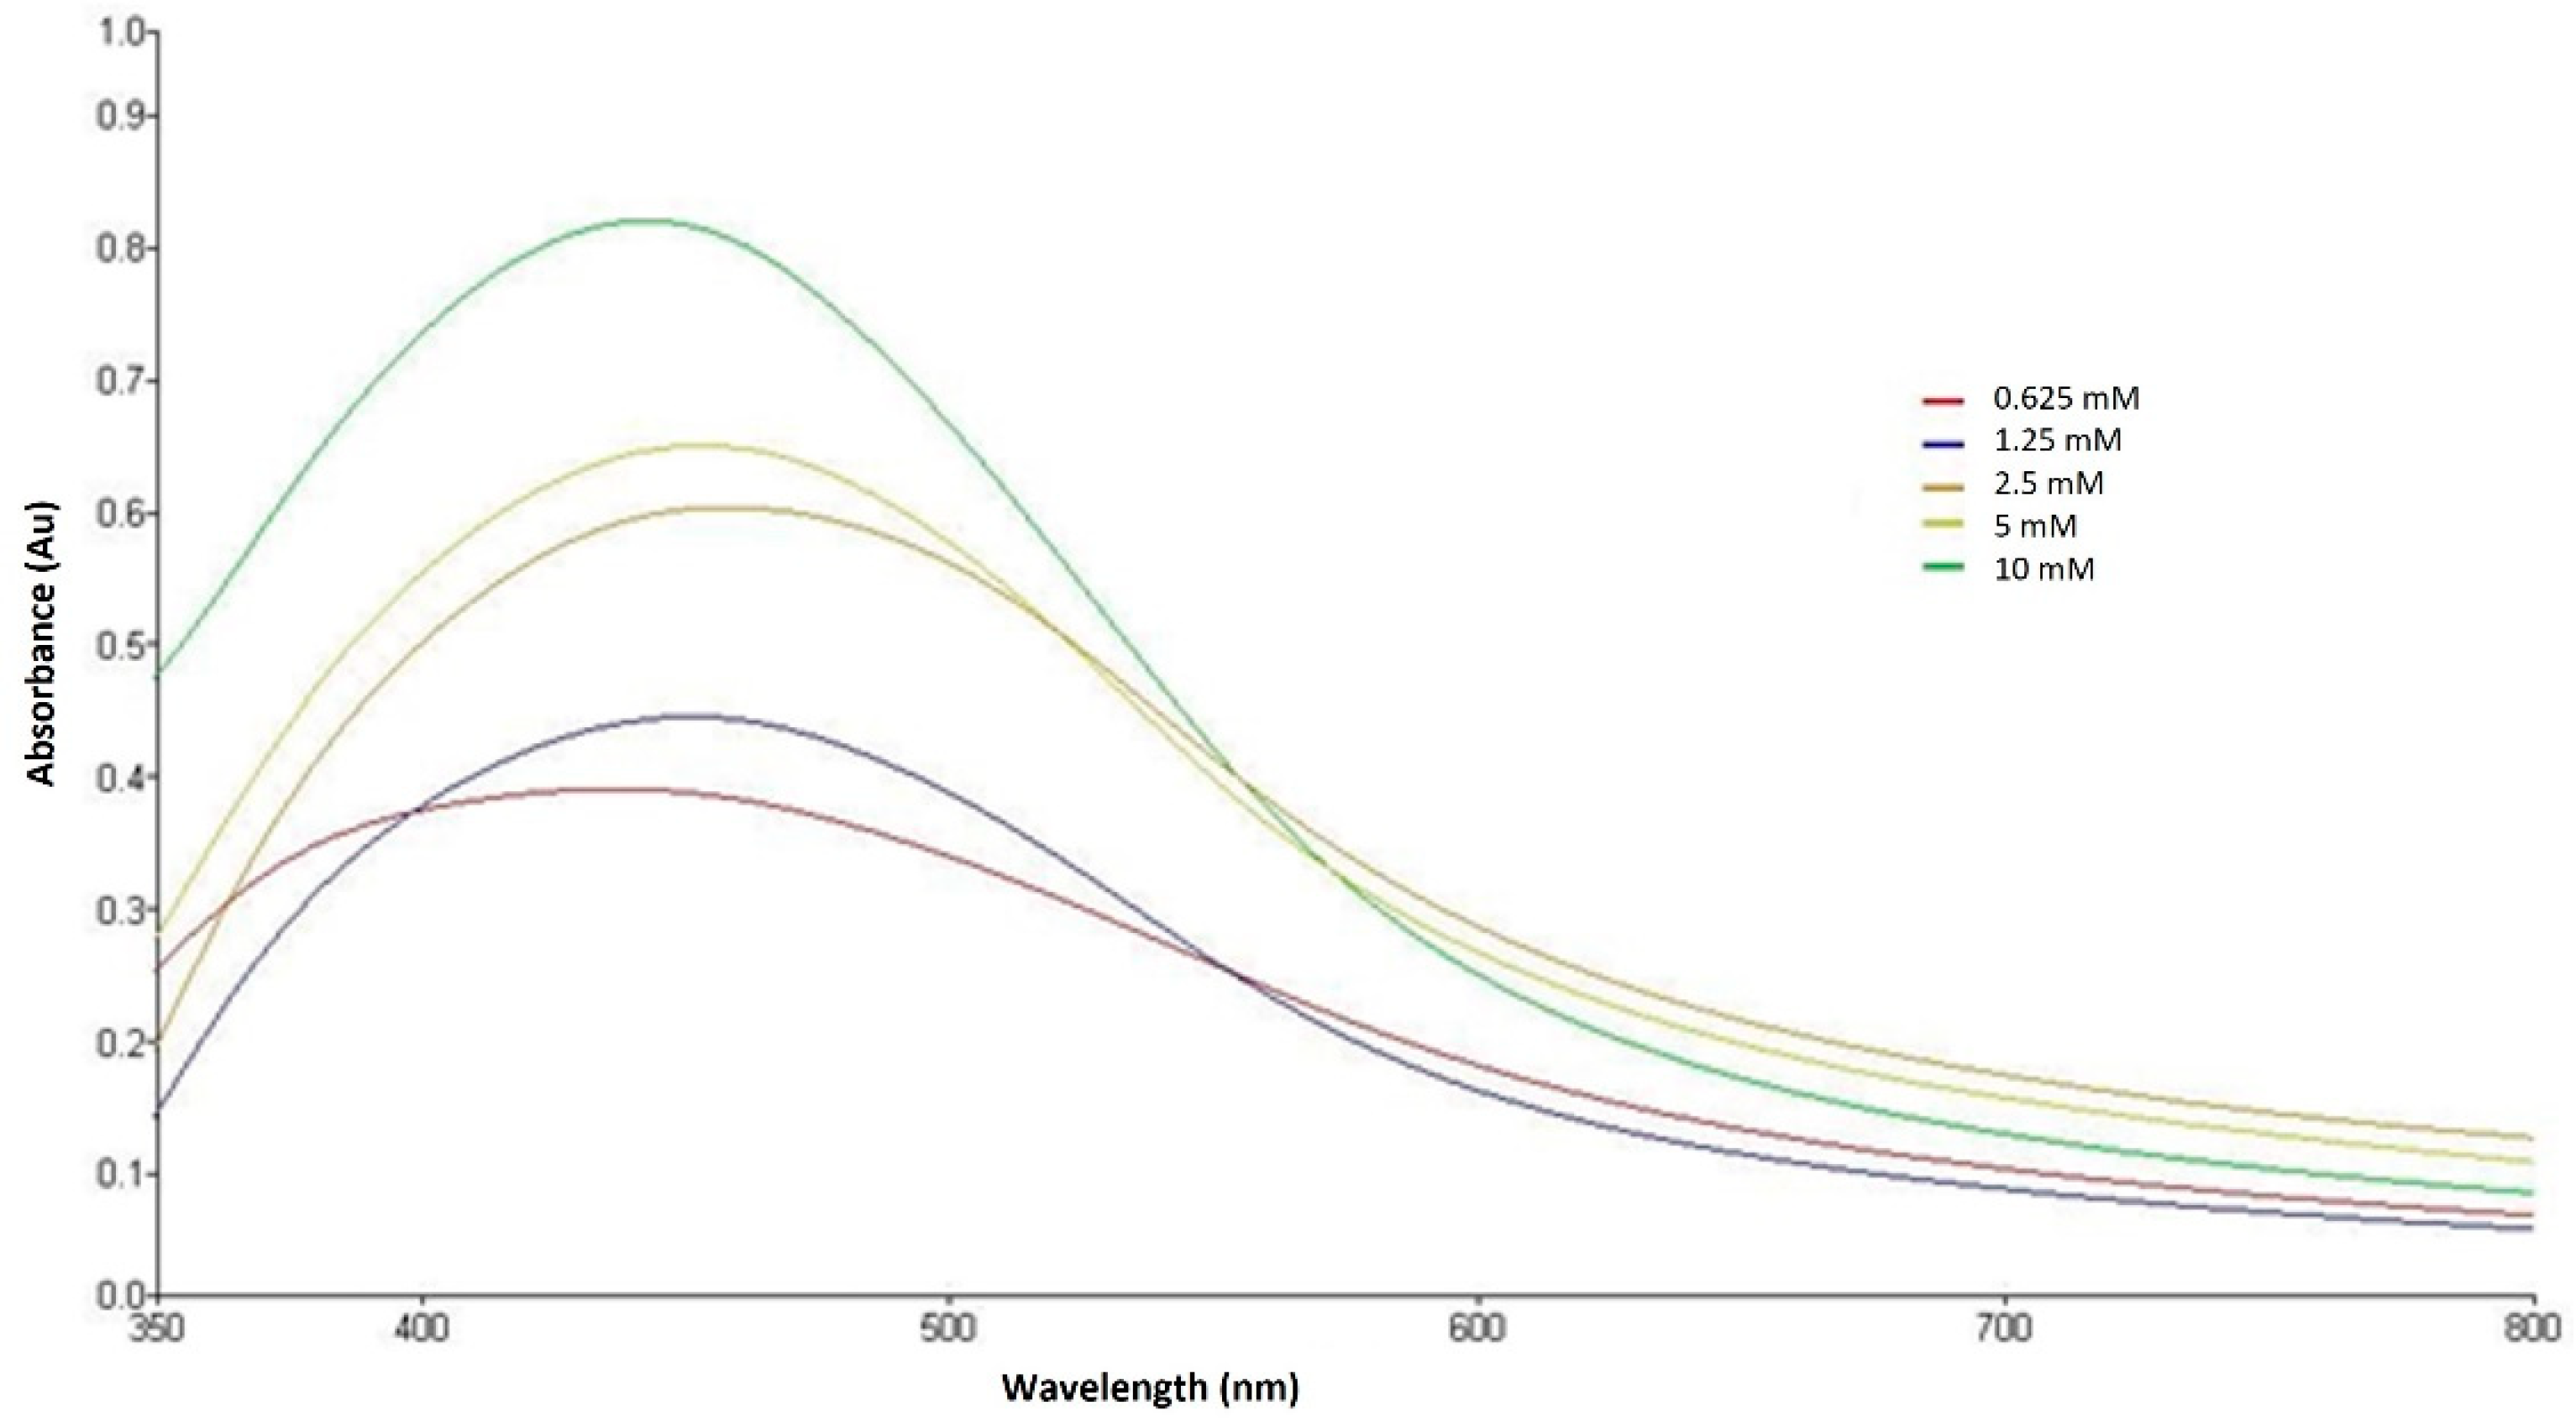
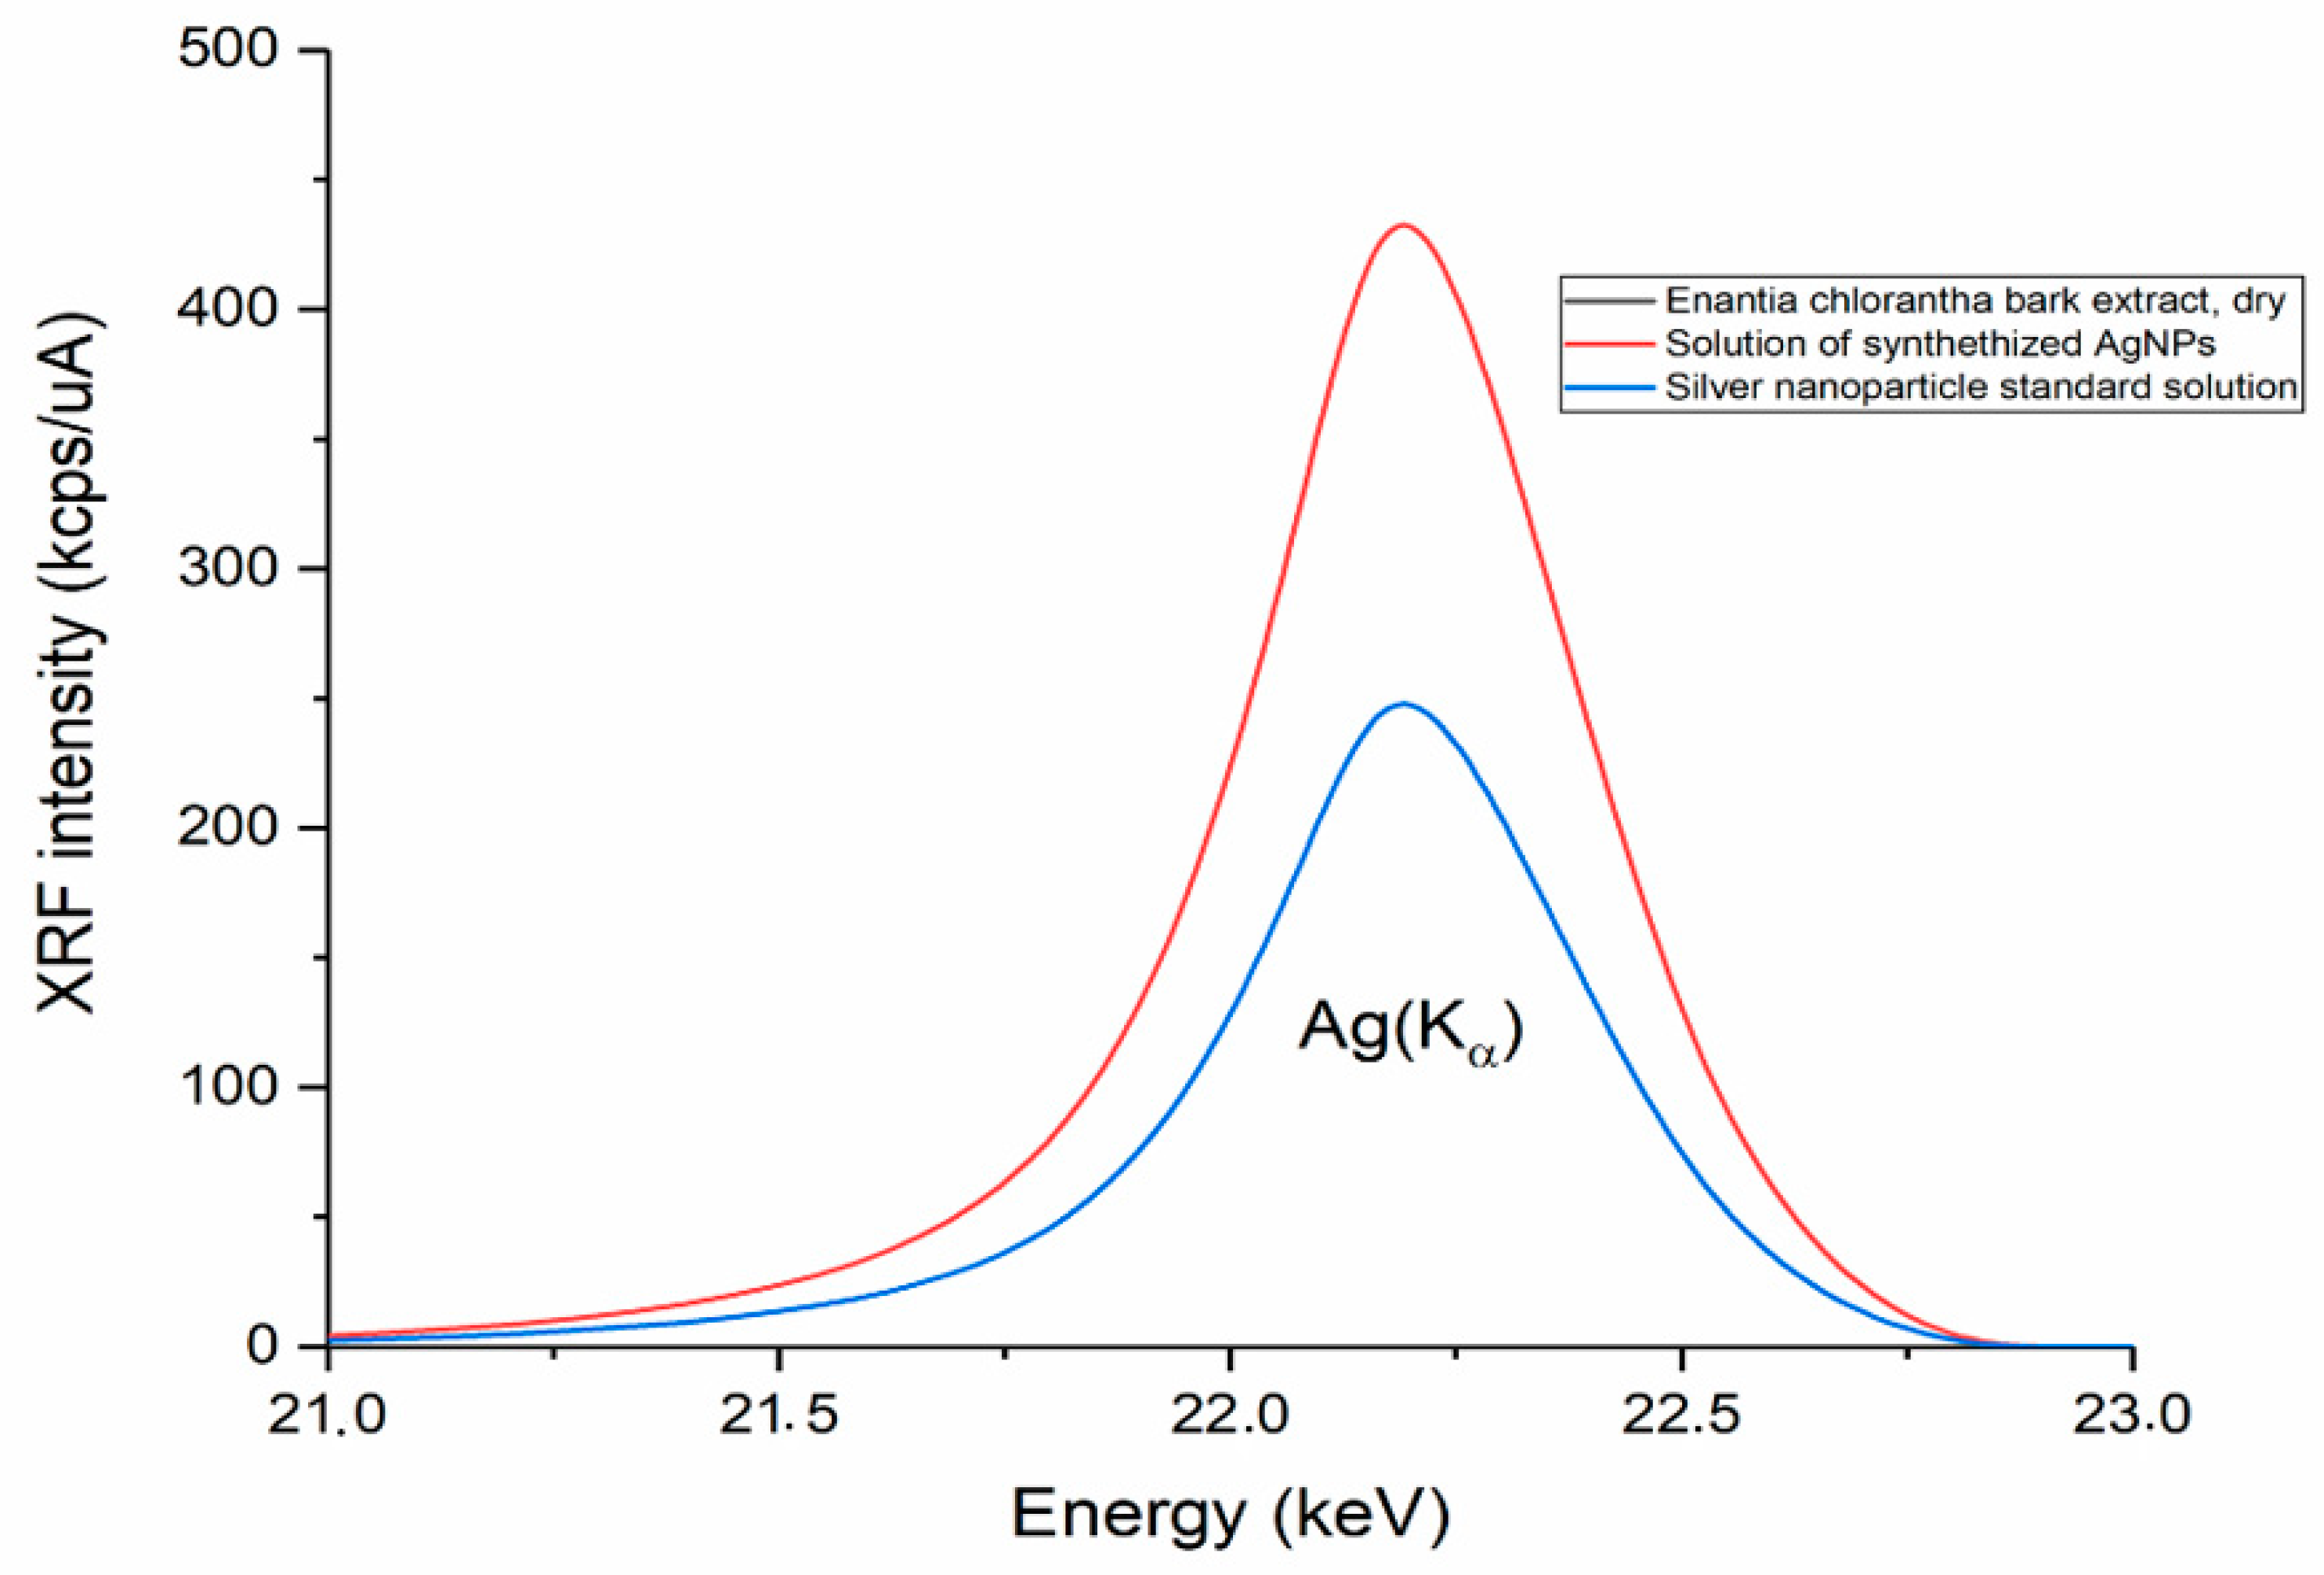
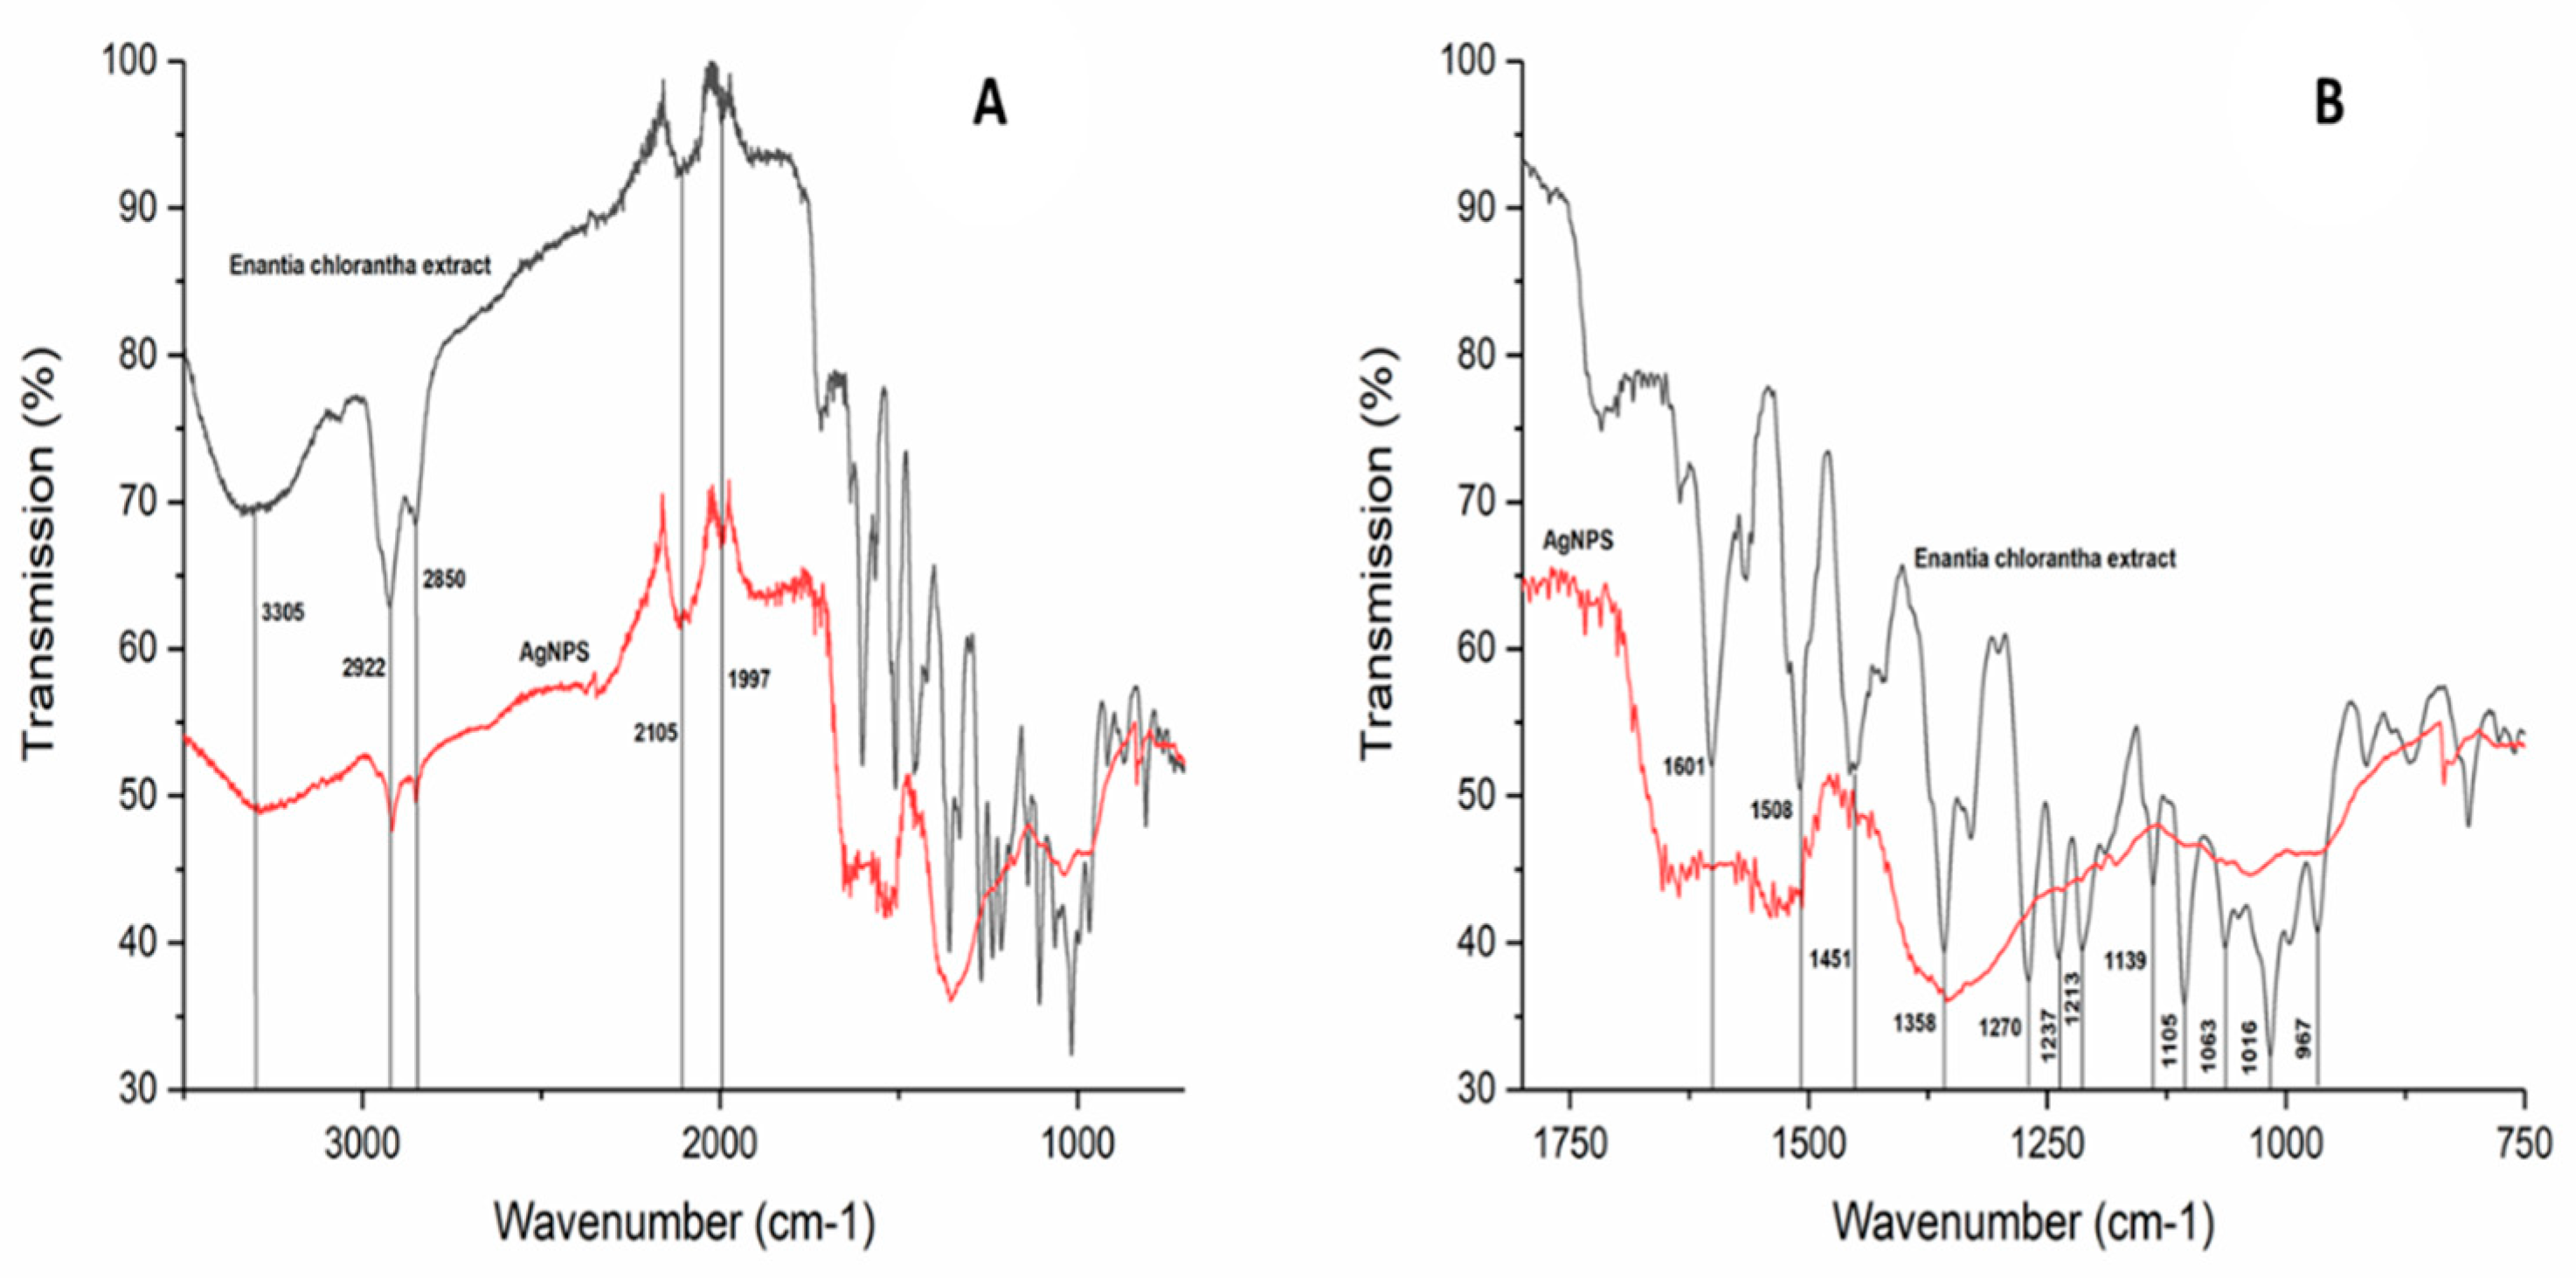
3.3. Silver Nanoparticles Green-Synthetized Using Enantia chlorantha Bark

The reduction of silver nitrate using the bark extract of Enantia chlorantha led to a color change in the reaction solutions from colorless to yellowish-brown, with an accentuation of the color as the concentration of AgNO3 increased (Figure 1). Other studies have reported similar observations [33,34]. This color change, which is characteristic of the formation of silver nanoparticles (AgNPs), has been attributed to the excitation of surface plasmon vibrations in AgNPs [33,34,35]. In addition, by using UV–Visible spectra, the maximum absorbance peak of solutions containing the synthetized AgNPs was seen between 430 and 450 nm, with absorbance increasing (from 0.33 to 0.82) with the concentration of AgNO3 (Figure 2). Similarly, Vadlapudi and Amanchy [35] reported that the absorption spectra of the silver nanoparticles formed in the reaction media have an absorbance peak at 434 nm. In the same vein, several authors have reported that the absorption spectra of silver nanoparticles formed in the reaction media have an absorbance peak at 430–450 nm [36,37,38,39].
Referring to the literature, only the solution containing the AgNPs synthesized with the lowest concentration of AgNO3 (1.25 mM) was considered for the rest of the study. X-ray fluorescence analysis confirmed the presence of Ag in the reaction media by a characteristic peak in the spectrum at the silver Kα line of 22.105 keV (Figure 3). It is important to highlight that instead of the reaction mixture (extract + AgNO3), the washed and dried AgNPs were resuspended in distilled water for XRF analysis because the Ag+ ions of the reaction mixture could have biased the result. Indeed, it is well known that XRF analysis cannot distinguish ions of the same element in different valence states and detects all elements regardless of their form (here, Ag or Ag+) in the solution [40]. Otherwise, the fluorescence intensity turned out to be higher in the solution of synthesized nanoparticles, which may indicate a higher concentration of Ag compared with the control (standard 2 nm silver nanoparticles at 8 ppm).
In addition, photon cross-correlation spectrometry revealed that the AgNPs had an average hydrodynamic diameter ×50 of 59.74 nm (Figure S9) and were stable at the initial measurement point (Figure S10). However, after follow-up for 12 weeks, we found that AgNPs exposed to light formed a blackish precipitate (sign of instability) while no change was observed with those kept in the shade. A study conducted by Mittelman et al. [41] which aimed to assess the effects of ultraviolet light on silver nanoparticle mobility and dissolution, revealed that a 3-day UV exposure resulted in up to a 5-fold increase in mean diameter, a 10 to 15 mV increase in zeta potential, red shifts in surface plasmon resonance, and up to a 25-fold increase in Ag + release. They finally concluded that exposure to UV light significantly enhances AgNP retention and dissolution, and thus, the oxidative aging of AgNPs is likely to enhance Ag + release. Although the AgNPs synthetized in the present study were not exposed to UV, we can assume that the same mechanism is involved in the loss of stability of AgNPs exposed to light; therefore, the conservation of AgNPs in darkness is highly recommended.
Furthermore, the FTIR spectra (Figure 4A,B) of the Enantia chlorantha extract and synthesized AgNPs were examined to identify the possible biomolecules responsible for capping and the efficient stabilization of the metal nanoparticles synthesized. The broad bands between 3200 and 3500 cm−1 on both spectra correspond to the O-H bond from jatrorrhizine, pseudocolumbamine, columbamine, or 7,8-dihydro-8-hydroxypalmatine, or from one of the unidentified compounds found in the extract (Table 5). The two peaks at 2922 cm−1 and 2850 cm−1 correspond to the C-H stretch, and the assignments at 2105 and 1997 cm−1 correspond to the double bond of the carbon frame present in palmatine and its derivatives found in the extract (Table 5). In general, according to the presence of absorption bands in the range from 3500 to 2000 cm−1, the IR spectrum of synthesized AgNPs repeats the structure of the extract spectrum. Figure 4B shows a strengthened fragment of the FTIR spectrum in the wavenumber range from 1750 to 750 cm−1. The synthetized AgNPs did not exhibit absorption peaks at 1717 cm−1 due to C=O, and at 1270 and 1237 cm−1 due to the C-N functional groups, respectively. The five peaks identified at 1213, 1139, 1105, 1063 and 1016 cm−1 correspond to different states of C–O stretching from functional groups of palmatine and its derivatives found in E. chlorantha bark extract (Table 5). Modified outlines of those bands are traced in the second spectra, indicating the AgNPs are covered with the mentioned compounds.
FTIR analysis confirmed that the bioreduction of Ag + ions to silver nanoparticles is due to the reduction in the capping material of the plant extract. As reported by others [42,43], AgNPs are probably stabilized by bioactive components of the bark extract such as alkaloids (Table 5), which might have formed a layer on the silver nanoparticles (biological capping) preventing agglomeration.

3.4. Antibacterial Activity of E. chlorantha Bark and Its AgNPs

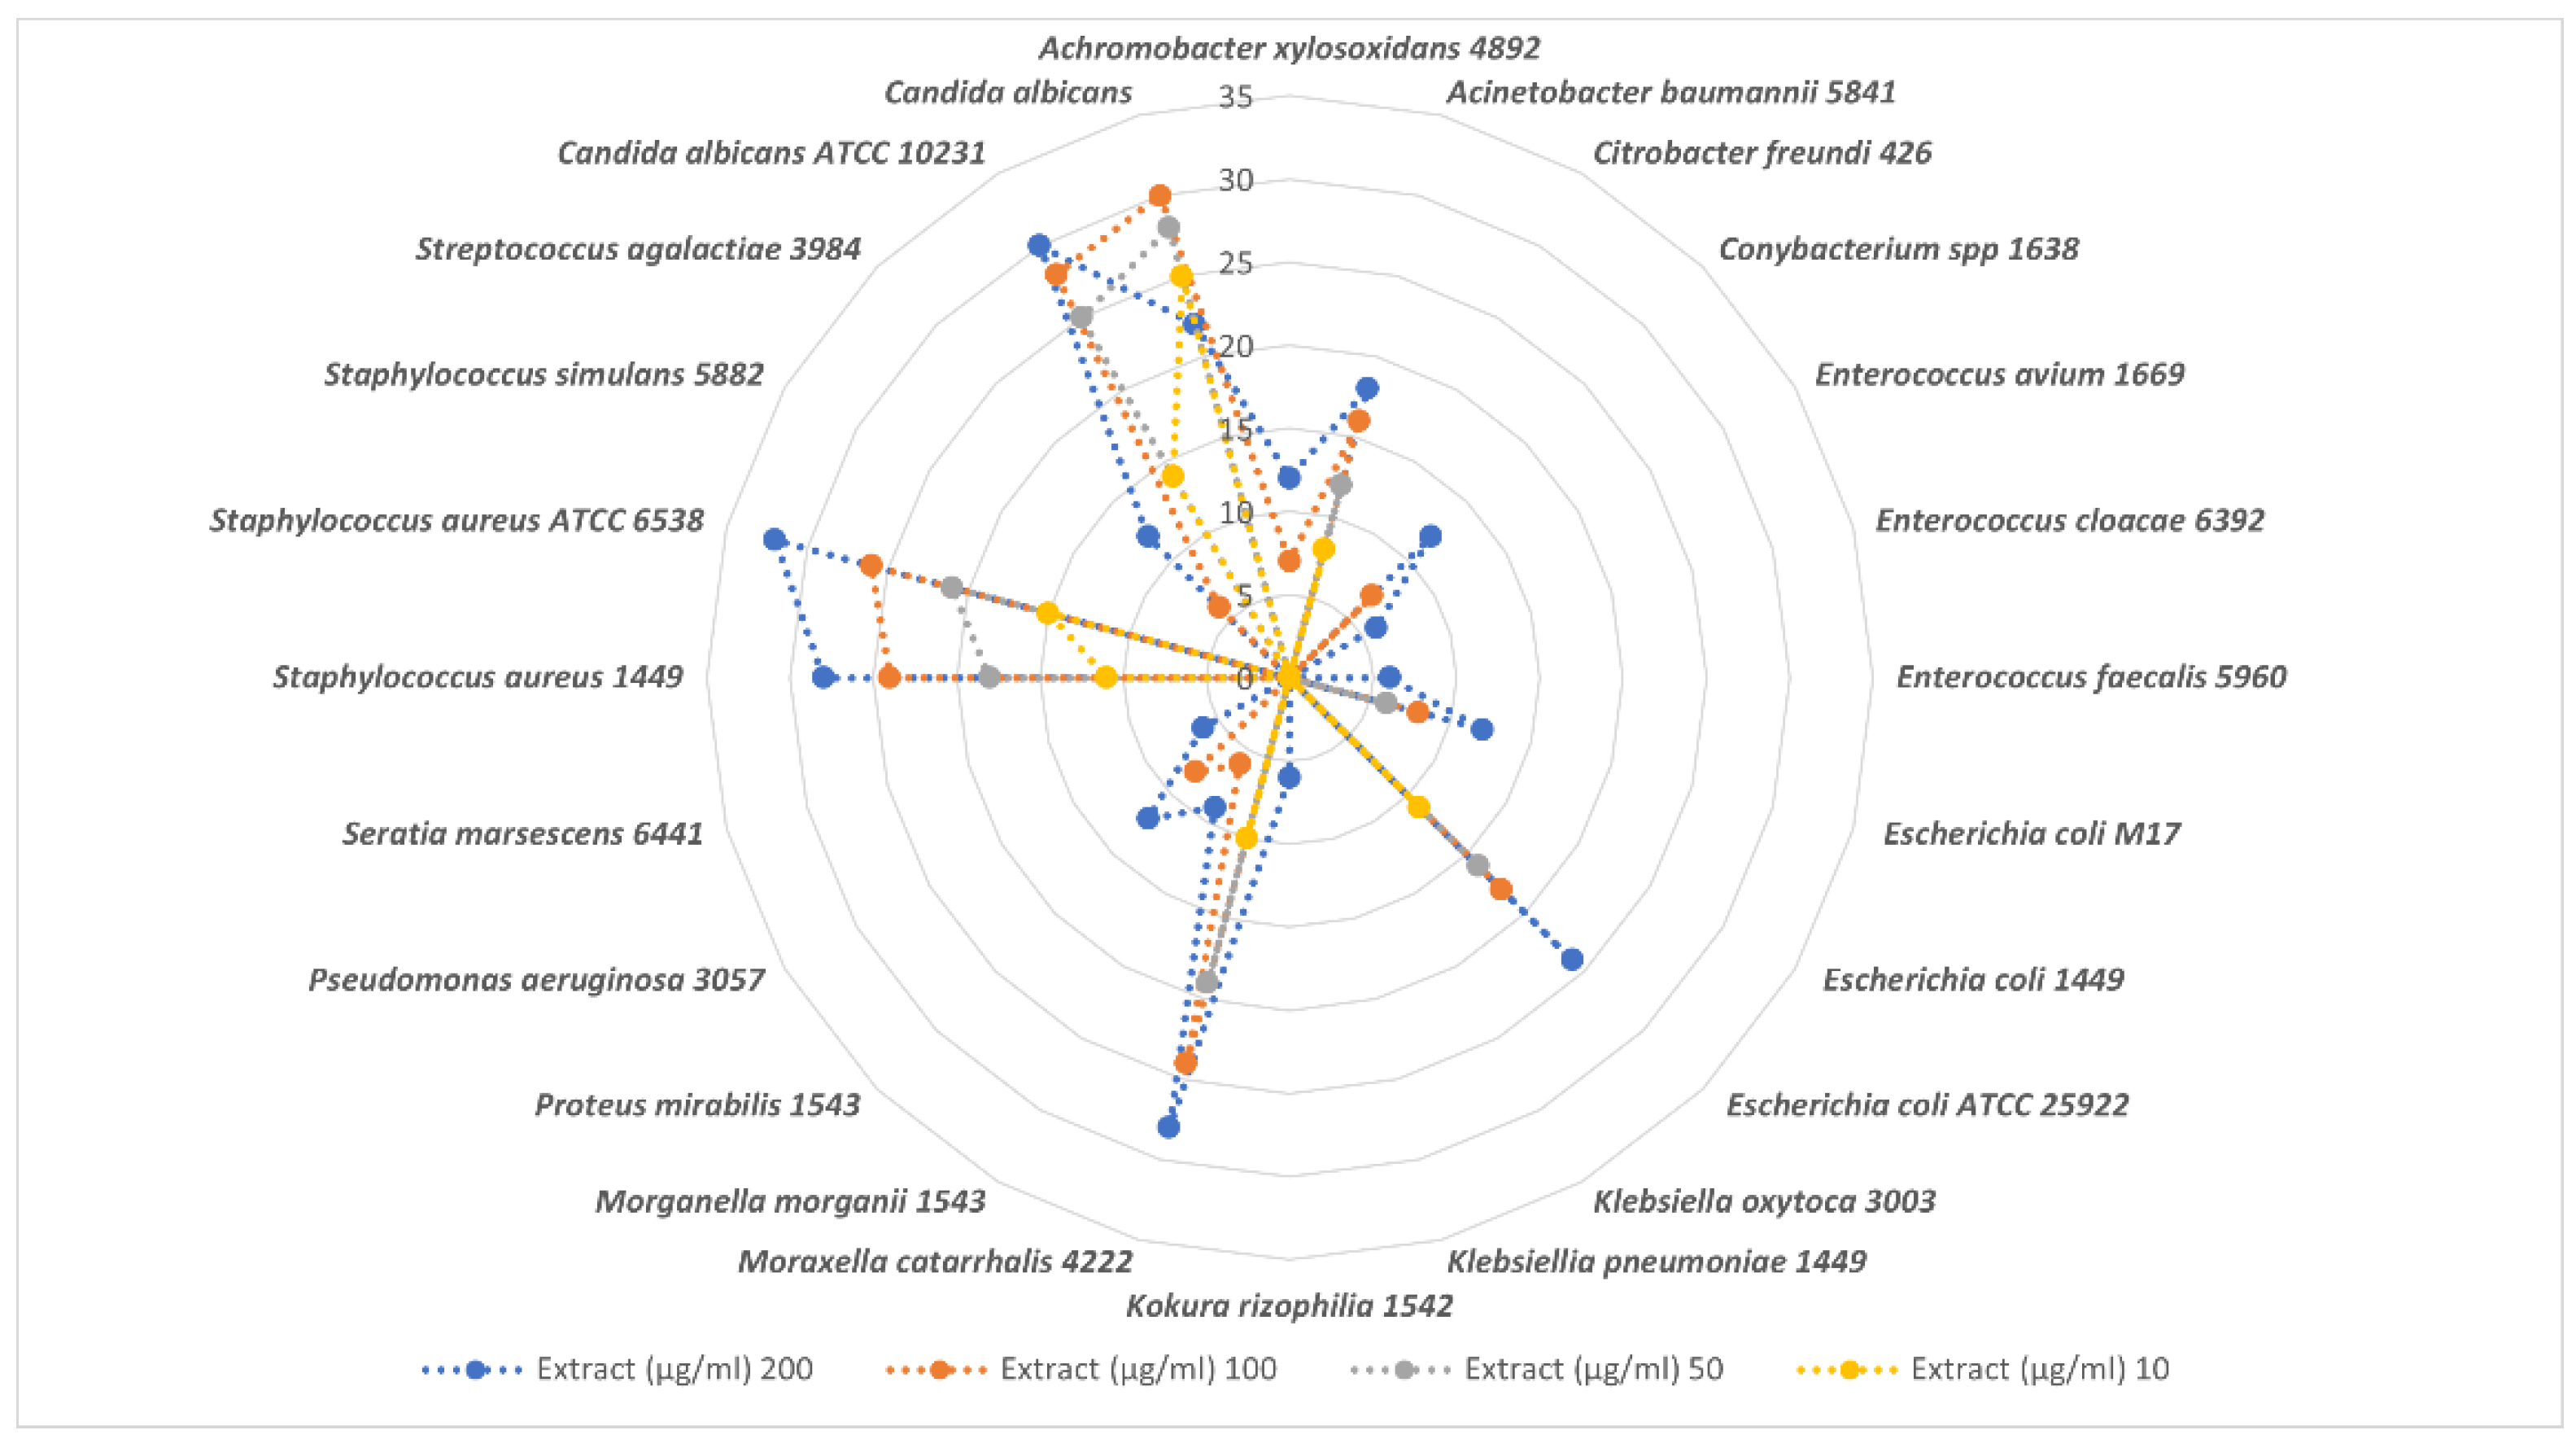
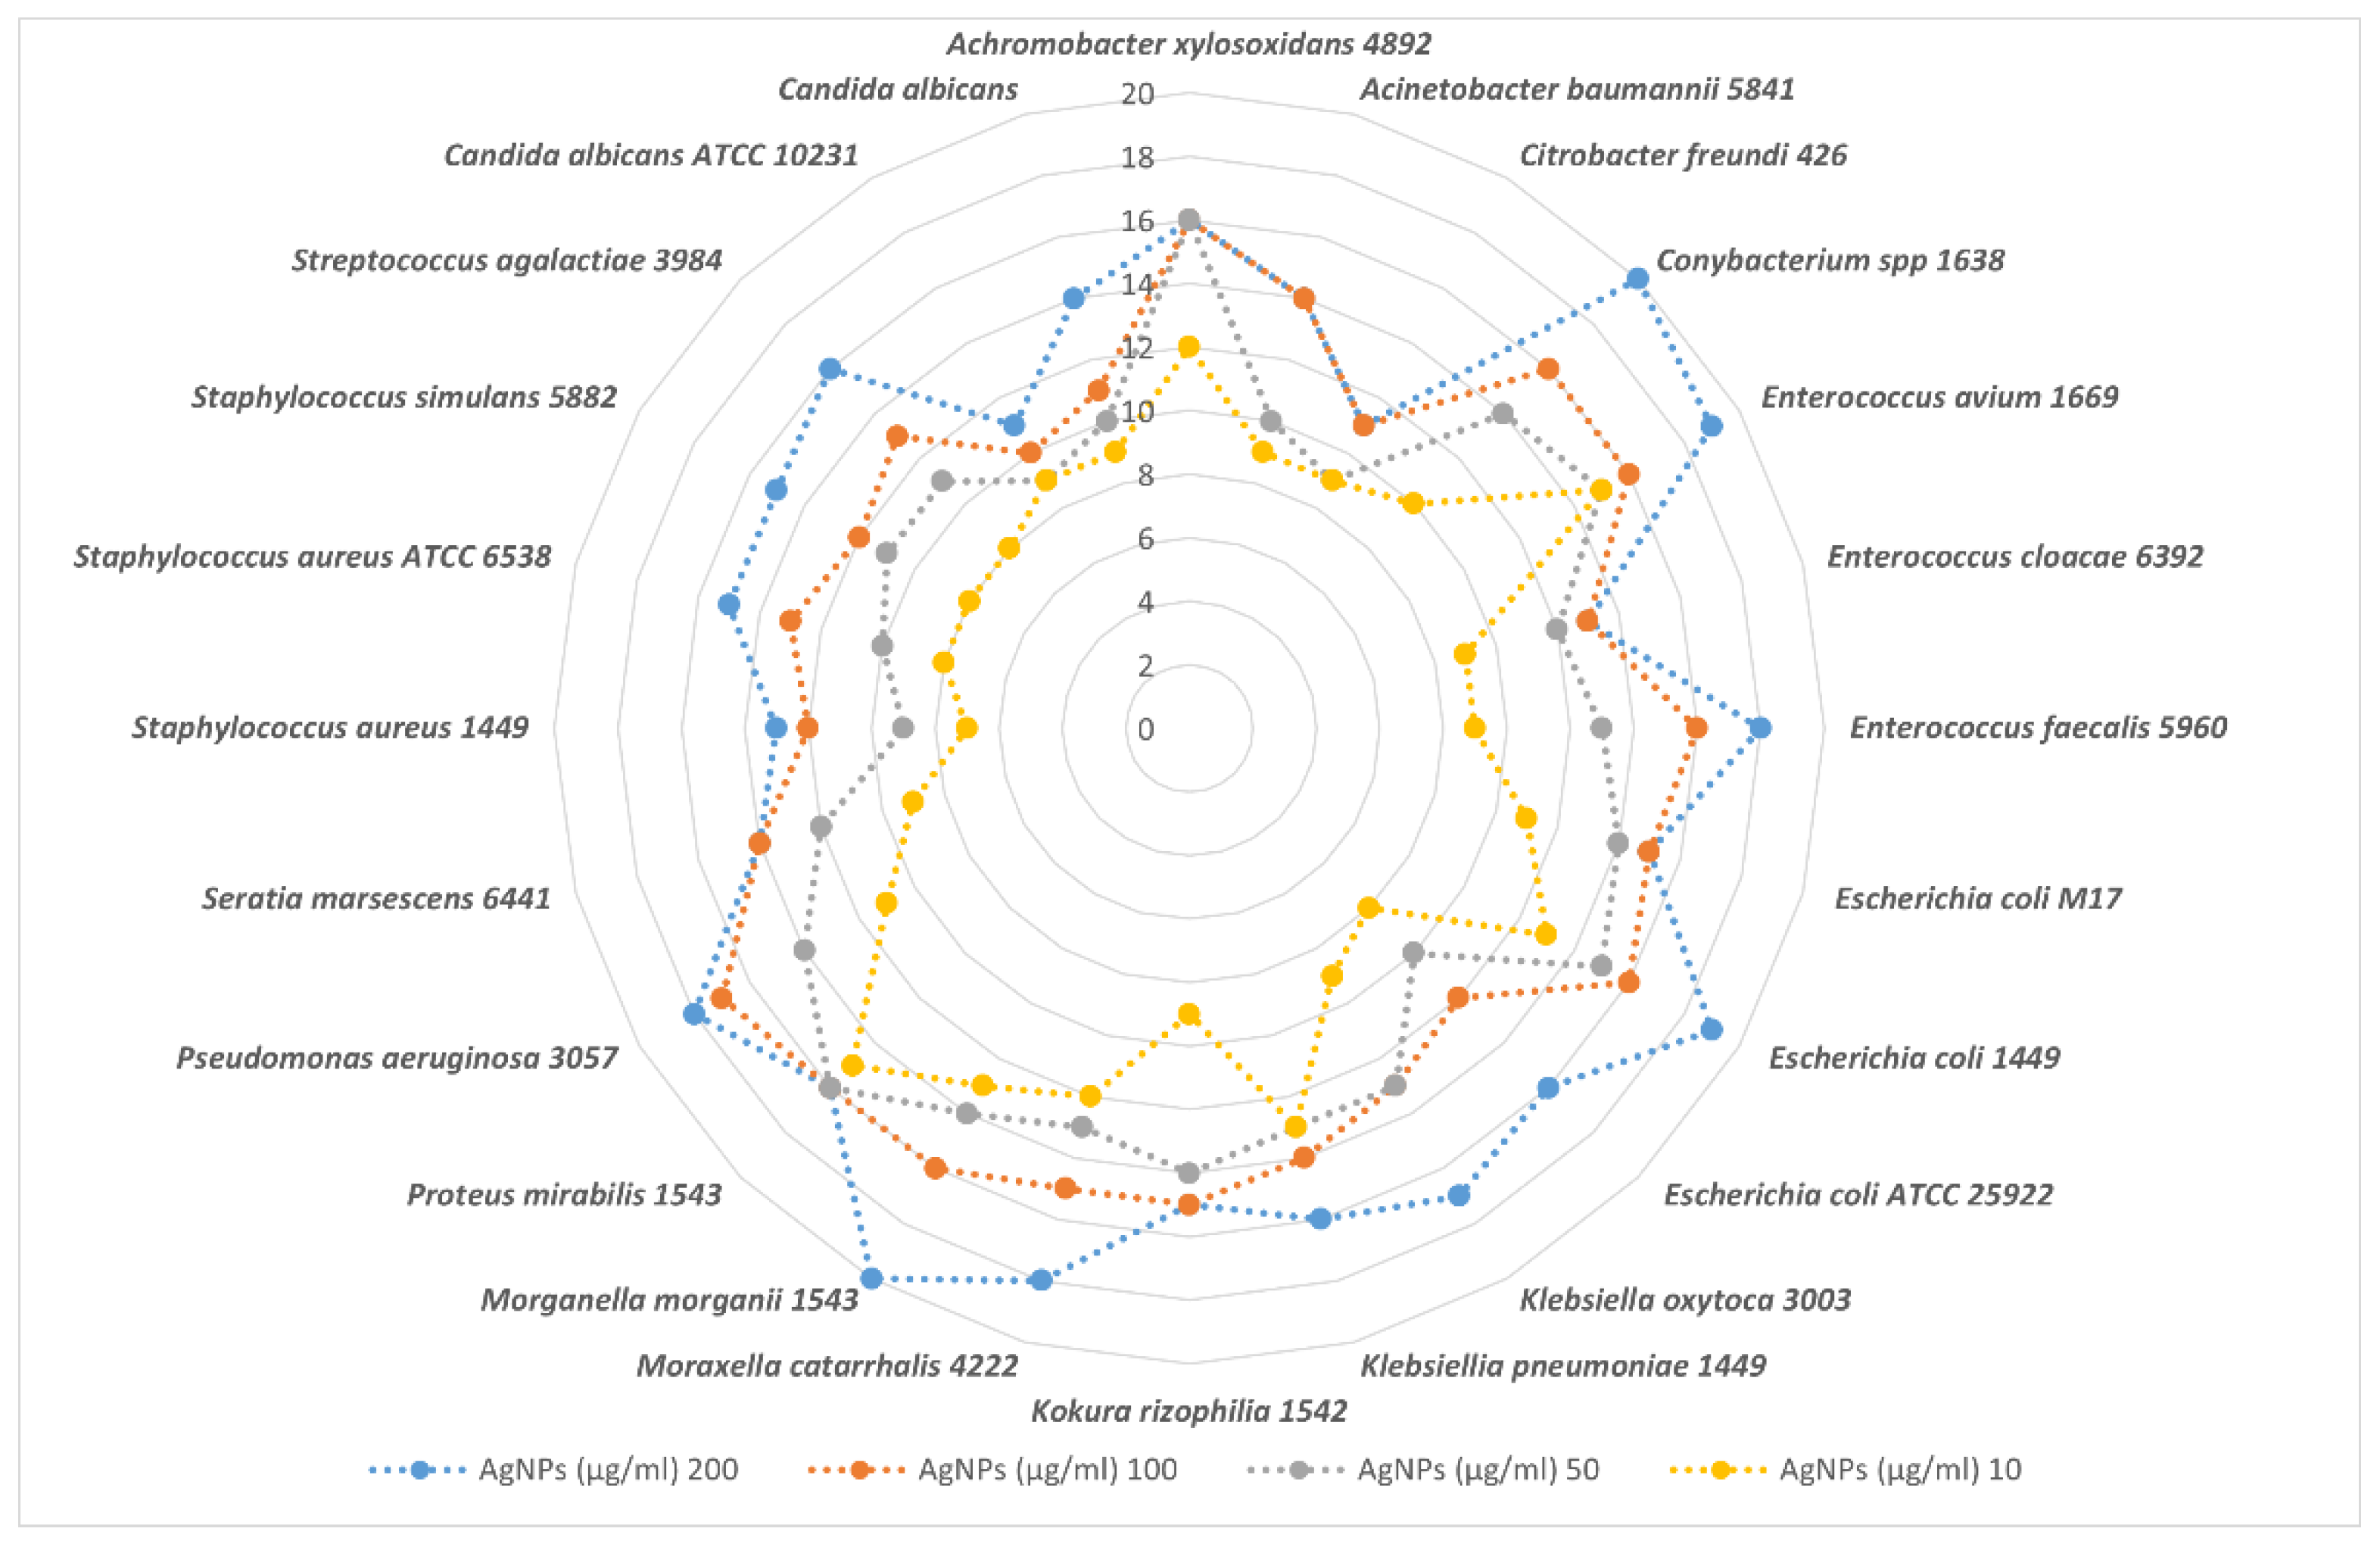
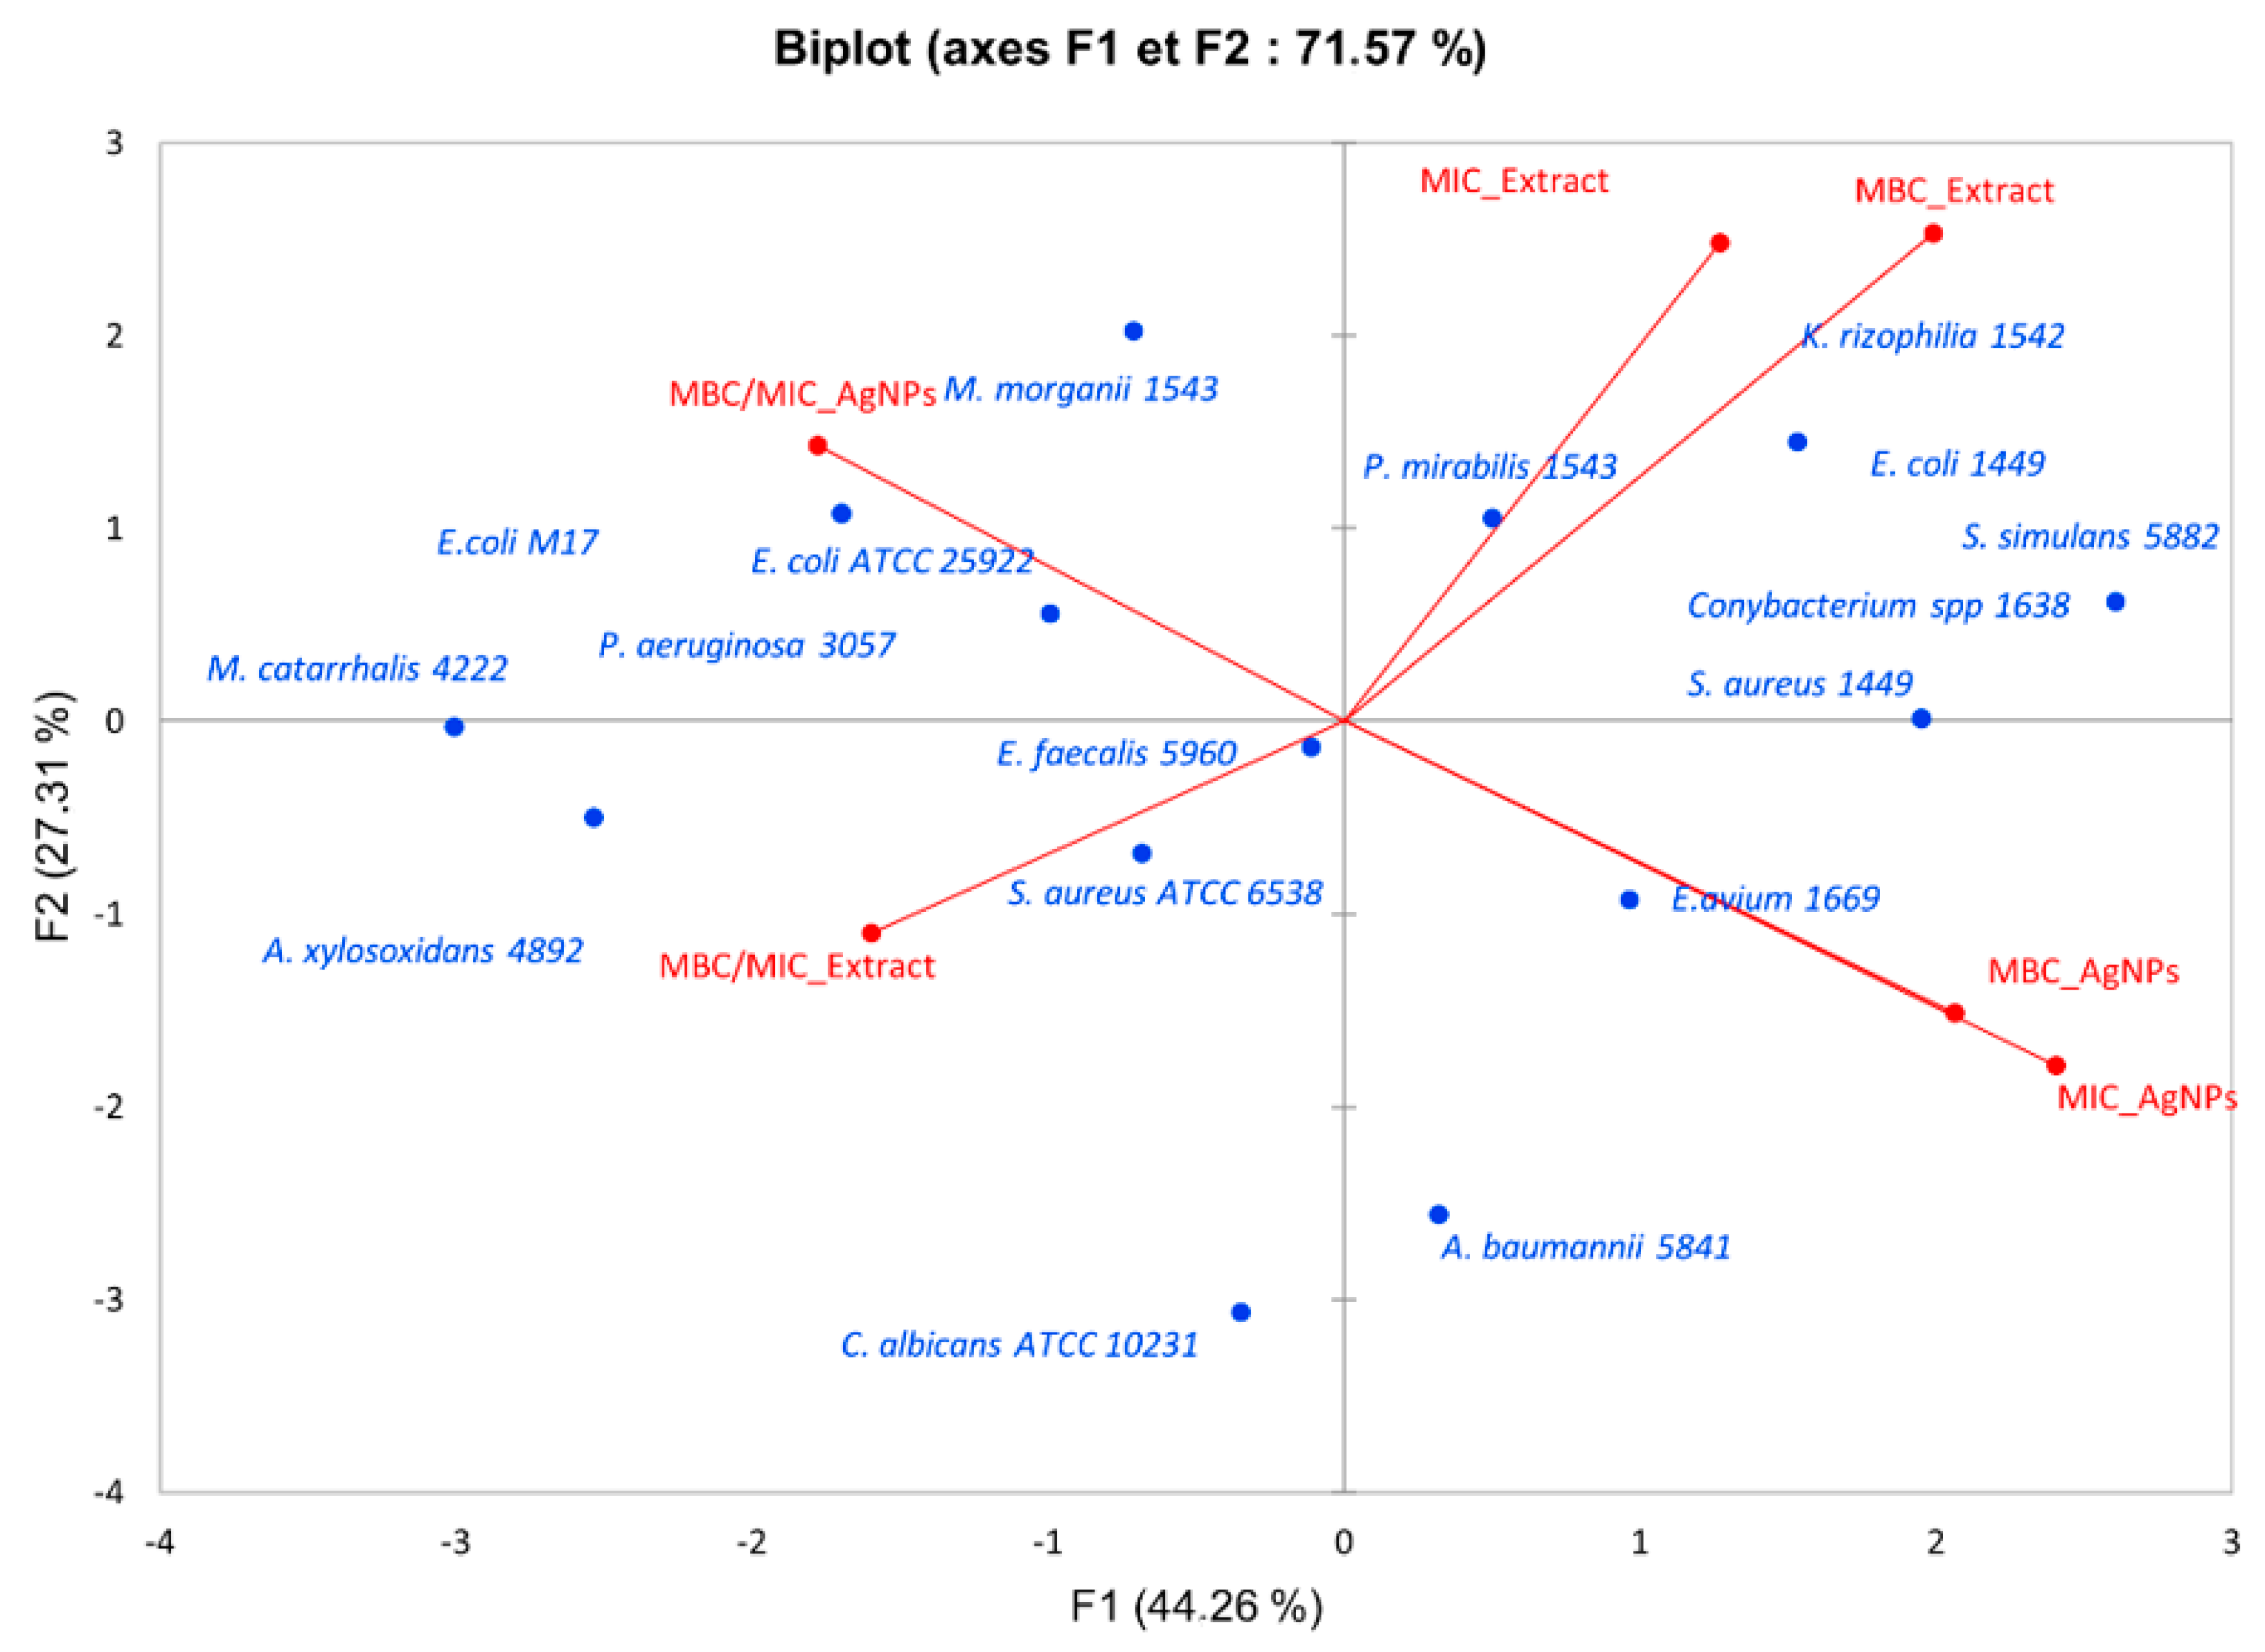
3.4.1. Dose-Dependent Effect, Minimum Inhibitory Concentration (MIC), Minimum Bactericidal Concentration (MBC), Minimum Fungicidal Concentration (MFC), and Ratio MBC/MIC

Figure 5 and Figure 6 show the inhibition diameters of the optimized extract of Enantia chlorantha bark (O-ECB) and the green-synthetized nanoparticles (AgNPs), respectively. Different concentrations (10, 50, 100, and 200 µg/mL) were used to assess the dose-dependent effect of the antimicrobial activity. Both AgNPs and O-ECB demonstrated a dose-dependent effect in all the strains against which they were active. Regardless of the concentration, both antimicrobials exhibited a noteworthy antimicrobial activity with the inhibition diameter ranging from 5 to 31 mm for O-ECB and 7 to 20 mm for AgNPs. With the O-ECB, the highest antimicrobial activity was observed against standard microorganisms (E. coli ATCC 25922, S. aureus ATCC 6538, and C. albicans ATCC 10231) (Figure 5), while the effect of AgNPs was almost the same in clinical and standard strains (Figure 6). Regarding clinical strains, O-ECB was particularly active (inhibition diameter ≥25 mm) against Moraxella catarrhalis 4222 and S. aureus 1449, with moderate activity on all other strains except Citrobacter freundi 426, Enterococcus cloacae 6392, Klebsiella oxytoca 3003, Klebsiellia pneumoniae 1449, and Seratia marsescens 6441, against which O-ECB exhibited either low or no activity. A better appreciation of the antimicrobial activity of O-ECB and AgNPs was possible using the determination of the minimal inhibitory concentration (MIC), minimal bactericidal concentration (MBC), minimal fungicidal concentration (MFC), and tolerance level (ratios MBC/MIC and MFC/MIC).
Table 7 shows the MIC, MBC, MFC, and MBC (or MFC)/MIC of O-ECB and the AgNPs against 24 microorganisms. The MICs of the AgNPs varied from 2 to 64 µg/mL and were successfully determined against all microorganisms (24/24), while the MICs of the successfully determined O-ECB (20/24) varied from 8 to ≥1024 µg/mL. Both the AgNPs and O-ECB exhibited a noteworthy antifungal activity with their respective MICs, with MFCs of 8 and 32 µg/mL, and 64 and 128 µg/mL against C. albicans ATCC 10231. Meanwhile, higher MICs and MFCs were observed with both the AgNPs (512 and 512 µg/mL, respectively) and O-ECB (128 and 256 µg/mL, respectively) against the clinical C. albicans. This observation may indicate that the clinical strains are phenotypically more resistant than the reference one, probably due to the fact that the clinical strains are passed through hostile conditions which led them to better adapt to antimicrobial substances [18]. Although the antifungal mechanism of action of silver nanoparticles is not yet fully elucidated [44], it can be hypothesized that clinical strains of C. albicans have phenotypically more chance of survival than non-resistant fungi when treated with antifungals. Moreover, and interestingly, regarding the antifungal activity, it can be observed from Table 7 that the MICs and MFCs of O-ECB are 4 to 8 times lowers than those of AgNPs. The strong antifungal activity of the O-ECB can be ascribed to the protoberberine alkaloids present in the extract, such as jatrorrhizine (Table 5), which have been reported to exert very strong antifungal activity [45].
In addition, all the MBCs of the AgNPs were determined successfully, while O-ECB had no bactericidal activity on 5 microorganisms out of the 24 tested. These results were in agreement with those observed with the inhibition diameters (Figure 5 and Figure 6), and the O-ECB was completely inactive against Klebsiella oxytoca 3003, Klebsiella pneumoniae 1449, Seratia marsescens 6441 (all Gram-negative bacteria). Given that all the Gram+ were susceptible, the inactivity of the O-ECB against certain Gram− could be attributed to the efflux pump (EP), which can be found in the cell membrane of Gram− bacteria, but not on those of Gram+ [46,47]. In addition, recent works have revealed the presence of efflux pumps (AcrAB multidrug efflux system and RND-type efflux pump) in bacteria belonging to species resistant to the O-ECB in the present study [48,49]. Indeed, efflux pumps (EPs) act as export or efflux systems that can cause resistance to a wide range of antibacterial agents. Khameneh et al. [46] reported that, throughout this mechanism, the antibacterial agent is pumped out faster than the time it requires to be diffused in a bacterial cell; consequently, the intrabacterial concentration becomes less than the effective value.
Moreover, the noteworthy activity of AgNPs reported in this study agrees with most work in the literature, which attributes broad-spectrum antimicrobial activity to AgNPs [50]. The mechanism of action of nanoparticles is not yet clearly understood but, presently, there are three main explanations that have been proposed to describe their antibacterial activity. On the one hand, Sondi and Salopek-Sondi [51] reported that AgNPs can directly interact with the bacterial cell membrane, causing subsequent membrane damage and complexation with components located inside the cells. Banerjee et al. [52] proposed that their antibacterial activity can be ascribed to the interaction with thiol (−SH) groups and the production of reactive oxygen species (ROS). Finally, Pal et al. [53] and Rai et al. [50] suggested that AgNPs’ antibacterial activity is due to the release of silver ions which inhibit respiratory enzymes and generate ROS [53].
In order to visualize the association between the microbial species tested, MIC, MBC, and the tolerance level (ratio MBC/MIC) of the O-ECB and AgNPs, a principal component analysis (PCA) was performed, and the result was assigned in an F1 × F2 system (Figure 7). The PCA revealed that the first two principal components (F1 and F2) explained 71.57% of the total variation and F1 and F2 accounted for 44.26% and 27.31%, respectively. We observed that all the microorganisms are distributed into four groups linked, respectively, to MIC_extract and MBC_extract, MIC_extract and MBC_AgNPs, MBC/MIC_AgNPs, and MBC/MIC_extract. Both Gram+ and Gram− are included in each of these groups, revealing the broad-spectrum activity of E. chlorantha extract and AgNPs.
Overall, according to the classification established by Kuete [54] and Kuete and Efferth [55], the O-ECB and AgNPs could be considered as having a strong antimicrobial activity against all the microbial strains tested except (for O-ECB) K. oxytoca 3003, K. pneumoniae 1449, and S. marsescens 6441, as they scored MIC values lower than 0.625 mg/mL. In addition, wherever they were active, both the AgNPs and O-ECB exhibited bactericidal activity; it is established in the literature that an antimicrobial compound is considered bactericidal/fungicidal against a microbial strain when the ratio MBC (or MFC)/MIC ≤ 4 [56,57].

3.4.2. Antibiotic Resistance Reversal Activity

The use of combination therapy has been suggested as a new approach to improve the efficacy of antimicrobial agents [58]. In this study, we combined kanamycin, ampicillin, and cefazolin with green-synthetized silver nanoparticles (AgNPs) and the optimized ethanolic extract of Enantia chlorantha bark (O-ECB). As shown in Table 8, the fractional inhibitory concentration (FIC) ranged from 0.015 to 0.500. We observed a decrease in MIC of antibiotics ranging from 1/4 to 1/128. The lower is the FIC index, and the higher is the synergy [58]. Therefore, the best synergy (FIC = 0.015) was found between ampicillin and O-ECB with a 128-fold decrease in the MIC of ampicillin against a resistant E. coli. A spectacular reduction in the MIC of kanamycin and cefazolin (64-fold decrease, FIC = 0.031) was also observed in combination with O-ECB against E. faecalis 5960 (Table 8). This good synergy between the O-ECB and kanamycin can be explained by the presence in the extract of protoberberine alkaloids, which are the major constituents of E. chlorantha bark (Table 5), and which have already been reported as good adjuvants for antimicrobials in resistant and non-resistant strains [59,60,61]. Furthermore, no antagonism (FIC > 4) or indifference (1≤ FIC ≤ 4) was noted between the AgNPs or O-ECB and the antibiotics. However, we found an additional effect (0.5 ≤ FIC ≤ 1) between cefazolin and AgNPs (FIC = 0.500). The additional effect is not negative, but we proscribe the cefazolin + AgNPs combination as we observed that a black pellet was formed immediately after mixing the two substances, while all the other combinations remained clear.

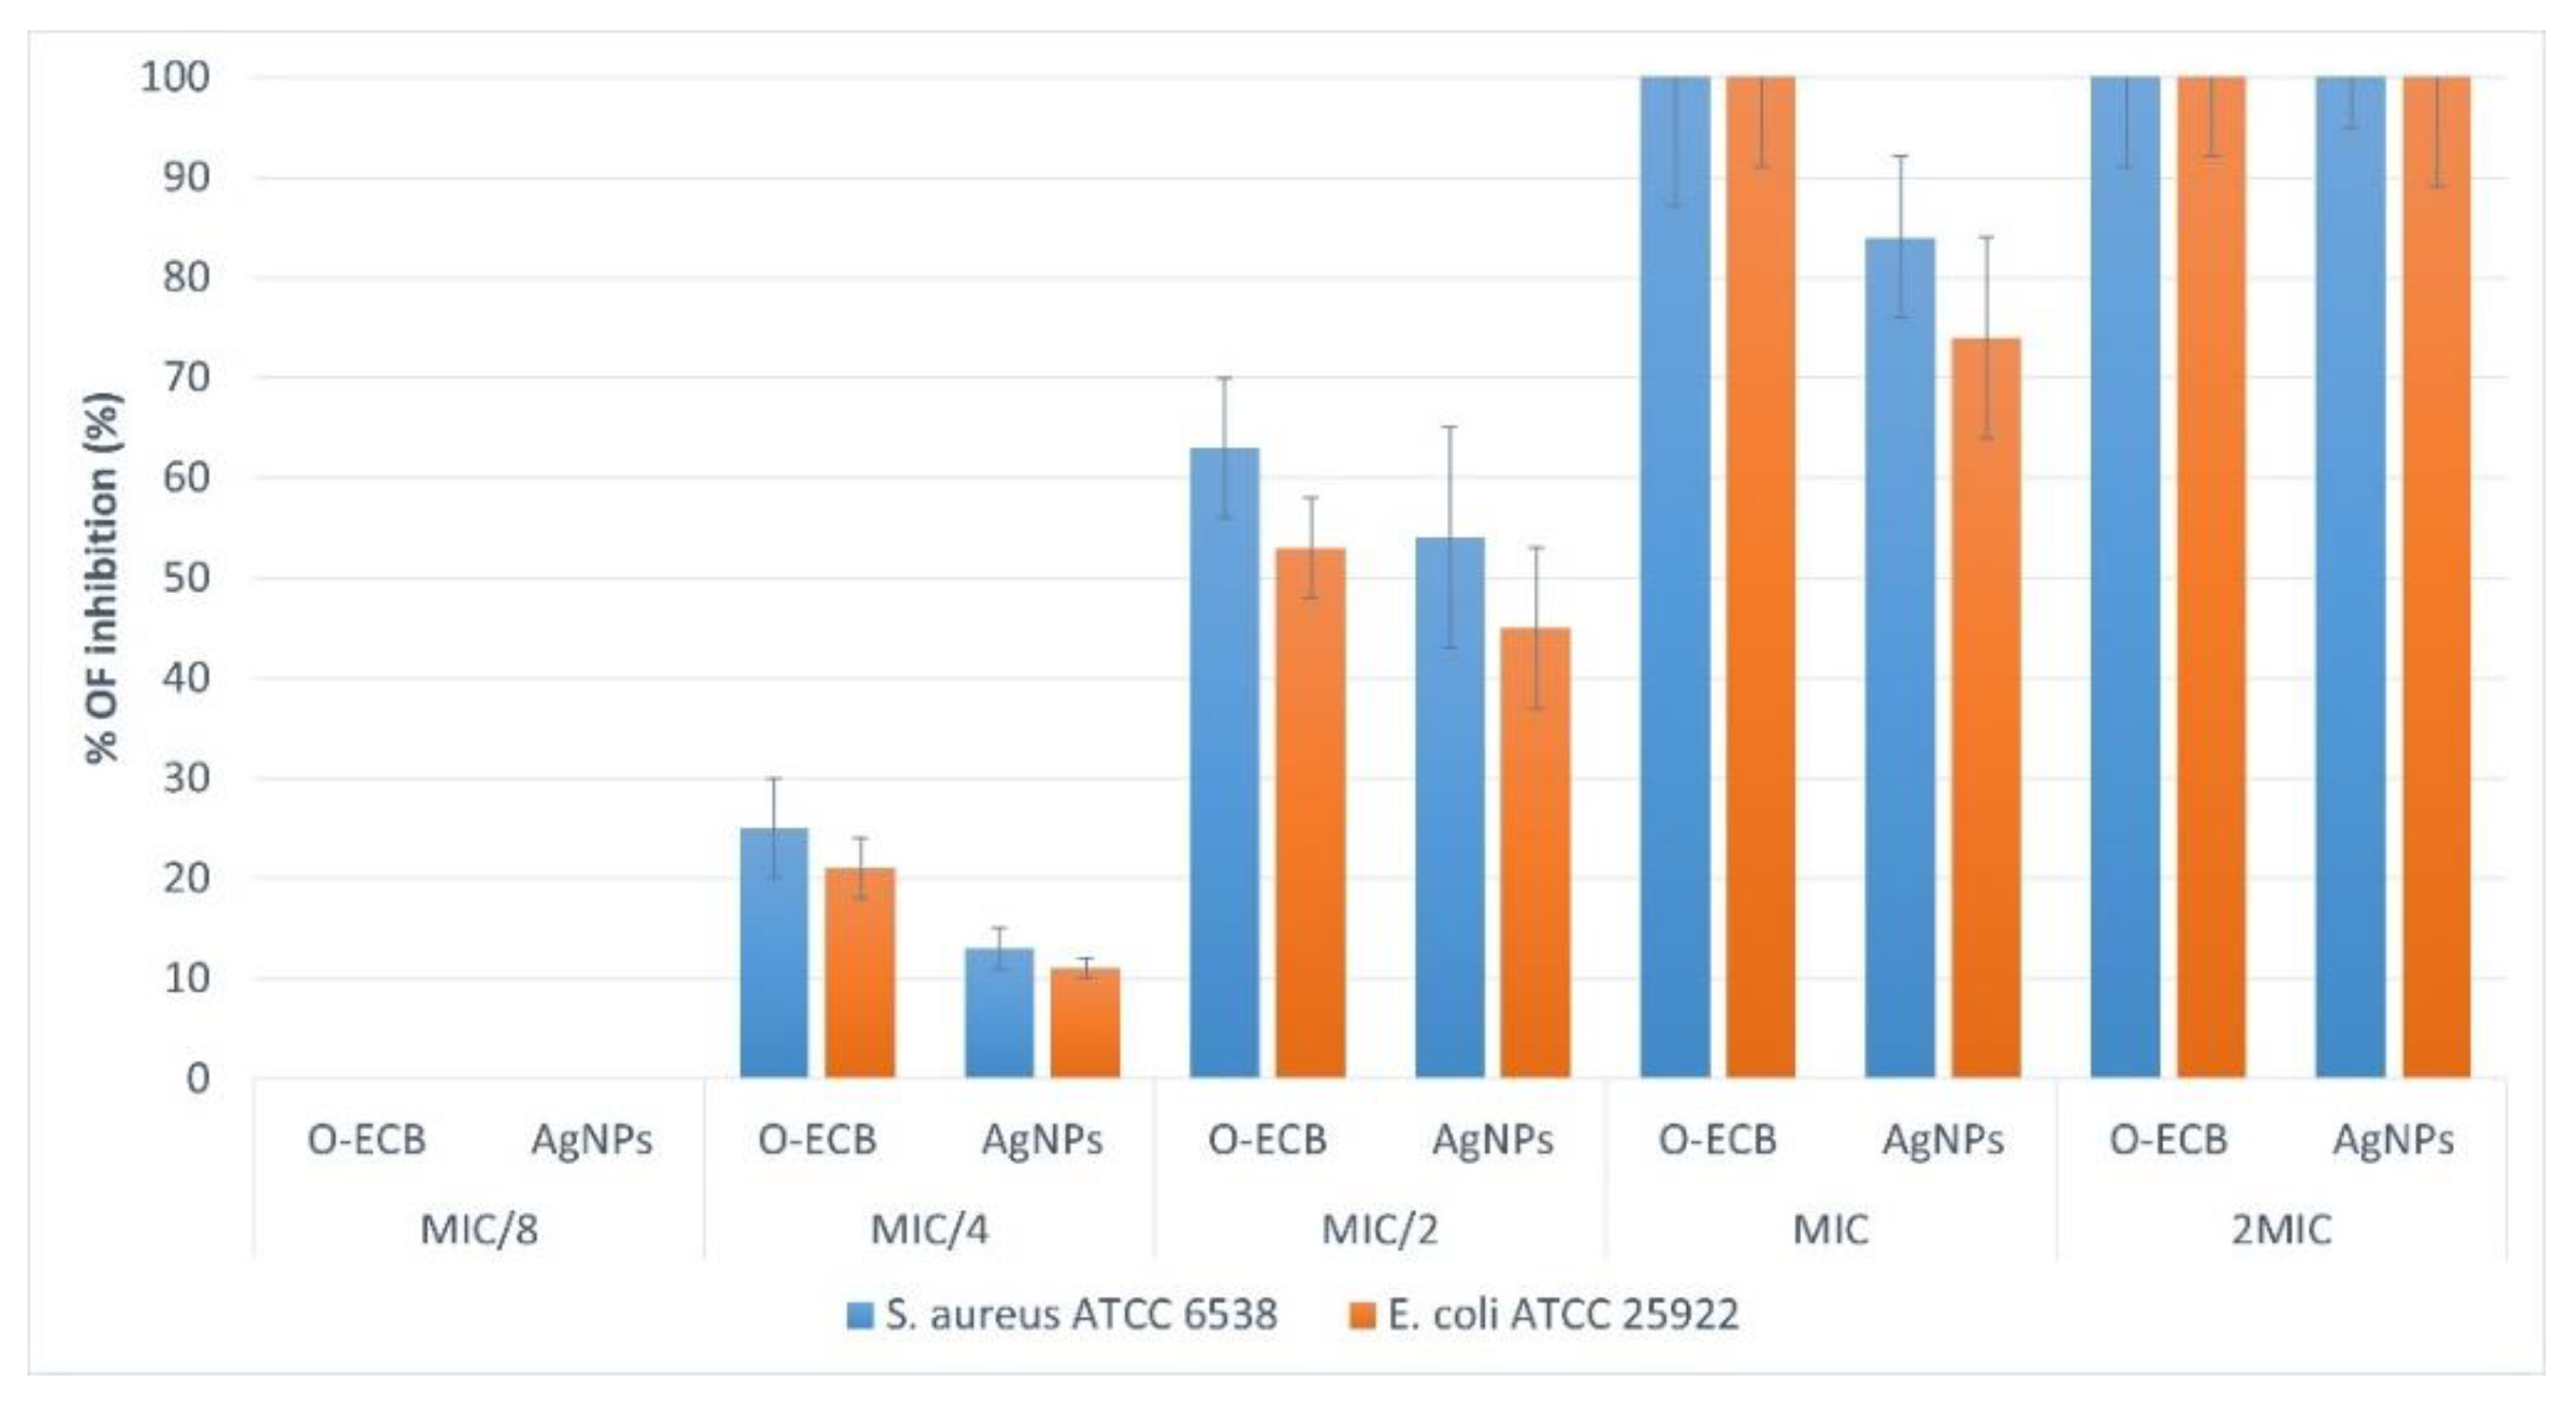
3.4.3. Impact of AgNPs and O-ECB on Biofilm Formation

Previous studies have revealed strong evidence that medicinal plants and AgNPs have promising attitudes to combat biofilm formation in various bacteria [62,63]. Biofilms are microbial consortia embedded in self-produced exopolymer matrices mainly composed of exopolysaccharides. The search for means of combating the formation of biofilms is necessary because this cellular state significantly contributes to resistance to antibiotics and the complication of infections [63]. Indeed, microbes living in these matrices benefit from nutrient and water supplies [64]; improved lateral gene transfer [65]; and protection against adverse environmental conditions such as desiccation and chemicals such as detergents, disinfectants, and antibiotics [66]. In the present study, we observed that silver nanoparticles (AgNPs) and the optimized ethanolic extract of Enantia chlorantha bark (O-ECB) very strongly inhibited the biofilm formation in E. coli ATCC 25,922 and S. aureus ATCC 6538. As shown in Figure 8, the sub-inhibiting concentrations (MIC/8, MIC/4, and MIC/2) demonstrated percentages of inhibition varying from 0 to 63% and 0 to 54%. Percentages of biofilm inhibition of 100% were observed on the two microorganisms at MIC with O-ECB and at 2MIC with AgNPs. Overall, at MIC/8, no antibiofilm activity was observed; but for higher concentrations, O-ECB was more effective than AgNPs and the antibiofilm activity was greater on S. aureus compared to E. coli. Therefore, both O-ECB and AgNPs could be recommended in the management of diseases in which biofilms are involved, such as otitis media [67], osteomyelitis [68], bacterial endocarditis, cystic fibrosis [69], otolaryngologic infections [70], and nonhealing wounds [71]. The antibiofilm efficacy of AgNPs and O-ECB could also be used in biofilm-related infections linked to the surfaces of catheters, medical implants, wound dressings, and other types of medical devices [63]. However, before any application, many other studies are needed to address issues related to the toxicity, safety, and possible side effects of these AgNPs, such as allergies and irritations [63,72].

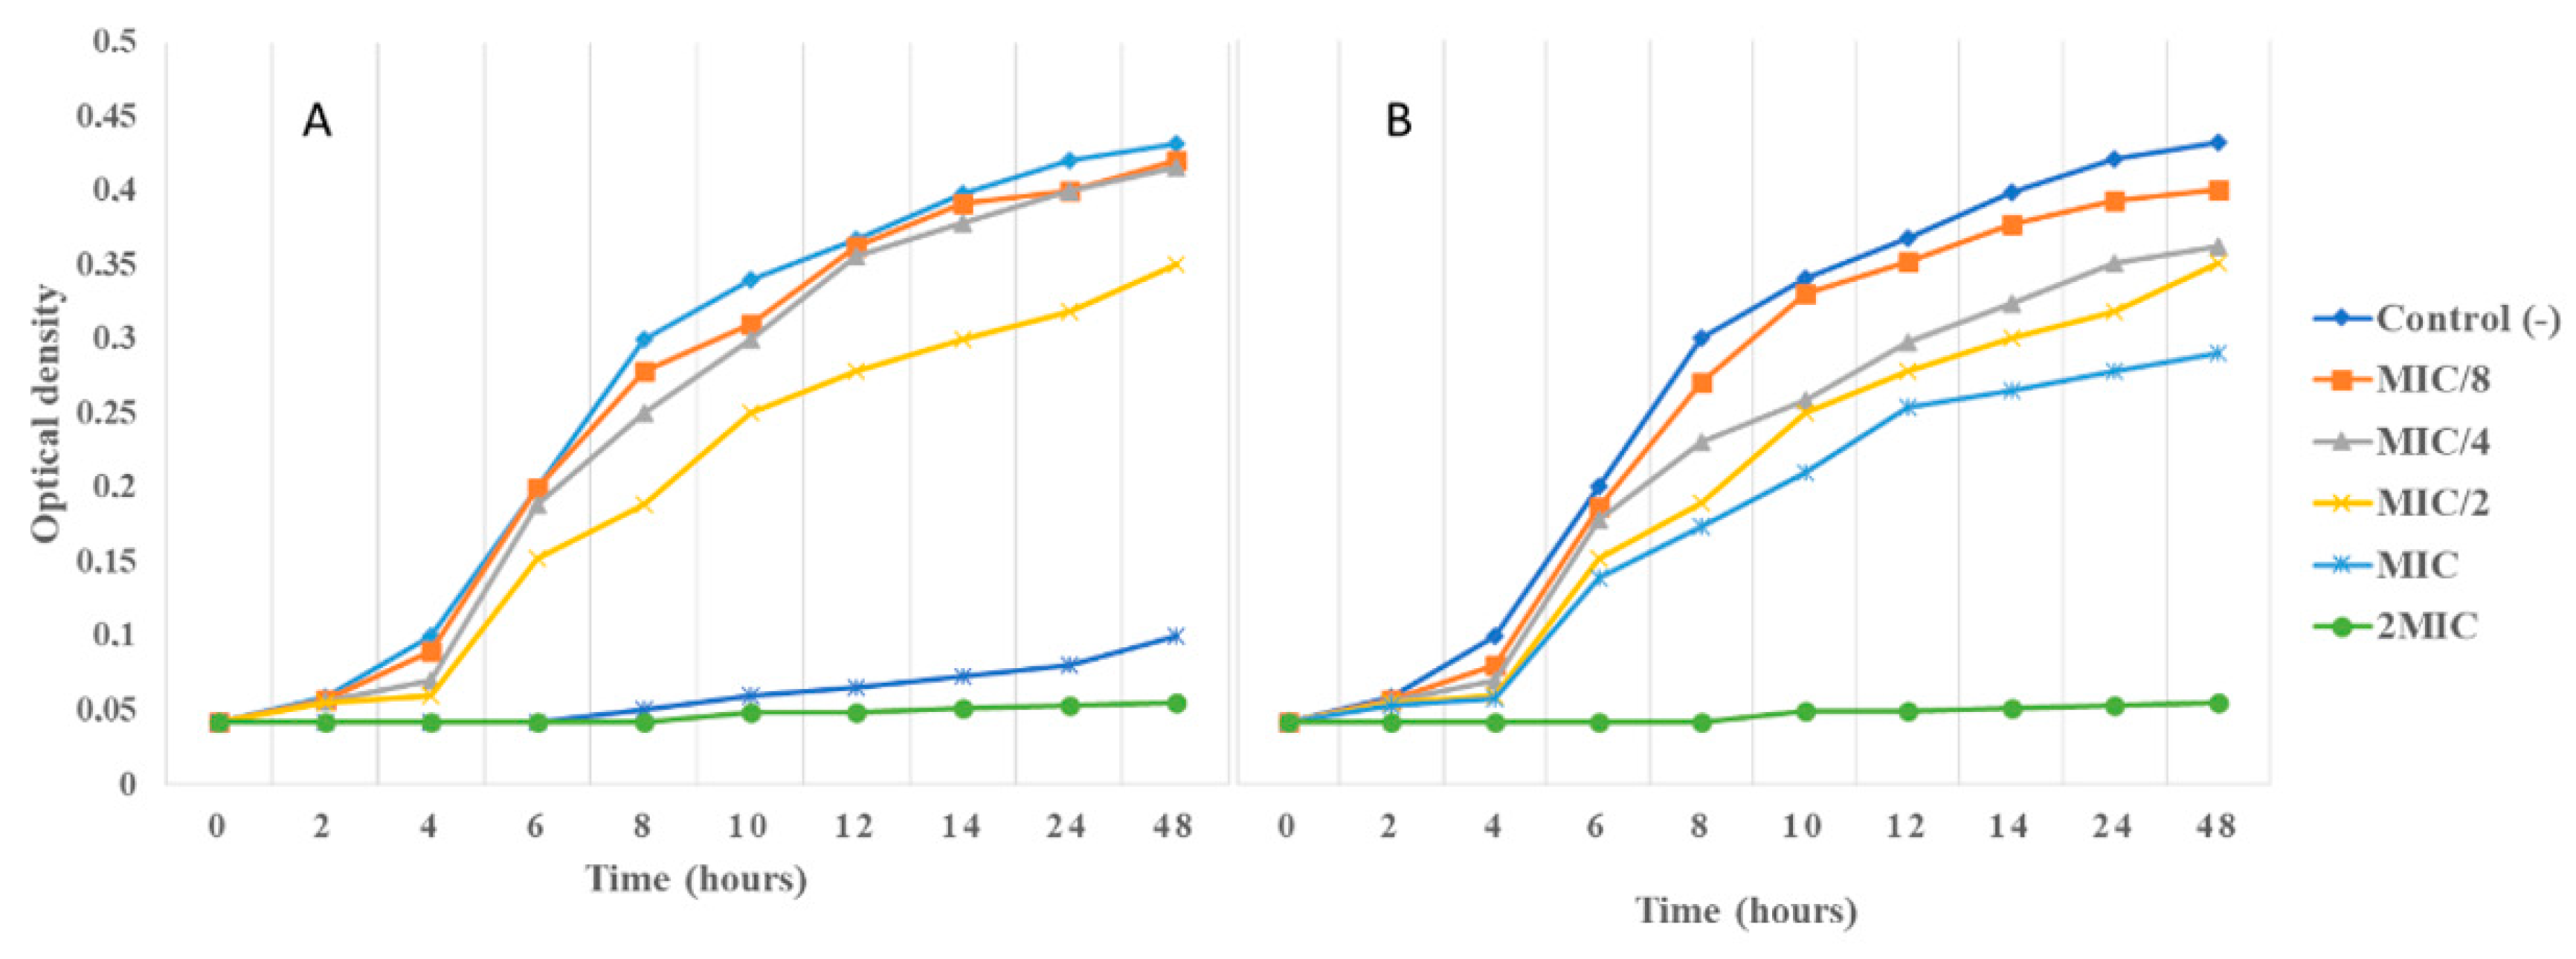
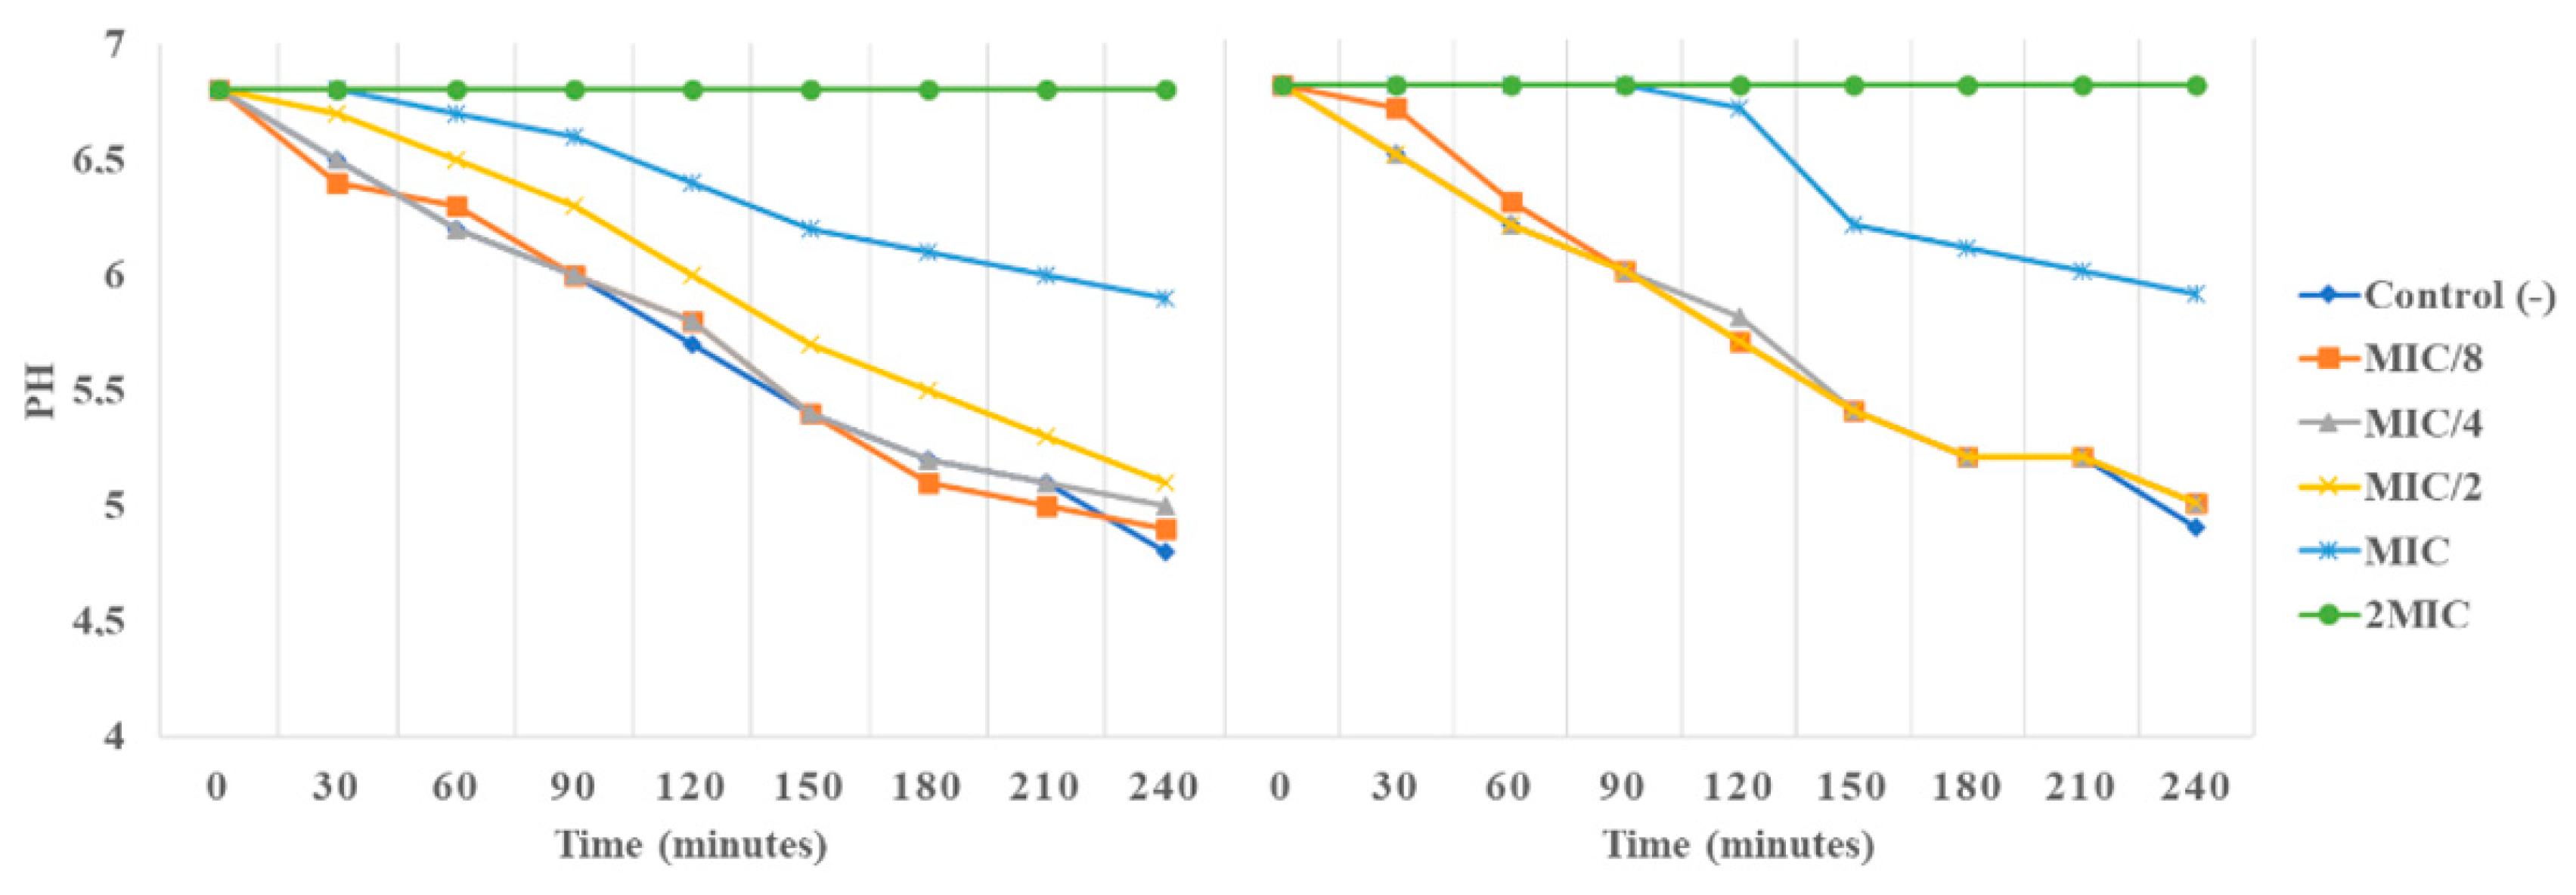
3.4.4. Impact of AgNPs and O-ECB on E. coli Growth Kinetic and H+-ATPase Proton Pumps

As suggested by others [25], we attempted to investigate the potential mechanism of antibacterial activity of O-ECB and AgNPs by studying their influence on the E. coli ATCC 25,922 growth kinetic and H+-ATPase proton pumps. As shown in Figure 9, neither AgNPs nor O-ECB influenced the E. coli growth at MIC/8. However, at MIC/2, O-ECB prolonged the lag phase right up to 12 h, while AgNPs influenced the growth kinetic by prolonging the lag phase right up to 10 h. At MIC and 2MIC, the lag phase was prolonged till the end of the growth kinetic study (48 h) with O-ECB, while the same result was observed with AgNPs only at 2MIC. Interestingly, in other studies [25], the impact of antimicrobial agents on the growth kinetic at 2MIC was explained by the fact that 2MIC corresponded to MBC; which is not the case in our study (2MIC < MBC; Table 8). We can, therefore, hypothesize that concentrations greater than or equal to the MIC (and lower than the MBC) play an almost bactericidal role or have a very strong bacteriostatic effect. This observation was confirmed by the study of the impact of AgNPs and O-ECB on E. coli H+-ATPase proton pumps (Figure 10), where the most significant effect was also obtained at 2MIC. Indeed, as shown in Figure 10, for MIC/8, MIC/4, MIC/2 (only for AgNPs), and the control (absence of AgNPs and O-ECB) a progressive and considerable increase in the acidification of the media (lowering of the pH from 6.8 to 4.9) was noted from 0 to 4 h. On the contrary, at MIC/2 (not for AgNPs) and MIC, the acidification was less significant and, at 2MIC, no change in pH was observed with either the AgNPs or O-ECB. The observations made at MIC and 2MIC in the potential mechanism of action investigation allowed us to conclude that, at these concentrations, the AgNPs and O-ECB prevented the bacteria from using the nutrients available in the culture medium through the inhibition of the synthesis of enzymes involved in the nutrient metabolism. In addition, it is well known that the cytoplasmic pH of bacteria cells is regulated by the extrusion of protons through the respiratory chain and K+ influx at acid pH, and cation/proton antiporter regulates the pH in alkaline states. Ion exchange systems in bacteria are coupled with the adenosine triphosphate (ATP) energy synthesis used by the bacteria and any blockage of their operation (leading to a reduction in the acidification of the medium) could be harmful to their survival [25].

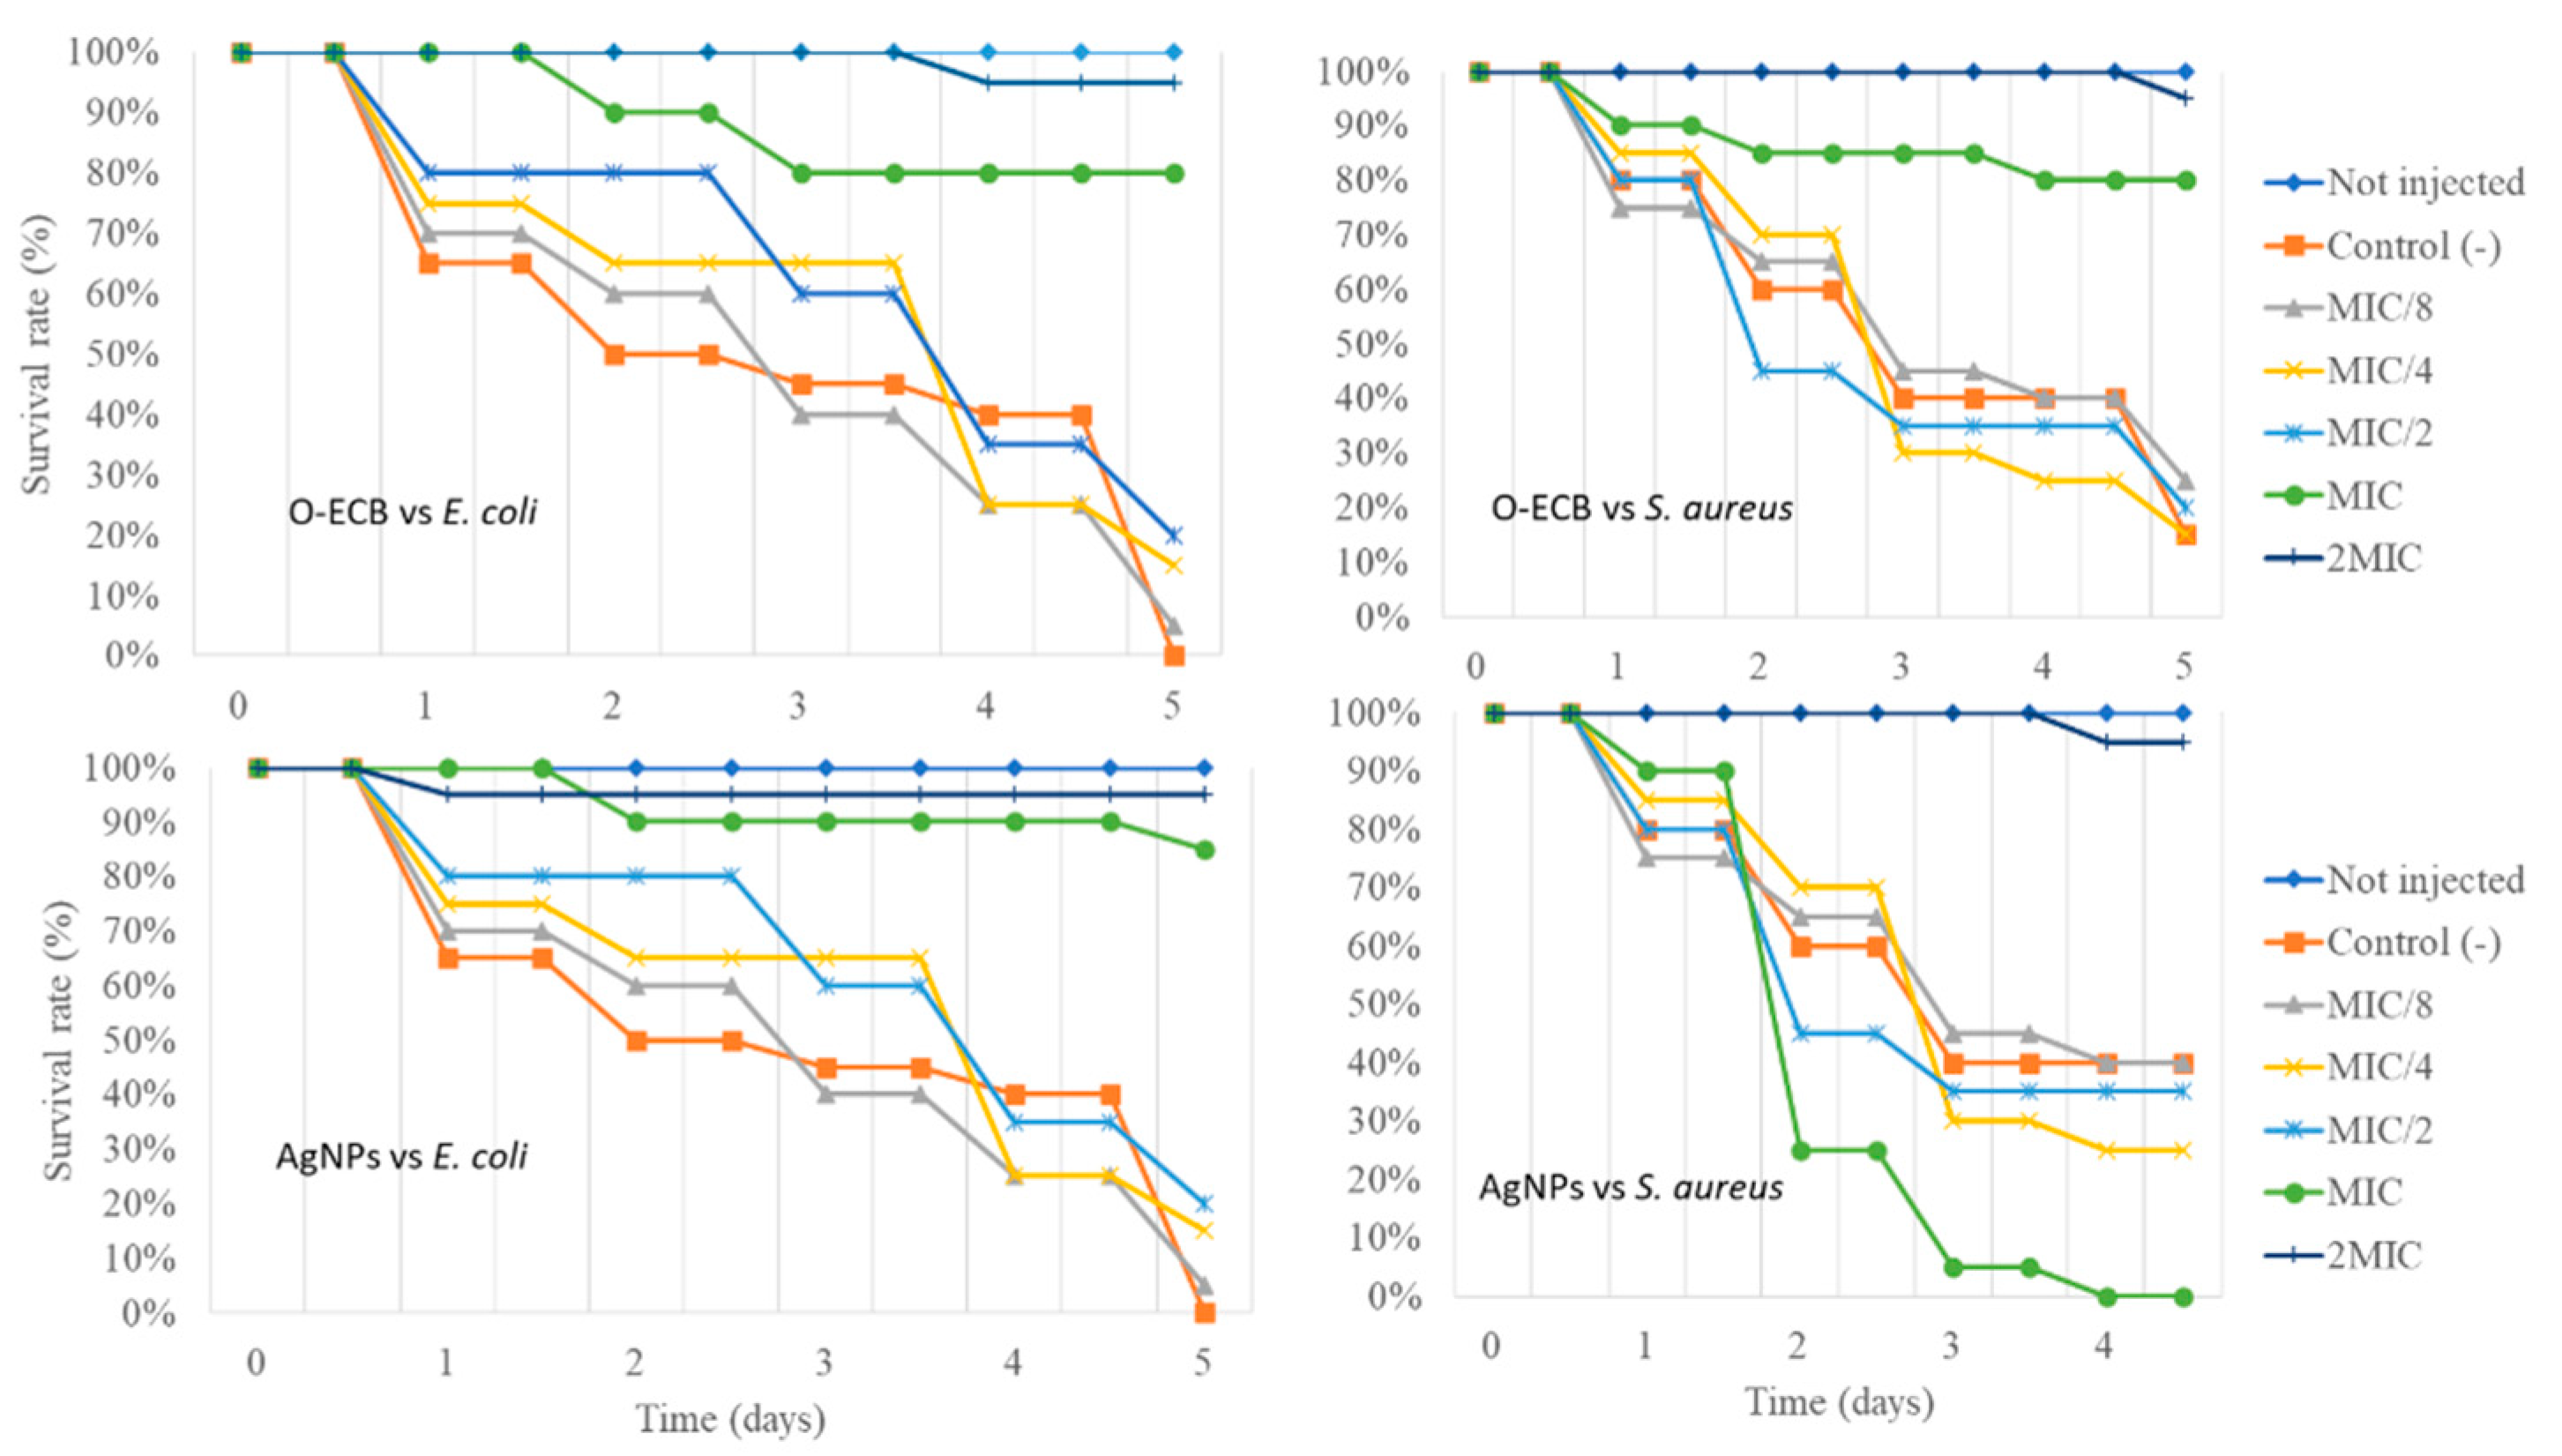
3.5. Toxicity Screen and In Vivo Antibacterial Activity of AgNPs and O-ECB

The toxicity of the O-ECB and AgNPs was evaluated prior to the study of antimicrobial activity in vivo in order to avoid the use of lethal concentrations against Galleria mellonella larvae. The survival curve is depicted in Figure S11 and the LD50s were reported in Table 9. As shown in Table 9, the LD50s of O-ECB (40 mg/mL) and AgNPs (600 µg/mL) were far higher than their respective MICs in vitro (Table 9) against E. coli ATCC 25,922 (128 and 16 µg/mL) and S. aureus ATCC 6538 (64 and 32 µg/mL). Therefore, it was legitimate to use the concentrations equivalent to MIC/8, MIC/4, MIC/2, MIC, and 2MIC in the study of antimicrobial activity in vivo. However, returning to the LD50s, we can conclude that AgNPs are moderately toxic while O-ECB is practically non-toxic, because according to the classification of Gosselin, Smith and Hodge [73], biologically active compounds can be super toxic (LD50 < 5 mg/kg bw), extremely toxic (LD50 ∈ [5–50 mg/kg bw]), very toxic (LD50 ∈ [50–500 mg/kg bw]), moderately toxic (LD50 ∈ [0.5–5 g/kg bw]), slightly toxic (LD50 ∈ [5–15 g/kg]), and practically non-toxic (above 15 g/kg).
As shown in Figure 11, the in vivo antimicrobial activity obeyed the trends observed on the impact of AgNPs and O-ECB on the growth kinetic and H+-ATPase proton pumps. Indeed, for each group of larvae infected with the microorganisms, the larval survival rates were 90–100% at 2MIC on the last day of monitoring (day 5) compared with the lower concentrations (MIC/8, MIC/4) and the control (larvae injected with PBS) where the survival rate was less than 10%. Interestingly, the larvae in the group challenged with E. coli were likely to die more quickly compared to those infected with S. aureus, which supposes a faster growth or a high pathogenicity of this bacterium on G. mellonella. In addition, in the group of larvae treated with AgNPs, at MIC the survival rate dropped very sharply on day 2 in the larvae challenged with S. aureus. This drop could be explained either by the decrease in the concentration in larval hemocoels (approaching MIC/8-MIC/4), stress response, or by an adaptation phenomenon that would have induced an increase in pathogenicity. However, the adaptation hypothesis is implausible because adaptation phenomena are more likely to occur with repeated exposure to subinhibitory concentrations of antimicrobials [74], but rarely with a single dose, such as in the present study. In our previous investigation with the same strain, we noticed that after several exposures to low doses of antimicrobials, S. aureus became more virulent, grew faster, produced more biofilms, and was more resistant to other antibiotics [19]. Latimer et al. [75] reported that these changes are mainly due to the response to stress conditions. However, they also argued that these changes are potentially the consequence of changes in the expression of the intercellular polysaccharides, protein PIA, and Aap, or rather changes in the staphylococcal accessory regulator gene sarA, which controls several virulence determinants, including biofilm formation, hemolysins, and DNase [75,76,77,78]. Although similar observations have not been made with the O-ECB, we strongly recommend the use of antimicrobials in general at bactericidal doses to limit possible adaptations.

4. Conclusions

In this study, after optimizing the ethanolic extraction of active compounds from the bark of Enantia chlorantha (O-ECB), we identified the main constituent of the extract, and we successfully achieved an ecofriendly synthesis of silver nanoparticles (AgNPs) that we further characterized. The in vitro and in vivo antimicrobial activity, impact on E. coli growth kinetic and H+-ATPase proton pumps, synergy with conventional antibiotics, and toxicity of both the O-ECB and AgNPs were evaluated. We found that both the O-ECB and AgNPs exhibited broad-spectrum antibacterial activity (both on Gram+ and Gram− and on fungi) worthy of being exploited in the formulation of new antimicrobials. Moreover, except for the cefazolin + AgNPs combination, the AgNPs and O-ECB worked well in synergy with the other antibiotics with remarkable decreases in minimum inhibitory concentrations and very low fractional inhibitory concentrations. In vivo antibacterial activity using the Galleria mellonella model was closely correlated with in vitro activity. Finally, in addition to the significant impact on biofilms, an evaluation of the mechanism of antimicrobial activity showed that both the O-ECB and AgNPs acted by inhibiting H+-ATPase proton pumps and influenced the growth kinetic.

Supplementary Materials

The following supporting information can be downloaded at: https://www.mdpi.com/article/10.3390/fermentation8100530/s1. Table S1: Bacterial strains used and their susceptibility profile to antibiotics. Table S2: Elemental composition of green-synthesized AgNPs. Figure S1: Main individual effect plot showing how the factors (percentage of ethanol, ratio m/v, and extraction time) influence the volume yield. Figure S2: Main individual effect plot showing how the factors (percentage of ethanol, ratio m/v, and extraction time) influence the mass yield. Figure S3: Main individual effect plot showing how the factors (percentage of ethanol, ratio m/v, and extraction time) influence the inhibition diameter of S. aureus ATCC 6538. Figure S4: Interaction plot displaying how the relationship between the factors involved in the extraction process (percentage of ethanol, ratio m/v, and extraction time) influence the volume yield. Figure S5: Interaction plot displaying how the relationship between the factors involved in the extraction process (percentage of ethanol, ratio m/v, and extraction time) influence the mass yield. Figure S6: Interaction plot displaying how the relationship between the factors involved in the extraction process (percentage of ethanol, ratio m/v, and extraction time) influence the inhibition diameter of S. aureus ATCC 6538. Figure S7: Contour plot showing the evolution of the volume yield as a function of the ratio m/v and the percentage of ethanol. Figure S8: HPLC-MS/MS chromatogram of the optimized extract of Enantia chloranta bark. Figure S9: Particle size and distribution using photon cross-correlation spectrometry. Figure S10: Stability measurement of green-synthetized silver nanoparticles. Figure S11: Survival rate of Galleria mellonella challenged with various concentrations of AgNPs.

Author Contributions

Conceptualization, M.M.J.A., A.K.L.D. and P.I.V.; methodology, M.M.J.A., K.N.W., A.A.G. and P.I.V.; software, M.M.J.A., M.V.A. and M.A.M.; validation, M.M.J.A. and P.I.V.; formal analysis, K.P.; investigation, M.M.J.A., M.R., G.V.S., E.C.; K.S.Z., K.S.A., T.M.I., K.A.L. and P.V.O.; resources, P.I.V. and S.A.L.; data curation M.M.J.A., I.K. and S.S.; writing—original draft preparation, M.M.J.A.; writing—review and editing, S.N.A., S.S. and I.K.; visualization, M.M.J.A., P.P.A., N.T.K.D. and T.S.N.; supervision, P.I.V.; project administration, P.I.V. All authors have read and agreed to the published version of the manuscript.

Funding

This research received no external funding.

Institutional Review Board Statement

Not applicable.

Informed Consent Statement

Not applicable.

Data Availability Statement

All data are within the manuscript and Supplementary Materials.

Acknowledgments

This study has been supported by the RUDN University strategic Academic Leadership Program.

Conflicts of Interest

The authors declare no conflict of interest.

References

  1. Tailor, G.; Yadav, B.L.; Chaudhary, J.; Joshi, M.; Suvalka, C. Green synthesis of silver nanoparticles using Ocimum canum and their anti-bacterial activity. Biochem. Biophys. Rep. 2020, 24, 100848. [Google Scholar] [CrossRef]
  2. Mostafa, M.; Kandile, N.G.; Mahmoud, M.K.; Ibrahim, H.M. Synthesis and characterization of polystyrene with embedded silver nanoparticle nanofibers to utilize as antibacterial and wound healing biomaterial. Heliyon 2022, 8, e08772. [Google Scholar] [CrossRef] [PubMed]
  3. Zhang, X.F.; Liu, Z.G.; Shen, W.; Gurunathan, S. Silver nanoparticles: Synthesis, characterization, properties, applications, and therapeutic approaches. Int. J. Mol. Sci. 2016, 17, 1534. [Google Scholar] [CrossRef] [PubMed]
  4. Shedrack, R.K.; Peter, K.; Judith, S.; Dominic, O.; Peter, M.; Naomi, M. Biogenic synthesis of silver nanoparticles using Azadirachta indica methanolic bark extract and their anti-proliferative activities against DU-145 human prostate cancer cells. Afr. J. Biotechnol. 2022, 21, 64–72. [Google Scholar]
  5. Chinnasamy, G.; Chandrasekharan, S.; Koh, T.W.; Bhatnagar, S. Synthesis, characterization, antibacterial and wound healing efficacy of silver nanoparticles from Azadirachta indica. Front. Microbiol. 2021, 12, 204. [Google Scholar] [CrossRef]
  6. Chandhirasekar, K.; Thendralmanikandan, A.; Thangavelu, P.; Nguyen, B.-S.; Nguyen, T.-A.; Sivashanmugan, K.; Nareshkumar, A.; Nguyen, V.-H. Plant-extract-assisted green synthesis and its larvicidal activities of silver nanoparticles using leaf extract of Citrus medica, Tagetes lemmonii, and Tarenna asiatica. Mater. Lett. 2021, 287, 129265. [Google Scholar] [CrossRef]
  7. Chakravarty, A.; Ahmad, I.; Singh, P.; Sheikh, M.U.D.; Aalam, G.; Sagadevan, S.; Ikram, S. Green synthesis of silver nanoparticles using fruits extracts of Syzygium cumini and their bioactivity. Chem. Phys. Lett. 2022, 795, 139493. [Google Scholar] [CrossRef]
  8. Cardoso-Avila, P.E.; Patakfalvi, R.; Rodríguez-Pedroza, C.; Aparicio-Fernández, X.; Loza-Cornejo, S.; Villa-Cruz, V.; Martínez-Cano, E. One-pot green synthesis of gold and silver nanoparticles using Rosa canina L. extract. RSC Adv. 2021, 11, 14624–14631. [Google Scholar] [CrossRef]
  9. Davares, A.K.L.; Arsene, M.M.J.; Viktorovna, P.I.; Shommya, D. Enantia chlorantha and its Multiple Therapeutic Virtues: A Mini Review. J. Pharm. Res. Int. 2021, 33, 254–259. [Google Scholar] [CrossRef]
  10. Etame, R.E.; Mouokeu, R.S.; Pouaha, C.L.C.; Kenfack, I.V.; Tchientcheu, R.; Assam, J.P.A.; Poundeu, F.S.M.; Tiabou, A.T.; Etoa, F.X.; Kuiate, J.R.; et al. Effect of fractioning on antibacterial activity of Enantia chlorantha Oliver (Annonaceae) methanol extract and mode of action. Evid. Based Complement. Altern. Med. 2018, 2018, 4831593. [Google Scholar] [CrossRef] [Green Version]
  11. Abike, T.O.; Osuntokun, O.T.; Modupe, A.O.; Adenike, A.F.; Atinuke, A.R. Antimicrobial Efficacy, Secondary Metabolite Constituents, Ligand Docking of Enantia chlorantha on Selected Multidrug Resistance Bacteria and Fungi. J. Adv. Biol. Biotechnol. 2020, 23, 17–32. [Google Scholar] [CrossRef]
  12. Olivier, D.K.; Van Vuuren, S.F.; Moteetee, A. Annickia affinis and A. chlorantha (Enantia chlorantha)—A review of two closely related medicinal plants from tropical Africa. J. Ethnopharmacol. 2015, 176, 438–462. [Google Scholar] [CrossRef] [PubMed]
  13. Arsene, M.M.J.; Podoprigora Irina, V.; Davares, A.K.L. Galleria mellonella (greater wax moth) as an eco-friendly in vivo approach for the assessment of the acute toxicity of medicinal plants: Application to some plants from Cameroon. Open Vet. J. 2021, 11, 651–666. [Google Scholar] [CrossRef] [PubMed]
  14. Faghri, J.; Dehbanipour, R.; Rastaghi, S.; Sedighi, M.; Maleki, N. High prevalence of multidrug-resistance uropathogenic Escherichia coli strains, Isfahan, Iran. J. Nat. Sci. Biol. Med. 2016, 7, 22–26. [Google Scholar] [CrossRef] [PubMed] [Green Version]
  15. Arsene, M.M.J.; Zangue, D.S.C.; Ngoune, T.L.; Nyasha, K.; Louis, K. Antagonistic effects of raffia sap with probiotics against pathogenic microorganisms. Foods Raw Mater. 2021, 9, 24–31. [Google Scholar] [CrossRef]
  16. Motse, D.F.K.; Ngaba, G.P.; Koum, D.C.K.; Foko, L.P.K.; Ebongue, C.O.; Adiogo, D.D. Etiologic profile and sensitivity pattern of germs responsible for urinary tract infection among under-five children in Douala, Cameroon: A Hospital Based Study. Avicenna J. Clin. Microbiol. Infect. 2019, 6, 49–56. [Google Scholar] [CrossRef]
  17. Mbarga, M.J.A.; Davares, A.K.L.; Podoprigora Irina, V.; Smoliakova Larisa, A.; Suadkia, S.; Khelifi, I.; Sergueïevna, D.M. The public health issue of antibiotic residues in food and feed: Causes, consequences, and potential solutions. Vet. World 2022, 15, 662–671. [Google Scholar] [CrossRef]
  18. Arsène, M.M.J.; Podoprigora, I.V.; Davares, A.K.L.; Razan, M.; Das, M.S.; Senyagin, A.N. Antibacterial activity of grapefruit peel extracts and green-synthesized silver nanoparticles. Vet. World 2021, 14, 1330–1341. [Google Scholar] [CrossRef]
  19. Arsene, M.M.J.; Viktorovna, P.I.; Grigorievna, V.E.; Davares, A.K.L.; Sergeevna, D.M.; Nikolaevna, S.I. Prolonged exposure to antimicrobials induces changes in susceptibility to antibiotics, biofilm formation and pathogenicity in Staphylococcus aureus. J. Pharm. Res. Int. 2021, 33, 140–151. [Google Scholar] [CrossRef]
  20. Yuri, K.K.; Arsene, M.M.J.; Aliya, M.V.; Podoprigora Irina, V.; Volina Elena, G. Assessment of antimicrobial activity of ethanolic and aqueous extracts of Aesculus hippocastanum L. (horse chestnut) bark against bacteria isolated from urine of patients diagnosed positive to urinary tract infections. bioRxiv, 2021; in print. [Google Scholar] [CrossRef]
  21. Joseph, M.M.A.; Podoprigora Irina, V.; Davares, A.K.L.; Mouafo, H.T.; Manga, I.A.M.; Pavlovna, S.I.; Sergueïevna, D.M. Screening of antimicrobial activity of aqueous and ethanolic extracts of some medicinal plants from Cameroon and assessment of their synergy with common antibiotics against multidrug-resistant uropathogenic bacteria. bioRxiv, 2021; in print. [Google Scholar] [CrossRef]
  22. Mondal, A.H.; Yadav, D.; Mitra, S.; Mukhopadhyay, K. Biosynthesis of silver nanoparticles using culture supernatant of shewanella sp. Ary1 and their antibacterial activity. Int. J. Nanomed. 2020, 15, 8295–8310. [Google Scholar] [CrossRef]
  23. Berlutti, F.; Frioni, A.; Natalizi, T.; Pantanella, F.; Valenti, P. Influence of sub-inhibitory antibiotics and flow condition on Staphylococcus aureus ATCC 6538 biofilm development and biofilm growth rate: BioTimer assay as a study model. J. Antibiot. 2014, 67, 763–769. [Google Scholar] [CrossRef] [PubMed]
  24. Habibipour, R.; Moradi-Haghgou, L.; Farmany, A. Green synthesis of AgNPs@ PPE and its Pseudomonas aeruginosa biofilm formation activity compared to pomegranate peel extract. Int. J. Nanomed. 2019, 14, 6891–6899. [Google Scholar] [CrossRef] [PubMed] [Green Version]
  25. Demgne, O.M.F.; Mbougnia, J.F.T.; Seukep, A.J.; Mbaveng, A.T.; Tene, M.; Nayim, P.; Wamba, B.E.N.; Guefack, M.-G.F.; Beng, V.P.; Tane, P.; et al. Antibacterial phytocomplexes and compounds from Psychotria sycophylla (Rubiaceae) against drug-resistant bacteria. Adv. Tradit. Med. 2021, 1–12. [Google Scholar] [CrossRef]
  26. Thitilertdecha, N.; Teerawutgulrag, A.; Rakariyatham, N. Antioxidant and antibacterial activities of Nephelium lappaceum L. extracts. LWT Food Sci. Technol. 2008, 41, 2029–2035. [Google Scholar] [CrossRef]
  27. Muala, W.C.B.; Desobgo, Z.S.C.; Jong, N.E. Optimization of extraction conditions of phenolic compounds from Cymbopogon citratus and evaluation of phenolics and aroma profiles of extract. Heliyon 2021, 7, e06744. [Google Scholar] [CrossRef]
  28. Onivogui, G.; Letsididi, R.; Diaby, M.; Wang, L.; Song, Y. Influence of extraction solvents on antioxidant and antimicrobial activities of the pulp and seed of Anisophyllea laurina R. Br. ex Sabine fruits. Asian Pac. J. Trop. 2015, 6, 20–25. [Google Scholar] [CrossRef] [Green Version]
  29. Mouafo, H.T.; Tchuenchieu, A.D.K.; Nguedjo, M.W.; Edoun, F.L.E.; Tchuente, B.R.T.; Medoua, G.N. In vitro antimicrobial activity of Millettia laurentii De Wild and Lophira alata Banks ex CF Gaertn on selected foodborne pathogens associated to gastroenteritis. Heliyon 2021, 7, e06830. [Google Scholar] [CrossRef]
  30. Evbuomwan, L.; Chukwuka, E.P.; Obazenu, E.I.; Ilevbare, L. Antibacterial Activity of Vernonia amygdalina Leaf Extracts against Multidrug Resistant Bacterial Isolates. J. Appl. Sci. Environ. Manag. 2018, 22, 17–21. [Google Scholar] [CrossRef] [Green Version]
  31. Ibrahim, L.B. Antidiabetic Activity and Pharmacodynamic Interaction of Combined Administration of Ethanolic Stem Bark Extract of Enantia chlorantha and Lisinopril in Type 2 Diabetic Rats. Ph.D. Thesis, Kwara State University, Malete, Nigeria, 2019. Available online: https://www.proquest.com/openview/ebed11153ea830f88d5d0ba9dcc21f80/1?pq-origsite=gscholar&cbl=18750&diss=y (accessed on 28 June 2021).
  32. Ibrahim, L.B.; Idowu, P.F.; Moses, O.A.; Alabi, M.A.; Ajani, E.O. Antidiabetic Potential of Stem Bark Extract of Enantia chlorantha and Lack of Modulation of Its Therapeutic Efficacy in Diabetic Rats Co-Administered with Lisinopril. Acta Chim. Slov. 2021, 68, 118–127. [Google Scholar] [CrossRef]
  33. Priya, D.S.; Sankaravadivu, S.; Sudha, S.; Christy, H.K.S. Green synthesis and Characterisation of Silver Nanoparticles Using Phallusia nigra. Ann. Rom. Soc. Cell Biol. 2021, 25, 12948–12957. [Google Scholar]
  34. Gudimalla, A.; Jose, J.; Varghese, R.J.; Thomas, S. Green synthesis of silver nanoparticles using Nymphae odorata extract incorporated films and antimicrobial activity. J. Polym. Environ. 2021, 29, 1412–1423. [Google Scholar] [CrossRef]
  35. Vadlapudi, V.; Amanchy, R. Phytofabrication of silver nanoparticles using Myriostachya wightiana as a novel bioresource, and evaluation of their biological activities. Braz. Arch. Biol. Technol. 2017, 60, e17160329. [Google Scholar] [CrossRef] [Green Version]
  36. Kim, G.W.; Shin, D.; Yang, M. Optical Property Change of Silver Nanowire Thin Films in Laser Patterning Process. Int. J. Precis. Eng. Manuf. 2020, 21, 301–308. [Google Scholar] [CrossRef]
  37. Scolaro, C.; Visco, A.; Torrisi, L. Laser welding of polymeric nanocomposites filled with silver nanoparticles produced by laser ablation. J. Instrum. 2020, 15, C02037. [Google Scholar] [CrossRef]
  38. Długosz, O.; Banach, M. Continuous synthesis of metal and metal oxide nanoparticles in microwave reactor. Colloids Surf. A Physicochem. Eng. 2020, 606, 125453. [Google Scholar] [CrossRef]
  39. Kumar, R.; Kumar, S.; Jewaria, P.K.; Devi, P. A study on green synthesis of silver nanoparticles using Murraya koenigii aqueous leaf extract. Int. J. Chem. Stud. 2020, 8, 2757–2759. [Google Scholar] [CrossRef]
  40. Obodovskiy, I. Radiation methods of matter composition analysis. In Radiation; Elsevier: Amsterdam, The Netherlands, 2019; pp. 293–301. [Google Scholar]
  41. Mittelman, A.M.; Fortner, J.D.; Pennell, K.D. Effects of ultraviolet light on silver nanoparticle mobility and dissolution. Environ. Sci. Nano. 2015, 2, 683–691. [Google Scholar] [CrossRef]
  42. Shankar, P.D.; Shobana, S.; Karuppusamy, I.; Pugazhendhi, A.; Ramkumar, V.S.; Arvindnarayan, S.; Kumar, G. A review on the biosynthesis of metallic nanoparticles (gold and silver) using bio-components of microalgae: Formation mechanism and applications. Enzym. Microb. Technol. 2016, 95, 28–44. [Google Scholar] [CrossRef]
  43. Pandey, S.; De Klerk, C.; Kim, J.; Kang, M.; Fosso-Kankeu, E. Eco friendly approach for synthesis, characterization and biological activities of milk protein stabilized silver nanoparticles. Polymers. 2020, 12, 1418. [Google Scholar] [CrossRef]
  44. Wang, L.; Hu, C.; Shao, L. The antimicrobial activity of nanoparticles: Present situation and prospects for the future. Int. J. Nanomed. 2017, 12, 1227. [Google Scholar] [CrossRef]
  45. Volleková, A.; Košt’álová, D.; Kettmann, V.; Tóth, J. Antifungal activity of Mahonia aquifolium extract and its major protoberberine alkaloids. Phytother. Res. 2003, 17, 834–837. [Google Scholar] [CrossRef] [PubMed]
  46. Khameneh, B.; Iranshahy, M.; Soheili, V.; Bazzaz, B.S.F. Review on plant antimicrobials: A mechanistic viewpoint. Antimicrob. Resist. Infect. Control. 2019, 8, 118. [Google Scholar] [CrossRef] [PubMed] [Green Version]
  47. Mahamoud, A.; Chevalier, J.; Alibert-Franco, S.; Kern, W.V.; Pagès, J.M. Antibiotic efflux pumps in Gram-negative bacteria: The inhibitor response strategy. J. Antimicrob. Chemother. 2007, 59, 1223–1229. [Google Scholar] [CrossRef] [PubMed]
  48. Padilla, E.; Llobet, E.; Doménech-Sánchez, A.; Martínez-Martínez, L.; Bengoechea, J.A.; Albertí, S. Klebsiella pneumoniae AcrAB efflux pump contributes to antimicrobial resistance and virulence. Antimicrob. Agents Chemother. 2010, 54, 177–183. [Google Scholar] [CrossRef] [Green Version]
  49. Ni, R.T.; Onishi, M.; Mizusawa, M.; Kitagawa, R.; Kishino, T.; Matsubara, F.; Tsuchiya, T.; Kuroda, T.; Ogawa, W. The role of RND-type efflux pumps in multidrug-resistant mutants of Klebsiella pneumoniae. Sci. Rep. 2020, 10, 10876. [Google Scholar] [CrossRef]
  50. Rai, M.; Kon, K.; Ingle, A.; Duran, N.; Galdiero, S.; Galdiero, M. Broad-spectrum bioactivities of silver nanoparticles: The emerging trends and future prospects. Appl. Microbiol. Biotechnol. 2014, 98, 1951–1961. [Google Scholar] [CrossRef]
  51. Sondi, I.; Salopek-Sondi, B. Silver nanoparticles as antimicrobial agent: A case study on E. coli as a model for Gram-negative bacteria. J. Colloid Interface Sci. 2004, 275, 177–182. [Google Scholar] [CrossRef]
  52. Banerjee, M.; Mallick, S.; Paul, A.; Chattopadhyay, A.; Ghosh, S.S. Heightened reactive oxygen species generation in the antimicrobial activity of a three components iodinated chitosan—Silver nanoparticle composite. Langmuir 2010, 26, 5901–5908. [Google Scholar] [CrossRef]
  53. Pal, S.; Tak, Y.K.; Song, J.M. Does the antibacterial activity of silver nanoparticles depend on the shape of the nanoparticle? A study of the gram-negative bacterium Escherichia coli. Appl. Environ. Microbiol. 2007, 73, 1712–1720. [Google Scholar] [CrossRef] [Green Version]
  54. Kuete, V. Potential of Cameroonian plants and derived products against microbial infections: A review. Planta Med. 2010, 76, 1479–1491. [Google Scholar] [CrossRef]
  55. Kuete, V.; Efferth, T. Cameroonian medicinal plants: Pharmacology and derived natural products. Front. Pharmacol. 2010, 1, 123. [Google Scholar] [CrossRef] [PubMed] [Green Version]
  56. Oussou, K.R.; Coffi, K.; Nathalie, G.S.; Gerard, K.; Mireille, D.; Yao, T.N.; Gille, F.; Jean-Claude, C.H. Activités antibactériennes des huiles essentielles de trois plantes aromatiques de Côte d’Ivoire. Comptes Rendus. Chim. 2008, 7, 1081–1086. [Google Scholar] [CrossRef]
  57. Teke, G.N.; Kuiate, J.R.; Kuete, V.; Teponno, R.B.; Tapondjou, L.A.; Tane, P.; Giacinti, G.; Vilarem, G. Bio guided isolation of potential antimicrobial and antioxidant agents from the stem bark of Trilepisium madagascariense. S. Afr. J. Bot. 2011, 77, 319–327. [Google Scholar] [CrossRef] [Green Version]
  58. Ngongang, F.C.M.; Fankam, A.G.; Mbaveng, A.T.; Wamba, B.E.N.; Nayim, P.; Beng, V.P.; Kuete, V. Methanol extracts from Manilkara zapota with moderate antibacterial activity displayed strong antibiotic-modulating effects against multidrug-resistant phenotypes. Pharmacology 2020, 3, 37. [Google Scholar] [CrossRef]
  59. Benelli, G.; Maggi, F.; Petrelli, R.; Canale, A.; Nicoletti, M.; Rakotosaona, R.; Rasoanaivo, P. Not ordinary antimalarial drugs: Madagascar plant decoctions potentiating the chloroquine action against Plasmodium parasites. Ind. Crops Prod. 2017, 103, 19–38. [Google Scholar] [CrossRef]
  60. Casciaro, B.; Mangiardi, L.; Cappiello, F.; Romeo, I.; Loffredo, M.R.; Iazzetti, A.; Calcaterra, A.; Goggiamani, A.; Ghirga, F.; Mangoni, M.L.; et al. Naturally-occurring alkaloids of plant origin as potential antimicrobials against antibiotic-resistant infections. Molecules 2020, 25, 3619. [Google Scholar] [CrossRef]
  61. Kumar, P.; Srivastava, V.; Chaturvedi, R.; Sundar, D.; Bisaria, V.S. Elicitor enhanced production of protoberberine alkaloids from in vitro cell suspension cultures of Tinospora cordifolia (Willd.) Miers ex Hook. F. Thoms. Plant Cell Tissue Organ Cult. 2017, 130, 417–426. [Google Scholar] [CrossRef]
  62. Alam, K.; Al Farraj, D.A.; Mah-E-Fatima, S.; Yameen, M.A.; Elshikh, M.S.; Alkufeidy, R.M.; Mustafa, A.E.-Z.M.; Bhasme, P.; Alshammari, M.K.; Alkubaisi, N.A.; et al. Anti-biofilm activity of plant derived extracts against infectious pathogen-Pseudomonas aeruginosa PAO1. J. Infect. Public Health 2020, 13, 1734–1741. [Google Scholar] [CrossRef]
  63. Martinez-Gutierrez, F.; Boegli, L.; Agostinho, A.; Sánchez, E.M.; Bach, H.; Ruiz, F.; James, G. Anti-biofilm activity of silver nanoparticles against different microorganisms. Biofouling 2013, 29, 651–660. [Google Scholar] [CrossRef]
  64. Swidwinska-Gajewska, A.M.; Czerczak, S. Nanosrebro-szkodliwe skutki dzialania biologicznego/nanosilver-harmful effects of biological activity. Med. Pr. 2014, 65, 831. [Google Scholar]
  65. Goller, C.C.; Romeo, T. Environmental influences on biofilm development. Bact. Biofilms 2008, 322, 37–66. [Google Scholar] [CrossRef]
  66. Mah, T.F.C.; O’Toole, G.A. Mechanisms of biofilm resistance to antimicrobial agents. Trends Microbiol. 2001, 9, 34–39. [Google Scholar] [CrossRef]
  67. Stewart, P.S.; Costerton, J.W. Antibiotic resistance of bacteria in biofilms. Lancet 2001, 358, 135–138. [Google Scholar] [CrossRef]
  68. Bakaletz, L.O. Bacterial biofilms in otitis media: Evidence and relevance. Pediatr. Infect. Dis. J. 2007, 26, S17–S19. [Google Scholar] [CrossRef] [PubMed]
  69. Brady, R.A.; Leid, J.G.; Calhoun, J.H.; Costerton, J.W.; Shirtliff, M.E. Osteomyelitis and the role of biofilms in chronic infection. FEMS Immunol. Med. Microbiol. 2008, 52, 13–22. [Google Scholar] [CrossRef] [PubMed] [Green Version]
  70. Høiby, N. Understanding bacterial biofilms in patients with cystic fibrosis: Current and innovative approaches to potential therapies. J. Cyst. Fibros. 2002, 1, 249–254. [Google Scholar] [CrossRef] [Green Version]
  71. Post, J.C.; Stoodley, P.; Hall–Stoodley, L.; Ehrlich, G.D. The role of biofilms in otolaryngologic infections. Curr. Opin. Otolaryngol. Head Neck Surg. 2004, 12, 185–190. [Google Scholar] [CrossRef]
  72. Ames, G.A.; Swogger, E.; Wolcott, R.; deLancey Pulcini, E.; Secor, P.; Sestrich, J.; Costerton, J.W.; Stewart, P.S. Biofilms in chronic wounds. Wound Repair Regen. 2008, 16, 37–44. [Google Scholar] [CrossRef]
  73. Canadian Centre for Occupational Health and Safety Act (CCOHS). What Is a LD50 and LC50? Available online: https://www.ccohs.ca/oshanswers/chemicals/ld50.html (accessed on 2 June 2021).
  74. Mann, R.; Holmes, A.; McNeilly, O.; Cavaliere, R.; Sotiriou, G.A.; Rice, S.A.; Gunawan, C. Evolution of biofilm-forming pathogenic bacteria in the presence of nanoparticles and antibiotic: Adaptation phenomena and cross-resistance. J. Nanobiotechnol. 2021, 19, 291. [Google Scholar] [CrossRef]
  75. Latimer, J.; Forbes, S.; McBain, A.J. Attenuated virulence and biofilm formation in Staphylococcus aureus following sublethal exposure to triclosan. Antimicrob Agents Chemother. 2012, 56, 3092–3100. [Google Scholar] [CrossRef] [Green Version]
  76. Sachivkina, N.P.; Karamyan, A.S.; Kuznetsova, O.M.; Byakhova, V.M. Development of therapeutic transdermal systems for microbial biofilm destruction. FEBS Open Bio. 2019, 9, 386. [Google Scholar]
  77. Kravtsov, E.G.; Anokhina, I.V.; Rybas, Y.A.; Sachivkina, N.P.; Ermolaev, A.V.; Brodskaya, S.B. Effects of female sex hormones on adhesion of candida albicans yeast-like fungi to the buccal epithelium. Bull. Exp. Biol. Med. 2014, 157, 246–248. [Google Scholar] [CrossRef] [PubMed]
  78. Sachivkina, N.P.; Kravtsov, E.G.; Vasilyeva, E.A.; Anokhina, I.V.; Dalin, M.V. Study of antimycotic activity of Lyticase. Bull. Exp. Biol. Med. 2009, 148, 214–216. [Google Scholar] [CrossRef] [PubMed]
Figure 1. Color change after green synthesis of AgNPs with various concentrations of AgNO3.
Fermentation 08 00530 g001
Figure 2. UV-Vis spectrum of solutions with green-synthetized silver nanoparticles.
Fermentation 08 00530 g002
Figure 3. XRF spectra of dry Enantia chlorantha bark extract (black) and solutions of green-synthesized AgNPs (red) and silver nanoparticle standard (blue) with the characteristic energy of silver fluorescence—silver Kα line of 22.105 keV.
Fermentation 08 00530 g003
Figure 4. FTIR spectra of the Enantia chlorantha bark extract (black) and green-synthetized silver nanoparticles t (red) in the range from 3500 to 700 cm−1 (A) and 1750 to 750 cm−1 (B).
Fermentation 08 00530 g004
Figure 5. Radar chart obtained from Excel software showing the inhibition diameters of various concentrations of E. Chlorantha bark on the tested strains.
Fermentation 08 00530 g005
Figure 6. Radar chart obtained from Excel software showing the inhibition diameters of various concentrations of green-synthetized AgNPs using E. Chlorantha bark extract on the tested strains.
Fermentation 08 00530 g006
Figure 7. PCA analysis of MIC, MBC, and ratio MBC/MIC of optimized ethanolic extract of E. chlorantha bark (O-ECB) and green-synthetized AgNPs against various microorganisms.
Fermentation 08 00530 g007
Figure 8. Antibiofilm activity of optimized ethanolic extract of E. chlorantha bark (O-ECB) and green-synthetized silver nanoparticles (AgNPs).
Fermentation 08 00530 g008
Figure 9. The action of optimized ethanolic bark extract of Enantia chlorantha (A) and AgNPs (B) on E. coli ATCC 25922 growth kinetic. MIC = minimum inhibitory concentration.
Fermentation 08 00530 g009
Figure 10. The action of optimized ethanolic bark extract of Enantia chlorantha (A) and AgNPs (B) on E. coli ATCC 25922 H+-ATPase-mediated proton pumping. MIC = minimum inhibitory concentration.
Fermentation 08 00530 g010
Figure 11. In vivo antimicrobial activity of AgNPs and O-ECB on larval form of Galleria mellonella challenged with S. aureus ATCC 6538 and E. coli ATCC 25922.
Fermentation 08 00530 g011
Table 1. Results of the extraction procedure of E. chloranta bark using the Box–Behnken experimental matrix.
Coded VariablesExperimental VariablesVolume Yield (%)Mass Yield (%)Inhibition Diameter of S. aureus (mm)
Trial% EtOH
(X1)
Ratio m/v (X2)Temps (X3)% EtOH (X1)Ratio m/v (X2)Time in Hours (X3)ExpTheoExpTheoExpTheo
110110015/1002493.0092.3713.1012.2027.0023.88
21−1010010/1001597.0097.1210.509.9324.0024.38
301−15020/100687.0086.509.508.8321.0018.25
4−1−10010/1001594.0093.127.306.288.007.88
5−110020/1001587.0086.877.506.6814.0013.63
611010020/1001584.0084.8712.8010.2326.0026.13
70005015/1001593.0093.338.608.7319.0017.00
80005015/1001594.0093.338.908.7315.0017.00
9−10−1015/100690.0090.627.608.5011.009.63
1010−110015/100692.0091.6213.0012.0527.0025.13
110−1−15010/100696.0096.258.408.5316.0013.00
120005015/1001593.0093.338.708.7317.0017.00
13−101015/1002491.0091.377.608.5513.0010.38
140−115010/1002496.0096.508.508.5816.0014.25
150115020/1002488.0087.759.108.9818.0016.50
Table 2. Analysis of variance for the regression models of volume yield, mass yield, and inhibition diameter of S. aureus ATCC 6538.
Volume Yield (%)Mass Yield (%)Inhibition Diameter (mm)
SourceSum of
Squares
F-Valuep-ValueSum of
Squares
F-Valuep-ValueSum of
Squares
F-Valuep-Value
Model197.41728.000.00156.342736.120.001467.98322.130.002
Linear174.25074.150.00049.255094.720.000448.75063.650.000
X12.0002.550.17147.0450271.410.000420.500178.940.000
X2171.125218.460.0002.205012.720.01628.12511.970.018
X31.1251.440.2840.00500.030.8720.1250.050.827
Square13.9175.920.0425.920211.380.01111.9831.700.282
X1 * X17.61911.200.0204.605826.760.0046.5192.970.145
X2 * X25.9847.860.0380.49592.310.1890.7910.220.658
X3 * X30.3140.400.5540.81854.720.0824.6731.990.218
Two-Way Interaction9.2503.940.0871.16752.250.2017.2501.030.455
X1 * X29.00011.490.0191.10256.360.0534.0001.700.249
X1 * X30.0000.001.0000.00250.010.9091.0000.430.543
X2 * X30.2500.320.5970.06250.360.5742.2500.960.373
Error3.917 0.8667 11.750
Lack of Fit3.2503.250.2440.820011.710.0803.7500.310.820
Pure Error0.667 0.0467 8.000
Total201.333 57.2093 479.733
Table 3. Validation parameters.
R2R2 AdjAADBfAf
Volume yield98.0594.550.0081.0001.008
Mass yield98.4995.760.0690.9701.069
Inhibition diameter97.5593.140.0880.9361.089
Table 4. Optimal extraction conditions of active compounds from Enantia chlorantha bark and composite desirability of volume yield, mass yield, and inhibition diameter.
% EtOHRatio m/vTime (h) D (mm)Mass Yield (%)Volume Yield (%)Composite Desirability
100 (1)20/100 (1)6 (−1)Solution28.62513.595-0.96
Experimental value3114.393
Table 5. Phytochemical composition of the optimized ethanolic bark extract of Enantia chlorantha.
No.NameRT, minStructurem/z, MS Spectram/z, MS/MS Spectra (CE 30 eV)%
1Compound 115, 24Fermentation 08 00530 i001314269, 253, 237, 211, 209, 192, 175, 160, 145, 143, 137, 121, 1071.86
2Compound 217, 68Fermentation 08 00530 i002328283, 269, 253, 237, 189, 174, 151, 121, 1070.64
3Compound 319, 66Fermentation 08 00530 i003314269, 253, 237, 211, 209, 192, 175, 145, 143, 137, 121, 1070.69
4Pseudorotundine20, 33Fermentation 08 00530 i004356192, 190, 1771.68
5Tetrahydropalmatine (Rotundine)23, 54Fermentation 08 00530 i005356192, 190, 1773.12
6Compound 6 + Unknown compound24, 19Fermentation 08 00530 i006328 (78%),
368 (22%)
283, 268, 252, 237, 189, 174, 145, 121, 107
+
353, 352, 338, 336, 324, 310, 307
1.83
7Jatrorrhizine24, 73Fermentation 08 00530 i007338323, 322, 308, 294, 27911.02
8Pseudocolumbamine25, 88Fermentation 08 00530 i008338323, 322, 308, 294, 279, 2656.33
9Columbamine +7,8-dihydro-8-hydroxypalmatine26, 29Fermentation 08 00530 i009338 (95%)323, 322, 308, 306, 294, 279, 277, 26519.21
370 (5%)355, 354, 340, 326, 312, 311
10Pseudopalmatine28, 19Fermentation 08 00530 i010352336, 320, 308, 294, 292, 2791.99
11Palmatine28, 98Fermentation 08 00530 i011352336, 322, 320, 308, 294, 292, 27851.63
Table 6. Mineral composition of optimized ethanolic bark extract of Enantia chlorantha.
Chemical ElementMean Fluorescence Intensity, cps/uAStandard Deviation
Si0.05810.0024
S0.20520.0028
Cl2.59420.0097
K0.65110.0010
Ca0.61850.0253
Mn0.14820.0033
Fe3.48540.0127
Zn0.16240.0014
Br4.65290.0114
Table 7. Minimal inhibitory concentrations (MICs), minimal bactericidal concentrations (MBCs), and minimal fungicidal concentrations (MFCs), of E. Chloranta bark extract and its green-synthetized AgNPs.
ExtractAgNPs
MIC (µg/mL)MBC (or MFC) (µg/mL)MBC (or MFC)/MICMIC (µg/mL)MBC (or MFC) (µg/mL)MBC (or MFC)/MIC
A. xylosoxidans 4892321284482
A. baumannii 58411632264641
C. freundi 426512>1024-641282
Conybacterium spp 16382565122641282
E. avium 16691285124641282
E. cloacae 6392512>1024-32321
E. faecalis 5960128512432642
E. coli M1712851248324
E. coli 14492565122641282
E. coli ATCC 25922128512416644
K. oxytoca 3003>1024>1024-32642
K. pneumoniae 1449>1024>1024-641282
K. rizophilia 1542512512132642
M. catarrhalis 422216322284
M. morganii 154325651228324
Ps mirabilis 1543256512216161
P. aeruginosa 305712851248324
S. marsescens 6441>1024>1024-641282
S. aureus 14492565122641282
S. aureus ATCC 653864512832642
S. simulans 5882512512164641
S. agalactiae 3984512>1024-641282
C. albicans ATCC 102318324641282
C. albicans12825625125121
Table 8. Synergy of ampicillin, kanamycin, and cefazolin with O-ECB and AgNPs.
E. coli 1449S. aureus 1449E. faecalis 5960
AmpicillinMIC/MBC1024/ND64/51232/64
FIC (AMP + O-ECB)0.015 (1/128)0.125 (1/16)0.125 (1/16)
FIC(AMP + AgNPs)0.250 (1/8)0.125 (1/16)0.125 (1/16)
KanamycinMIC/MBC32/1288/16128/128
FIC (KA + O-ECB)0.250 (1/8)0.250 (1/8)0.031 (1/64)
FIC(KA + AgNPs)0.125 (1/16)0.125 (1/16)0.125 (1/16)
CefazolinMIC/MBC64/1288/1664/256
FIC (CZ + O-ECB)0.250 (1/8)0.125 (1/8)0.031 (1/64)
FIC(CZ + AgNPs)0.500 (1/16)0.500 (1/16)0.500(1/16)
Table 9. LD50 of green-synthetized silver nanoparticles (AgNPs) and optimized ethanolic extract of Enantia chlorantha bark (O-ECB).
LD50
mg/mLg/kg of Body Weight
O-ECB40.0029.75
AgNPs0.60.4
Publisher’s Note: MDPI stays neutral with regard to jurisdictional claims in published maps and institutional affiliations.

