Article

Effect of Prolonged Fermentations of Coffee Mucilage with Different Stages of Maturity on the Quality and Chemical Composition of the Bean

by
Valentina Osorio Pérez
1,*,
Cristina Inés Álvarez-Barreto
2,
Luis Gerónimo Matallana
2,
José Ricardo Acuña
1,
Luz Fanny Echeverri
1 and
Luis Carlos Imbachí
1
1
National Coffee Research Center, Planalto, km. 4, Vía Antigua Chinchiná-Manizales, Manizales 170009, Colombia
2
Departamento de Ingeniería, Universidad de Caldas, Manizales 170007, Colombia
*
Author to whom correspondence should be addressed.
Fermentation 2022, 8(10), 519; https://doi.org/10.3390/fermentation8100519
Submission received: 29 August 2022 / Revised: 13 September 2022 / Accepted: 19 September 2022 / Published: 7 October 2022
(This article belongs to the Section Fermentation for Food and Beverages)

Abstract

:
The sensory quality of coffee begins in the plant tree, where the characteristics of the fruits define the composition of the chemical precursors, which can be preserved or transformed in stages such as mucilage fermentation, and are the basis for the beverage attributes. This study evaluated three degrees of maturity and their comportment in fermentation under two temperatures and two-time extensions, establishing their sensory and chemical characteristics through analytical techniques such as liquid and gas chromatography. The effect of the prolongation time was evidenced for oxalic, quinic, citric acids, glucose, and fructose in two of the three degrees of maturity evaluated. The interaction of the process conditions increased the content of fructose and glucose in one of the states, being more evident at 20 °C. The treatments associated with the most advanced stage of maturity and with higher temperature decreased the scores of five sensory attributes and the fructose content increased by 48.50% and the glucose content increased by 47.31%. Advanced stages of maturity preserve quality standards, but their performance can be differential in postharvest processes, especially in those that are beyond the standards, such as those involving prolongations in different processes such as fermentation.

1. Introduction

The quality of coffee is the result of the combination of multiple factors that converge in the productive system of the crop, each of which generates a unique chemical composition of the bean that is the basis for the expression of the sensory attributes of coffee [1,2]. The postharvest process begins with the selection of the fruit at the optimal state of maturity and ends with the drying of the bean, generating both positive and negative effects on the sensory characteristics of the coffee beverage. For many years, the research associated with this process was focused on the development of equipment and operational optimizations and controls to avoid the appearance of defects. Today, this process has a new perspective, and elements such as the degree of maturity and the biotechnological conditions of mucilage removal take on increasing importance in the sense that they can generate changes in the chemical composition of the coffee bean and finally be reflected in sensory quality [3,4].
The mucilage of coffee fruit is a hydrogel composed mainly of water, sugars, and pectic substances [5]. This covers or envelops the seed, representing approximately 22% of the weight of the pulped coffee. The amount depends largely on the degree of maturity of the grain [6]. The chemical composition of the mucilage in combination with yeasts, fungi, and bacteria present in the environment, on the surface of the fruit (phyllosphere microbiota), and in the equipment explains the natural occurrence of fermentation at room temperature without resorting to inoculations. Due to the high impact of the mucilage fermentation process on the sensory quality of coffee, numerous studies have emerged with the objective of generating control and consistency in the fermentation process. An important area of study includes the use of microbiological starter cultures [7,8,9,10,11]. Several authors have evaluated the ability of different starter cultures to improve the quality of coffee obtained by fermentation in wet, dry, and semidry processing methods, finding that coffees with different sensory profiles can be obtained [4,8]. While there is no consensus [12,13], some results show that the use of pure cultures for the fermentation process in coffee processing promotes consistency and control. Regarding the fermentation process [11], other studies show that the changes are not significant when compared with the sensory quality of the coffee obtained by spontaneous fermentation [12,14].
The microorganisms naturally present during the postharvest process (or processing) use the compounds of the peel and mucilage as substrates during fermentation. They produce organic acids and other metabolites that can affect the sensory characteristics of the beverage [15,16]. In the case of the fungal population during postharvest, they can affect the quality of the grain by generating negative flavors and producing mycotoxins [17]. The main factors that contribute to the formation of volatile compounds in coffee are the microbial metabolites and the inherent compounds of the beans, and these can be highly variable depending on the region of production and the variety of coffee used [16,18]. Numerous elements influence the formation of the aroma of coffee, and there is a delicate relationship between flavor and fermentation; with adequate controls, it can improve sensory qualities [11]. This can be attributed to the composition of the aroma precursors present in green coffee after fermentation. Numerous biological, chemical, and physical factors are involved in this process; however, temperature and oxygen availability have been referenced as the main external factors [19]. In the case of dry-processed coffee, the microbiota is much more varied and complex than that found in wet fermentations [9].
The microbial activities that occur during fermentation depend on the physicochemical properties of the peel and mucilage, and these conditions can be variable depending on the initial conditions of the coffee fruits and the type and processing conditions of the benefit. In this research, the effect of the state of maturity of the fruit on the spontaneous fermentation of the mucilage was determined at two external temperatures of the process and two prolonged fermentation times. This influence was determined in the variables of sensory quality and in the chemical composition of green almond coffee.

2. Materials and Methods

2.1. Coffee Fruits

Coffee fruits of the species Coffea arabica L., variety Castillo®, from the department of Caldas, Colombia, were collected with the method of pass retention [20], which ensured the maximum concentration of mature coffee. A total of 400 kg of fruits were processed (work unit), hydraulically classified to remove low-quality fruits, and subsequently separated into three degrees of maturity; for this research, there were 8 work units. The first state was associated with the red-orange color (EM1-a *: 25.16); the second state was associated with the crimson color (EM2-a *: 17.55); and the third state was associated with the garnet color (EM3-a *: 8.09). The chromatic coordinate a * refers to the average obtained for the 8 work units by state of maturity estimated with the CIEL * a * b * color scale.
The experimental units were formed by the stage of maturity, and the fruits were pulped with a 2500 horizontal machine with a circular sieve (Medellín, Colombia). Then, 80 kg of pulped coffee was taken by stage of maturity and divided for the four treatments (20 kg) corresponding to the spontaneous fermentation process at two temperatures, 15 and 20 °C, and two additional fermentation times. The prolongation of the fermentation was established as follows: the fermentation process was monitored following the FermaestroTM methodology [21]. This method verifies the exact moment when the degradation of the mucilage is completed by observing changes in the density of the coffee during the process. The methodology used a truncated cone-shaped perforated vessel, which is more sensitive to slight changes in volume. The decrease in volume of pulped coffee increase in the height of the empty space at the top of the appliance. When the height of the coffee in the device stabilizes, this indicates that the washing point has been reached. After the end time defined by this device, the grains continued the fermentation process for two additional times: 10 and 20 h. In this way, 12 treatments were configured (EM: maturity stage; T: temperature; t: extension time): EM1T15t10, EM1T15t20, EM1T20t10, EM1T20t20, EM2T15t10, EM2T15t20, EM2T20t10, EM2T20t20, EM3T15t10, and EM3T20t20 (Figure 1). After fermentation, in 30 L plastic containers, the coffee was washed, classified, and dried in a mechanical static layer dryer with indirect combustion, propane gas as fuel and with an air flow rate of 100 m3/min/t cps at 40 °C to a humidity range of 10 to 12%.
During the development of the process, internal temperature of pulped coffee volume was monitored every four hours, and the pH, titratable acidity, and Brix degrees of the mucilage were evaluated until the end of the total fermentation process.

2.2. Temperature, pH, Degrees Brix, and Titratable Acidity

For temperature monitoring, a stainless-steel probe thermometer with an accuracy of ± 0.3 °C was used. For the determination of pH, a Mettler Toledo MP 230 pH device (Im Langacher, Switzerland) was used. The Brix degrees were determined with the Bellingham Stanley RFM742 refractometer (Bradford, UK); results were compensated by temperature at 20 °C, with a resolution of 0.01 and accuracy ± 0.04. Titratable acidity was determined by volumetric titration with a basic reagent (NaOH) until reaching pH 8.3 in a Mettler Toledo DL 53 titrator (Im Langacher, Switzerland). The result is expressed in mg CaCO3/L of the solution. For pH and temperature, the electrode was introduced into the volume of pulped coffee; for Brix degrees and titratable acidity, a sample of the liquid mucilage was taken.

2.3. High-Performance Liquid Chromatography HPLC

The compounds of interest were obtained from ground green coffee using water type I as the solvent. Sugars were obtained by refluxing for 30 min of 0.02 g of green coffee, subsequent centrifugation at 10,000 rpm, and filtration of 1.00 mL of the solution through 0.45 μm filters. Organic acids were obtained by stirring 0.08 g of green coffee and sedimentation at 20 °C for 15 min and filtration of 1.00 mL of the solution through 0.45 μm filters. In the separation and quantification of sugars, an Alliance 2690 HPLC system coupled to a refractive index detector 2414 was used, and the process was performed in a Sugar Pack I column (Waters, 6.5 × 300 mm, 10 µm) (Connecticut, USA) at 85 °C using deionized water at a flow rate of 0.5 mL/min. Organic acids and alkaloids were determined using a Waters 600E HPLC system coupled to a diode array detector (DAD-996) (Connecticut, USA) with a Hi-Plex H column (Agilent, 7.7 × 300 mm, 8 µm) (California, USA) at a temperature of 50 °C and a flow of 0.5 mL/min with deionized water (acidified: 0.01 M H2SO4) and detected at 210 nm. For the determination of alkaloids, a Symmetry C18 column (Waters, 4.6 mm × 250 mm, 100 Å, 5 µm) (Connecticut, USA) was used at 35 °C, with a flow of 1.0 mL/min using a mixture of water, methanol, and acetic acid (59:40:1 v/v/v) and detection at 273 nm.

2.4. Gas Chromatography

The composition of free fatty acids present in the lipid fraction of green almond coffee was determined by gas chromatography coupled to a mass selective detector (HP-8860-MSD 6890) (California, USA) using the reference method AOAC 969.33. Free fatty acids were esterified from 80 µL of lipid extract, which was esterified with 1 mL of a 20% boron trifluoride methanolic solution at 80 °C for 1 h. Free fatty acids were extracted from the methanolic solution by two successive liquid–liquid extractions with 1 mL of hexane. The samples were shaken and after 5 min, the two-phase separation was completed. The separation of the compounds was performed with an HP-MS column (5% phenylmethylsiloxane 30 × 250 µm × 0.25 µm) (California, USA) with a temperature ramp program of 20 °C/min from 90 to 260 °C and a constant helium flow of 1.2 mL/min. The structural confirmation of the fatty acids present in the sample was performed from the mass spectra obtained and compared with databases (NIST2017).

2.5. Total Chlorogenic Acids, Total Lipids, and Total Protein

The determination of the total content of chlorogenic acids was performed in a Beckman spectrophotometer (DU-650) (California, USA) using three wavelengths of 265, 328, and 380 nm after extraction with aqueous methanol and purification with Carrez reagents. For the quantification of the lipid fraction, extraction by Soxhlet was used, followed by the rotary evaporation process according to the AOAC 945.16 analysis method. The determination of total protein was performed using the method based on the principle of Dumas 990.03 of AOAC, 2005, through combustion with a controlled oxygen supply, in which the organic matter is destroyed at high temperatures, generating nitrogen and carbon gases, which are quantified by an IR detection cell and a thermal conductivity cell. The protein value was obtained by multiplying the percentage of nitrogen obtained from the elemental analysis by a factor of 6.25.

2.6. Physical and Sensory Quality

The physical quality included the determination of the moisture content, the percentage of loss, defective grains, brocaded grains, black grains and vinegars, and healthy almonds [22]. The sensory evaluation was performed by five certified Q-Grader tasters following the SCA (Specialty Coffee Association) protocol. This methodology includes the beverage preparation protocol: degree and roasting times (55–65 Agtron/SCA, 8–12 min), coffee proportion, grinding granulometry, water temperature, and quality and analysis temperatures. Ten sensory attributes were recorded: fragrance/aroma, flavor, residual flavor, acidity, body, balance, uniformity, clean cup, sweetness, taste score, defects, and total score.

2.7. Statistical Analysis

For each maturity stage, the response variables were analyzed with an analysis of variance corresponding to a completely randomized experimental design model in a 2 × 2 factorial arrangement at a significance level α = 0.05. When the analysis of variance showed the effect of treatments (p-value < 0.05), Duncan’s multiple comparison test (α = 0.05) was performed on the treatments to identify the effect of temperatures and/or prolonged fermentation times.

3. Results and Discussion

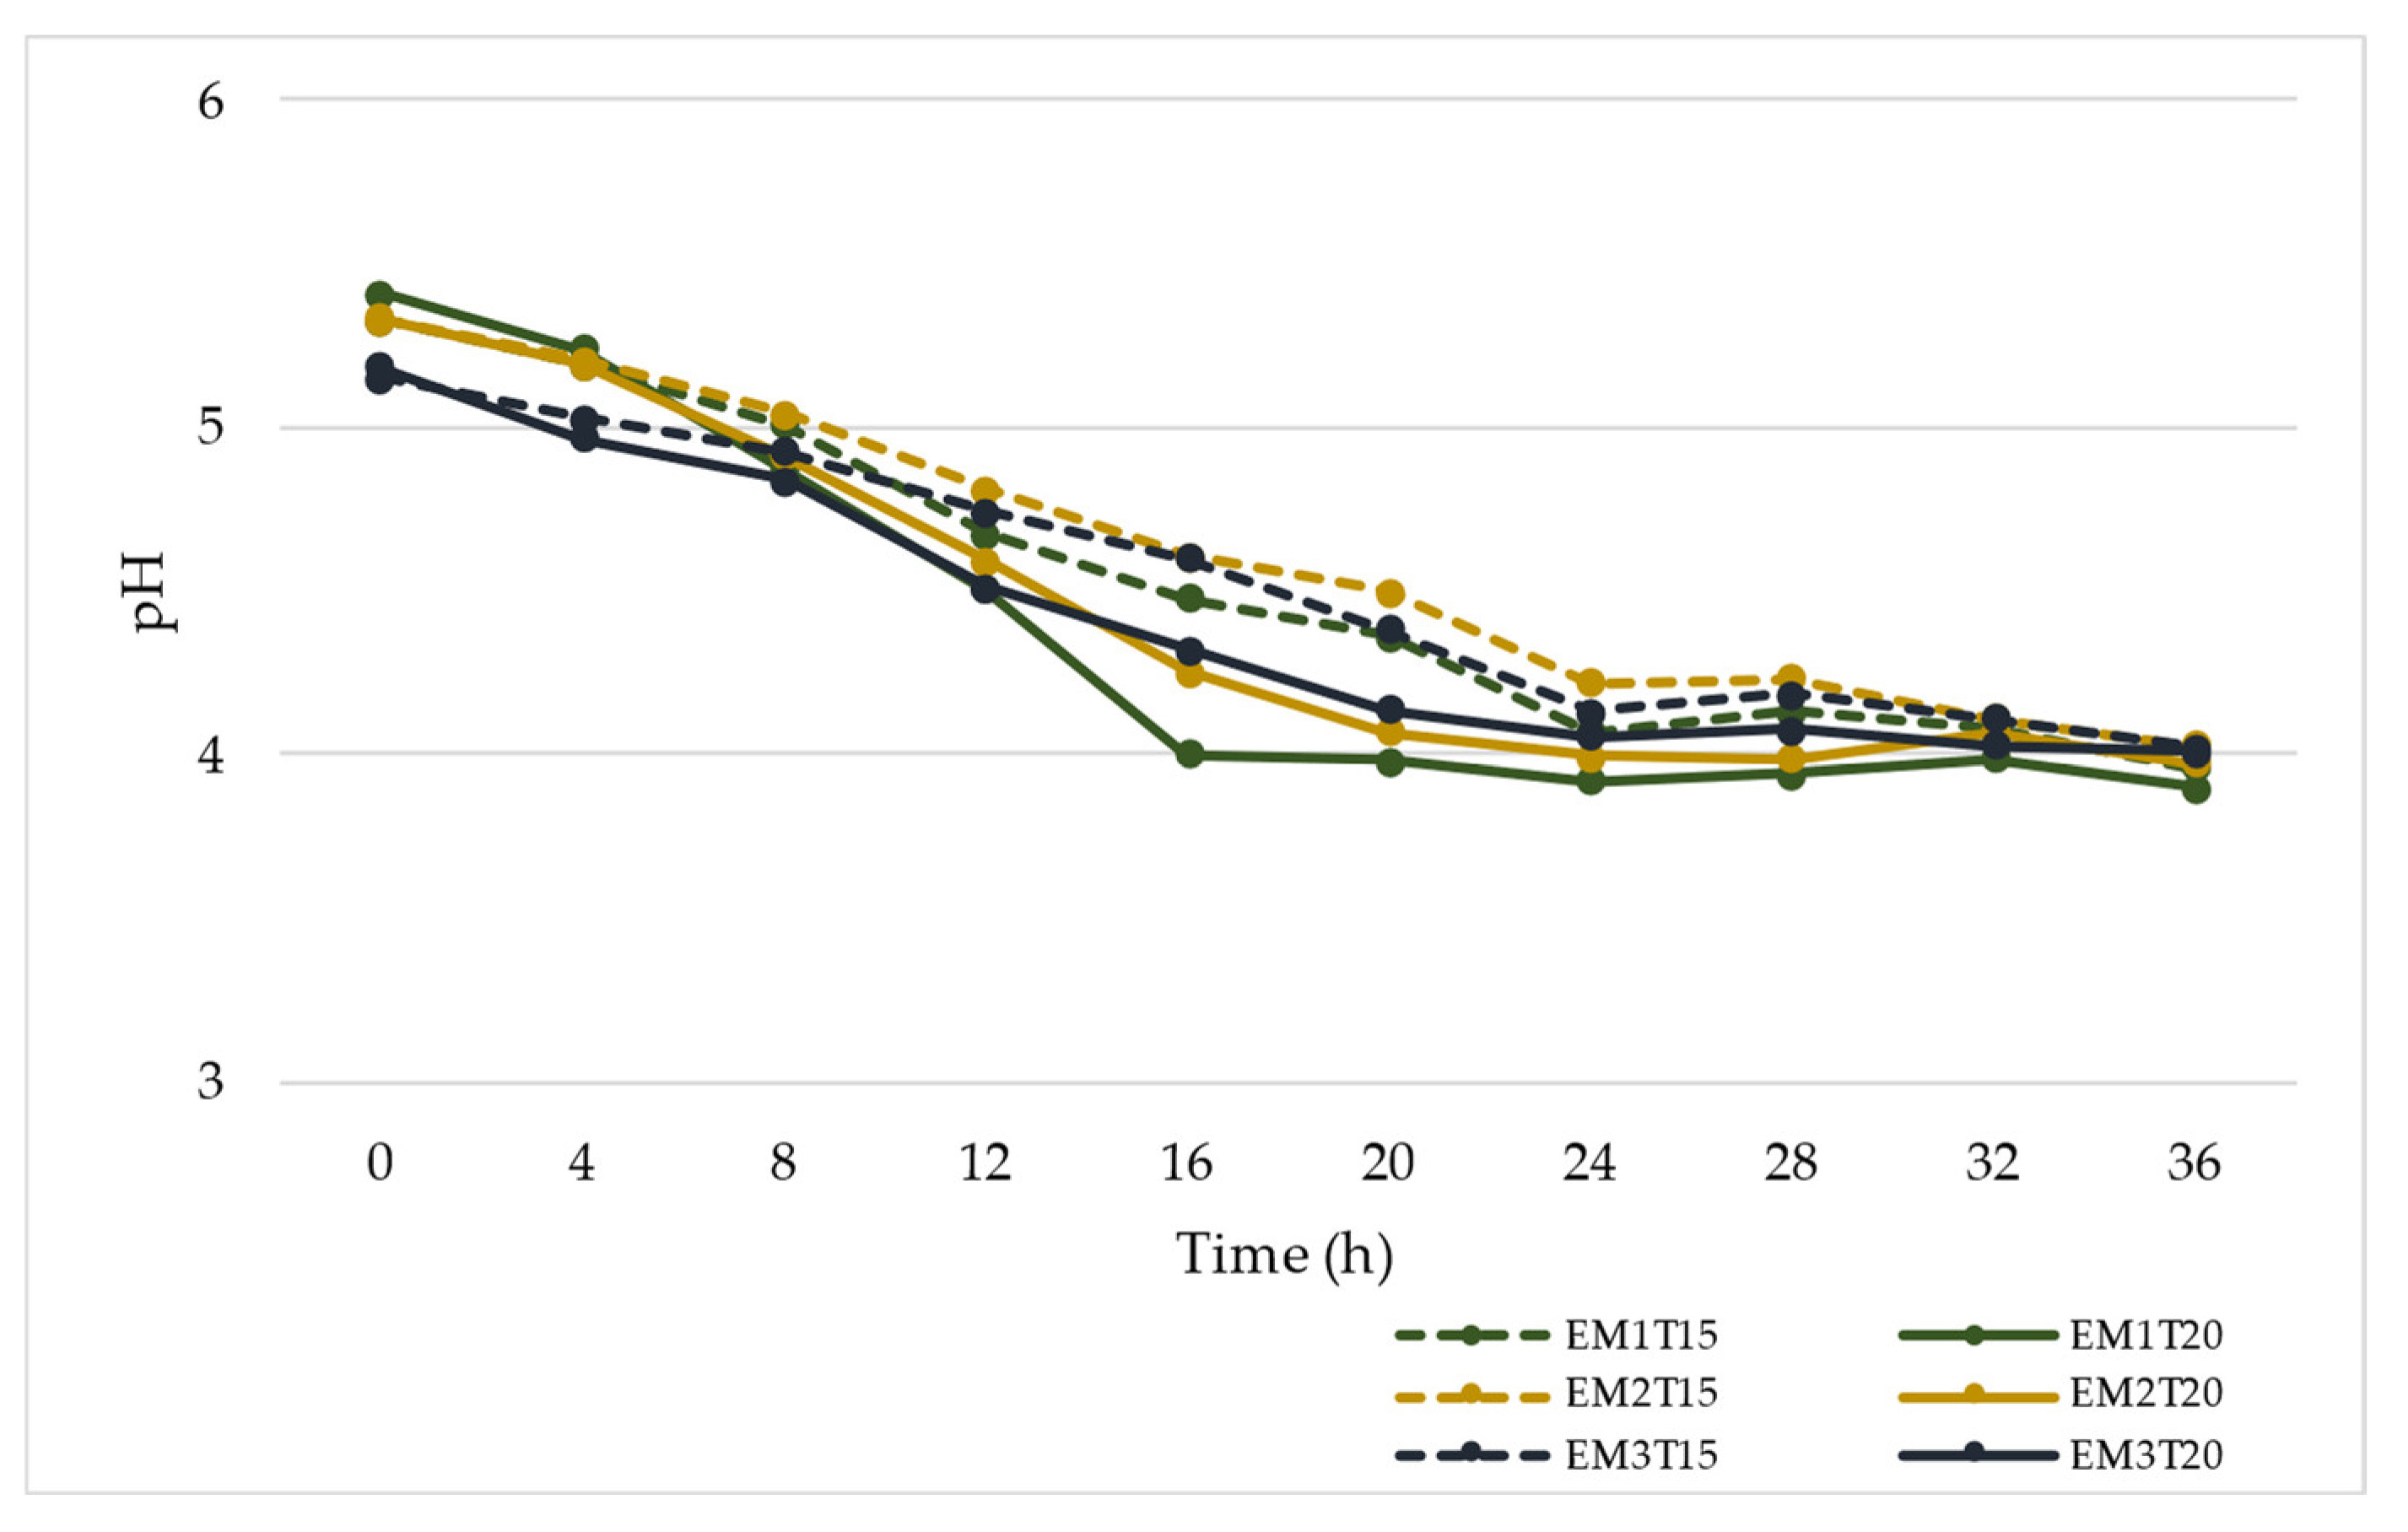
3.1. Temperature, pH, Degrees Brix, and Titratable Acidity

The comportment of the variables was monitored at four-hour intervals. The treatments with an extension time of 10 h after estimating the washing point of the coffee with FermaestroTM had an average total processing time of 24 h, while for the extension of 20 h, it was 36 h.
The process temperatures of 15 °C and 20 °C generated differences in the internal temperature of the samples as the fermentation time of the coffee mucilage increased. The twelve treatments began the process with an average temperature of 21.81 °C, but the difference was evident between hours 16 and 24. For hours 16, 20, and 24, the treatments with a process temperature of 15 °C presented temperature averages of 19.67 °C, 19.53 °C, and 19.67 °C, and the treatments with a process temperature of 20 °C had average temperatures of 23.29 °C, 24.42 °C, and 24.59 °C, respectively. Correa et al., 2014 [23], reported an average temperature of 21.2 °C for a spontaneous fermentation of 20 h. The average temperatures described above are part of the optimal range for the growth of most microorganisms. The greatest difference between the treatments with process temperatures of 15 °C and 20 °C was 4.92 °C at hour 24, and this difference decreased to 3.78 °C at hour 36. The mass was explained by the exothermic process generated by microbial growth. The comportment of the temperature is contrary to that reported by de Oliveira Junqueira et al., 2019 [7], where the temperature had an initial average value of 28 °C and decreased until hour 12 when it stabilized, ending at hour 48 with an average value of 18 °C.
The pH at time zero of fermentation presented an average value of 5.29 for all treatments, similar to the value of 5.4 reported by de Melo Pereira et al., 2015 [12]. It shows a strong decrease until hour 16 (Figure 2), reaching an average value of 4.38, then continues to show decreases in its value, but less accentuated and reaches an average value of 3.96 at hour 36. The pH of the coffee mucilage during fermentation of fruits with different stages of maturity shows a negative linear comportment within the evaluated times. As in the temperature in monitoring hours 16 and 24, a separation of the treatments was generated with different process temperatures (15 and 20 °C). The treatments with a process temperature of 15 °C had values of 4.56 and 4.14, and the treatments with a temperature of 20 °C had values of 4.19 and 3.99, respectively. At hour 36, these average values of the treatments with different process temperatures were equal to a value of 3.96. The minimum pH value found was 3.90, which was present in the EM1T20t20 treatment at hour 36, while the maximum value of 5.41 was observed at time zero for these same treatments. The initial pH value and the comportment coincide with that found by de Oliveira Junqueira et al., 2019 [7], where the initial average value was 5.2 with a slight increase in hour 6 of the process followed by a continuous decrease until hour 48, ending with an average value of 4.2. Avallon et al., 2001 [24], reported that after fermentation, the mucilage cell assemblages with apparently intact walls are separated from the parchment by the rupture of the walls of the first cell layer. The acidification process changes the properties of the inner layer of the mucilage, weakening the polysaccharide network and generating a change in its texture. For this reason, pH values lower than 4.5 are used as a method to determine the end of the coffee fermentation process [18]. Peñuela-Martínez et al., 2018 [25], developed fermentations with temperature and pH control, finding an effect of their interaction; at lower temperatures, there were higher values of sensory quality. Fermentation at a temperature of 17 °C and pH of 5 obtained a significantly higher score.
The degrees of Brix did not show significant changes during the fermentation of the mucilage, starting with average values of 10.31 and increasing to average levels of 15.57, and after hour 4, the values remained stable in a range from 15 to 17 until hour 36. At time zero, the minimum average values of 9.26, 10.62, and 11.04 were presented for the maturity stages EM1, EM2, and EM3. This difference in the initial values may be associated with the lower amount of water in the mucilage in the EM3 state, which generates a concentration of the total soluble solids generating a slightly higher value, possibly also by hydrolytic processes of the pectin. The mucilage content in the EM1 and EM3 stages of maturity are different; the maximum percentage is in the EM1 stage, with a value of 15.44%, and decreases as the stage of maturity increases until reaching a value of 10.07 with respect to the total weight of the fruit. The treatments with maturity stages EM1 and EM3 presented the maximum value of degrees Brix at hour 16, with values of 16.45 and 17.68, respectively. For stage EM2, the maximum value of 16.92 was observed at hour 20. Although the comportment of the degrees of Brix is similar to that reported by Oliveira Junqueira et al., 2019 [7], the initial value differs; these authors report a slight increase in the first 12 h of fermentation with an initial value of approximately 5.3, which was half of what was reported in this study; although, these authors do not report the degrees of maturity of the fruits.
The titratable acidity of the coffee mucilage during fermentation had a positive linear comportment; the average at time zero for all treatments was 862.16 (mg CaCO3/L), and the average value was 6148.46 in hour 36. Similar to the internal temperature of the mass and the pH as time passes, a separation of the treatments is generated under the two conditions of process temperature, and this differentiation is more evident beginning in hour 12. The maximum values were found at hour 36; for the treatments associated with a process temperature of 15 °C, this value was 5600.60, and for those of 20 °C, it was 6696.32. The greatest difference between treatments with different process temperatures (15 °C and 20 °C) was evidenced at hour 24 with a value of 1589.15 in favor of treatments with a process temperature of 20 °C. The comportment of acidity implies a continuous accumulation of galacturonic acids from the hydrolysis of pectin and is much more evident than the decrease in pH, and although it presents negative linear comportment in advanced stages of fermentation, the changes are less marked in comparison with titratable acidity.

3.2. Physical Quality

For the physical quality variables, the analysis of variance showed no effect of treatments according to the F test (α = 0.05) for maturity stage, process temperature, and prolonged fermentation time. The average moisture content of the samples ranged from 11.10 to 11.68%, which implied that the water activity was in the range of 0.62–0.63. The percentage of decline had an average value of 18.31%, and the minimum and maximum values of 18.15 and 18.49, respectively, were found in the EM2T15t10 and EM1T15t20 treatments. With respect to the defective kernel, the maximum content of defective beans was presented by the EM3T20t20 treatment with a value of 3.64%, the general average of the treatments was 2.68%, and the fermentation prolongation times of 10 and 20 h were 2.43% and 2.92%, respectively. The state of maturity with the highest content of defective beans was EM3, with a value of 3.05%; in this same state, the minimum value of 1.91% was found in the treatment with a temperature of 15 °C and a prolonged time of 10 h. The average value of the black grains and vinegars was 0.28%, and the maximum value by state of maturity was found in EM3, with a value of 0.35%. In all maturity stages, the treatments associated with a temperature of 20 °C and an extension time of 20 h reported maximum values of blacks and vinegars of 0.39, 0.34, and 0.54 in stages EM1, EM2, and EM3, respectively, which may involve grain pigmentation associated with longer process times due to possible darkening reactions caused by the enzymatic degradation of phenolic compounds. The average of brocaded grains was 3.12%, and the maximum value was found in EM3T20t10 with a value of 4.13%. The average value of the percentage of healthy almonds is estimated at 74% with respect to dry parchment coffee, and higher values indicate a better physical quality. The percentages of healthy almonds were 77.04, 76.75, and 75.87 for the stages of maturity EM1, EM2, and EM3, respectively. The maximum value of 77.55% was reported for the EM1T20t10 treatment, and the minimum value of 75.31% was reported for the EM3T20t10 treatment.

3.3. Organic Acids

The major organic acids found in green almond coffee were citric, quinic, malic, and acetic acids, with average contents (g/kg) of 10.62, 5.85, 4.85, and 2.59, respectively (Figure 3). The analysis of variance did not show a significant effect of acetic, lactic, malic, and succinic acids, which is different from that reported by De Bruyn et al., 2017 [26], where the prolongation of the fermentation time generates a proportional increase in the concentrations of acetic acid, ethanol, glycerol, glucuronic acid, lactic acid, mannitol, and succinic acid. With respect to succinic acid, it is similar to that described by Elhalis et al., 2020 [27], where the concentrations remain relatively constant during this stage. Acetic acid had an average value of 2.59 g/kg, with minimum and maximum values of 2.10 and 3.62 in treatments EM3T20t20 and EM2T15t10, respectively. The maximum average was evidenced in the treatments associated with the state of maturity EM2, with a value of 2.74. Lactic acid presented an average content of 0.31 g/kg, and the maximum average value was reported in the treatments associated with the state of maturity EM3 and prolongation times of 20 h, with values close to 0.32. De Melo Pereira et al., 2020 [18], report that the abundant sugar content present in the mucilage of the coffee fruit, which includes pentoses, hexoses, and polysaccharides, is the primary source of carbon and energy for the growth of lactic acid bacteria, but that under the conditions of carbon and environmental limitation acid, these homofermentative species can change to a mixed acid metabolism so that, according to the process conditions, different compositions of organic acids can be found. De Carvalho et al., 2018 [28], did not observe differences in the concentrations of citric and succinic acids in the samples with inoculated fermentation treatments and with spontaneous fermentation. However, they reported approximately double the concentration of lactic acid in the process inoculated with the Lactobacillus species. The average content of malic acid was 4.85 g/kg, and the average values of the treatments increased with more advanced stages of maturity, with values of 4.57, 4.90, and 5.07 for the states. EM1, EM2, and EM3, respectively. The average value of succinic acid was 1.62 g/kg, the minimum was 1.45 in treatment EM1T15t10, and the maximum was 1.79 in treatment EM3T15t20. Succinic acid is naturally present in coffee, and the translocation of this acid occurs from the pulp to the bean with the help of microbial activity and can cause changes in the attributes of the beverage [1]. De Oliveira Junqueira et al., 2019 [7], reported in the first description of the predominant bacteria in spontaneous fermentation that Leuconostoc and Pichia nakasei were dominant, and the metabolic activity of these microbial groups resulted mainly in the production of lactic acid and acetaldehyde. These authors found a concentration of 2.76 g/L organic acids, which were not modified after the fermentation processes, indicating that the microbial activity and the drying process do not interfere with the composition of the main compounds within the coffee.
For the oxalic and quinic acids in the EM1 stage of maturity and for the citric acid in the EM2 stage, the analysis of variance showed a significant effect on the fermentation prolongation time (Figure 4). Oxalic acid in the EM1 state presents a reduction in its concentration of 42.85% and quinic acid an increase of 10.93% when going from 10 to 20 h of prolongation of the process. The citric acid in the state of maturity EM2 shows a decrease of 3.82%. The state of maturity EM3 showed no effect on the contents of organic acids in green almond coffee. De Bruyn et al., 2017 [26], report that green coffee beans processed wet contain higher concentrations of citric acid than green coffee beans processed dry. They also reported that mucilage changes are reflected in the endosperm, where they found high concentrations of microbial metabolites. Contrary to what was reported by Elhalis et al., 2020 [27], who described relatively stable levels of quinic acid during fermentation, this research reported an increase in the state of maturity EM1, which may be associated with the degradation of total chlorogenic acids.

3.4. Total Lipids and Free Fatty Acids

For the lipid fraction of green almond coffee, the analysis of variance did not show a significant effect on the state of maturity or the interaction of the temperature of the process and the time of mucilage fermentation. Table 1 shows the average values per treatment of palmitic, linoleic, oleic, stearic, and arachidic fatty acids. The average value of the percentage of lipids was 10.50, the minimum was 10.27 in the EM1T15t20 treatment, and the maximum was 10.79 in the EM3T20t20 treatment.
Among the fatty acids present in coffee, linoleic acid is the main fatty acid, followed by palmitic acid. The waxes of almond coffee originate in the epicarp of the fruit and represent between 0.06 and 0.1% of normally roasted coffee [29]. For the average values of free fatty acids per treatment, palmitic acid was the predominant fatty acid, followed by linoleic, oleic, stearic, and arachidic acids. The analysis of variance did not show a significant effect of the state of maturity, the temperature of the process, the time of prolongation of the fermentation, or the interaction of the previous factors on the percentage composition of free fatty acids (Table 1). Palmitic acid presented an average value of 41.03%, and the maximum average value was found in the treatment associated with a process temperature of 20 °C, extension time of 20 h, and state of maturity EM3 with a value of 41.59%. Linoleic acid presented an average value of 34.34%, and the minimum average value was associated with the fermentation treatments performed with the state of maturity EM3 (33.83%). Oleic acid showed a tendency to decrease its values as the treatments were associated with higher levels of fruit maturity, which were 10.60%, 10.51%, and 10.35% in the EM1, EM2 and EM3 states, respectively. Stearic fatty acids presented an average value for all treatments of 9.50%, and the average value of the treatments with the longest extension time increased from 9.47% to 9.54% after 10 to 20 additional hours of fermentation of the mucilage. This comportment was similar for the arachidic fatty acid, whose average values of the treatments with an extension time of 10 h ranged from 4.57% to 4.67% at 20 h. Garrett et al., 2016 [30], described increases in the levels of the compounds palmitic acid, linoleic acid, and stearic acid in regions of the endosperm attacked by insects, suggesting that perhaps these compounds have a direct implication in the coffee bean–insect interaction. In this study, the lipids and the composition of free fatty acids, which are some of the compounds responsible for the texture and body of coffee, were not modified by the treatments; the expression of these genes could have been associated with a protective effect.

3.5. Total Crude Protein and Alkaloids

The average protein content of the treatments was 13.80% (Table 1), and the lowest average contents were observed in the treatments with a process temperature of 20 °C and an extension time of 10 h, with values of 13.76 and 13.79, respectively. The treatments associated with the state of maturity EM3 presented the maximum average value of 13.87%. Bressani et al., 2020 [31], reported that higher protein concentrations in coffee are correlated with increases in pyrazine, characterized by nutty, almond, and sweet flavors, and with an increase in sucrose degradation during roasting. These authors used different processing methods, finding differences in the types of proteins, describing an increase in the concentration of proteins in natural dry coffee and a decrease in semi-dry coffee. In this investigation, no changes in the total protein content were identified since different processing methods were not contrasted, nor were inoculations of pulped coffee used. This content was not affected by the stages of maturity of the fruit, prolonged fermentation times, or temperature.
Alkaloids and grain proteins, although usually defined as responsible for the bitter taste, have a fundamental role in the chemical reactions responsible for the aroma and characteristic flavor of coffee [26]. The former were not modified by the different conditions of prolonged fermentation of the coffee mucilage. Caffeine showed a tendency to increase its contents in the treatments associated with advanced stages of maturity, with values of 1.09%, 1.13%, and 1.14% for states EM1, EM2, and EM3, respectively. The average percentage of theobromine in the treatments was 0.021, and the lowest average value was reported for the treatments associated with the state of maturity EM3, with an average value of 0.019. The average percentage of trigonelline in the treatments was 0.87, and unlike theobromine, the highest average value was reported for the treatments associated with the state of maturity EM3, with an average value of 0.88. The mean alkaloid content of the treatments is shown in Table 1.

3.6. Total Chlorogenic Acids

Total chlorogenic acids showed a tendency to decrease their content in the treatments associated with advanced stages of maturation, taking values of 3.86%, 3.80%, and 3.72% for states EM1, EM2, and EM3, respectively, which for the state of maturity EM2 involved the increase in quinic acid by prolonging the fermentation time. As reported by Zhang et al., 2019 [32], total chlorogenic acids decrease slightly in standard and extended fermentations. Lower average values were also observed at the highest process temperatures, 3.85% and 3.74% for 15 °C and 20 °C, respectively.

3.7. Sugars

The treatments associated with the EM1 state had average values of glucose, fructose, and sucrose of 0.80, 1.07, and 89.80 (g/kg), respectively, and those of the EM2 state had values of 0.71, 1.02, and 88.57, respectively, and treatments associated with the EM3 state had values of 0.83, 1.07, and 86.28, respectively. For the maturity stages EM1 and EM3, the analysis of variance showed a significant effect at 5% on the contents of glucose and fructose by the time of mucilage fermentation after 10 to 20 h of prolongation. In the EM1 stage of maturity, the fructose content increased from 0.71 (B) to 1.43 (A), and glucose increased from 0.55 (B) to 1.03 (A) and in the EM3 stage of maturity. The fructose content increased from 0.69 (B) to 1.34 (A), and the glucose content increased from 0.49 (B) to 0.93 (A). In the EM1 stage of maturity, the fructose content increased by 50.34%, and the glucose content increased by 46.60%. In the EM3 stage of maturity, the fructose content increased by 48.50% and the glucose content increased by 47.31%; the hydrolysis of sucrose influenced the predominance of glucose and fructose [33]. For the state of maturity EM2, the analysis of variance showed the effect of the interaction of the process temperature and the prolongation time on the content of fructose and glucose (Figure 5). De Bruyn et al., 2017 [26], define differences in the concentrations of fructose and glucose due to the type of processing: wet or dry. Additionally, they show that the anoxia of the grains can trigger germination, which generates a response of consumption among other carbohydrates, which is even more intense during prolonged fermentation. Coffee beans subjected to anoxia consume carbohydrates continuously through glycolysis, which causes the concentration of sucrose in the endosperm to decrease, which was evident in this study because the sucrose content of the treatments associated with prolonged fermentation for 10 h presented an average of 89.01 g/kg, while those associated with 20 h, that is, 10 additional hours, presented an average value of 87.43 g/kg [26]. In comparison with mucilage in the grain, fewer noticeable changes are produced in the concentrations of metabolites; after fermentation, they report significant decreases in the concentrations of fructose, glucose, sucrose, and caffeine. However, Elhalis et al., 2020 [27], found that during fermentation, reducing sugars and lactic acid accumulated inside the grains. For the state of maturity EM2, the effect of the interaction of the process temperature and the prolongation time was evident for the content of fructose and glucose, and the increase in these simple sugars was more evident in the treatments with a process temperature of 20 °C.

3.8. Sensory Quality

The sensory quality was determined following the SCA cupping protocol, which involves the individual determination of attributes, and the summation configures the total score. In this study, scores lower than 80 points imply the presence of sensory defects. A total of 96 samples were evaluated, associated with 12 treatments and 8 experimental units, of which 15.63% had sensory defects. Three treatments associated with the maturity stage EM1 (EM1T15t20, EM1T20t10, and EM1T20t20) presented sensory defects in an experimental unit, the first two with earthy defects and the third with fermented defects. In the EM2 and EM1 stages, three treatments showed defects in an experimental unit: the EM2T20t20 ferment and the EM2T15t10 and EM2T20t10 earthy treatments. In the state of maturity EM3, the highest percentage of sensory defects was present at 9.38%. The EM3T20t10 treatment had ferment sensory defects in two experimental units. The EM3T20t20 treatment presented fermented sensory defects in seven of the eight experimental units analyzed (87.5%) and was the treatment with the greatest negative effect on quality. Treatments with the same process temperatures and prolongation times of the fermentation process in the stages of maturity EM1 and EM2 did not present defects with the same frequency as the treatment associated with EM3. Do Carmo et al., 2020 [34], evaluated 6, 12, 18, 24, 30, and 36 h of fermentation and found the lowest values of sensory score in treatments 30 and 36, reporting a green astringency associated with changes in the cell membranes of the grains, which determined that the excess fermentation was detrimental to the quality of the drink and the physiological quality.
The analysis of variance for the treatments associated with the maturity stages EM1 and EM2 showed no effect on the prolongation time, process temperature, or their interaction on the different sensory attributes or on the total SCA score. For the total score, the treatments associated with ME1 obtained an average value of 81.35 with a maximum of 83.92, and those associated with ME2 obtained an average value of 82.05 with a maximum of 83.83. The maximum values obtained coincide with the maximum value of 84 points reported by Do Carmo et al., 2020 [34], for the treatment of 18 h of fermentation. De Carvalho et al., 2018 [28], reported scores higher than 80 and obtained the highest scores in the sensory attributes of aroma, flavor, acidity, body, and balance in inoculated treatments compared to spontaneous fermentation, while sweetness, cleanliness, and uniformity were statistically similar for both treatments, possibly due to the absence of sensory defects. However, de Melo Pereira et al., 2015 [12], reached a score of 89 points for the treatment with spontaneous fermentation, which was equal to the inoculated score; however, they reported that the use of the strain favored distinctive characteristics of vanilla flavor and floral aromas.
In this research, the tasters identified 337 sensory descriptors of flavor that were classified into categories: caramel-sweet, chocolate, citrus, spices, floral, fruity, dried, and red fruits. Most descriptors (42.73%) corresponded to the candy-sweet group, 17.51% to chocolate, and 14.54% to nuts. The frequency of descriptors of the caramel-sweet group increased in the treatments associated with the different stages of maturity, going from 36.84%, 44.25%, and 49.45% in EM1, EM2, and EM3, respectively. The fruit group increased its frequency from 5.76% to 10.94% by increasing the process temperature from 15 to 20 °C, while the dried fruits decreased from 18.60% to 10.33% due to the increase in time from 10 to 20 h.
The analysis of variance showed an effect in the treatments of the state of maturity EM3. Increasing the prolongation time from 10 to 20 h generated an effect on the acidity attribute, decreasing from an average value of 7.26 to 6.79. Increasing the temperature of the fermentation process of the mucilage with fruits of the state of maturity EM3, which was the most advanced stage evaluated, showed a negative effect, since a decrease in the scores of five attributes of the eleven evaluated was generated. The temperature of the process had an effect on the attributes of fragrance/aroma, residual flavor, acidity, balance, and taste score by reducing their values from 7.62 to 7.40, 7.31 to 6.60, 7.41 to 6.65, 7.36 to 6.62, and 7.36 to 6.63, respectively. These decreases are associated with the values obtained in the EM3T20t20 treatment, which are in the lowest segment of the evaluation scale due to sensory defects. The interaction of the process temperature (15 °C and 20 °C) with the fermentation prolongation time (10 and 20 h) had an effect on the flavor attributes, clean cup, and total SCA score according to the F test (α = 0.05) (Figure 6).
The state of maturity of coffee is a determining condition in fermentation, since states such as EM3 where the mucilage content is lower with respect to the state of maturity EM1 can consistently generate a negative effect on quality by causing defects such as fermentation. As reported by Avallone et al., 2001 [35], the initial microflora of fermentation is abundant and varied; aerobic is predominant and more heterogeneous when there is a higher water content in the process. The acidic conditions prevailing at the end of fermentation favor the development of yeasts, which could be responsible for the alcoholic flavor of the coffee beverage after overfermentation. In the case of the state of maturity EM3, a lower mucilage content of 10.07% compared to the state of EM1 with a value of 15.44% was explained by a lower water content associated with the dehydration that the fruit undergoes. The last stages of maturation could favor the growth of yeasts.
For the variables evaluated, a backward regression analysis was performed to identify the set of variables that significantly influenced the dependent variable defined as the total SCA score. Through individual contrast (of the t or the F) and as a result of 37 initial variables, there are 10 that ultimately influence the total sensory score SCA (Figure 7). With these selected variables, the Pearson correlation coefficient was determined, and its significance was evaluated according to the t-test (α = 0.05).

4. Conclusions

The quality of coffee is the result of the combination of multiple factors that converge in the production system, each of which generates a unique expression of the chemical composition of the bean that is the basis for the generation of the sensory attributes of the beverage. This research evaluated the characteristics of the coffee bean to define the effect of the maximum level of maturity of the fruit on the fermentation of the mucilage. The results indicated that the three stages of ripening evaluated showed no effect of temperature and prolongation time on the physical quality variables, nor on acetic, lactic, malic and succinic acids, free fatty acids, lipids, protein, caffeine, theobromine, trigonelline, and total chlorogenic acids. The treatments associated with maturity stages EM1 and EM2 showed no effect on the sensory profile due to prolongation time, processing temperature, or their interaction. For oxalic and quinic acids at maturity stage EM1 and for citric acid at stage EM2, a significant effect of fermentation prolongation time was observed. Maturity stage EM3 had no effect on the contents of organic acids in green almond coffee. Maturity stages EM1 and EM3 showed increases in the contents of glucose and fructose due to the fermentation time. The maturity stage EM2 presented an effect of the interaction of process temperature and prolongation time for fructose and glucose content. The treatments at maturity stage EM3 showed an interaction effect of process temperature and fermentation extension time on flavor, clean cup, and total SCA scores. This implies a differential response of the coffee fruit to fermentation time and temperature conditions depending on its degree of maturity. Consistent with what has been reported by different authors, the fermentation of mucilage generates conditions that favor changes within the grain in organic acids and sugars such as glucose and fructose. It is important to recognize that the source of grain changes occurs in two ways: there is a contribution from external processes, but these, in turn, generate conditions during fermentation that induce grain responses to them, generating exosmosis or endosmosis. The final response of the grain against the profile of its chemical composition and quality is also the result of the endogenous metabolism of the endosperm under conditions of anoxia during fermentation and not exclusively of the transfer of microbial metabolites to the interior of the grain during the fermentation of the mucilage. This research defines the degree of maturity of the fruit as a process variable since it establishes the initial conditions of the process with respect to the amount and composition of the substrate for microbial activities. Advanced stages of maturity have a quality that preserves the standards of commercialization, but their comportment is different in the different stages of postharvest, such as fermentation, where prolonged times and high temperatures consistently affect the sensory attributes. For this reason, it is important to know the configuration of the maturity stages of the initial mass to correctly define the conditions of the subsequent postharvest processes to avoid damaging the integrity of the grain.

Author Contributions

Conceptualization, formal analysis, investigation, data curation, writing—original draft preparation, V.O.P.; review and editing, C.I.Á.-B., L.G.M., and J.R.A.; review and formal analysis, L.F.E. and L.C.I. All authors have read and agreed to the published version of the manuscript.

Funding

This work was supported by National Coffee Research Center (Cenicafé) (Crossref Funder ID 100019597).

Informed Consent Statement

Written informed consent has been obtained from the coffee sensory analysts to publish this paper.

Data Availability Statement

Data is contained within the article.

Acknowledgments

The authors gratefully acknowledge to principals Hernando Duque and Álvaro Gaitán of Cenicafé; the colleagues Jenny Pabón, Claudia Gallego, Paola Calderón, Wilson Vargas, Carlos Gonzalo Mejía, José Farid López, John Félix Trejos, Rubén Medina, and Esther C. Montoya; and the support staff Víctor Castañeda and Benjamín Sánchez.

Conflicts of Interest

The authors declare no conflict of interest.

References

  1. Da Mota, M.C.B.; Batista, N.N.; Rabelo, M.H.S.; Ribeiro, D.E.; Borém, F.M.; Schwan, R.F. Influence of fermentation conditions on the sensorial quality of coffee inoculated with yeast. Food Res. Int. 2020, 136, 109482. [Google Scholar] [CrossRef] [PubMed]
  2. Velmourougane, K. Impact of natural fermentation on physicochemical, microbiological and cup quality characteristics of Arabica and Robusta coffee. Proc. Natl. Acad. Sci. India Sect. B Biol. Sci. 2013, 83, 233–239. [Google Scholar] [CrossRef]
  3. Pereira Bressani, A.P.; Martinez, S.J.; Reis Evangelista, S.; Ribeiro Dias, D.; Freitas Schwan, R. Characteristics of fermented coffee inoculated with yeast starter cultures using different inoculation methods. Food Sci. Technol. 2018, 92, 212–219. [Google Scholar] [CrossRef]
  4. Silva, C.F.; Vilela, D.M.; de Souza Cordeiro, C.; Duarte, W.F.; Dias, D.R.; Schwan, R.F. Evaluation of a potential starter culture for enhance quality of coffee fermentation. World J. Microbiol. Biotechnol. 2013, 29, 235–247. [Google Scholar] [CrossRef]
  5. Puerta, G.I.; Rios, S. Chemical composition of coffee mucilage according to fermentation and refrigeration time. Rev. Cenicafé 2011, 62, 23–40. [Google Scholar]
  6. Oliveros, C.E.; Roa, G. Mechanical demucilagination of coffee. Tech. Adv. Cenicafé 1995, 216, 1–7. [Google Scholar] [CrossRef]
  7. de Oliveira Junqueira, A.C.; de Melo Pereira, G.V.; Coral Medina, J.D.; Alvear, M.C.R.; Rosero, R.; de Carvalho Neto, D.P.; Enríquez, H.G.; Soccol, C.R. First description of bacterial and fungal communities in Colombian coffee beans fermentation analysed using Illumina-based amplicon sequencing. Sci. Rep. 2019, 9, 8794. [Google Scholar] [CrossRef] [Green Version]
  8. Evangelista, S.R.; Silva, C.F.; da Cruz Miguel, M.G.; de Souza Cordeiro, C.; Pinheiro, A.C.; Duarte, W.F.; Schwan, R.F. Improvement of coffee beverage quality by using selected yeasts strains during the fermentation in dry process. Food Res. Int. 2014, 61, 183–195. [Google Scholar] [CrossRef] [Green Version]
  9. Silva, C.; Schwan, R.; Sousa Dias, Ë.; Wheals, A.E. Microbial diversity during maturation and natural processing of coffee cherries of Coffea arabica in Brazil. Int. J. Food Microbiol. 2000, 60, 251–260. [Google Scholar] [CrossRef]
  10. Wang, C.; Sun, J.; Lassabliere, B.; Yu, B.; Liu, S.Q. Coffee flavour modification through controlled fermentation of green coffee beans by Saccharomyces cerevisiae and Pichia kluyveri: Part II. Mixed cultures with or without lactic acid bacteria. Food Res. Int. 2020, 136, 109452. [Google Scholar] [CrossRef] [PubMed]
  11. Wei, L.; Wai Cheong, M.; Curran, P.; Yu, B.; Quan Liu, S. Coffee fermentation and flavor—An intricate and delicate relationship. Food Chem. 2015, 185, 182–191. [Google Scholar] [CrossRef]
  12. De Melo Pereira, G.V.; Neto, E.; Soccol, V.T.; Medeiros, A.B.P.; Woiciechowski, A.L.; Soccol, C.R. Conducting starter culture-controlled fermentations of coffee beans during on-farm wet processing: Growth, metabolic analyses and sensorial effects. Food Res. Int. 2015, 75, 348–356. [Google Scholar] [CrossRef] [PubMed]
  13. Iamanaka, B.T.; Teixeira, A.A.; Teixeira, A.R.R.; Vicente, E.; Frisvad, J.C.; Taniwaki, M.H.; Bragagnolo, N. Potential of volatile compounds produced by fungi to influence sensory quality of coffee beverage. Food Res. Int. 2014, 64, 166–170. [Google Scholar] [CrossRef] [PubMed]
  14. Martinez, S.J.; Pereira Bressani, A.P.; Da Cruz Pedrozo, M.G.; Ribeiro Dias, D.; Freitas Schwan, R. Different inoculation methods for semi-dry processed co ff ee using yeasts as starter cultures. Food Res. Int. 2017, 102, 333–340. [Google Scholar] [CrossRef]
  15. Evangelista, S.; Da Cruz Pedrozo, M.G.; Ferreira Silva, C.; Marques Pinheiro, A.C.; Freitas Schwan, R. Microbiological diversity associated with the spontaneous wet method of coffee fermentation. Int. J. Food Microbiol. 2015, 210, 102–112. [Google Scholar] [CrossRef]
  16. Silva, L.; Egídio Ribeiro, D.; Reis Evangelista, S.; Da Cruz Pedrozo, M.G.; Marques Pinheiro, A.C.; Meira Borém, F.; Freitas Schwan, R. Controlled fermentation of semi-dry coffee (Coffea arabica) using starter cultures: A sensory perspective. Food Sci. Technol. 2017, 82, 32–38. [Google Scholar] [CrossRef]
  17. Waters, D.M.; Arendt, E.K.; Moroni, A.V. Overview on the mechanisms of coffee germination and fermentation and their significance for coffee and coffee beverage quality. Crit. Rev. Food Sci. Nutr. 2017, 57, 259–274. [Google Scholar] [CrossRef] [PubMed]
  18. de Melo Pereira, G.V.; da Silva Vale, A.; de Carvalho Neto, D.P.; Muynarsk, E.S.; Soccol, V.T.; Soccol, C.R. Lactic acid bacteria: What coffee industry should know? Curr. Opin. Food Sci. 2020, 31, 1–8. [Google Scholar] [CrossRef]
  19. Ribeiro, L.S.; Miguel, M.G.; Evangelista, S.R.; Martins, P.M.; van Mullem, J.; Belizario, M.H.; Schwan, R.F. Comportment of yeast inoculated during semi-dry coffee fermentation and the effect on chemical and sensorial properties of the final beverage. Food Res. Int. 2017, 92, 26–32. [Google Scholar] [CrossRef] [PubMed]
  20. Sanz Uribe, J.R.; Oliveros, C.E.; Duque, H.; Mejía, C.G.; Benavides, P.; Medina, R.D. Pass retention: An option to improve labor productivity in coffee harvesting. Tech. Adv. Cenicafé 2018, 488, 1–8. [Google Scholar] [CrossRef]
  21. Peñuela-Martínez, A.E.; Pabón, J.P.; Sanz, J.R. Fermaestro method: To determine the completion of coffee mucilage fermentation. Tech. Adv. Cenicafé 2013, 431, 8. [Google Scholar] [CrossRef]
  22. Colombian Institute of Technical Standards and Certification. NTC 2324: Green coffee. Olfactory and Visual Examination and Determination of Foreign Matter and Defects. Available online: https://tienda.icontec.org/gp-cafe-verde-examen-olfativo-y-visual-y-determinacion-de-materia-extrana-y-defectos-ntc2324-2021.html (accessed on 1 May 2020).
  23. Correa, E.C.; Jiménez-Ariza, T.; Díaz-Barcos, V.; Barreiro, P.; Diezma, B.; Oteros, R.; Echeverri, C.; Arranz, F.J.; Ruiz-Altisent, M. Advanced Characterisation of a Coffee Fermenting Tank by Multi-distributed Wireless Sensors: Spatial Interpolation and Phase Space Graphs. Food Bioprocess Technol. 2014, 7, 3166–3174. [Google Scholar] [CrossRef] [Green Version]
  24. Avallone, S.; Guiraud, J.-P.; Guyot, B.; Olguin, E.; Brillouet, J.-M. Fate of Mucilage Cell Wall Polysaccharides during Coffee Fermentation. J. Agric. Food Chem. 2001, 49, 5556–5559. [Google Scholar] [CrossRef] [PubMed]
  25. Peñuela-Martínez, A.E.; Zapata-Zapata, A.D.; Durango-Restrepo, D.L. Performance of different fermentation methods and the effect on quality coffee (Coffea arabica L.). Coffee Sci. 2018, 13, 465–476. [Google Scholar] [CrossRef]
  26. De Bruyn, F.; Zhang, S.J.; Pothakos, V.; Torres, J.; Lambot, C.; Moroni, A.V.; Callanan, M.; Sybesma, W.; Weckx, S.; De Vuyst, L. Exploring the Impacts of Postharvest Processing on the Microbiota and Metabolite Profiles during Green Coffee Bean Production. Appl. Environ. Microbiol. 2017, 83, e02398-16. [Google Scholar] [CrossRef] [PubMed] [Green Version]
  27. Elhalis, H.; Cox, J.; Frank, D.; Zhao, J. The crucial role of yeasts in the wet fermentation of coffee beans and quality. Int. J. Food Microbiol. 2020, 333, 108796. [Google Scholar] [CrossRef] [PubMed]
  28. de Carvalho Neto, D.P.; de Melo Pereira, G.V.; Finco, A.M.O.; Letti, L.A.J.; da Silva, B.J.G.; Vandenberghe, L.P.S.; Soccol, C.R. Efficient coffee beans mucilage layer removal using lactic acid fermentation in a stirred-tank bioreactor: Kinetic, metabolic and sensorial studies. Food Biosci. 2018, 26, 80–87. [Google Scholar] [CrossRef]
  29. Belitz, H.-D.; Grosch, W.; Schieberle, P. Food Chemistry, 4th ed.; Springer: Berlin/Heidelberg, Germany, 2009. [Google Scholar] [CrossRef]
  30. Garrett, R.; Rezende, C.M.; Ifa, D.R. Revealing the spatial distribution of chlorogenic acids and sucrose across coffee bean endosperm by desorption electrospray ionization-mass spectrometry imaging. LWT Food Sci. Technol. 2016, 65, 711–717. [Google Scholar] [CrossRef]
  31. Bressani, A.P.; Martinez, S.J.; Vilela, L.D.; Dias, D.R.; Schwan, R.F. Coffee protein profiles during fermentation using different yeast inoculation methods. Pesquisa Agropecuária Brasileira 2020, 55, e01159. [Google Scholar] [CrossRef]
  32. Zhang, S.J.; De Bruyn, F.; Pothakos, V.; Torres, J.; Falconi, C.; Moccand, C.; Weckx, S.; De Vuyst, L. Following coffee production from cherries to cup: Microbiological and metabolomic analysis of wet processing of Coffea arabica. Appl. Environ. Microbiol. 2019, 85, e02635-18. [Google Scholar] [CrossRef]
  33. Koshiro, Y.; Jackson, M.C.; Nagai, C.; Ashihara, H. Changes in the content of sugars and organic acids during ripening of Coffea arabica and Coffea canephora fruits. Eur. Chem. Bull. 2015, 4, 378–383. [Google Scholar]
  34. Do Carmo, K.B.; Do Carmo, J.C.B.; Krause, M.R.; Peterle, G. Sensory and physiological quality of arabic coffee under different fermentation times. Biosci. J. 2020, 36, 429–438. [Google Scholar] [CrossRef] [Green Version]
  35. Avallone, S.; Guyot, B.; Brillouet, J.M.; Olguin, E.; Guiraud, J.P. Microbiological and biochemical study of coffee fermentation. Curr. Microbiol. 2001, 42, 252–256. [Google Scholar] [CrossRef]
Figure 1. Methodology of prolonged fermentation treatments.
Fermentation 08 00519 g001
Figure 2. Average pH of mucilage of coffee with prolonged fermentation.
Fermentation 08 00519 g002
Figure 3. Average organic acid content of coffee beans with prolonged mucilage fermentation.
Fermentation 08 00519 g003
Figure 4. Effect of mucilage fermentation prolongation time on organic acids. Uncommon letters imply a difference in averages according to Duncan’s test (α = 0.05).
Fermentation 08 00519 g004
Figure 5. Effect of prolonged mucilage fermentation on coffee sugars in the EM2 maturity stage according to Duncan’s test (α = 0.05).
Fermentation 08 00519 g005
Figure 6. Effect of prolonged mucilage fermentation on the sensory quality of coffee according to Duncan’s test (α = 0.05).
Fermentation 08 00519 g006
Figure 7. Heatmap of quality variables correlated with the total SCA score. Significant codes: 0 ‘***’ 0.001 ‘**’ 0.01 ‘*’ 0.05.
Fermentation 08 00519 g007
Table 1. Average content of lipids, free fatty acids, protein, alkaloids, and total chlorogenic acids for coffee with different stages of maturity and prolonged fermentation of the mucilage.
Lip * (%)Palm * (C16:0) (%)Lino * (C18:2) (%)Olei *
(C18:1) (%)
Stea * (C18:0) (%)Arac * (C20:0) (%)Prot * (%)Caf * (%)Theob * (%)Trig * (%)CGA * (%)
EM1T15t1010.3941.3234.3710.199.574.5613.771.090.020.873.90
EM1T15t2010.2740.7334.3310.769.614.5713.751.090.020.873.94
EM1T20t1010.5640.8434.6510.509.604.4113.741.100.020.873.82
EM1T20t2010.2940.1334.7710.959.624.5313.751.090.020.873.81
EM2T15t1010.4040.6734.9010.429.504.5113.831.120.020.863.91
EM2T15t2010.6340.5834.4210.839.424.7513.871.120.020.863.74
EM2T20t1010.4340.5934.9410.559.314.6113.791.140.020.883.75
EM2T20t2010.4641.1734.3910.239.474.7313.641.160.020.893.83
EM3T15t1010.7541.1334.2010.549.474.6514.021.160.020.893.80
EM3T15t2010.6141.3634.2410.309.504.6013.801.140.020.883.84
EM3T20t1010.4441.6233.8810.379.404.7313.651.140.020.883.62
EM3T20t2010.7942.2533.0310.229.654.8514.021.160.020.883.65
* For the compounds in Table 1, the analysis of variance showed no treatment effect. The fatty acid composition is reported as a percentage of the lipid fraction. The content of lipids, protein, alkaloids, and total chlorogenic acids on the weight of the sample.
Publisher’s Note: MDPI stays neutral with regard to jurisdictional claims in published maps and institutional affiliations.

