Article

Waste Apple Pomace Conversion to Acrylic Acid: Economic and Potential Environmental Impact Assessments

1
BioMatter Unit, École Polytechnique de Bruxelles, Université Libre de Bruxelles (ULB), Avenue F.D. Roosevelt, 50-CP 165/61, 1050 Brussels, Belgium
2
College of Life Sciences, Xinyang Normal University (XYNU), Xinyang 464000, China
3
School of Biomedical Sciences, University of Otago, Dunedin 9010, New Zealand
*
Authors to whom correspondence should be addressed.
Fermentation 2022, 8(1), 21; https://doi.org/10.3390/fermentation8010021
Submission received: 9 December 2021 / Revised: 31 December 2021 / Accepted: 3 January 2022 / Published: 6 January 2022
(This article belongs to the Section Industrial Fermentation)

Abstract

:
The global demand for acrylic acid (AA) is increasing due to its wide range of applications. Due to this growing demand, alternative AA production strategies must be explored to avoid the exacerbation of prevailing climate and global warming issues since current AA production strategies involve fossil resources. Investigations regarding alternative strategies for AA production therefore constitute an important research interest. The present study assesses waste apple pomace (WAP) as a feedstock for sustainable AA production. To undertake this assessment, process models based on two production pathways were designed, modelled and simulated in ASPEN plus® software. The two competing production pathways investigated included a process incorporating WAP conversion to lactic acid (LA) prior to LA dehydration to generate AA (denoted as the fermentation–dehydration, i.e., FD, pathway) and another process involving WAP conversion to propylene prior to propylene oxidation to generate AA (denoted as the thermochemical–fermentation–oxidation, i.e., TFO, pathway). Economic performance and potential environmental impact of the FD and TFO pathways were assessed using the metrics of minimum selling price (MSP) and potential environmental impacts per h (PEI/h). The study showed that the FD pathway presented an improved economic performance (MSP of AA: USD 1.17 per kg) compared to the economic performance (MSP of AA: USD 1.56 per kg) of the TFO pathway. Crucially, the TFO process was determined to present an improved environmental performance (2.07 kPEI/h) compared to the environmental performance of the FD process (8.72 kPEI/h). These observations suggested that the selection of the preferred AA production pathway or process will require a tradeoff between economic and environmental performance measures via the integration of a multicriteria decision assessment in future work.

Graphical Abstract

1. Introduction

The increasing threat of catastrophic climate effects [1] due to anthropogenic greenhouse gas (GHG) emissions and natural resource depletion have, in recent times, motivated research into the production of “green” products. Some of these green products, produced via biorefinery of biomass, are capable of partly (or completely) replacing their fossil fuel alternatives [2,3]. Biorefinery technologies are sustainable progressions that incorporate biomass conversion technologies to facilitate the conversion of biomass to high-value products, and thus promote the circular bioeconomy paradigm [2]. Given that the implementation of such biorefineries has thus far been limited by low profitability and concerns about poor commercialization [3], the use of waste biomass streams has been proposed as one strategy that may enhance overall economic performance, given that feedstock cost is an important factor that influences biorefinery economic performance [3,4]. The present study therefore proposes the utilization of the waste biomass resources of waste apple pomace (WAP) as a useful biorefinery feedstock. WAP is an abundant biomass resource, with ~18 × 109 kg of pomace estimated to be generated globally per year [4]. The poor management of this WAP stream may lead to unfavorable environmental outcomes such as uncontrolled GHG emissions from the disposal of pomace in landfills, unwanted acidification of agricultural soils via leachate formation and also the pollution of underground waters [5]. The utilization of WAP as a biomass resource therefore presents an opportunity for value extraction while also circumventing waste management concerns. The current study seeks to investigate the production of AA from WAP.
Acrylic acid (AA; CH₂ = CHCOOH) is the simplest of the unsaturated acids [6,7,8]. AA is an important product that is characterized by several significant end uses such as in the production of superabsorbent polymers and artificial textiles [9,10,11]. A review of the literature shows that most of the AA produced (~42%) is employed in the manufacturing of dispersions, i.e., detergents. AA may also be used in the production of acrylic-based polymers for fabricating corneal prosthesis and contact lenses as well as in tissue engineering [9,10]. The wide range of AA applications are partly due to its ability to achieve rapid polymerization and its efficiency in delivering carboxylate functionality in commercial products [12]. The importance of AA is further demonstrated by the annual global market size and market demand, predicted to reach USD 22.55 billion and 8750 kton, respectively, by 2022 [13,14].
Currently, AA is commercially obtained via the catalytic oxidation of olefins, which are derived from the refining of fossil crude [6,7,8]. This approach exacerbates GHG emissions and natural resource depletion concerns. AA can also be produced from the non-fossil feedstocks of glycerol or biomass [15,16,17,18,19,20,21,22]. Notably, since glycerol typically requires additional production operations (i.e., as a byproduct of the biodiesel production process), the use of freely available biomass as a feedstock may be a more sustainable strategy. The literature reveals that (non-fossil) AA may be produced from biomass via stepwise processes, involving an initial LA acid production step (via sugar fermentation) followed by LA dehydration (i.e., fermentation–dehydration or FD pathway) [23,24,25]. The current study proposes an alternative “syngas pathway” that incorporates the conversion of biomass to (→) propylene → AA (i.e., thermochemical–fermentation–oxidation or the TFO pathway). We hypothesize that this pathway may be more favorable because unlike the biomass→ LA → AA pathway, which only utilizes polysaccharides present in biomass for AA production (i.e., via polysaccharide fermentation), all fractions of the biomass feedstock including the lignin fraction are employed in AA production via a preliminary syngas production step (i.e., thermochemical transformation). Therefore, to evaluate our hypothesis, in the present study we seek to undertake economic and environmental assessments of the two pathways that can transform WAP to AA (i.e., via the TFO and FD pathways). In spite of the importance of AA, to the best of our knowledge, no comparative economic assessment of AA production processes from WAP has been reported in the literature.
Additionally, recognizing the importance of addressing environmental performance concerns, the current study also seeks to comparatively explore the environmental performances of the alternative AA production pathways. Since feedstock collection and transportation to the AA production site are assumed to be similar for both pathways, only environmental impacts of the standalone AA production facilities will be assessed. Thus, the assessment of impacts associated with environmental risk, waste minimization opportunities and raw materials acquisition [26,27,28] are beyond the scope of the present study and are not presented here.

2. Materials and Methods

In this study, the commercial software Aspen Plus® version 11 (Aspen Technology Inc., Cambridge, MA, USA) was used to design, model and simulate AA production via the TFO and FD pathways. Calculations involving mass balance, energy balance, chemical and phase equilibrium were undertaken in Aspen Plus®. The WAP was modelled according to its reported chemical [29], proximate and elemental composition [30]. These data are presented in Tables S1 and S2 in the Supplementary Materials.
Modelling of other chemical inputs was achieved using the data library in Aspen Plus. The (base) non-random two-liquid (NRTL) thermodynamic property method was considered sufficient to model the properties (i.e., activities, fugacities, fugacity coefficients, etc.) of chemical species in different phases and in complex systems [31,32,33,34]. The reactors were modelled based on experimental results obtained from literature as discussed below (Section 2.1), using the stoichiometric (RSTOIC) reactor models. The RSTOIC reactor models are based on the knowledge of fractional conversion of reacting species. For complex reactions such as those involved in gasification processes, it was assumed that thermodynamic equilibrium was attained since the rates of associated chemical and physical–chemical reactions are infinitely high [35]. The gasification reaction was therefore modelled using the two equilibrium (RGIBBS) reactor models in Aspen Plus®. Generally speaking, in the Aspen Plus RGIBBS model, the concentration of species is determined by minimizing the Gibbs free energy (Gtotal) of the system as follows [36,37,38]:
G t o t a l = i = 1 N n i G 0 f . i + i = 1 N ( n i R T ln ( f i f i o ) )
where fio for gas phase species is equal to 1 bar, such that
f i = θ i y i P
while for liquid phase species,
f i f i o = a i
where fio, G0f,i and θi represent the standard molar fugacity, the Gibbs free energy of formation at 1 bar and the fugacity coefficient of the ith specie respectively. T, R and yi represent the temperature in K, the universal gas constant (8.314 J/mol·K) and the mole fraction vapor of the ith specie respectively [36,37,38].
All pumps, turbines and compressors were modelled as isentropic units [39]. Finally, distillation processes were modelled using the RADFRAC model Aspen Plus®, which facilitates rigorous energy and mass balance calculations and can be used to facilitate the separation of highly non-ideal liquid mixtures [40]. To determine the column design specifications, the design parameters (i.e., number of stages, reboiler duty, reflux ratio, etc.) were initially estimated using the Fenske–Underwood–Gilliland correlation model in Aspen Plus® [39,41].

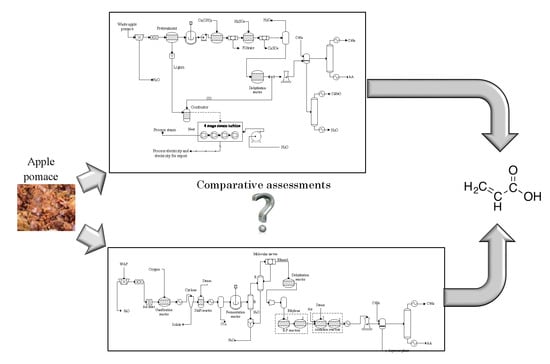
2.1. Process Description

Initially, the FD process that employs LA as a precursor to AA via its dehydration was investigated according to the simplified process flow diagram presented in Figure 1. LA production was based on similar techniques described in [42]. Figure 1 shows that initially, the water content of the WAP is reduced to 50 wt.% from 67 wt.% (Materne company, Brussels, Belgium) via mechanical dewatering operations. The dewatered WAP was then homogenized at 1 atm and at a temperature of 25 °C. The requirements for the dewatering and homogenization operations are specified as 2 kW per 1 m3 of feed and 1.5 kW per ton of feed, respectively, and are incorporated in the simulation using Fortran codes [43,44]. Pretreatment of the WAP is subsequently undertaken for lignin separation via hot water treatment to minimize the generation of inhibitors (i.e., furfural) that may limit the efficiency of downstream fermentation operations [5,45,46]. This hot water treatment approach also limits polysaccharide losses during biomass pretreatment as discussed in the literature [5,45,46]. According to the well-established experimental approach employed in the literature [47], hot water pre-treatment is undertaken at the temperature of 142.4 °C and pressure 1 atm with a 65% sugar (C6 and C5) recovery achieved according to the reaction equations presented in Table S3 in Supplementary Materials. To enhance process efficiency and energy self-sufficiency, onsite steam generation is achieved using the lignin fraction as a solid fuel [39]. The lignin separated is employed as a fuel for heat and electricity generation via a conceptual combined heat and power (CHP) plant, in accordance with the Rankine cycle as described in the literature [5]. In the CHP plant, pressurization of water to 20 atm is initially achieved using a pump operating at 0.9 efficiency. The pressurized water is then heated using heat generated from the boiler via the combustion of the solid fuel (in this case lignin) to facilitate the production of superheated steam. Electrical energy is then generated via the expansion of the pressurized superheated steam to 1 atm in an isentropic turbine. The steam is then condensed and reused within the system. Figure 1 shows that the assumed lignin-free stream (after hot water treatment) is subjected to a fermentation operation under the action of Lactobacillus casei sub sp. rhamnosus (ATCC 10863) at a temperature of 45 °C and pressure of 1 atm [48]. This microbe is used in the present study due to its capability to metabolize C5 (~80% conversion) and C6 (~100% conversion) to produce LA according to the reactions summarized in Table S3 (Supplementary Materials). At the conclusion of the fermentation process, the broth is subjected to precipitation treatment followed by acid treatment using Ca(OH)2 at a temperature of 95 °C to facilitate the production of C6H10CaO6 for its separation from the solution [49,50,51]. The C6H10CaO6 is then subjected to acid treatment to enable the recovery of LA, with the waste stream of gypsum generated. Stage-wise separation of the C6H10CaO6 and the gypsum is achieved using filtration at 25 °C and 1 atm [49,50,51]. Since the dehydration of the LA to AA requires that the LA stream has a LA content of 50 wt.% [52], a vaporization operation is imposed at the temperature of 100 °C to increase the concentration of LA and achieve 50 wt.% concentration [49,50,51]. In accordance with the work of Ghantani et al. [52] LA (50 wt.%) dehydration to produce AA is achieved under the action of Ca/P (1.3 molar ratio), with LA presenting a 100% conversion when subjected to a temperature condition of 375 °C. The dominant dehydration reaction facilitates the production of AA, water and a side decarboxylation reaction facilitates the production of CO and acetaldehyde (C2H4O), with AA selectivity assumed to be 60% [52]. The exit stream is then initially degassed for the recovery of CO, which is utilized as a gaseous fuel in the CHP plant. The CO gas has a higher heating value (HHV) of 4.368 MJ/kg [53]. Since it is not possible to separate AA from water via conventional distillation because of the formation of a minimum boiling azeotrope [54], an extractive distillation approach is employed [55]. Several organic solvents have been reported in the literature for AA extraction from an aqueous solution. These solvents include diisopropyl ether, isopropyl acetate, methyl isobutyl ketone and toluene [55]. However, Song et al. [55] recommended toluene as the preferred solvent for the extraction when the combined effects of extraction capacity and solvent cost are considered. In the present study, toluene was therefore employed to facilitate AA extraction. In this approach, the stream exiting the dehydration reactor is rapidly cooled to 25 °C using a quencher to reduce the risk of polymerization of AA, after which the mixture is fed to a liquid–liquid extractor, with toluene used as the solvent to facilitate the separation of aqueous components from AA [55]. The toluene–AA steam is then distilled to facilitate toluene recovery with associated AA generated as the bottom stream [54]. The recovered toluene is cooled and condensed and made available for re-use. Finally, the aqueous stream is distilled to facilitate acetaldehyde recovery, as a byproduct of the process. The alternative AA production process (simplified) is presented in Figure 2, which shows the TFO pathway. The gasification “subprocess” described in Figure 2 is based on generic processes previously described in the literature [56,57,58]. After the initial dewatering step, the WAP stream is then subjected to a drying operation. The dried WAP is then transferred to the reactor where the partial oxidation of the WAP is achieved under the action of steam (Figure 2).
The typical gasification reactions are summarized in Table S3. Herein, steam gasification was employed since steam facilitates the production of syngas (CO and H2) characterized by higher H2 and reduced CO2 contents [58,59]. To further decrease CO2 generation potential, a steam–biomass ratio of 0.5 was imposed [60]. The gasification operation was specified as being undertaken at the temperature of 1000 °C as applying temperatures higher than 800 °C minimizes tar formation in gasification systems [56]. Notably, at gasification temperatures ranging from 900 °C–1000 °C, tar formation is significantly mitigated due to tar cracking [56,60]. This statement is consistent with other process models developed in the literature where tar formation was not considered [61,62]. Additionally, such high temperatures reduce the risk of the production of heavy hydrocarbons (i.e., > C4) in the gasification process [63]. At the conclusion of the gasification reaction, the exit stream is cooled to 37 °C and the solids (char) present in the stream are removed using a cyclone. The current study assumes that the char is composed of carbon and ash only [60]. The syngas product is then transferred to a fermenter, operating at the mesophilic temperature of 37 °C and pressure of 1 atm. Fermentation of the syngas is achieved under the action of acetogenic microorganisms such as Clostridium ljungdahlii and Clostridium carboxidivorans [64,65] according to equations presented in Table S3. CO and H2 conversions to ethanol are assumed to be 90% and 70%, respectively, as previously reported by Phillips et al. [66]. According to Klasson et al.’s work, [66], the aforementioned conversions are achieved when fermentation of syngas occurs in the presence of ~0.8 g of Clostridium ljungdahlii per liter of fermentation broth. Having concluded the fermentation operation, the fermentation broth containing the ethanol is purified via a stage-wise distillation process as described in the literature [67]. The fermentation broth is then transferred to a “beer” column (B) where stripping of ethanol from the stream is achieved with the resulting vapor phlegm composed of ~35 wt.% ethanol and ~65 wt.% water. Further concentration of the vapor phlegm is achieved when the stream is transferred to the rectification column (R) such that a distillate containing ~91 wt.% ethanol is produced. To facilitate further concentration of the ethanol-containing stream, the distillate is dehydrated using molecular sieves to achieve an ethanol product with a purity of ~99 wt.%. Having generated the ethanol product, the stream is transferred to the dehydration reactor where dehydration is achieved at 350 °C and 1 atm for ethylene production in accordance with the work of Arvidsson and Lundin [68] (reactions in Table S3). In accordance with literature, the conversion of ethanol to ethylene is specified as 99.9%, while the side reaction involves the conversion of the residual ethanol to diethyl ether [67,68]. Given that acetic acid is produced as a byproduct of the syngas fermentation process and unreacted ethanol is retained in the stream after the dehydration reaction, it is assumed that the acetic acid and ethanol are available to undergo esterification reaction for ethyl acetate production. Both streams are therefore transferred to an esterification reactor (reaction in Table S3) operating at 80 °C and 1 atm with a reaction conversion of 84% assumed (ethanol as the limiting reactant) [69].
Cleaning of the ethylene product is achieved using activated carbon. To produce propylene from ethylene, the methods highlighted in the novel and recent study by Beucher et al. [70] are employed. To this regard, the ethylene product is subjected to a cascade of reactions involving two reactors for propylene formation. In the first reactor, ethylene is converted (~85 wt.% conversion) to 2-butene under the action of a nickel-based catalyst at temperature and pressure conditions of 120 °C and 29.6 atm, respectively. The exit stream is then transferred to the second reactor, where the 2-butene in the stream reacts with the previously unconverted ethylene at temperature and pressure conditions of 450 °C and 1 tam, respectively, to produce propylene, under the action of Tungsten oxide-based catalyst. To produce AA from propylene, a well-established method were used [71]. According to Sanchez et al., [71], the stream containing the propylene is fed to a reactor together with air compressed at a pressure of 5.95 atm and low pressure steam at the pressure and temperature of 5.95 atm and 159 °C, respectively. The propylene, air and steam feed fractions are maintained at 1/7.75/3.75 (mass basis) [71]. In the first reactor, the propylene is then oxidized to facilitate its initial conversion to acrolein, AA, acetic acid and CO2 with conversions of 79, 6, 12 and 3%, respectively, achieved, under the action of bismuth molybdate catalyst at a temperature of 350 °C [71]. The initial oxidation of propylene reactions in reactor 1 are presented in Table S3.
Figure 2 shows that the hot gaseous mixture, containing mostly acrolein, is transferred to the next reactor 2, where acrolein conversion to AA is achieved under the action of vanadium–molybdenum oxide, at a temperature of 300 °C. An AA production yield of 85% is attained in reactor 2 [71]. The gaseous product is then cooled from 300 °C to 25 °C with the liquid–liquid extraction module discussed in the FD pathway above executed to facilitate AA recovery. In the TFO pathway, the heat from all exothermic reactor units in the biorefinery (i.e., propylene oxidation reactors [72]) is recovered in the form of high pressure steam at 20 atm and employed in electricity generation (via the conceptual CHP). The specifications of major operations discussed above are presented in Table S3 in Supplementary Materials. Having designed and modelled the AA production processes, mass balance and energy balance calculations were subsequently undertaken in Aspen Plus using the Aspen Energy Analyzer ® V.11 [67,73].

2.2. Economic Assessments

Plant availability was assumed to be 7200 h per year to aid economic assessments. To assess the economic performances of the AA production processes, the minimum selling prices (MSPs) of the AA product generated from both processes were determined. The MSP was specified as the price of AA for which the net present value (NPV) of the project was equal to zero, with the NPV determined using a discounted flow table and calculated as follows [74]:
NPV = TCI + n = 1 t N R ( 1 + i ) n + S n ( 1 + i ) n
where TCI, i and n denote the total capital investment cost in USD, discount rate (10%), and project lifespan (30 y), respectively. Sn denotes the salvage value specified as zero, with straight-line depreciation assumed. NR denotes the net cash flow (annual cash flow less the assets) in USD.
The total operating costs (TOC) of the FD and TFO processes were also determined as a summation of the fixed production cost components (i.e., costs incurred irrespective of the plant productivity), and the variable production costs (i.e., cost proportional to the plant outputs) [58]. The costing relations employed in estimating these cost components are presented in Supplementary Materials. The TCI was determined from equipment purchase costs provided by the Aspen Process Economic Analyzer V.11 (APEA). These purchase costs were determined based on mapping algorithms that employ the mass and energy balance simulation results for equipment sizing calculations. Based on the equipment purchase costs, correlations that were employed to calculate the TCI costing components are presented elsewhere [74,75,76].
The associated TCI cost correlations are presented in Supplementary Materials. In the present study, the purchase cost of general equipment, i.e., distillation columns, heater, cooler, tanks and pumps, were obtained from APEA. In line with previous studies [77,78,79], the cost of specialized equipment such as the gasification reactor, cyclone, reactors and molecular sieves were obtained from literature and commercial vendors [80,81] and the purchase costs of these specialized equipment summarized in Supplementary Materials. To account for inflationary effects from equipment purchase costs obtained in different years, Chemical Engineering Plant Cost Index (CEPCI) values were employed according to standard methods [58]. The CEPCI for the year 2020 specified as 607.5 [5] was employed. The purchase cost pi of these specialized ith equipment in USD was subsequently adjusted for the desired characteristic factor as follows [58,82]:
p i = p i , F r e f ( F F r e f ) 0.65
where F and Fref denote characteristic factors such as the volume of the equipment in the present study and reference volume of the equipment, pi,ref denotes the purchase cost for the equipment with the reference characteristic factor and 0.65 [83] denotes the scaling factor employed in the present study.
The economic assessment technique described thus far is the study estimate type (i.e., Class 4 estimate) and is typically employed in facilitating conceptual or feasibility studies [84]. The economic assessment technique was therefore specified as sufficient for the current comparative investigation. A summary of the economic assumptions employed in the present study are shown in Table 1.

2.3. Environmental Performance Assessment

Since the current study is interested in the comparative assessment of standalone alternative AA production pathways, the potential environmental impact (PEI) of the alternative processes was selected as a sufficient metric [85,86]. The PEI was measured using the WAR algorithm since it is a powerful tool that facilitates rapid assessments of environmental impacts during the design stages of manufacturing processes [86,87]. PEI employs energy and mass balance results of the simulated process as inputs for the calculation of its constituent impact categories [67] highlighted in Table 2. The PEI of a process is calculated as follows [74,85]:
I ˙ o u t c p = i c p I ˙ i o u t = i c p M ˙ i o u t k x i ϕ k
I ˙ o u t e p = i e p g M ˙ i o u t k x k i ϕ k
where I ˙ o u t c p denotes the rate of PEI out of the process from chemical interactions, I ˙ o u t e p denotes the rate of PEI out of a system from energy generation processes and M ˙ i o u t is the mass flow rate of exit streams from the process i. xki is the mass fraction of component k in the exit stream i and ϕk is the potential environmental impact due to component k. The parameter ϕk denotes the sum of the specific PEI due to disposal of component k into the environment, leading to different impact categories l as follows [85]:
ψ k = l α i ϕ k l s
where, αi denotes the relative weighting factor of impact categories, l (Table 2), with all impact categories considered equally significant in the present study. In the present study, the environmental impacts of the processes were reported in terms of the PEI per unit time. PEI per unit time was selected because it indicates that all components of the output streams (waste streams, AA stream and product streams) for both cases were considered.
Other PEIs of the system such as the PEI due to the release of waste energy were assumed to be negligible because processes typically do not dispose “unwanted” energy into the environment [28]. Furthermore, PEI/h of the WAP was considered negligible in both cases due to the implied renewability of the biomass resource. Further descriptions of the WAR algorithm and the governing equations are outside the scope of the present study and are presented elsewhere [85,86,88].

3. Results

Based on the processes described in Section 2, the Aspen Plus-developed models are presented in Figure 3 and Figure 4, with the mass balance results of major streams presented in Table 3. Figure 3 represents the FD process, which integrates WAP handling and homogenization with pretreatment (for sugar release), fermentation (for LA production) and dehydration (for AA production). The model developed based on TFO process is shown in Figure 4, which includes WAP handling and gasification (for syngas production), syngas fermentation (for ethanol production), ethanol purification, ethanol dehydration (for ethylene production), ethylene to propylene conversions and propylene oxidation (for AA production) operations. The result in Table 3 shows that the FD process will facilitate the production of 1.94 tons/h (14 ktons/y) of AA (97 wt.% purity) and 0.34 tons/h (2.45 ktons/y) of acetaldehyde as byproducts. It is estimated that for an equal mass of feedstock, the resulting mass of AA generated via the FD process is approximately 6 times than that of the TFO process.
Employing the Aspen Energy Analyzer ® V.11 discussed above in Section 2.1, the externally required heating and cooling utilities are highlighted in Table 4.
Employing methods discussed in Section 2.3, the economic performances of FD and TFO processes were assessed. The TCI and the total operating cost (TOC) components results are presented in Table 5 and Table 6, respectively.
Employing the TOC and TCI values, the economic performance parameters were determined and summarized in Table 7.
Employing the WAR software and using the methods discussed earlier above in Section 2.3 above, the PEI/h for both processes are summarized in Figure 5.

4. Discussion

Table 3 shows that, based on the AA purity of 97 wt.% achieved in the present study, the AA product can be designated as technical grade (i.e., 94 wt.% ≤ AA purity < 99.5 wt.%) [89,90]. Such technical grade AA can be used in the synthesis of acrylate esters that can be transformed into comonomers [91]. These comonomers can be polymerized to produce valuable products, such as surface coatings, adhesives, textiles, paints and polymeric materials [91]. Table 3 also shows that the composition of syngas generated on a mass basis is 8, 31, and 61% for H2, CO, and CO2, which translates to mole basis equivalents of 62, 17 and 21%, respectively. These mole basis yields of H2, CO, and CO2 are comparable to the experimentally determined mole composition of syngas of ~60, ~22 and ~18% reported in the literature [92]. The mass balance results for major streams in the AA production processes are summarized in Table 3. The table shows that only 0.478 tons/h of propylene is generated from 0.786 tons/h of ethanol, translating to a yield of 27 wt.%. This observation is consistent with the experimentally reported yield of propylene from ethanol, which was shown to range from 24.5–28.6 wt.% [93]. In addition, considering the mass flow rate of sugars (C6 + C5) in the hydrolysate (4.77 ton/h) and the mass flow rate of LA (i.e., 3.915 ton/h) presented in Table 3, the LA yield per unit mass of sugars can be calculated as 82.1 wt.%. This yield is consistent with the yield of 88 kg of LA per 100 kg sugars (from apple pomace) and based on experimental work [94]. As expected, in both cases, the actual yield of LA is less than the theoretical yield of 1 kg of lactic per 1 kg of sugar [94]. Notably, the result in Table 3 suggests that our initial hypothesis that the complete utilization of all fractions of the WAP via its partial oxidation for syngas production will translate to higher AA productivity compared to the fermentation approach for initial LA production is false. This observation can be explained by the productivity of the intermediate product, particularly as the productivity of these intermediate streams directly impact the AA yield. For instance, Table 3 shows that the mass of the LA generated in the FD process is ~18 times the mass of propylene produced via the TFO process. Table 4 shows that while the external heating utility requirement of the FD pathway for AA production is 59.66 MW, the external heating utility requirement of the TFO pathway is negligible. These results are based on the assumption that full heat integration is achieved. This observation is expected and consistent with processes that incorporate exothermic processes [95,96,97]. In the TFO process, the oxidation of propylene for the generation of acrolein, AA, acetic acid and CO2 as discussed in Section 2.1 is highly exothermic [72]. For such exothermic systems, addition external heating utilities are not required. Similarly, since the exit hot streams (from the exothermic processes) are cooled by being employed as heat sources for steam generation, the externally required cooling duty calculated (15.87 MW) is shown to be lower than the externally required cooling duty in the FD process (27.48 MW). Table 4 also shows that the FD process has the potential for higher net electricity generation of 11.45 MW compared to the TFO process, which has net electricity production potential of 0.83 MW. This is expected, since in FD, the lignin fraction (HHV = ~25.5 MJ/kg [98]) employed as a solid fuel in the boiler for steam generation has a higher energy density compared to the TFO process, where CO (HHV = 4.368 MJ/kg [53]) is employed as the gaseous fuel. It is clear that the combustion of lignin will lead to the generation of more boiler heat, which, in turn, will generate more energetic steam than to the combustion of CO. Table 5 shows that the total capital investment (TCI) calculated for the TFO process of USD 26.5 million is 57% more (~) than the value calculated for the FD process of USD 16.9 million. This observation could be justified by the differences in processing complexity, with the TFO process clearly shown to incorporate more steps than the FD process. A higher number of processing steps employed typically translates to a higher capital cost. This statement is consistent with the “functional unit” approach in capital cost estimation [99,100]. Table 5 also shows that in both FD and TFO processes, the equipment installation cost is the most crucial costing component and constitutes ~51% of the total TCI. This observation is consistent with the class 4 estimation approach that considers the major equipment cost as the most crucial in calculating initial project cost estimates. Table 6, on the other hand, shows that the total operating cost of the FD process (USD 18.9 million) exceeds the total operating cost of the TFO process (USD 13.6 million), with the variable cost component accounting for 78 and 65% of the total cost, respectively. This observation is expected since, based on model descriptions in Section 2.1, the FD process will involve more variable cost components (i.e., chemical inputs of Ca(OH)2, H2SO4, catalyst, toluene and waste gypsum management) compared to the TFO process (catalyst and toluene)
Table 7 shows that the MSPs of the AA produced via the TFO and FD processes are USD 1.56 per kg and USD 1.17 per kg, respectively. This is due to the generation of more AA product and the lower TCI requirement in the FD process compared to the TFO process, as discussed above (Section 3). Both the FD and TFO pathways were shown to lead to the generation of an AA product with MSPs exceeding the price of commercial fossil-sourced AA, reported to have a selling price of USD 0.9 per kg [101] at the time of drafting this work. This suggests that more work is required to facilitate further reduction in the cost of producing biomass-sourced AA to enhance commercial competiveness. For instance, the introduction of intensification technologies, i.e., reactive distillation units, may significantly reduce the CAPEX for overall improvements in economic performance. Interestingly, the economic performance of the FD pathway (MSP of USD 1.17 per kg) was demonstrated to be comparable to the economic performance of the best-case scenario for AA production from biomass of MSP of USD 1.29 per kg, as reported in [102]. The difference in MSPs may be attributed to the differences in purity, with the study in [102] reporting a purity of >99% AA, while the present work reported AA purity of 97%. It is clear that enhancing the purity of the AA product will require the integration of addition purification units, leading to higher CAPEX costs and a higher MSP of AA.
Figure 5 shows that the FD pathway has a higher environmental impact (8.72 kPEI/h) compared to the TFO pathway (2.07 kPEI/h). In both pathways, the photochemical oxidation potential (PCOP) index constitutes the highest impact category, with values of 6.06 kPEI/h and 1.48 kPEI/h for the FD and TFO pathways, respectively. This may be due to the larger mass of toluene required in the FD process (642.2 kg/h) for AA recovery compared to that for the TFO process (102.7 kg/h). Volatile organic compounds such as toluene have the potential to undergo photochemical reactions with oxides such as nitrous oxides (NOx), leading to unwanted smog formation, implying that higher masses of toluene will exacerbate the PCOP pollution risk [86].
Figure 5 also shows that for the impact categories of HTPI, HTPE and TTP, the impacts associated with the FD process exceed those for the TFO process. These observations may be partly a consequence of the higher mass of toluene employed in FD compared to the TFO process. Notably, the wastewater stream generated via the FD process is characterized by residual sulfuric acid and calcium sulfate, which are consequences of the lactic acid purification process discussed in 2.1 above. Sulfuric acid and calcium sulfate have the potential to exacerbate unfavorable environmental impacts via an increase in indexes of ATP (aquatic toxicity) and TTP (terrestrial toxicity) when improperly managed. The presence of these pollutants in the waste stream from the FD process may explain its higher ATP (0.047 kPEI/h) and TTP (1.08 kPEI/h) indexes compared to the ATP (0.0085 kPEI/h) and TTP (0.278 kPEI/h) indexes of the TFO process. The higher impact acidification potential (AP) index value (0.213 kPEI/h) for the FD process relative to the AP index value (negligible kPEI/h) of the TFO process is due to the need for external fossil energy to satisfy the heating energy needs of the FD process. This is because the use of these fuels will lead to the unwanted production of oxides such as CO2 that are capable of forming weak acids (i.e., H2CO3 for acid rain production). The study therefore suggests that the TFO process is preferable to the FD process if only the environmental performance metrics are considered. This observation contradicts the conclusions drawn from the economic performance metrics since the FD process was shown to be preferable to the TFO process as illustrated by the lower MSP of AA. This scenario therefore presents a conundrum, with the selection of the preferred AA production pathway dependent on tradeoffs between favorable economic and environmental outcomes by decision makers.

5. Conclusions

The study presents an initial comparative analysis of the two acrylic acid (AA) production pathways while employing waste apple pomace (WAP) as a renewable carbon source. In this study, we assessed FD and TFO processes as alternative approaches. The FD process incorporates an initial pretreatment operation for the production of a hydrolysate stream containing useful sugars followed by fermentation of these sugars for lactic acid (LA) production prior to LA dehydration for AA production. The TFO process, on the other hand, integrates the gasification of WAP followed by the fermentation of the syngas for alcohol production, which is employed as a precursor for propylene gas production, prior to a catalytic oxidation process for AA production. Considering both speculative processes, the FD process was shown to present improved economic performance relative to the TFO process. This is highlighted by the lower MSP of the AA product from the FD process of USD 1.17 per kg relative to the MSP of USD 1.56 per kg from the AA product of the TFO process. Crucially, the TFO process exhibited improved environmental performance compared to the FD process, which presents a dilemma for policy makers. Further multicriteria decision assessment is therefore proposed.

Supplementary Materials

The following are available online at https://www.mdpi.com/article/10.3390/fermentation8010021/s1, Table S1: Composition of waste apple pomace, Table S2: Proximate and ultimate of waste apple pomace, Table S3: Details of major operations, Table S4: Economic assumptions employed in the study, Table S5: Capital cost components employed in TCI (CAPEX) determination, Table S6: Correlations employed in operating cost (OPEX) determination, Table S7: Assumed operating cost components, Table S8: Capital cost components obtained from literature only. All other costs are obtained from ASPEN plus economic analyzer.

Author Contributions

Conceptualization, O.V.O.; methodology, O.V.O. and L.N.; software, O.V.O.; validation, A.S. and H.A.; writing—original draft preparation, O.V.O., L.N. and A.S.; writing—review and editing, O.V.O., H.A. and A.S. All authors have read and agreed to the published version of the manuscript.

Funding

This research received no external funding.

Institutional Review Board Statement

Not applicable.

Informed Consent Statement

Not applicable.

Data Availability Statement

Not applicable.

Acknowledgments

The first author gratefully acknowledges the financial support of Wallonia-Brussels International via their Excellence Postdoctoral Fellowship. The Funds for Scientific Research (Belgium) in partnership with the National Research Fund (South Africa) are also acknowledged for the bilateral research mobility fund; REF PINT-BILAT-M / VA-R M005.21.

Conflicts of Interest

The authors declare no conflict of interest.

Abbreviations

FDFermentation-dehydration
TFOThermochemical-fermentation-oxidation
WAPWaste apple pomace
AAAcrylic acid
LALactic acid
GHGGreenhouse gas
NRTLNon-random two-liquid
RSTOICStoichiometric reactor model
RGIBBSEquilibrium reactor model
RADFRACRigorous distillation column model
CHPCombined heat and power
HHVhigher heating value
TCItotal capital investment
TOCtotal operating costs
FCIFixed capital investment
WCIWorking capital investment
TDCTotal direct cost
TIDCTotal indirect cost
APEAAspen Process Economic Analyzer
CEPCIChemical Engineering Plant Cost Index

References

  1. Moriarty, P.; Honnery, D. The risk of catastrophic climate change: Future energy implications. Futures 2021, 128, 102728. [Google Scholar] [CrossRef]
  2. Okoro, O.V.; Sun, Z.; Birch, J. Meat processing waste as a potential feedstock for biochemicals and biofuels—A review of possible conversion technologies. J. Clean. Prod. 2017, 142, 1583–1608. [Google Scholar] [CrossRef]
  3. Mehmood, M.A.; Liu, C.-G.; Reungsang, A. Editorial: Special issue “Sustainable biorefinery approaches”. Biomass Convers. Biorefinery 2021, 11, 741–742. [Google Scholar] [CrossRef]
  4. Yates, M.; Gomez, M.R.; Martin-Luengo, M.A.; Ibañez, V.Z.; Martinez Serrano, A.M. Multivalorization of apple pomace towards materials and chemicals. Waste to wealth. J. Clean. Prod. 2017, 143, 847–853. [Google Scholar] [CrossRef] [Green Version]
  5. Okoro, O.V.; Shavandi, A. An assessment of the utilization of waste apple slurry in bio-succinic acid and bioenergy production. Int. J. Environ. Sci. Technol. 2021. [Google Scholar] [CrossRef]
  6. Landi, G.; Lisi, L.; Russo, G. Oxidation of propane and propylene to acrylic acid over vanadyl pyrophosphate. J. Mol. Catal. A Chem. 2005, 239, 172–179. [Google Scholar] [CrossRef]
  7. Mazloom, G.; Alavi, S.M. Kinetic study of selective propane oxidation to acrylic acid over Mo1V0.3Te0.23Nb0.12Ox using the genetic algorithm. React. Kinet. Mech. Catal. 2013, 110, 387–403. [Google Scholar] [CrossRef]
  8. Scott, J. Acrylic Acid Production via Propylene Oxidation—By Intratec Solutions: Chemengonline. 2016. Available online: https://www.chemengonline.com/acrylic-acid-production-via-propylene-oxidation-intratec-solutions/ (accessed on 30 April 2021).
  9. Brown, D. Acrylic Acid. In Encyclopedia of Toxicology, 3rd ed.; Wexler, P., Ed.; Academic Press: Cambridge, MA, USA, 2014; pp. 74–75. [Google Scholar]
  10. Serrano-Aroca, A. Latest improvements of acrylic-based polymer properties for biomedical applications. In Acrylic Polymers in Healthcare; InTechOpen: Rijeka, Croatia, 2017; Volume 1, p. 13. [Google Scholar]
  11. Jin, X.; Meng, K.; Zhang, G.; Liu, M.; Song, Y.; Song, Z.; Yang, C. Interfacial catalysts for sustainable chemistry: Advances on atom and energy efficient glycerol conversion to acrylic acid. Green Chem. 2021, 23, 51–76. [Google Scholar] [CrossRef]
  12. Staples, T.L.; Chatterjee, P.K. Chapter VIII—Synthetic Superabsorbents. In Textile Science and Technology; Chatterjee, P.K., Gupta, B.S., Eds.; Elsevier: Amsterdam, The Netherlands, 2002; Volume 13, pp. 283–322. [Google Scholar]
  13. Grand-View-Research. Acrylic Acid Market Size Worth $22.55 Billion by 2022; Grand-View-Research: Dublin, Ireland, 2016. [Google Scholar]
  14. Expertmarketresearch. Global Acrylic Acid Market: By Applications: Acrylate Esters, Super Absorbent Polymer (SAP), Others; Regional Analysis; Historical Market and Forecast (2016–2026); Market Dynamics; SWOT Analysis; Porter’s Five Forces Analysis; Value Chain Analysis; Compet; Expertmarketresearch: Sheridan, WY, USA, 2020. [Google Scholar]
  15. Kim, M.; Lee, H. Highly Selective Production of Acrylic Acid from Glycerol via Two Steps Using Au/CeO2 Catalysts. ACS Sustain. Chem. Eng. 2017, 5, 11371–11376. [Google Scholar] [CrossRef]
  16. Danner, H.; Ürmös, M.; Gartner, M.; Braun, R. Biotechnological production of acrylic acid from biomass. Appl. Biochem. Biotechnol. 1998, 70, 887–894. [Google Scholar] [CrossRef]
  17. Straathof, A.J.J.; Sie, S.; Franco, T.T.; van der Wielen, L.A.M. Feasibility of acrylic acid production by fermentation. Appl. Microbiol. Biotechnol. 2005, 67, 727–734. [Google Scholar] [CrossRef]
  18. Petrescu, L.; Fermeglia, M.; Cormos, C.-C. Life Cycle Analysis applied to acrylic acid production process with different fuels for steam generation. J. Clean. Prod. 2016, 133, 294–303. [Google Scholar] [CrossRef]
  19. Iglesias, J.; Martínez-Salazar, I.; Maireles-Torres, P.; Martin Alonso, D.; Mariscal, R.; López Granados, M. Advances in catalytic routes for the production of carboxylic acids from biomass: A step forward for sustainable polymers. Chem. Soc. Rev. 2020, 49, 5704–5771. [Google Scholar] [CrossRef]
  20. Yan, B.; Liu, Z.-H.; Liang, Y.; Xu, B.-Q. Acrylic Acid Production by Gas-Phase Dehydration of Lactic Acid over K+-Exchanged ZSM-5: Reaction Variable Effects, Kinetics, and New Evidence for Cooperative Acid–Base Bifunctional Catalysis. Ind. Eng. Chem. Res. 2020, 59, 17417–17428. [Google Scholar] [CrossRef]
  21. Lyu, S.; Wang, T. Efficient production of acrylic acid by dehydration of lactic acid over BaSO4 with crystal defects. RSC Adv. 2017, 7, 10278–10286. [Google Scholar] [CrossRef] [Green Version]
  22. Wojcieszak, R.; Bonnotte, T.; Paul, S.; Katryniok, B.; Dumeignil, F. Lactic Acid Conversion to Acrylic Acid Over Fluoride-Substituted Hydroxyapatites. Front. Chem. 2020, 8, 421. [Google Scholar] [CrossRef]
  23. De Resende, T.M.; da Costa, M.M. Biopolymers of sugarcane. In Sugarcane Biorefinery, Technology and Perspectives; Santos, F., Rabelo, S.C., De Matos, M., Eichler, P., Eds.; Academic Press: Cambridge, MA, USA, 2020; pp. 229–254. [Google Scholar]
  24. Kehrer, M. Liquid-Phase Dehydration of Lactic Acid for the Production of Bio-Acrylic acid Development of a Multi-Step Process. Ph.D. Thesis, Friedrich-Alexander-Universität Erlangen-Nürnberg (FAU), Erlangen, Germany, 17 December 2018. [Google Scholar]
  25. Xu, X.; Lin, J.; Cen, P. Advances in the Research and Development of Acrylic Acid Production from Biomass1 1Supported by the Special Funds for Major State Basic Research Program of China (973 Program, No.2004CCA05500). Chin. J. Chem. Eng. 2006, 14, 419–427. [Google Scholar] [CrossRef]
  26. Pistikopoulos, E.N.; Stefanis, S.K.; Livingston, A.G.A. Methodology for Minimum Environmental Impact Analysis. Symp. Ser. 1995, 35, 4128. [Google Scholar]
  27. Shonnard, D.R.; Hiew, D.S. Comparative Environmental assessments of VOC Recovery and recycle design alaternatives for gaseous waste streams. Environ. Sci. Technol. 2000, 34, 5222–5228. [Google Scholar] [CrossRef]
  28. Young, D.M.; Cabezas, H. Designing sustainable processes with simulation: The waste reduction (WAR) algorithm. Comput. Chem. Eng. 1999, 23, 1477–1491. [Google Scholar] [CrossRef]
  29. Gustafsson, J.; Landberg, M.; Bátori, V.; Åkesson, D.; Taherzadeh, M.J.; Zamani, A. Development of Bio-Based Films and 3D Objects from Apple Pomace. Polymers 2019, 11, 289. [Google Scholar] [CrossRef] [Green Version]
  30. Zhang, B.; Heidari, M.; Regmi, B.; Salaudeen, S.; Arku, P.; Thimmannagari, M.; Dutta, A. Hydrothermal Carbonization of Fruit Wastes: A Promising Technique for Generating Hydrochar. Energies 2018, 11, 2022. [Google Scholar] [CrossRef] [Green Version]
  31. Marcotullio, G. The Chemistry and Technology of Furfural Production in Modern Lignocellulose-Feedstock Biorefineries. 2011. Available online: https://www.researchgate.net/publication/254908764_The_Chemistry_and_Technology_of_Furfural_Production_in_Modern_Lignocellulose-Feedstock_Biorefineries (accessed on 8 December 2021).
  32. Peña-Tejedor, S.; Murga, R.; Sanz, M.T.; Beltrán, S.J.F.P.E. Vapor–liquid equilibria and excess volumes of the binary systems ethanol+ ethyl lactate, isopropanol+ isopropyl lactate and n-butanol+ n-butyl lactate at 101.325 kPa. Fluid Phase Equilibria 2005, 230, 197–203. [Google Scholar] [CrossRef]
  33. Deterre, S.; Albet, J.; Joulia, X.; Baudouin, O.; Giampaoli, P.; Decloux, M.; Athes, V.J.J.O.C.; Data, E. Vapor–liquid equilibria measurements of bitter orange aroma compounds highly diluted in boiling hydro-alcoholic solutions at 101.3 kPa. J. Chem. Eng. Data 2012, 57, 3344–3356. [Google Scholar] [CrossRef]
  34. Vu, D.T.; Lira, C.T.; Asthana, N.S.; Kolah, A.K.; Miller, D.J.J.J.O.C.; Data, E. Vapor−liquid equilibria in the systems ethyl lactate+ ethanol and ethyl lactate+ water. J. Chem. Eng. Data 2006, 51, 1220–1225. [Google Scholar] [CrossRef]
  35. Cempa-Balewicz, M.; Jacek Łączny, M.; Smoliński, A.; Iwaszenko, S. Equilibrium Model of Steam Gasification of Coal. J. Sustain. Min. 2013, 12, 21–28. [Google Scholar] [CrossRef] [Green Version]
  36. Sreejith, C.C.; Muraleedharan, C.; Arun, P. Thermo-Chemical Analysis of Biomass Gasification by Gibbs Free Energy Minimization Model-Part: II (Optimization of Biomass Feed and Steam to Biomass Ratio). Int. J. Green Energy 2013, 10, 610–639. [Google Scholar] [CrossRef]
  37. Basu, P. Biomass Gasification and Pyrolysis: Practical Design and Theory; Academic Press: Cambridge, MA, USA, 2010. [Google Scholar]
  38. Okoro, O.V.; Sun, Z.; Birch, J. Techno-Economic Assessment of a Scaled-Up Meat Waste Biorefinery System: A Simulation Study. Materials 2019, 12, 1030. [Google Scholar] [CrossRef] [Green Version]
  39. Petersen, A.M.; Chireshe, F.; Okoro, O.; Gorgens, J.; Van Dyk, J. Evaluating refinery configurations for deriving sustainable aviation fuel from ethanol or syncrude. Fuel Process. Technol. 2021, 219, 106879. [Google Scholar] [CrossRef]
  40. ASPEN-plus. Aspen Plus User Guide; ASPEN Technology Incorporated: Cambridge, MA, USA, 2000. [Google Scholar]
  41. Petersen, A.M.; Okoro, O.V.; Chireshe, F.; Moonsamy, T.; Görgens, J.F. Systematic cost evaluations of biological and thermochemical processes for ethanol production from biomass residues and industrial off-gases. Energy Convers. Manag. 2021, 243, 114398. [Google Scholar] [CrossRef]
  42. Okoro, O.V.; Nie, L.; Hobbi, P.; Shavandi, A. Valorization of Waste Apple Pomace for Production of Platform Biochemicals: A Multi-Objective Optimization Study. Waste Biomass Valorization 2021, 12, 6887–6901. [Google Scholar] [CrossRef]
  43. Alibaba. Mechanical Dewatering Device. Available online: https://www.alibaba.com/product-detail/Dewatering-Dewatering-Machine-NORSEN-Vehicular-Sludge_1600051333912.html?spm=a2700.galleryofferlist.normal_offer.d_title.5c49383dKmOCni&s=p (accessed on 18 February 2021).
  44. Zimmer, E. Optimal Use of Resources and Energy During Fruit Juice Extraction. In Fruit Processing; Bucher Unipektin A: Nlederwenlngen, Switzerland, 2017. [Google Scholar]
  45. Kim, D. Physico-Chemical Conversion of Lignocellulose: Inhibitor Effects and Detoxification Strategies: A Mini Review. Molecules 2018, 23, 309. [Google Scholar] [CrossRef] [PubMed] [Green Version]
  46. Pérez, J.A.; Ballesteros, I.; Ballesteros, M.; Sáez, F.; Negro, M.J.; Manzanares, P. Optimizing Liquid Hot Water pretreatment conditions to enhance sugar recovery from wheat straw for fuel-ethanol production. Fuel 2008, 87, 3640–3647. [Google Scholar] [CrossRef]
  47. Hijosa-Valsero, M.; Paniagua-García, A.I.; Díez-Antolínez, R. Biobutanol production from apple pomace: The importance of pretreatment methods on the fermentability of lignocellulosic agro-food wastes. Appl. Microbiol. Biotechnol. 2017, 101, 8041–8052. [Google Scholar] [CrossRef] [PubMed]
  48. Iyer, P.V.; Thomas, S.; Lee, Y.Y. High-yield fermentation of pentoses into lactic acid. Appl. Biochem. Biotechnol. 2000, 84, 665–677. [Google Scholar] [CrossRef]
  49. Su, C.-Y.; Yu, C.-C.; Chien, I.L.; Ward, J.D. Control of Highly Interconnected Reactive Distillation Processes: Purification of Raw Lactic Acid by Esterification and Hydrolysis. Ind. Eng. Chem. Res. 2015, 54, 6932–6940. [Google Scholar] [CrossRef]
  50. Kamble, S.P.; Barve, P.P.; Joshi, J.B.; Rahman, I.; Kulkarni, B.D. Purification of Lactic Acid via Esterification of Lactic Acid Using a Packed Column, Followed by Hydrolysis of Methyl Lactate Using Three Continuously Stirred Tank Reactors (CSTRs) in Series: A Continuous Pilot Plant Study. Ind. Eng. Chem. Res. 2012, 51, 1506–1514. [Google Scholar] [CrossRef]
  51. Lee, H. Development of Lactic and Succinic Acid Biorefinery Configurations for Integration into a Thermomechanical Pulp Mill. Master’s Thesis, École Polytechnique de Montréal, Montreal, QC, Canada, 2015. [Google Scholar]
  52. Ghantani, V.C.; Lomate, S.T.; Dongare, M.K.; Umbarkar, S.B. Catalytic dehydration of lactic acid to acrylic acid using calcium hydroxyapatite catalysts. Green Chem. 2013, 15, 1211–1217. [Google Scholar] [CrossRef]
  53. Engineeringtoolbox. Fuel Gases Heating Values. Engineeringtoolbox. 2021. Available online: https://www.engineeringtoolbox.com/heating-values-fuel-gases-d_823.html (accessed on 24 April 2021).
  54. Berg, L. Dehydration of Acrylic Acid by Extractive Distillation. U.S. Patent 5,154,800, 13 October 1992. [Google Scholar]
  55. Song, D.; Yang, J.-H.; Lee, C.-J. Conceptual design of water separation process in glycerol-based acrylic acid production. Chem. Eng. Res. Des. 2020, 156, 324–332. [Google Scholar] [CrossRef]
  56. Gagliano, A.; Nocera, F.; Bruno, M.; Cardillo, G. Development of an Equilibrium-based Model of Gasification of Biomass by Aspen Plus. Energy Procedia 2017, 111, 1010–1019. [Google Scholar] [CrossRef]
  57. Pardo-Planas, O.; Atiyeh, H.K.; Phillips, J.R.; Aichele, C.P.; Mohammad, S. Process simulation of ethanol production from biomass gasification and syngas fermentation. Bioresour. Technol. 2017, 245, 925–932. [Google Scholar] [CrossRef]
  58. Okoro, O.V.; Faloye, F.D. Comparative Assessment of Thermo-Syngas Fermentative and Liquefaction Technologies as Waste Plastics Repurposing Strategies. AgriEngeneering 2020, 2, 378–392. [Google Scholar] [CrossRef]
  59. Salaudeen, S.A.; Acharya, B.; Heidari, M.; Al-Salem, S.M.; Dutta, A. Hydrogen-Rich Gas Stream from Steam Gasification of Biomass: Eggshell as a CO2 Sorbent. Energy Fuels 2020, 34, 4828–4836. [Google Scholar] [CrossRef]
  60. Pala, L.P.R.; Wang, Q.; Kolb, G.; Hessel, V. Steam gasification of biomass with subsequent syngas adjustment using shift reaction for syngas production: An Aspen Plus model. Renew. Energy 2017, 101, 484–492. [Google Scholar] [CrossRef]
  61. Sreejith, C.C.; Muraleedharan, C.; Arun, P. Performance prediction of steam gasification of wood using an ASPEN PLUS thermodynamic equilibrium model. Int. J. Sustain. Energy 2014, 33, 416–434. [Google Scholar] [CrossRef]
  62. Doherty, W.; Reynolds, A.; Kennedy, D. Aspen plus simulation of biomass gasification in a steam blown dual fluidised bed. In Materials and Processes for Energy: Communicating Current Research and Technological Developments; Formatex Research Centre: Norristown, PA, USA, 2013. [Google Scholar]
  63. Basu, P. (Ed.) Chapter 9—Production of Synthetic Fuels and Chemicals from Biomass. In Biomass Gasification and Pyrolysis; Academic Press: Cambridge, MA, USA, 2010; pp. 301–323. [Google Scholar]
  64. Ukpong, M.N.; Atiyeh, H.K.; De Lorme, M.J.; Liu, K.; Zhu, X.; Tanner, R.S.; Wilkins, M.R.; Stevenson, B.S. Physiological response of Clostridium carboxidivorans during conversion of synthesis gas to solvents in a gas-fed bioreactor. Biotechnol. Bioeng. 2012, 109, 2720–2728. [Google Scholar] [CrossRef]
  65. Tanner, R.S.; Miller, L.M.; Yang, D. Clostridium ljungdahlii sp. nov., an acetogenic species in clostridial rRNA homology group I. Int. J. Syst. Evol. Microbiol. 1993, 43, 232–236. [Google Scholar] [CrossRef] [Green Version]
  66. Phillips, J.R.; Klasson, K.T.; Clausen, E.C.; Gaddy, J.L. Biological production of ethanol from coal synthesis gas. Appl. Biochem. Biotechnol. 1993, 39, 559–571. [Google Scholar] [CrossRef]
  67. Petersen, A.M.; Okoro, O.V.; Du Preez, J.; Görgens, J.F. Evaluation of Biorefining Scenarios for Advanced Fuels Production from Triticale Grain. Energy Fuels 2020, 34, 11003–11013. [Google Scholar] [CrossRef]
  68. Arvidsson, M.; Lundin, B. Process Integration Study of a Biorefinery Producing Ethylene from Lignocellulosic Feedstock for a Chemical Cluster. Master’s Thesis, Chalmers University of Technology, Goteborg, Sweden, 2011. [Google Scholar]
  69. Calvar, N.; González, B.; Dominguez, A. Esterification of acetic acid with ethanol: Reaction kinetics and operation in a packed bed reactive distillation column. Chem. Eng. Process Intensif. 2007, 46, 1317–1323. [Google Scholar] [CrossRef]
  70. Beucher, R.; Cammarano, C.; Rodríguez-Castellón, E.; Hulea, V. Direct conversion of ethylene to propylene over Ni- and W-based catalysts: An unprecedented behaviour. Catal. Commun. 2020, 144, 106091. [Google Scholar] [CrossRef]
  71. Pérez Sánchez, A.; Pérez Sánchez, E.J.; Segura Silva, R.M. Simulation of the acrylic acid production process through catalytic oxidation of gaseous propylene using ChemCAD® simulator. J. Ingeniare Revista Chilena Ingeniería 2019, 27, 142–150. [Google Scholar] [CrossRef] [Green Version]
  72. Wibawanta, S.A.S. Catalytic Partial Oxidation of Propylene for Acrolein Production. Master’s Thesis, Curtin University, Perth, Australia, March 2011. [Google Scholar]
  73. Kanidarapu, N.R.; Reddy, G.K.; Prasad, P.R.; Sujatha, V. Design and Pinch Analysis of Methyl Acetate Production Process using Aspen Plus and Aspen Energy Analyzer. Int. J. Chem. Eng. Process. 2015, 1, 31–40. [Google Scholar]
  74. Okoro, O.V.; Nkrumah Banson, A.; Zhang, H. Circumventing Unintended Impacts of Waste N95 Facemask Generated during the COVID-19 Pandemic: A Conceptual Design Approach. Chem. Eng. 2020, 4, 54. [Google Scholar] [CrossRef]
  75. Devi, A.; Niazi, A.; Ramteke, M.; Upadhyayula, S. Techno-economic analysis of ethanol production from lignocellulosic biomass–a comparison of fermentation, thermo catalytic, and chemocatalytic technologies. Bioprocess Biosyst. Eng. 2021, 44, 1093–1107. [Google Scholar] [CrossRef] [PubMed]
  76. Sinnot, R.; Towler, G. Chemical Engineering Design; Elsevier: Burlington, NJ, USA, 2009. [Google Scholar]
  77. Lamidi, R.O.; Wang, Y.; Pathare, P.B.; Roskilly, A.P.; Aguilar, M.C. Biogas Tri-generation for Postharvest Processing of Agricultural Products in a Rural Community: Techno-economic Perspectives. Energy Procedia 2017, 142, 63–69. [Google Scholar] [CrossRef]
  78. Granjo, J.; Duarte, B.; Oliveira, N. Soybean biorefinery: Process simulation and analysis. J. Chem. Eng. Trans. 2015, 45, 583–588. [Google Scholar]
  79. Dimitriou, I.; García-Gutiérrez, P.; Elder, R.H.; Cuéllar-Franca, R.M.; Azapagic, A.; Allen, R.W.K. Carbon dioxide utilisation for production of transport fuels: Process and economic analysis. Energy Environ. Sci. 2015, 8, 1775–1789. [Google Scholar] [CrossRef] [Green Version]
  80. Dutta, A.; Talmadge, M.; Hensley, J.; Worley, M.; Dudgeon, D.; Barton, D.; Groendijk, P.; Ferrari, D.; Stears, B.; Searcy, E.M. Process Design and Economics for Conversion of Lignocellulosic Biomass to Ethanol: Thermochemical Pathway by Indirect Gasification and Mixed Alcohol Synthesis; National Renewable Energy Laboratory (NREL): Golden, CO, USA, 2011. [Google Scholar]
  81. Rickman, W.S. Handbook of Incineration of Hazardous Wastes (1991); CRC Press: Boca Raton, FL, USA, 2017. [Google Scholar]
  82. Towler, G.; Sinnott, R. Chemical Engineering Design: Principles, Practice and Economics of Plant and Process Design; Elsevier: Amsterdam, The Netherlands, 2008. [Google Scholar]
  83. Spath, P.; Aden, A.; Eggeman, T.; Ringer, M.; Wallace, B.; Jechura, J. Biomass to Hydrogen Production Detailed Design and Economics Utilizing the Battelle Columbus Laboratory Indirectly-Heated Gasifier; National Renewable Energy Laboratory: Golden, CO, USA, 2005. [Google Scholar]
  84. DOE. Cost Estimating Guide; Department of Energy: Washington, DC, USA, 2018; Available online: https://www.directives.doe.gov/directives-documents/400-series/0413.3-EGuide-21A/@@images/file (accessed on 10 September 2021).
  85. Young, D.; Scharp, R.; Cabezas, H. The waste reduction (WAR) algorithm: Environmental impacts, energy consumption, and engineering economics. Waste Manag. 2000, 20, 605–615. [Google Scholar] [CrossRef]
  86. Okoro, O.V.; Sun, Z.; Birch, J. Catalyst-Free Biodiesel Production Methods: A Comparative Technical and Environmental Evaluation. Sustainability 2018, 10, 127. [Google Scholar] [CrossRef] [Green Version]
  87. Cabezas, H.; Bare, J.; Mallick, S. Pollution prevention with chemical process simulators: The generalized waste reduction (WAR) algorithm–full version. Comput. Chem. Eng. 1999, 23, 623–634. [Google Scholar] [CrossRef]
  88. Gangadharan, P.; Kanchi, K.C.; Lou, H.H. Evaluation of the economic and environmental impact of combining dry reforming. Chem. Eng. Res. Des. 2012, 90, 1956–1968. [Google Scholar] [CrossRef]
  89. Pubchem. Acrylic Acid. National Library of Medicine. 2021. Available online: https://pubchem.ncbi.nlm.nih.gov/compound/Acrylic-acid (accessed on 10 October 2021).
  90. WHO. Acrylic Acid Health and Safety Guide; IPCS International Programme on Chemical Safety Health and Safety Guide No. 104; WHO: Geneva, Switzerland, 1997. [Google Scholar]
  91. Culp, A.; Holmes, K.; Nagrath, R.; Nessenson, D. Propane to Acrylic Acid; School of Engineering and Applied Science, University of Pennsylvania: Philadelphia, PA, USA, 2013. [Google Scholar]
  92. Salaudeen, S.A.; Acharya, B.; Dutta, A. Steam gasification of hydrochar derived from hydrothermal carbonization of fruit wastes. Renew. Energy 2021, 171, 582–591. [Google Scholar] [CrossRef]
  93. Xia, W.; Takahashi, A.; Nakamura, I.; Shimada, H.; Fujitani, T. Study of active sites on the MFI zeolite catalysts for the transformation of ethanol into propylene. J. Mol. Catal. A Chem. 2010, 328, 114–118. [Google Scholar] [CrossRef]
  94. Gullón, B.; Garrote, G.; Alonso, J.L.; Parajó, J.C. Production of l-lactic Acid and Oligomeric Compounds from Apple Pomace by Simultaneous Saccharification and Fermentation.  A Response Surface Methodology Assessment. J. Agric. Food Chem. 2007, 55, 5580–5587. [Google Scholar] [CrossRef]
  95. Akhtar, J.; Amin, N.A.S. A review on process conditions for optimum bio-oil yield in hydrothermal liquefaction of biomass. Renew. Sustain. Energy Rev. 2011, 15, 1615–1624. [Google Scholar] [CrossRef]
  96. Midgett, J.S. Assessing a Hydrothermal Liquefaction Process Using Biomass Feedstocks. Master’s Thesis, Luisiana State University, Baton Rouge, LA, USA, May 2008. [Google Scholar]
  97. Remón, J.; Randall, J.; Budarin, V.L.; Clark, J.H. Production of bio-fuels and chemicals by microwave-assisted, catalytic, hydrothermal liquefaction (MAC-HTL) of a mixture of pine and spruce biomass. Green Chem. 2019, 21, 284–299. [Google Scholar] [CrossRef]
  98. Demirbas, A. Higher heating values of lignin types from wood and non-wood lignocellulosic biomasses. Energy Sources Part A: Recovery Util. Environ. Eff. 2017, 39, 592–598. [Google Scholar] [CrossRef]
  99. Okoro, O.V.; Sun, Z.; Birch, J. Meat processing dissolved air flotation sludge as a potential biodiesel feedstock in New Zealand: A predictive analysis of the biodiesel product properties. J. Clean. Prod. 2017, 168, 1436–1447. [Google Scholar] [CrossRef]
  100. Cheali, P.; Gernaey, K.V.; Sin, G. Uncertainties in Early-Stage Capital Cost Estimation of Process Design—A Case Study on Biorefinery Design. Front. Energy Res. 2015, 3, 3. [Google Scholar] [CrossRef] [Green Version]
  101. Alibaba. Premium Industrial Grade Glacial Acrylic Acid 79-10-7 with Purity 99.9% Min Acrylic Acid Liquid for Water Treatment. 2021. Available online: https://www.alibaba.com/product-detail/Premium-Industrial-Grade-Glacial-Acrylic-Acid_1600360477213.html?spm=a2700.galleryofferlist.normal_offer.d_title.68a62f5dV4rcRI (accessed on 13 September 2021).
  102. Bhagwat, S.S.; Li, Y.; Cortés-Peña, Y.R.; Brace, E.C.; Martin, T.A.; Zhao, H.; Guest, J.S. Sustainable Production of Acrylic Acid via 3-Hydroxypropionic Acid from Lignocellulosic Biomass. ACS Sustain. Chem. Eng. 2021, 9, 16659–16669. [Google Scholar] [CrossRef]
Figure 1. Simplified process flow diagram for acrylic acid production from waste apple pomace using the fermentation–dehydration (FD) pathway involving LA production as a precursor to AA production.
Fermentation 08 00021 g001
Figure 2. Simplified process flow diagram for acrylic acid production from waste apple pomace using the thermochemical–fermentation–oxidation pathway involving propylene production as a precursor.
Fermentation 08 00021 g002
Figure 3. Aspen Plus output for AA production from WAP via the fermentation–dehydration (FD) pathway (black continuous lines, red dash lines and blue dashed line denote material, heat and work flows).
Fermentation 08 00021 g003
Figure 4. Aspen Plus output for AA production from WAP via the thermochemical–fermentation–oxidation (TFO) pathway (black continuous lines, red dash lines and blue dashed line denote material, heat and work flows, respectively).
Fermentation 08 00021 g004
Figure 5. Potential environmental impacts per h for the fermentation–dehydration (FD) and thermochemical–fermentation–oxidation (TFO) pathways.
Fermentation 08 00021 g005
Table 1. Economic parameters and assumptions.
ParameterValue
Base year2020
Project lifetime (y)30
Plant availability (h/y)7200
Tax rate (%)30
Discount rate (%)10
Salvage value (USD) 0
Depreciation Straight line
Table 2. Impact categories that constitute the basis of the potential environmental impact [86,88].
General Impact CategoryImpact CategoryMeasure of Impact Category
Human toxicityIngestion (HTPI)LD50
Inhalation/dermal (HTPE)OSHA PEL
Ecological toxicityAquatic toxicity (ATP)Fathead minnow LC50
Terrestrial toxicity (TTP)LD50
Global atmospheric impactsGlobal warming potential (GWP)GWP
Ozone depletion potential (ODP)ODP
Regional atmospheric impactsAcidification potential (AP)AP
Photochemical oxidation potential (PCOP)PCOP
Table 3. Mass balance results for major streams in the AA production processes.
Stream NameFD ProcessTFO Process
HydrolysateStream LAAA ACSyngas EAStream PAA
Mass fractions (x)
2-Butene0000000.5500
AC0000.9800000
AA 000.97000000.970
Carbon dioxide00000.610000
Carbon monoxide00000.310000
Ethanol00000000
Fructose0.0180000000
Glucose0.0240000000
Hydrogen00000.080000
LA00.500000000
Methane00000000
Propylene0000000.4500
Toluene000.03000000.030
EA00000100
Water0.9520.50000.0200000
Xylose0.0060000000
Mass flows (tons/h)99.307.831.940.330.4831.1660.4780.313
LA and P denote the streams containing crucial intermediate compounds of lactic acid and propylene, respectively. AC denotes acetaldehyde; FD denotes fermentation–dehydration; TFO denotes thermochemical–fermentation–oxidation; EA denotes ethyl acetate.
Table 4. External utility requirements of the conversion processes, assuming full heat integration.
Process ResultFD ProcessTFO Process
Externally required heating utility (MW)59.66-
Externally required cooling utility (MW)27.4815.87
Net electricity generated (MW) 11.450.83
FD denotes the fermentation–dehydration process and TFO denotes the thermochemical–fermentation–oxidation process.
Table 5. Cost distribution for total capital investment for acrylic acid production via two pathways.
Costing ComponentsFD ProcessTFO Process
Warehouse cost (USD)342,807.9536,738.2
Equipment installation cost (USD)771,317.81,207,661.0
Home office and construction fee (USD)385,658.9603,830.5
Site development (USD)8,570,198.213,418,455.1
Prorateable expenses (USD)1,006,998.31,576,668.5
Project contingency (USD)1,006,998.31,576,668.5
Additional piping (USD)2,013,996.63,153,337.0
Field expenses (USD)1,006,998.31,576,668.5
Other costs (start up, permits, etc.) (USD)1,006,998.31,576,668.5
Working capital (USD)805,598.61,261,334.8
Total capital investment (USD)16,917,571.226,488,030.6
FD denotes the fermentation–dehydration process and TFO denotes the thermochemical–fermentation–oxidation process.
Table 6. Cost distribution for total operating cost for acrylic acid production via two pathways.
Costing ComponentsFD ProcessTFO Process
Labor cost (USD)1,504,2961,504,296
Maintenance cost (USD)1,353,866.41,353,866.4
Labor burden (USD)113,616.9214,100
Property insurance (USD)1,127,838.11,765,868.7
Total variable cost (USD)14,834,442.68,791,658.6
Total operating cost (USD)18,934,059.913,629,789.7
FD denotes the fermentation–dehydration process and TFO denotes the thermochemical–fermentation–oxidation process.
Table 7. The minimum selling price (MSP) of AA generated by the processes considered.
ProcessMSP (USD/kg)
FD process1.17
TFO process1.56
FD denotes the fermentation–dehydration process and TFO denotes the thermochemical–fermentation–oxidation process.
Publisher’s Note: MDPI stays neutral with regard to jurisdictional claims in published maps and institutional affiliations.

