Article

pH-Based Control Strategies for the Nitrification of High-Ammonium Wastewaters

by
Ignatius Leopoldus van Rooyen
,
Hendrik Gideon Brink
and
Willie Nicol
*
Department of Chemical Engineering, University of Pretoria, Lynnwood Road, Private Bag X20, Hatfield, Pretoria 0028, South Africa
*
Author to whom correspondence should be addressed.
Fermentation 2021, 7(4), 319; https://doi.org/10.3390/fermentation7040319
Submission received: 24 November 2021 / Revised: 16 December 2021 / Accepted: 17 December 2021 / Published: 19 December 2021
(This article belongs to the Special Issue Recent Trends in Biogenic Gas, Waste and Wastewater Fermentation)

Abstract

:
Aquatic nitrogen pollution is one of the most urgent environmental issues requiring prevention and mitigation. Large quantities of high-ammonium wastewaters are generated by several industrial sectors, such as fertilizer and anaerobic-digestion plants. Nitrification of these wastewaters is commonly carried out, either to remove nitrogen or produce liquid fertilizers. Standard control methodologies for the efficient nitrification of high-ammonium wastewaters to produce liquid fertilizers have not yet been established and are still within their early stages of development. In this paper, novel pH-based control algorithms are presented that maintain operation at the microbial maximum reaction rate ( υ m a x ) in batch and continuous reactors. Complete conversion of ammonium to nitrate was achieved in a batch setup, and a conversion of 93% (±1%) was achieved in a continuously-stirred-tank-reactor. The unparalleled performance and affordability of the control schemes proposed offer a steppingstone to the future of sustainable fertilizer production.

Graphical Abstract

1. Introduction

The explosion of the world-population in the 20th century was made possible by the advent of the Haber–Bosch process. For the first time, nitrogen fertilizer (ammonia) could be produced at relatively low cost, allowing a several-fold increase in agricultural food production [1]. However, this high input of synthetic nitrogen has caused extensive environmental damage. Nitrogen is the limiting nutrient in most ecosystems and excess nitrogen results in far-reaching consequences. These include eutrophication, air pollution, biodiversity loss, climate change, and stratospheric ozone depletion [2]. Numerous investigations and regulations have since aimed to reduce this hazardous use of nitrogen [3,4,5,6,7].
One way to reduce the influx of synthetic nitrogen is to identify points along the production line at which nitrogen can be recycled. One such recovery point is ammonium rich wastewaters. Ammonium is a common pollutant found in both domestic and industrial wastewaters [8]. Plants most-prefer ammonium as nitrogen source and thus these wastewaters have been proposed as fertilizers. Most commonly, the wastewater from the anaerobic-digestion process has been proposed as a nutrient solution for hydroponic systems [9,10,11,12,13,14].
Hydroponics will likely play a key role in the future of sustainable food production given their pollution control capabilities [15,16]. Unlike conventional agriculture, however, high ammonium applications can be detrimental to hydroponic crops [11,13,17,18]. A large fraction of the ammonium must therefore be converted to nitrate, which is the nitrogen source traditionally supplied to hydroponic crops [19]. This can readily be accomplished via microbial nitrification, yielding a nitrate rich nutrient solution [20].
The use of these wastewaters as fertilizers in hydroponic systems is a relatively new research field [21]. Large scale processes for the nitrification of high-ammonium wastewaters for fertilizer production have not yet been adequately documented and standard control methodologies are yet to be established. The aim of this study was to develop a control scheme for the efficient nitrification of high-ammonia wastewaters. The objectives were: (1) affordability, (2) operation at the microbial maximum nitrification rate ( υ m a x ), (3) high conversion of ammonia to nitrate, and (4) controller adaptability (to accommodate variations in microbial activity).
The conversion of ammonia to nitrate involves two main microbial processes [22]. The first is ammonia oxidation to form nitrite, which is carried out by ammonia oxidizing bacteria. The second step is performed by a complementary microbial population which converts the nitrite to nitrate. The second step is usually much faster (but depends on variables such as temperature and pH), and therefore nitrite is typically present in minute quantities [22]. The overall reaction is highly acidic and hydroxide dosing (or other alkaline species) is required to maintain the pH at habitable conditions for the nitrifying bacteria (unless ammonia concentrations are relatively low). Approximately 1 mol of protons are released per mol of ammonia oxidized to nitrite and the conversion of nitrite to nitrate is pH neutral [23]. Therefore, the pH characteristics of the system can be used to infer nitrification activity. Since pH control systems are relatively cheap, affordable nitrification control can be achieved through innovative use of this variable. The successful use of such a pH-based control strategy would satisfy the objective of affordability (objective 1, as mentioned above). As such, pH-based control systems were designed to satisfy the remaining objectives, which are to maximize nitrification rates and achieve high conversion under adaptable control.

2. Materials and Methods

2.1. Experiments

In each experimental run, three independent nitrification reactors were operated in parallel. Thus, each run represented a triplicate. Each system had a liquid capacity of 1.8 L and was packed with biological filter media (Evolution Aqua Kaldnes® K1 Media). Each system was equipped with two peristaltic dosing pumps and two dosing reservoirs of 0.2 M (NH4)2SO4 (representing the wastewater) and 0.3 M KOH. A water addition and pump and a drain pump were incorporated to each system to allow a continuous liquid throughput (CSTR configuration). The nitrifying bacteria were cultivated for a period of four months (prior to the first experiment) after inoculation with an activated sample (DoPhin® “14 in 1 nitrifying bacteria”). Air sparging at 240 L h−1, using air pumps (Regent® 9500), was employed and the solution was replaced regularly. The nutrient solution used to cultivate the nitrifying bacteria was composed of 6 mM (NH4)2SO4, 2 mM MgSO4·7H2O, 1 mM KH2PO4, 6 mg L−1 NaOH, 7.5 mg L−1 Fe-EDTA, 0.05 mg L−1 Cu-EDTA, 2.9 mg L−1 H3BO3, 1.8 mg L−1 MnCl2·4H2O, 0.2 mg L−1 ZnSO4·7H2O, and 0.1 mg L−1 Na2MoO4·2H2O. For each subsequent experiment, the same nutrient solution was used except for (NH4)2SO4, which varied depending on the experimental objectives. All chemicals/nutrients were purchased from Merck™ (BioXtra©, ≥99.0%).
Run 1 was performed to establish the relationship between ammonium oxidation and hydroxide dosing required for pH homeostasis. The same nutrient solution (as above) was used but with zero (NH4)2SO4 charged initially. Instead, ammonium was dosed from the 0.2 M (NH4)2SO4 reservoir at a rate of 0.56 mmol L−1 day−1 (1 mmol day–1 per reactor volume of 1.8 L). The pH was controlled autonomously (at 6.5) by dosing hydroxide from the 0.3 M KOH reservoir via proportional-integral control (from online pH measurements taken every 30 min). Run 2 was the same as run 1 but instead, ammonium was dosed at a rate of 3.92 mmol L−1 day−1 (7 times higher).
Run 3 involved nitrification control in a batch setup with a proposed control strategy derived from the correlations obtained in runs 1 and 2 (discussed in Section 3). The same nutrient solution was charged with 4 mM (NH4)2SO4 initially. No additional (NH4)2SO4 was dosed and the pH was controlled in the same fashion as in runs 1 and 2 (using Proportional-Integral control).
Run 4 employed a different control strategy in a fed-batch system. The same nutrient solution was supplied with zero (NH4)2SO4 initially. Ammonium was dosed at a calculated value according to the proposed control strategy (discussed in Section 3). The pH was also controlled autonomously via PI control. Run 5 was near-identical to run 4, but instead, a constant throughput of deionised water was employed at a dilution rate of 1 day−1 (thus, operation in a continuously-stirred-tank-reactor (CSTR) instead of a fed-batch).

2.2. Apparatus and Instruments

An Arduino Mega 2560™ was employed as the controller platform which controlled all three systems simultaneously. HAOSHI™ pH probes (“pH meter Pro”) were used for online pH measurements. Kamoer© peristaltic pumps (“Precision Peristaltic Pump + Intelligent Stepper Controller”) were used for dosing (NH4)2SO4 and KOH. DFrobot™ peristaltic pumps (“digital peristaltic pump”) were used for automated water addition and solution removal. The main recirculation pumps were purchased from Xylem™ (Flojet Diaphragm Electric Operated Positive Displacement Pump, 3.8 L min−1, 2.5 bar, 12 V DC). Four Gravity™ analog electrical conductivity sensor V2 were used for online EC measurements. Nitrate, nitrite, and ammonium analysis was done using Merck™ photometric cell tests (nitrate test: DMP 0.10–25.0 mg/l NO3-N, nitrite test: 0.002–1.00 mg/l NO2-N, and ammonium test: 2.0–150 mg/l NH4-N Spectroquant®). The absorbance was measured in a spectrophotometer (Agilent Technologies™, Cary 60 UV-Vis, G6860A) at 340, 525, and 690 nm for nitrate, nitrite, and ammonium, respectively.

3. Results and Discussion

3.1. Determining the pH Characteristics of Nitrification

Since lower operating pH values are employed in hydroponic systems (around pH of 6), nitrification will also be conducted at lower pH levels (6.5) to yield a fertilizer product that can be applied directly. At lower pH levels, ammonia will predominantly exist in its protonated form, ammonium. As such, the reaction will henceforth be modelled as if ammonium is oxidized [24]. Therefore, effectively 2 mols of protons are released per mol of ammonium oxidized. Thus, if the pH is tightly controlled with hydroxide dosing, the hydroxide dosing rate will be two times the ammonium oxidation rate, as shown in Equations (1) and (2).
NH 4 + NO 3 + 2 H +
Therefore, if the pH is controlled:
D O H = 2   r N H 4 +
where r N H 4 + is the ammonium oxidation rate by the bacteria (molar) and D O H is the hydroxide dosing rate required for pH homeostasis.
This assumption was investigated in runs 1 and 2. A fed-batch setup was employed in which ammonium ((NH4)2SO4) was fed at a constant rate and the pH was controlled at 6.5 via feedback-PI-control. In run 1, ammonium was fed at 0.56 mmol-N L–1 day–1, which was approximately 10 times less than the maximum ammonium oxidation rate of the bacteria (estimated from trial runs). Run 2 was the same as run 1 except for feeding ammonium 7 times faster (3.92 mmol-N L–1 day–1). The results from runs 1 and 2 are reported in Figure 1. The measured nitrate concentrations and the cumulative amounts of hydroxide dosed (resulting from the pH controller) are plotted against the cumulative amounts of ammonium dosed (per litre solution). The ratio of the nitrate concentrations to the cumulative amounts of ammonium dosed equals 1, as shown in Figure 1. Therefore, all the ammonium dosed was converted to nitrate. The ratio of hydroxide to ammonium dosed is equal to 2 and 2.17 for runs 1 and 2, respectively. The ratio for run 2 is higher than the theoretical ratio of 2 (Equations (1) and (2)). This may be due to experimental error or additional acidic effects produced by the bacteria.

3.2. Batch Systems

Nitrification can be carried out in various reactor types. The choice depends on process specification. As such, control algorithms were designed for three common reactor types, namely batch, fed-batch, and CSTR. Batch systems have the advantage of operating at υ m a x (objective 2) since the substrate (ammonium) is consistently available in the bulk solution. Moreover, complete conversion can be achieved (objective 3). To maintain high production rates, draining and refilling of the batch system is required soon after complete consumption of ammonium. This is also necessary to maintain the health (maintenance energy) of the microbial community. If the reactor is devoid of ammonium for an extended period, high death rates are to be expected. Therefore, control systems able to detect ammonium extinction and quickly drain-and-replace the medium (or add additional ammonium) are central to batch nitrification units.
Since the hydroxide dosing rates are an inferential measurement of the ammonium oxidation rates, ammonium extinction will be accompanied by a cessation in hydroxide dosing. This provides an online indication of ammonium extinction and enables the controller to take immediate action. This is similar to an approach used in wastewater treatment where a reduction in the rate of change of pH is used to infer ammonium extinction [25,26,27]. In these systems, however, the pH is not controlled at a set point and oscillates due to alternating nitrification/denitrification processes. Relatively low ammonium concentrations are dealt with (a few mM) and hence changes in pH are sufficiently small as not to affect microbial performance. The target wastewaters (such as digestate), however, contain high ammonium concentrations which would result in critically low pH levels well before complete ammonium conversion. Therefore, the pH must be controlled to achieve efficient nitrification. The pH thus remains constant, and the hydroxide dosing rates (resulting from the pH control system) must provide information regarding the ammonium oxidation kinetics instead of changes in the measured pH values.
This control hypothesis was investigated in run 3. Each of the three systems was charged with 4 mM ammonium and the pH was controlled at 6.5 via feedback-PI-control. The control algorithm is given in the Sequential-Function-Chart shown in Figure 2. The degree of reduction in the hydroxide dosing rate (indication of ammonium extinction) was determined by comparing the current dosing rate (average over the past 3 h to reduce noise) to the maximum dosing rate (maximum of all past dosing rates), as shown in Figure 2. Ammonium extinction was inferred from a 50% or larger reduction in the current dosing rate compared to the maximum dosing rate, which upon detection, actuated additional ammonium dosing.
The results from run 3 are given in Figure 3 for each of the three setups. Sharp declines in the hydroxide dosing rates (blue lines) are observed at ammonium extinction, which is confirmed by ammonium concentration measurements (red dots). Vertical green dashed lines indicate ammonium dosing instances, which were actuated when a 50% reduction in the ammonium dosing rates occurred. Fast recovery (increase in the hydroxide dosing rates) is observed after the ammonium dosing instances. Note that the dosing rates are running averages over the past 3 h (six points), which was required to prevent false extinction readings resulting from experimental noise. This however caused ammonium dosing to occur in succession since the running average of the dosing rates took longer to increase (recover) than the immediate dosing rates. The immediate dosing rates dropped to zero soon after ammonium extinction and returned to their original values equally soon after additional ammonium was dosed.
Maximum nitrification rates were maintained, and complete conversion was achieved in the batch setup. Controller adaptability (objective 4) is not applicable since ammonium is constantly available in the liquid and thus variations in microbial activity do not affect controller performance. Although all objectives were satisfied, drawbacks to the batch setup exist. One such drawback is a potential false alarm of ammonium extinction. For example, if a drop in temperature occurred such that a 50% reduction in the nitrification rates resulted, the controller would mistake this as ammonium extinction event. If large variations in microbial activity are expected, the control strategy can be modified to guard against this by comparing the current dosing rate (which is the average over a 3-h window) against a longer running average (such as over a 12-h window), instead of comparing the current dosing rate to the maxing dosing rate over the whole timespan. Inferring ammonium extinction from a reduction in the more-recent dosing rate, compared to all past dosing rates, will prevent false ammonium extinction readings if nitrification rates decrease relatively slowly.

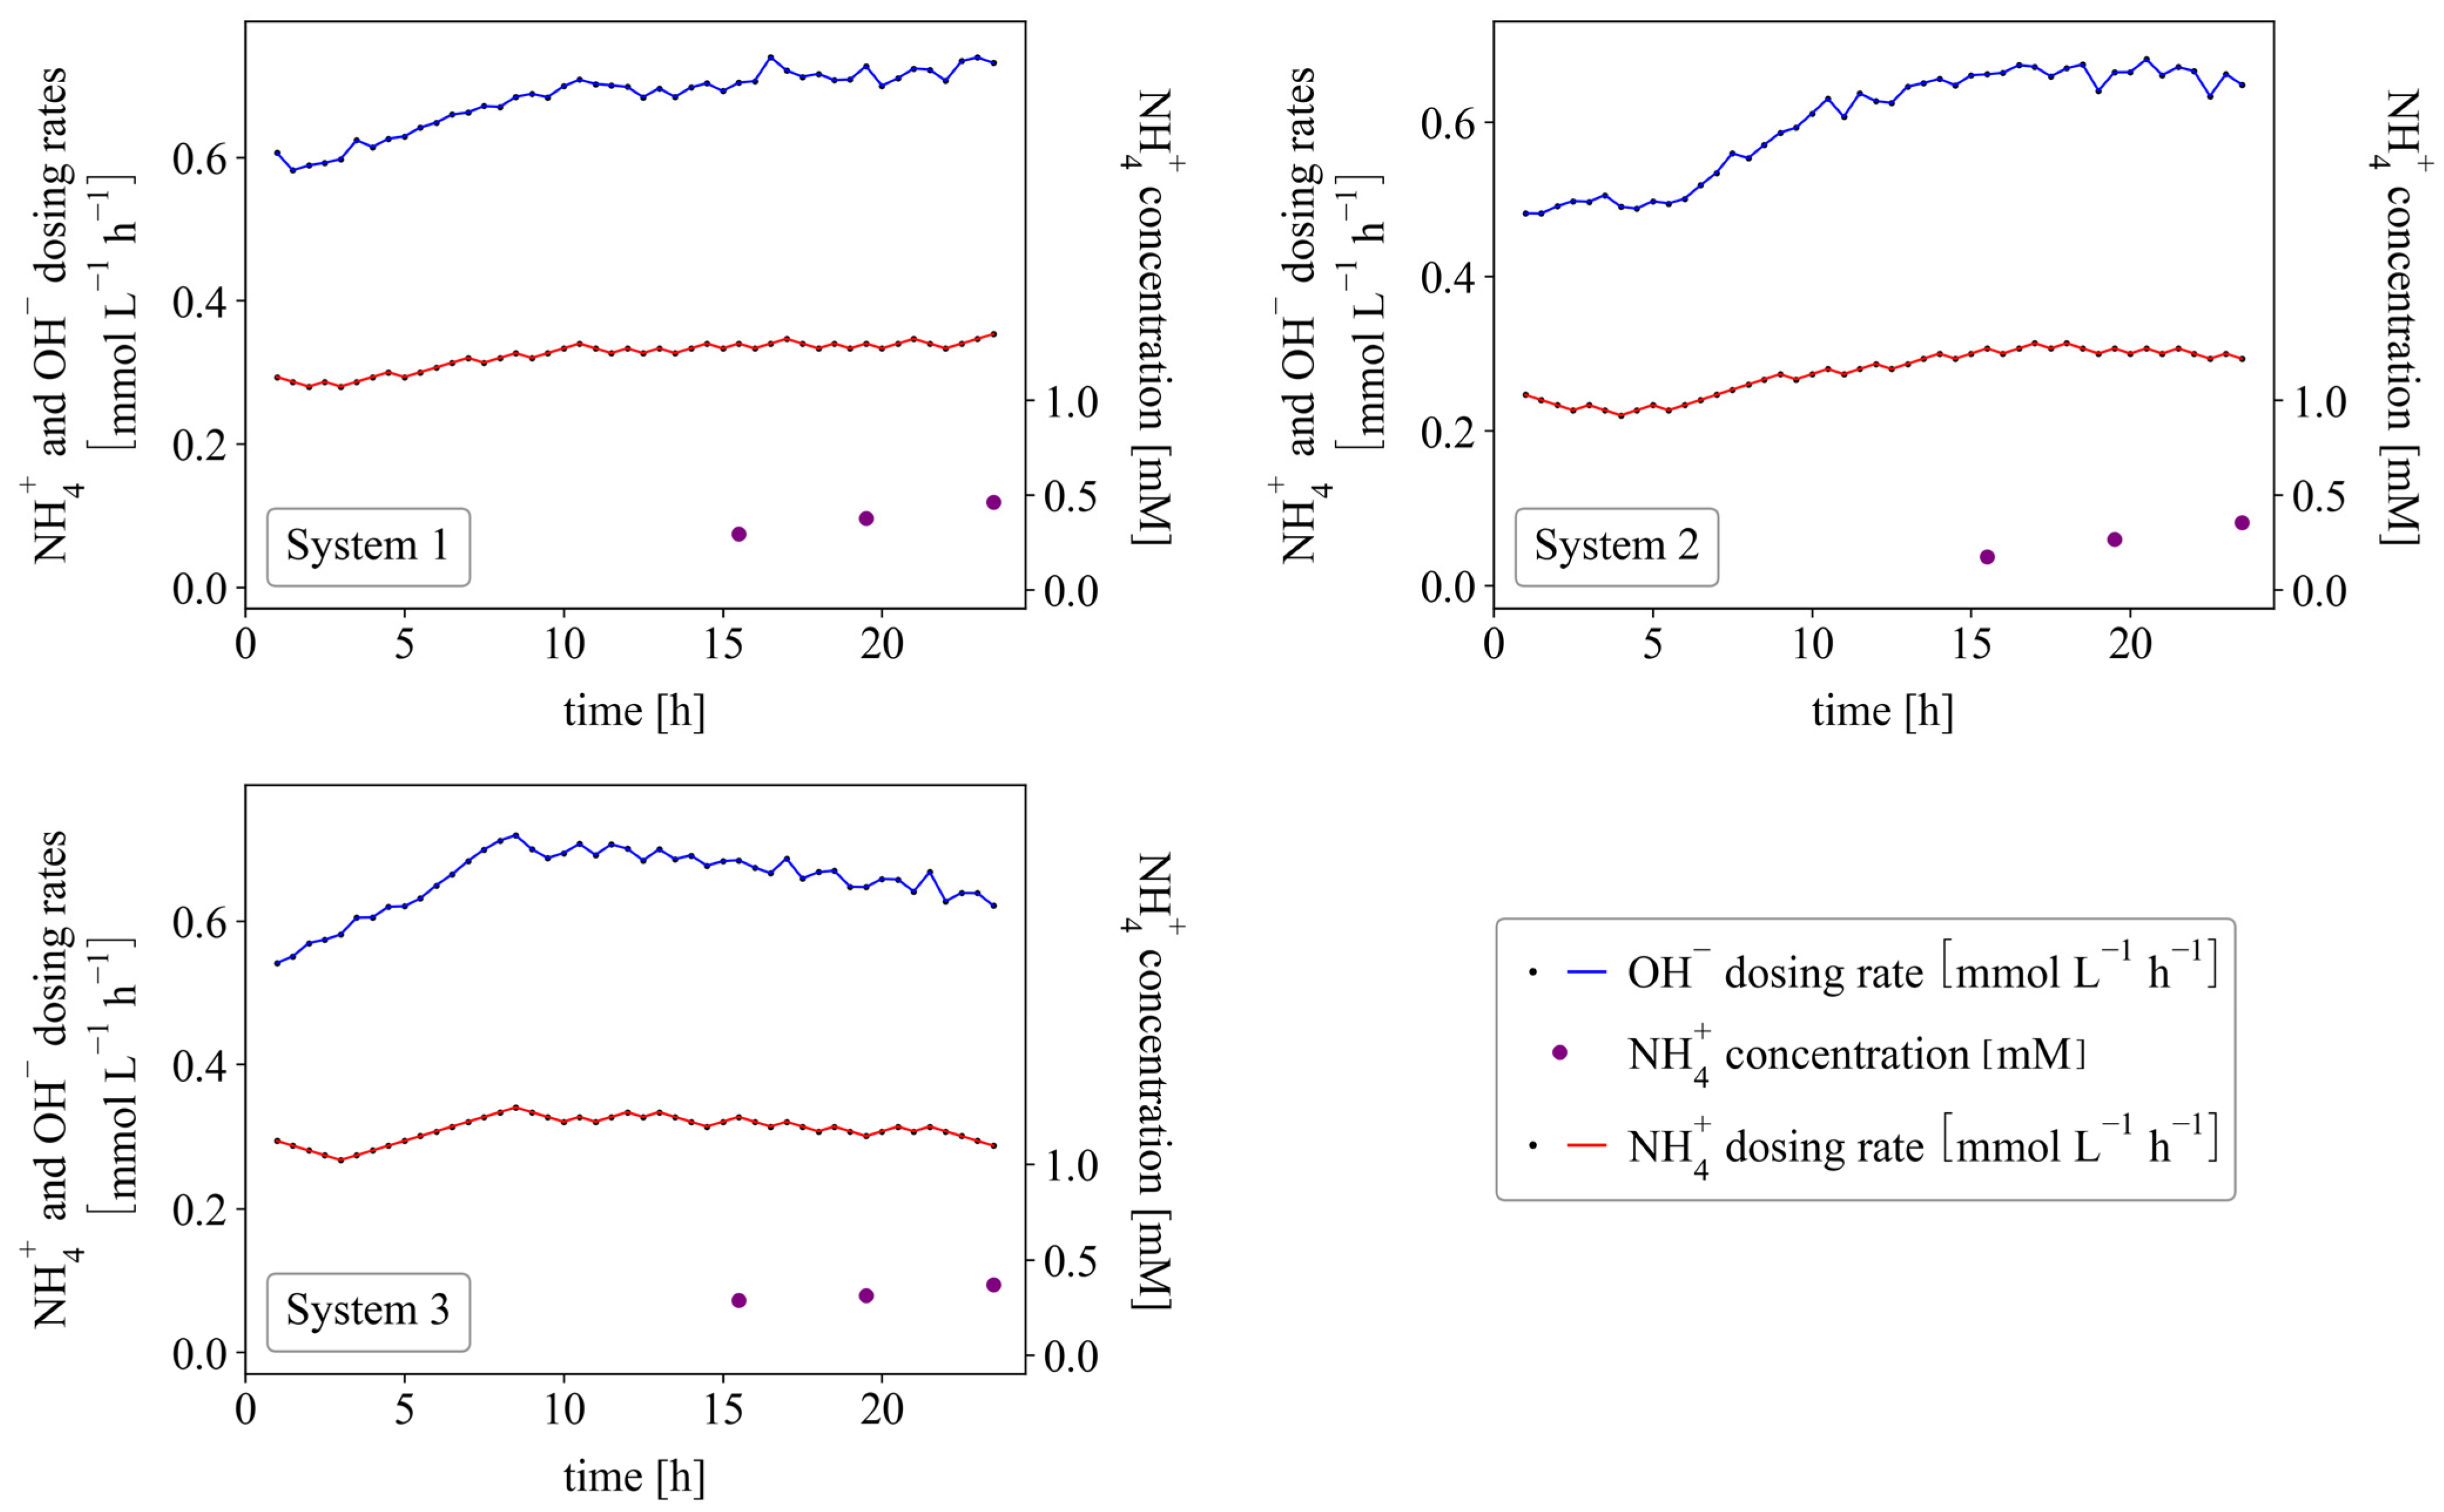
3.3. Fed-Batch Systems

Although the batch control system satisfied all the objectives laid out in Section 1, other reactor configurations may be desired based on production specifications and drawbacks associated with batch systems, such as substrate inhibition [28]. Thus, a control algorithm was designed for fed-batch systems next. In Section 3.1 (runs 1 and 2), a fed-batch system was employed where no ammonium was charged to the bulk medium and instead fed at a constant rate. Although complete conversion was achieved, these rates were below the maximum microbial ammonium oxidation rates ( υ m a x ). To meet objective 2 (which is to operate at υ m a x ), a control strategy is required which feeds ammonium at υ m a x under conditions in which υ m a x varies (objective 4 of adaptability). To understand the mechanism of such a control strategy, consider Figure 4 which plots the ammonium dosing rates ( D N H 4 + ) against the corresponding hydroxide dosing rates ( D O H ) required to control the pH. The ‘kink’ in the curve is the point at which the ammonium dosing rate equals υ m a x . Left of this point, ammonium is fed at a slower rate than υ m a x and thus the hydroxide dosing rate is two times the ammonium feed rate (Equation (2)), since all ammonium is consumed. To the right of this point, ammonium is fed at a faster rate than the bacteria can consume it. Under these conditions, ammonium is still oxidized at υ m a x and the hydroxide dosing rate remains constant at 2 υ m a x , but excess ammonium is dosed which accumulates in solution. Therefore, if the controller doses an arbitrary amount of ammonium, the resulting hydroxide dosing rate provides information regarding the region of operation (either to the left or right of the targeting operating point). Specifically, if D O H / D N H 4 + < 2   , the ammonium dosing rate is too large and must be reduced (operation is to the right of the target operating point). Alternatively, if D O H / D N H 4 + = 2   , ammonium dosing is less than or equal to υ m a x . In the latter case, no information exists regarding how much lower the ammonium dosing rate is than υ m a x and thus ammonium dosing should be increased to prevent drifting away from the target operating point. This control strategy is conveyed in Figure 5, in which the ammonium dosing rates are adjusted incrementally based on the operating regime. Note that a specification of D O H / D N H 4 + < 1.9 is employed instead of D O H / D N H 4 + < 2   . This is required to account for process errors, such as pump calibrations or dosing solution concentrations. If, for example, this specified constant is larger than the actual value (if 2.1 was specified, when the actual value is 2), the controller would continue to decrease the ammonium dosing rates (resulting in a runaway situation) until the ammonium dosing rates equal zero. Therefore, to safeguard against this, the specified constant should be slightly below the calibrated value to allow for errors. Operation will thus occur slightly to the right of the target operating point in Figure 4. This will result in a slow accumulation of ammonium in solution, but it can be minimized through accurate calibration.
Run 4 was conducted to test this control strategy in which the control algorithm shown in Figure 5 was employed in a fed-batch system with zero ammonium initially. An arbitrary amount of ammonium was dosed by the controller to “kick-start” the algorithm. The results are shown in Figure 6 for each of the three systems. It can be seen that the ammonium dosing rates (red lines) “follow” the hydroxide dosing rates (blue lines). The slow accumulation of ammonium in solution occurred, indicating that operation was maintained slightly to the right of the “Target operating point” shown in Figure 4 (ammonium dosing was slightly higher than υ m a x ). The cumulative amounts of ammonium dosed per litre solution (not shown) were around 10 times higher than the ammonium concentrations in solution (thus, around 90% conversion was achieved). These results show that nitrification can be accomplished at maximum production rates with 90% conversion under adaptable control. Thus, all objectives were satisfied. However, the accumulation of ammonium may become significant if the solution is not replaced regularly. To address this problem, the same control strategy was employed in a CSTR setup.

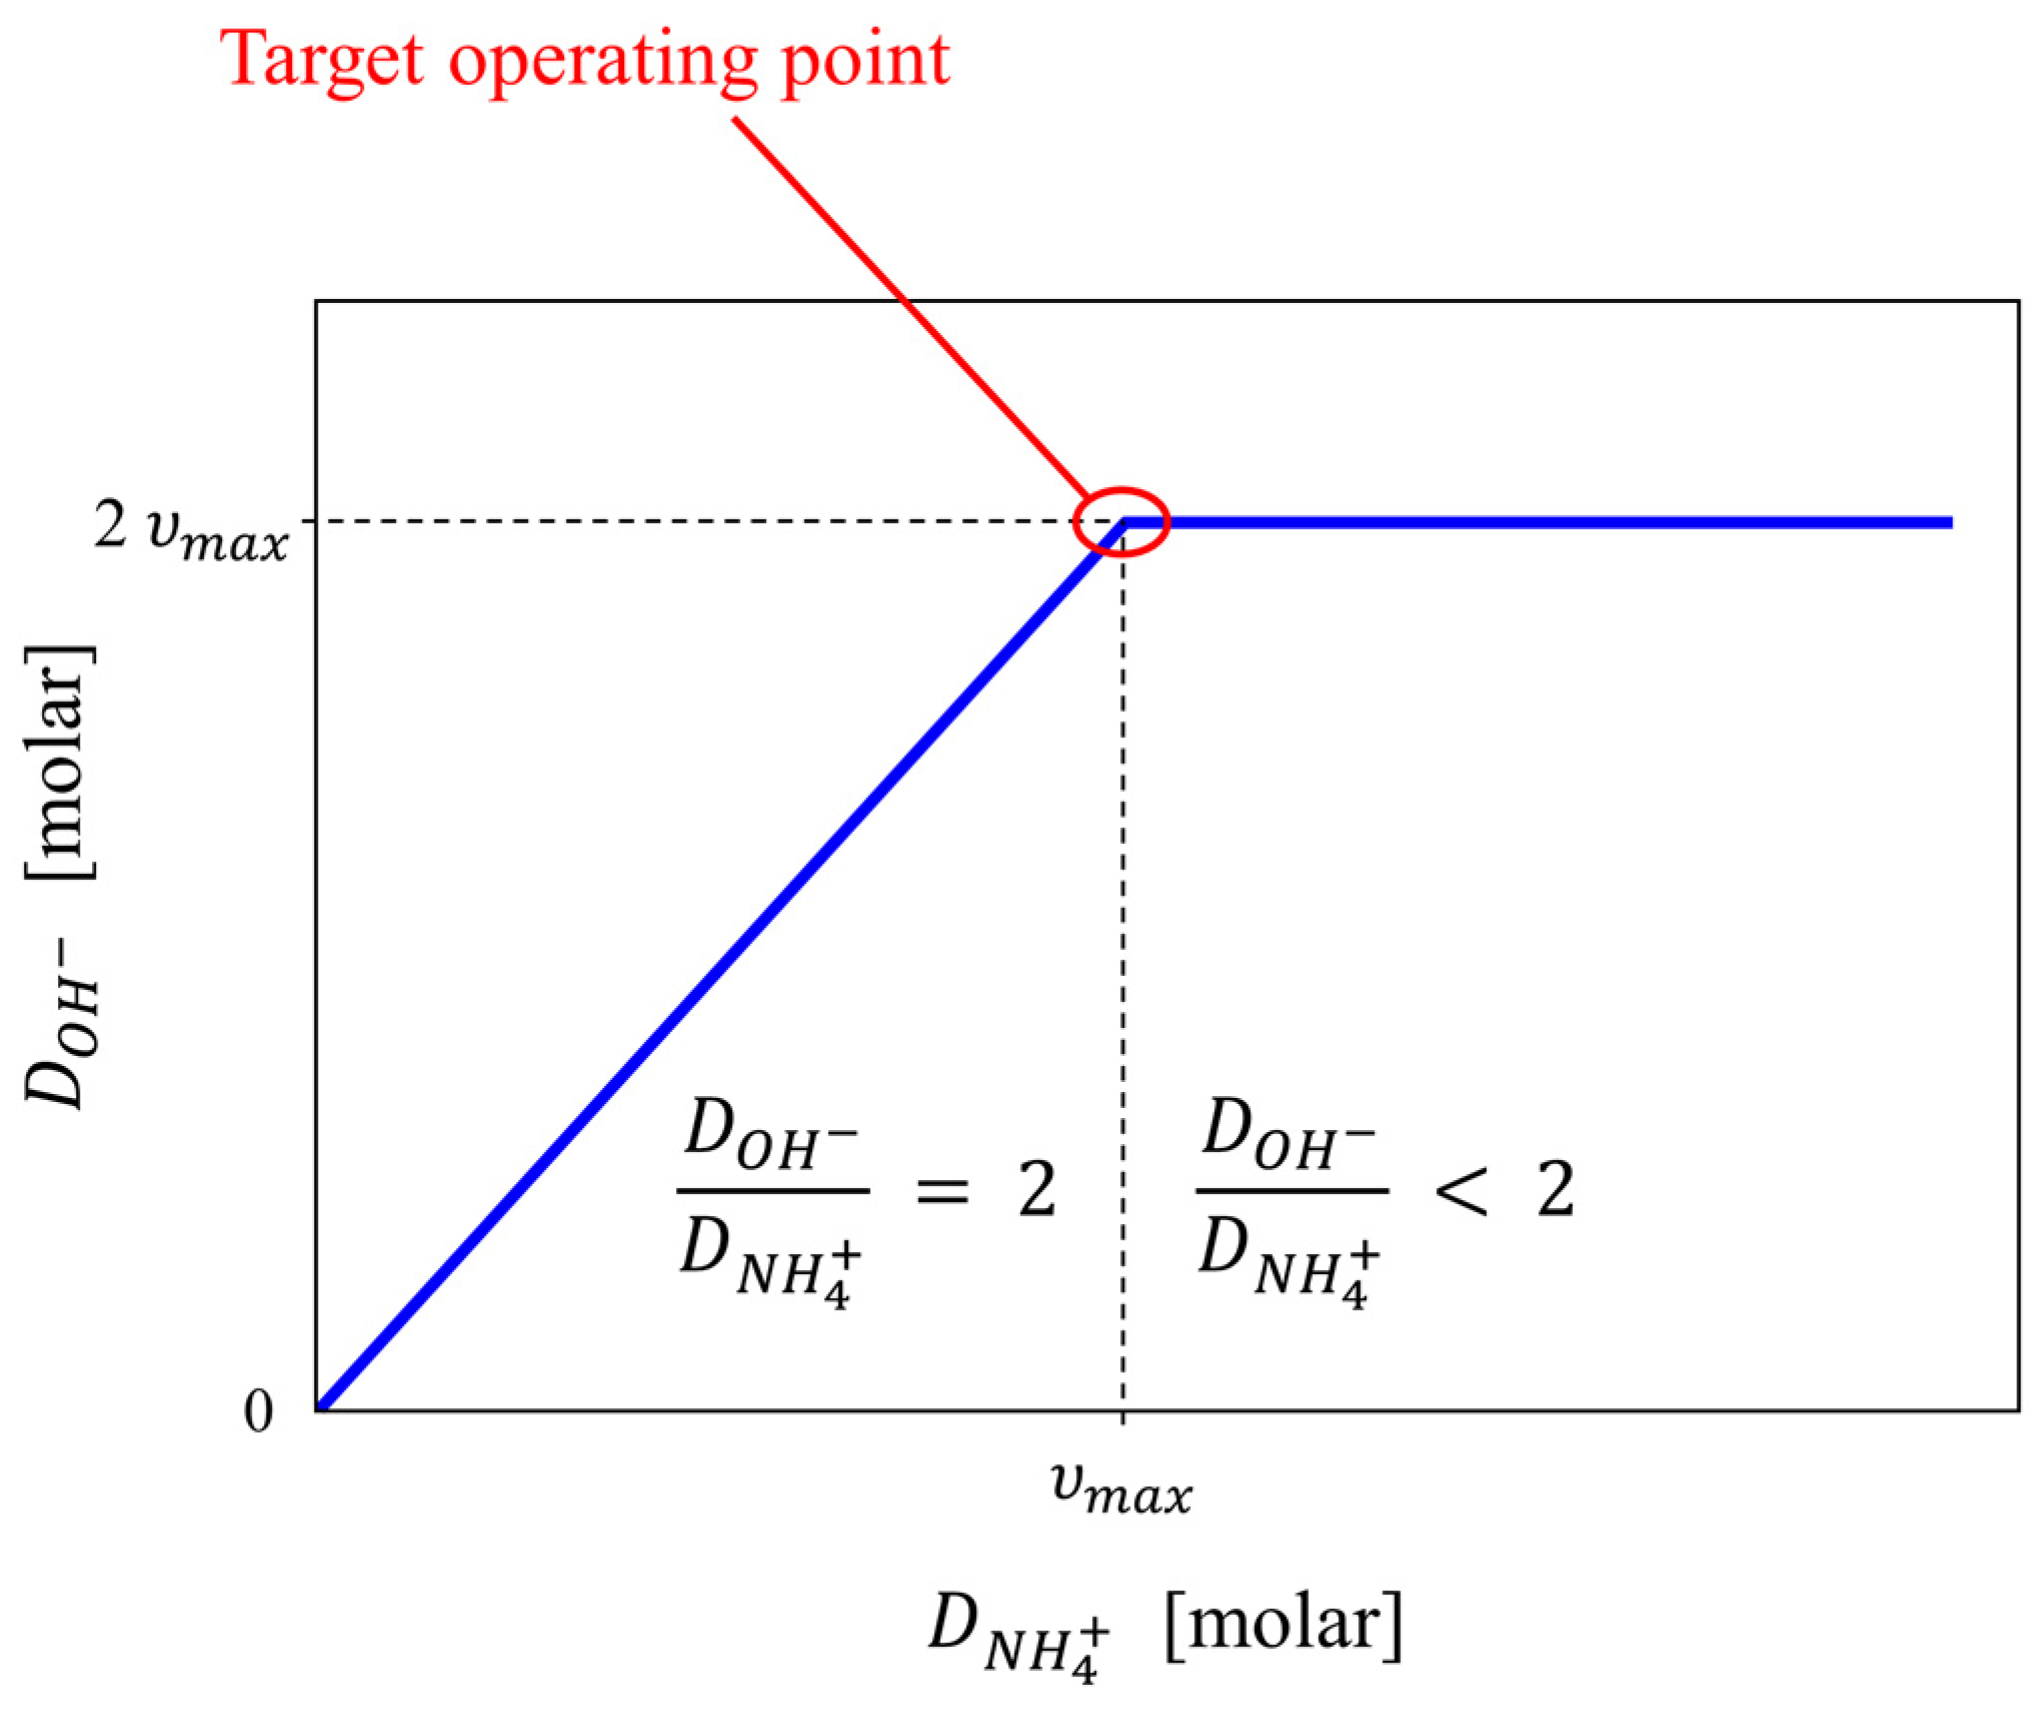
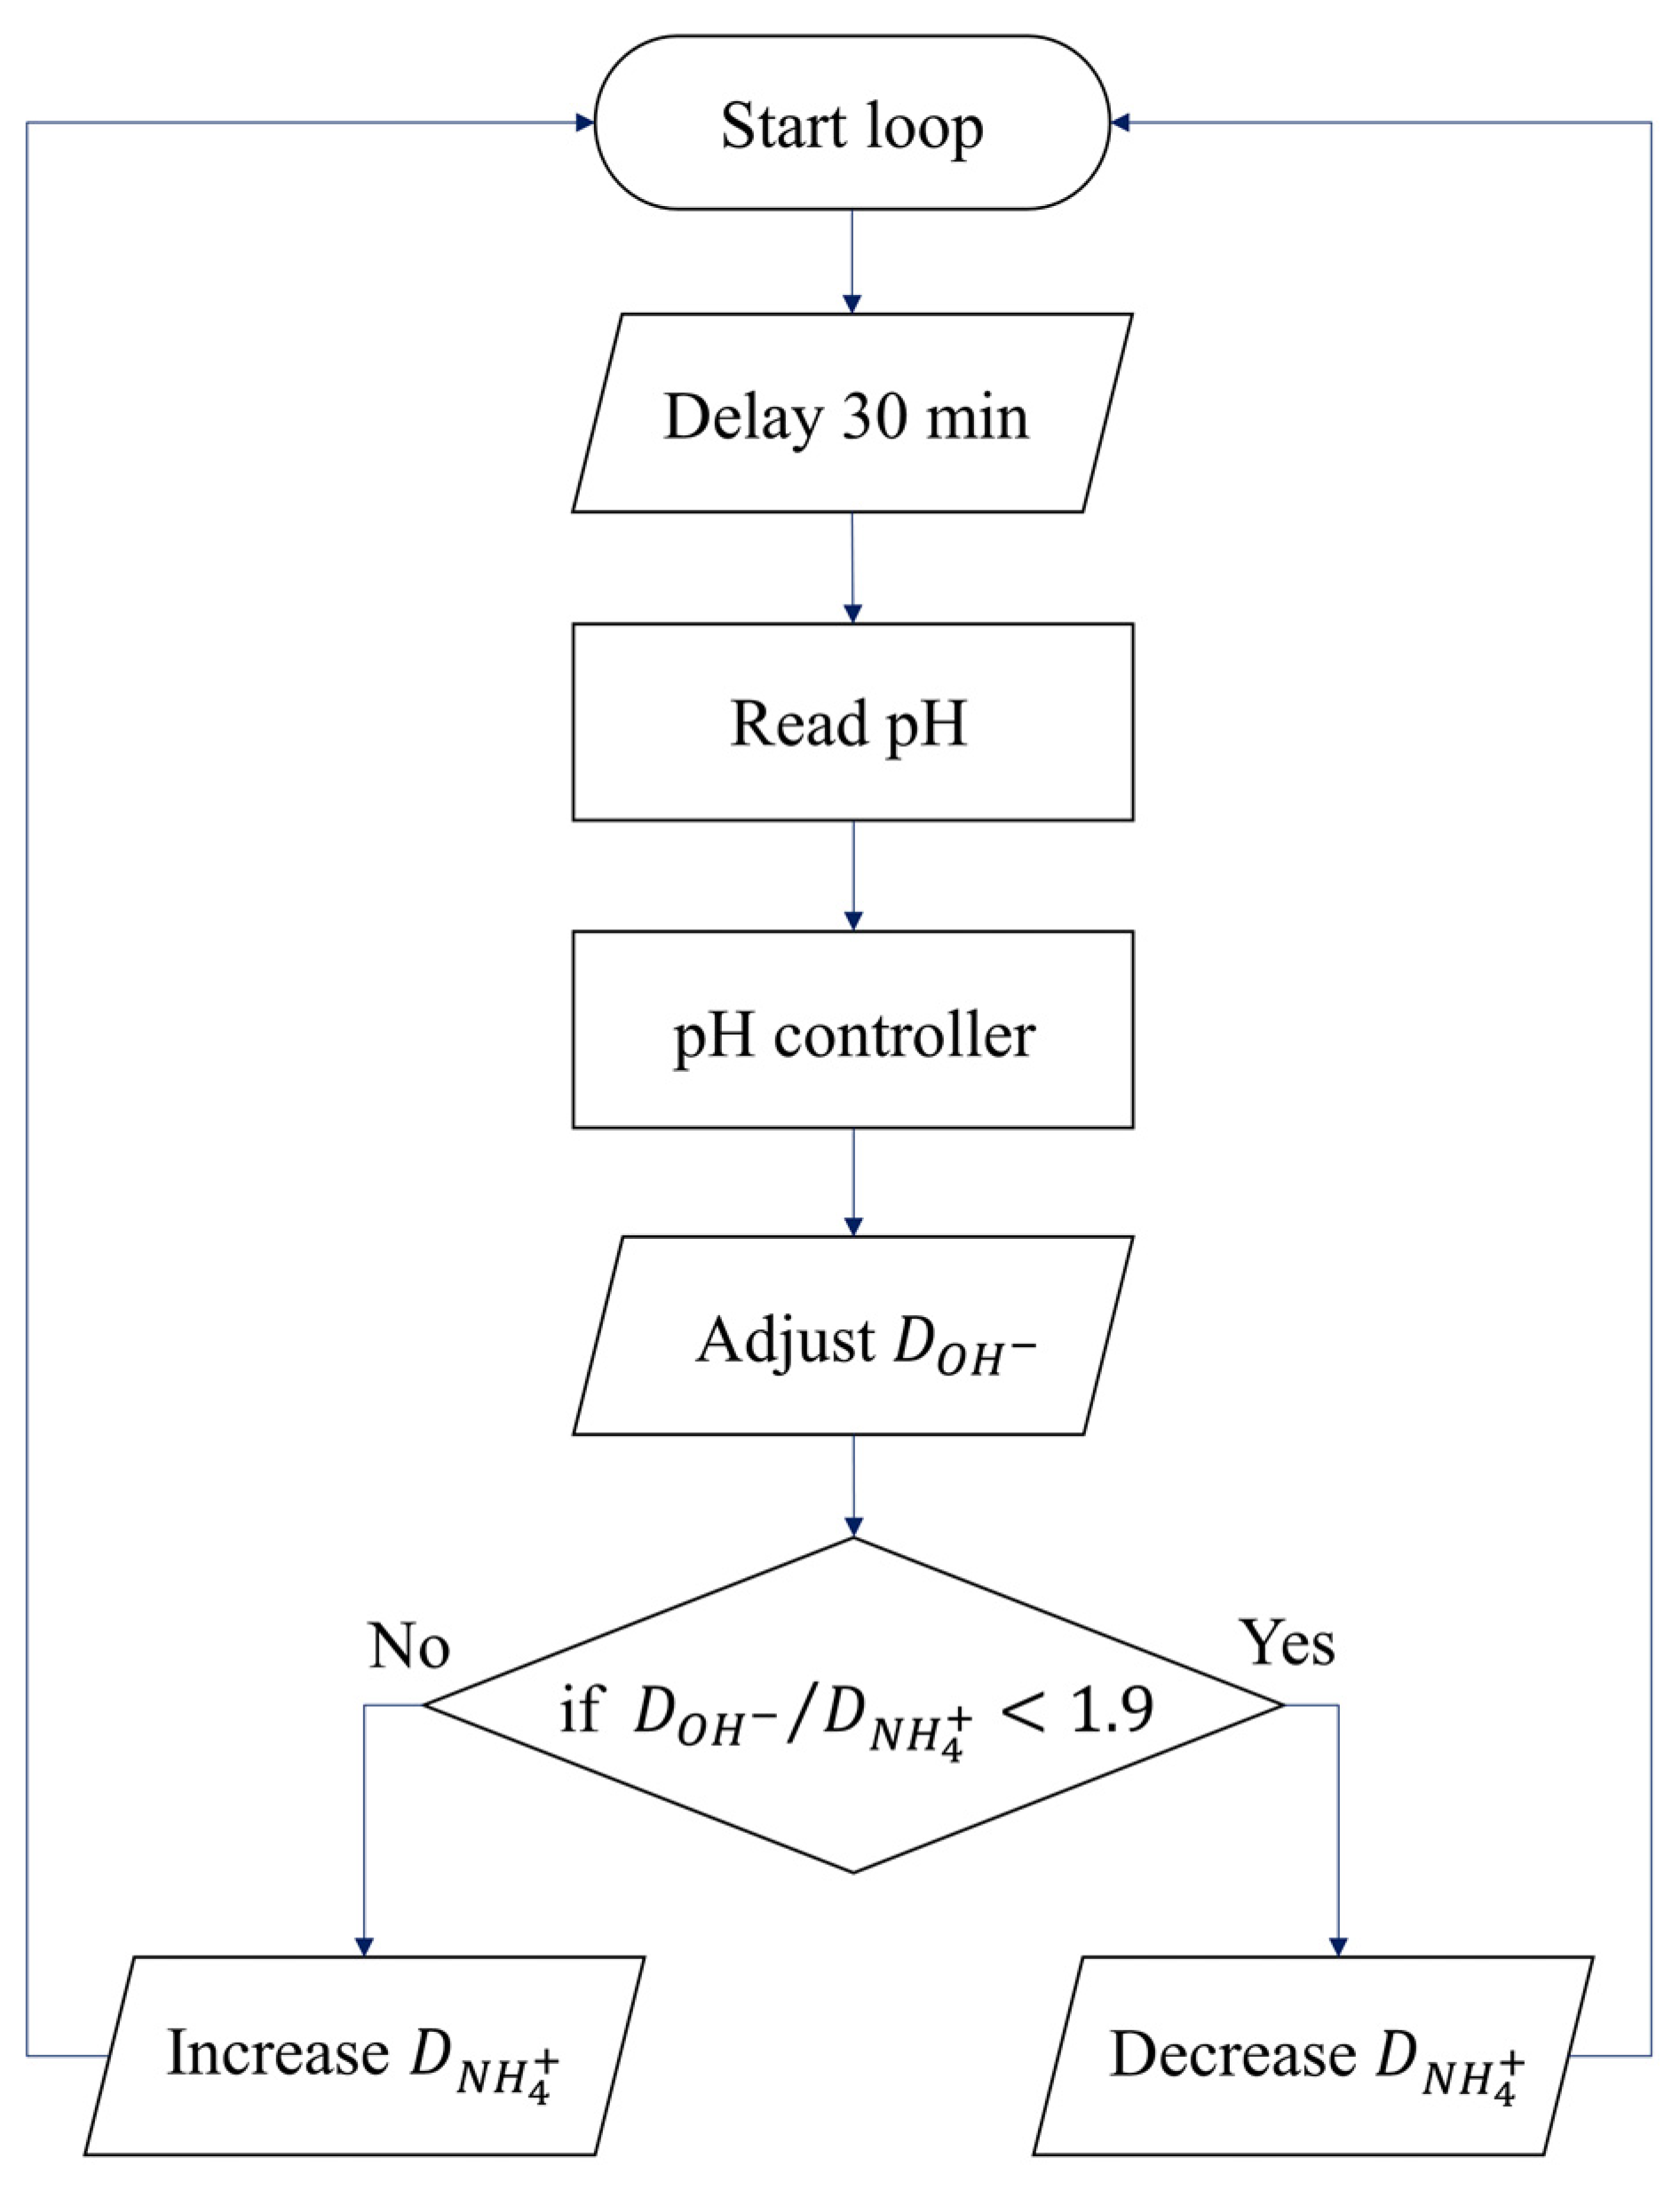
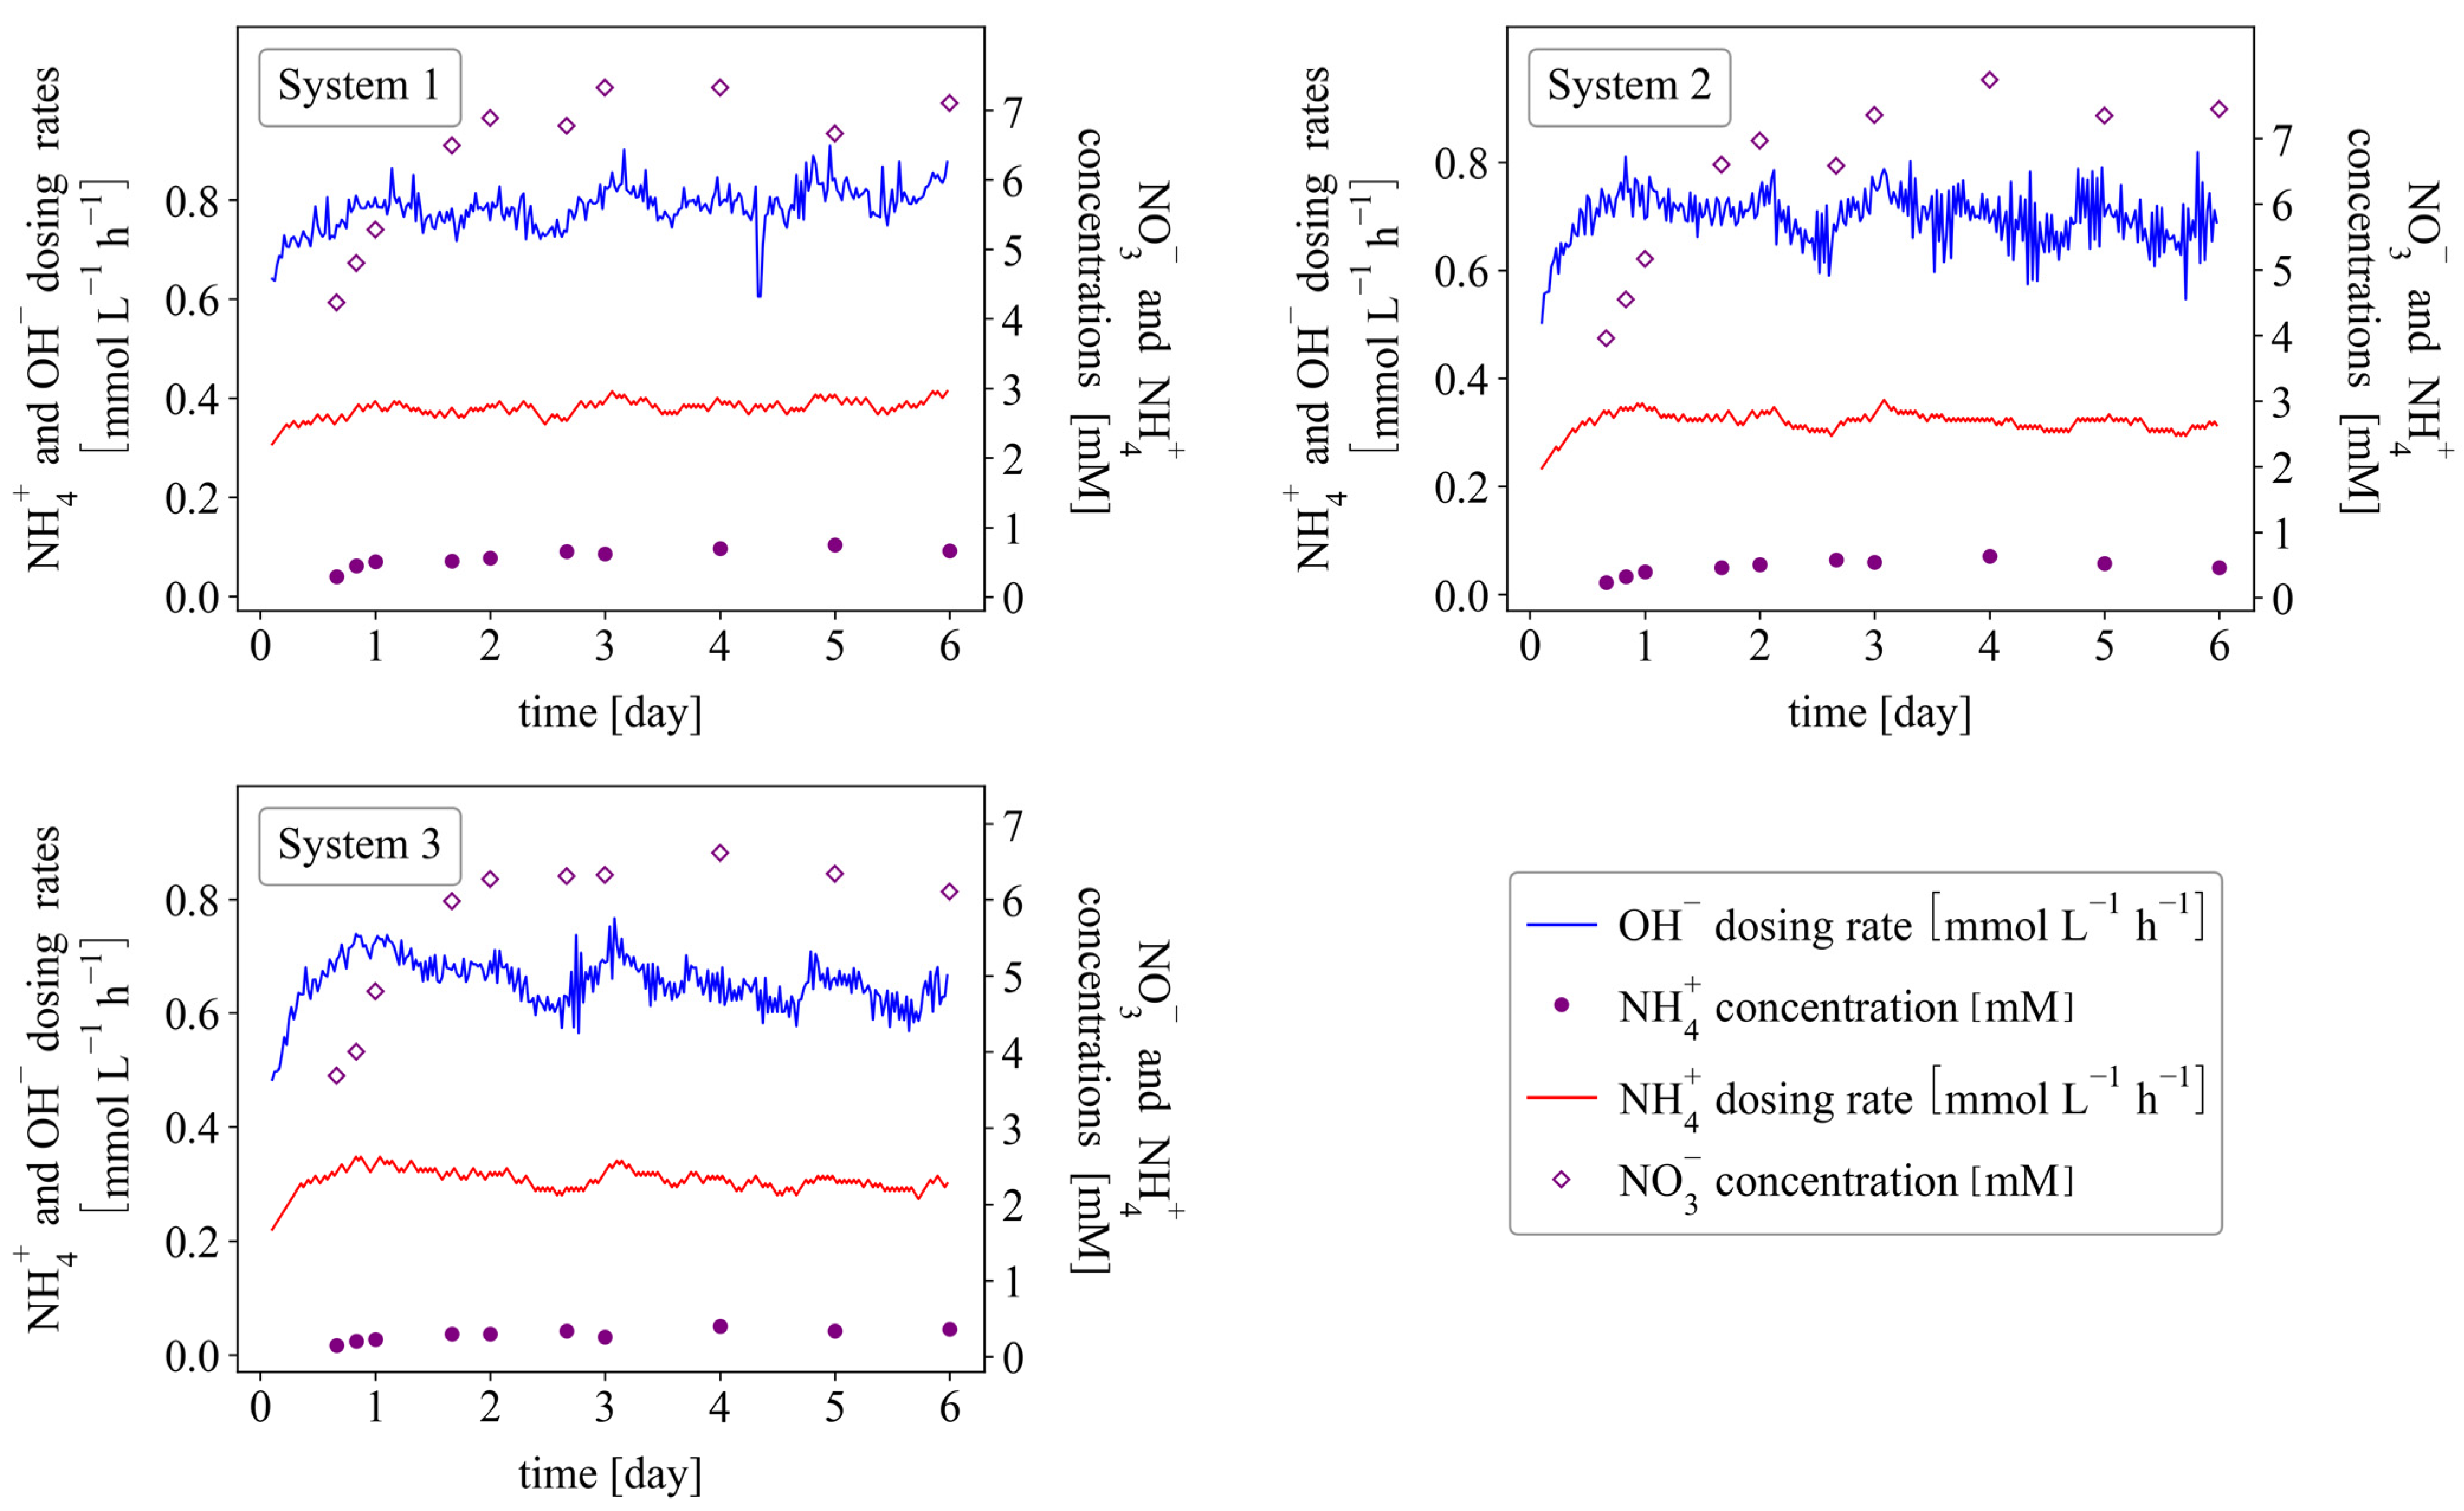
3.4. Continuous Systems

To eliminate ammonium accumulation, a dilution rate of 1 day–1 was employed (using deionized water), thus converting the fed-batch reactor into a CSTR. Run 5 was performed to test the control algorithm presented in Figure 5 in the CSTR. The results are shown in Figure 7, reported in the same fashion as in Figure 6 but including the nitrate concentrations in the reactor/effluent (measured via analysis of liquid samples). Ammonium concentrations stabilized at values below 1 mM and nitrate concentrations at around 7 mM. This corresponded to a conversion of 93% (±1%). The control algorithm performed well to consistently feed ammonium at just above υ m a x under varying υ m a x conditions (adaptable control).
The ammonium-to-nitrate ratio in solution has great agricultural significance and an optimum ratio typically exists for each plant species [29]. This ratio is often around one third molar, thus requiring a 75% conversion of ammonium to nitrate [30]. As such, if a higher ammonium-to-nitrate ratio is desired, operation should occur further to the right of the “Target operating point” shown in Figure 4. This can be accomplished by decreasing the constant in the “if statement” of Figure 5 (currently equal to 1.9).
The CSTR setup requires knowledge of the ammonium concentration in the wastewater. If this concentration is unknown or varies during production, the batch control scheme may be a better alternative. The solution in the batch system can be drained and replaced immediately upon ammonium extinction, thus realizing a semi-continuous process.

4. Conclusions

The objectives specified in Section 1, namely affordability, operation at υ m a x , high conversion, and controller adaptability, were satisfied using the presented control schemes in batch, fed-batch, and CSTR units. Although all the objectives were satisfied in all three reactor configurations, the CSTR system appeared to be the most attractive method since the seamless production of a high nitrate (93%) liquid-fertilizer was realized. Drawbacks of each setup have been discussed and thus the choice of system will depend on process specifications. The presented control algorithms lend viability to the use of high-ammonium wastewaters as liquid-fertilizers in hydroponic systems, thus providing an encouraging alternative to synthetic fertilizers.

Author Contributions

Conceptualization, I.L.v.R. and W.N.; methodology, I.L.v.R.; software, I.L.v.R.; formal analysis, I.L.v.R. and W.N.; investigation, I.L.v.R.; resources, W.N.; data curation, I.L.v.R. and W.N.; writing—original draft preparation, I.L.v.R.; writing—review and editing, I.L.v.R., W.N. and H.G.B.; visualization, I.L.v.R.; supervision, W.N.; project administration, I.L.v.R., W.N. and H.G.B.; funding acquisition, W.N. and H.G.B. All authors have read and agreed to the published version of the manuscript.

Funding

This research was partly funded by The National Research Foundation of South Africa, grant number: MND200615532008.

Institutional Review Board Statement

Not applicable.

Informed Consent Statement

Not applicable.

Data Availability Statement

The data presented in this study are openly available in the University of Pretoria Research Data Repository at 10.25403/UPresearchdata.17276768.

Conflicts of Interest

The authors declare no conflict of interest.

References

  1. Erisman, J.W.; Sutton, M.A.; Galloway, J.; Klimont, Z.; Winiwarter, W. How a century of ammonia synthesis changed the world. Nat. Geosci. 2008, 1, 636–639. [Google Scholar] [CrossRef]
  2. Kanter, D.R.; Bartolini, F.; Kugelberg, S.; Leip, A.; Oenema, O.; Uwizeye, A. Nitrogen pollution policy beyond the farm. In Nature Food; Springer Nature: Berlin/Heidelberg, Germany, 2020. [Google Scholar] [CrossRef] [Green Version]
  3. Castellar, J.A.C.; Formosa, J.; Fernández, A.I.; Jové, P.; Bosch, M.G.; Morató, J.; Arias, C.A. Cork as a sustainable carbon source for nature-based solutions treating hydroponic wastewaters–Preliminary batch studies. Sci. Total. Environ. 2019, 650, 267–276. [Google Scholar] [CrossRef]
  4. Gagnon, V.; Maltais-Landry, G.; Puigagut, J.; Chazarenc, F.; Brisson, J. Treatment of hydroponics wastewater using constructed wetlands in winter conditions. Water Air Soil Pollut. 2010, 212, 483–490. [Google Scholar] [CrossRef]
  5. Prystay, W.; Lo, K.V. Treatment of greenhouse wastewater using constructed wetlands. J. Environ. Sci. Health Part. B Pestic. Food Contam. Agric. Wastes 2001, 36, 341–353. [Google Scholar] [CrossRef]
  6. Rufí-Salís, M.; Calvo, M.J.; Petit-Boix, A.; Villalba, G.; Gabarrell, X. Exploring nutrient recovery from hydroponics in urban agriculture: An environmental assessment. Resour. Conserv. Recycl. 2020, 155. [Google Scholar] [CrossRef]
  7. Saxena, P.; Bassi, A. Removal of nutrients from hydroponic greenhouse effluent by alkali precipitation and algae cultivation method. J. Chem. Technol. Biotechnol. 2013, 88, 858–863. [Google Scholar] [CrossRef]
  8. Chan-Pacheco, C.R.; Valenzuela, E.I.; Cervantes, F.J.; Quijano, G. Novel biotechnologies for nitrogen removal and their coupling with gas emissions abatement in wastewater treatment facilities. In Science of the Total Environment; Elsevier, B.V.: Amsterdam, The Netherlands, 2021. [Google Scholar] [CrossRef]
  9. Ronga, D.; Setti, L.; Salvarani, C.; De Leo, R.; Bedin, E.; Pulvirenti, A.; Francia, E. Effects of solid and liquid digestate for hydroponic baby leaf lettuce (Lactuca sativa L.) cultivation. Sci. Hortic. 2019, 244, 172–181. [Google Scholar] [CrossRef]
  10. Möller, K.; Müller, T. Effects of anaerobic digestion on digestate nutrient availability and crop growth: A review. Eng. Life Sci. 2012, 12, 242–257. [Google Scholar] [CrossRef]
  11. Hachiya, T.; Sakakibara, H. Interactions between nitrate and ammonium in their uptake, allocation, assimilation, and signaling in plants. J. Exp. Bot. 2017, 68, 2501–2512. [Google Scholar] [CrossRef] [PubMed]
  12. Bergstrand, K.J.; Asp, H.; Hultberg, M. Utilizing anaerobic digestates as nutrient solutions in hydroponic production systems. Sustainability 2020, 12, 10076. [Google Scholar] [CrossRef]
  13. Neal, J.; Wilkie, A.C. Anaerobic Digester Effluent as Fertilizer for Hydroponically Grown Tomatoes. J. Undergrad. Res. 2014, 15, 1–5. [Google Scholar]
  14. Stoknes, K.; Scholwin, F.; Krzesiński, W.; Wojciechowska, E.; Jasińska, A. Efficiency of a novel “Food to waste to food” system including anaerobic digestion of food waste and cultivation of vegetables on digestate in a bubble-insulated greenhouse. Waste Manag. 2016, 56, 466–476. [Google Scholar] [CrossRef] [PubMed]
  15. Grand View Research. Hydroponics Market Size, Share & Trends Analysis Report by Type (Aggregate Systems, Liquid Systems), by Crops (Tomatoes, Lettuce, Peppers, Cucumbers, Herbs), by Region, and Segment Forecasts 2019–2025. Available online: https://www.grandviewresearch.com/industry-analysis/hydroponics-market (accessed on 17 October 2021).
  16. Kumar, R.R.; Cho, J.Y. Reuse of hydroponic waste solution. Environ. Sci. Pollut. Res. 2014, 21, 9569–9577. [Google Scholar] [CrossRef]
  17. Pelayo, L.O.; Hultberg, M.; Bergstrand, K.J.; Larsson-Jönsson, H.; Caspersen, S.; Asp, H. Biogas Digestate in Vegetable Hydroponic Production: pH Dynamics and pH Management by Controlled Nitrification. Waste Biomass Valorization 2021, 12, 123–133. [Google Scholar] [CrossRef] [Green Version]
  18. Pitts, M.; Stutte, G. Computer model of hydroponics nutrient solution pH control using ammonium. Life Support Biosph. Sci. Int. J. Earth Space 1999, 6, 73–85. [Google Scholar]
  19. Hoagland, D.R.; Arnon, D.I. The Water-Culture Method for Growing Plants without Soil; University of California, College of Agriculture, Agricultural Experiment Station: Berkeley, CA, USA, 1938. [Google Scholar]
  20. Botheju, D.; Svalheim, O.; Bakke, R. Digestate Nitrification for Nutrient Recovery. Open Waste Manag. J. 2010, 3, 1–12. [Google Scholar] [CrossRef]
  21. Edgar, M.; Levi, A.; Percy, C.; Gaddafi, L. Analysis of nitrifying microbial community for organic hydroponics. Afr. J. Microbiol. Res. 2018, 12, 1–8. [Google Scholar] [CrossRef] [Green Version]
  22. Quinlan, A.V. Prediction of the optimum pH for ammonia-N oxidation by nitrosomonas Europaea in well-aerated natural and domestic-waste waters. Water Res. 1984, 18, 561–566. [Google Scholar] [CrossRef]
  23. Madigan, M.T.; Martinko, J.M.; Parker, J. Brock Biology of Microorganisms, 10th ed.; Pearson Education, Inc.: Upper Saddle River, NJ, USA, 2003; p. 1019. [Google Scholar]
  24. Norton, J.; Ouyang, Y. Controls and adaptive management of nitrification in agricultural soils. Front. Microbiol. 2019, 10, 1931. [Google Scholar] [CrossRef] [Green Version]
  25. Andreottola, G.; Foladori, P.; Ragazzi, M. On-line control of a SBR system for nitrogen removal from industrial wastewater. Water Sci. Technol. 2001, 43, 93–100. [Google Scholar] [CrossRef]
  26. Hajsardar, M.; Borghei, S.M.; Hassani, A.H.; Takdastan, A. Simultaneous ammonium and nitrate removal by a modified intermittently aerated sequencing batch reactor (SBR) with multiple filling events. Pol. J. Chem. Technol. 2016, 18, 72–80. [Google Scholar] [CrossRef] [Green Version]
  27. Kim, H.; Hao, O.J. pH and Oxidation-Reduction Potential Control Strategy for Optimization of Nitrogen Removal in an Alternating Aerobic-Anoxic System All use subject to JSTOR Terms and Conditions pH and Control Nitrogen Strategy Removal Potential of for Optimization in an A. Water Environ. Res. 2001, 73, 95–102. [Google Scholar] [CrossRef]
  28. Kim, D.J.; Lee, D.I.; Keller, J. Effect of temperature and free ammonia on nitrification and nitrite accumulation in landfill leachate and analysis of its nitrifying bacterial community by FISH. Bioresour. Technol. 2006, 97, 459–468. [Google Scholar] [CrossRef] [PubMed]
  29. Cytryn, E.; Levkovitch, I.; Negreanu, Y.; Dowd, S.; Frenk, S.; Silber, A. Impact of short-term acidification on nitrification and nitrifying bacterial community dynamics in soilless cultivation media. Appl. Environ. Microbiol. 2012, 78, 6576–6582. [Google Scholar] [CrossRef] [Green Version]
  30. Tabatabaei, S.; Fatemi, L.; Fallahi, E. Effect of ammonium: Nitrate ratio on yield, calcium concentration, and photosynthesis rate in strawberry. J. Plant. Nutr. 2006, 29, 1273–1285. [Google Scholar] [CrossRef]
Figure 1. Results from runs 1 and 2 in which ammonium was dosed in a fed-batch system at 0.56 and 3.92 mmol-N L–1 day–1, respectively. The pH was controlled at 6.5 via feedback-PI-control (independent of ammonium dosing). Shown are the measured nitrate concentrations in solution, and the cumulative amounts of hydroxide dosed to control the pH.
Fermentation 07 00319 g001
Figure 2. Sequential-Function-Chart of the batch control algorithm designed to infer ammonium extinction from a 50% reduction in the hydroxide dosing rate. The pH controller is a feedback-PI-controller. More specifically, hydroxide is constantly dosed to the system but the rate at which it is dosed is adjusted (increased/decreased) by the pH controller every 30 min. This adjustment is based on the error signal received by the controller (difference between the pH reading and the setpoint pH). Note that D O H , m a x is the maximum D O H value since the start of the run. To reduce experimental noise, a six-point running average of the dosing rates were used (average over 3 h) in the two “if” statements shown in the diamond boxes.
Fermentation 07 00319 g002
Figure 3. Results from run 3 in a batch setup. Ammonium extinction was inferred from a 50% reduction in the hydroxide dosing rates (6 point running average). This was accomplished with the control algorithm presented in Figure 2. The hydroxide dosing rates are shown as blue lines for each of the 3 systems. Ammonium dosing instances are shown as vertical green dashed-lines (which occurred upon a 50% reduction in the hydroxide dosing rate). Ammonium extinction was confirmed by measurement of the ammonium concentrations in solution (red dots). “Spot checks” were done for nitrite, of which none was measured (<0.001 mM).
Fermentation 07 00319 g003
Figure 4. Plot of the hydroxide dosing rates ( D O H ) required for pH control as a function of the ammonium dosing rates ( D N H 4 + ) . At lower ammonium dosing rates, which are below υ m a x , the hydroxide dosing rates are double the ammonium dosing rates (see Equations (1) and (2)) since all the ammonium dosed is consumed. When the ammonium dosing rates are higher than υ m a x , the hydroxide dosing rates remain constant at 2 υ m a x regardless of D N H 4 + .
Fermentation 07 00319 g004
Figure 5. Sequential function chart of the control algorithm used in the fed-batch system. Designed to operate slightly to the right of “Target operating point” shown in Figure 4, the ammonium dosing rate is decreased when it is larger than υ m a x and increased when its smaller than υ m a x . A constant of 1.9 is specified (instead of 2) to account for calibration errors as discussed in the text.
Fermentation 07 00319 g005
Figure 6. Results from the control strategy shown in Figure 5, employed in a fed-batch system. Hydroxide dosing rates are shown as blue lines and the ammonium dosing rates are show as red lines. The ammonium concentrations in solution were measured and shown as purple dots. “Spot checks” were done for nitrite of which none was measured (<0.001 mM).
Fermentation 07 00319 g006
Figure 7. Results from the control strategy shown in Figure 5 employed in a CSTR setup with a dilution rate of 1 day–1. Hydroxide dosing rates are shown as blue lines and the ammonium dosing rates are show as red lines. The ammonium and nitrate concentrations in solution were measured and are shown as purple dots and diamond markers, respectively.
Fermentation 07 00319 g007
Publisher’s Note: MDPI stays neutral with regard to jurisdictional claims in published maps and institutional affiliations.

