Article

Different Gene Expression Patterns of Hexose Transporter Genes Modulate Fermentation Performance of Four Saccharomyces cerevisiae Strains

1
Interdepartmental Centre for Research in Viticulture and Enology (CIRVE), University of Padova, Via XXVIII Aprile, 14-31015 Conegliano, Italy
2
Department of Agronomy Food Natural Resources Animals and Environment (DAFNAE), University of Padova, Viale dell’Università, 16-35020 Legnaro, Italy
*
Author to whom correspondence should be addressed.
These authors contributed equally to this work.
Fermentation 2021, 7(3), 164; https://doi.org/10.3390/fermentation7030164
Submission received: 5 August 2021 / Revised: 16 August 2021 / Accepted: 17 August 2021 / Published: 23 August 2021
(This article belongs to the Special Issue Yeast Biotechnology 5.0)

Abstract

:
In Saccharomyces cerevisiae, the fermentation rate and the ability to complete the sugar transformation process depend on the glucose and fructose transporter set-up. Hexose transport mainly occurs via facilitated diffusion carriers and these are encoded by the HXT gene family and GAL2. In addition, FSY1, coding a fructose/H+ symporter, was identified in some wine strains. This little-known transporter could be relevant in the last part of the fermentation process when fructose is the most abundant sugar. In this work, we investigated the gene expression of the hexose transporters during late fermentation phase, by means of qPCR. Four S. cerevisiae strains (P301.9, R31.3, R008, isolated from vineyard, and the commercial EC1118) were considered and the transporter gene expression levels were determined to evaluate how the strain gene expression pattern modulated the late fermentation process. The very low global gene expression and the poor fermentation performance of R008 suggested that the overall expression level is a determinant to obtain the total sugar consumption. Each strain showed a specific gene expression profile that was strongly variable. This led to rethinking the importance of the HXT3 gene that was previously considered to play a major role in sugar transport. In vineyard strains, other transporter genes, such as HXT6/7, HXT8, and FSY1, showed higher expression levels, and the resulting gene expression patterns properly supported the late fermentation process.

1. Introduction

In wine alcoholic fermentation, glucose and fructose present in grape must are co-fermented by yeasts to ethanol and carbon dioxide. Grape must usually contains equal or very similar amounts of both sugars [1]. Glucose is known to be the preferred carbon source for Saccharomyces cerevisiae. Although fructose is used concomitantly with glucose, the latter is the first sugar to be depleted from the medium during fermentation [2,3]. Consequently, fructose becomes the main sugar present during the late stages of alcoholic fermentation, and wine yeasts have to ferment this non-preferred sugar in the presence of large amounts of ethanol. The stress associated with these conditions, together with nutritional imbalances, may result in sluggish or stuck fermentations [1,4]. Moreover, it has been reported that stuck fermentations are frequently characterized by an unusually high fructose-to-glucose ratio [2]. The ability of wine yeasts to ferment fructose is therefore critically important for the maintenance of a high rate of fermentation at the end of the process and for fermentation of the must to dryness. The reasons for the difference between the glucose fermentation rate and the fructose fermentation rate are unclear, but one of the first steps in hexose metabolism is generally thought to be involved [1].
The first essential step towards the utilization of hexose sugars is their uptake by yeast cells. In yeast, hexose uptake may proceed through facilitated diffusion carriers and energy-dependent active proton-sugar symporters [3,5,6]. Hexose transport in S. cerevisiae occurs via facilitated diffusion carriers and these are encoded by several genes, including the HXT genes, the GAL2 gene encoding a galactose transporter, and SNF3 and RGT2 encoding two glucose sensors [5,6]. Among the 17 HXT genes in S. cerevisiae, only seven of them, Hxt1p–Hxt7p, are required for growth on glucose or fructose [3,7]. Although all the hexose transporters in S. cerevisiae can also transport fructose, glucose is the preferential sugar for Hxt carriers [3]. The catabolic hexose transporters exhibit different affinities for their substrates; furthermore, the expression of their corresponding genes is controlled by the glucose sensors, according to the availability of carbon sources [8]. Expression of the HXTs, all of which exhibit different levels of glucose affinity, is differentially regulated depending on extracellular glucose concentrations [9].
The complete genome sequence of the commercial wine yeast strain EC1118 [10] and the vineyard strain P301 [11] revealed the presence of a new gene (named EC-1O4_6634g in the former study and P301_O3_0021 in the latter study) highly similar to the S. pastorianus FSY1 gene [10]. This gene was designated FSY1 as well, and Galeote and colleagues [3] demonstrated that, in S. cerevisiae, it encoded a high-affinity fructose/H+ symporter. In the EC1118 genome, FSY1 is in the C region that resulted from a horizontal gene transfer (HGT) from Torulaspora microellipsoides, a distant yeast species identified in the wine environment [12]. This region includes the FOT genes that confer a strong competitive advantage during grape must fermentation by increasing the number and diversity of oligopeptides that yeast can utilize as a source of nitrogen, thereby improving biomass formation, fermentation efficiency, and cell viability. Thus, the acquisition of the C region genes is related to better fermentation performance in the nitrogen-limited wine fermentation environment [13].
Moreover, FSY1 expression is repressed by high concentrations of glucose or fructose and is induced by ethanol as the sole carbon source [3]. This observation leads to suppose that this transporter is active in the last part of the fermentation process, where ethanol concentration is high and fructose residue is more abundant than glucose. Although the presence of HXT gene family and GAL2 gene is well documented in the Saccharomyces genus, studies on FSY1 gene diffusion among Saccharomyces strain genomes is lacking, as well as the FSY1 gene expression level during the fermentation process.
Previously, sugar transporter genes expression studies were mainly focused on a single strain in the fermentation process [14,15,16,17]. Therefore, in this work, the gene expression patterns of four S. cerevisiae strains (P301.9, R31.3, R008, and EC1118) have been studied at two time points of the late fermentation phase. The aim was to investigate how the strain gene expression pattern modulated the late fermentation process.

2. Materials and Methods

2.1. Yeast Strains

In the present work, four Saccharomyces cerevisiae strains were used: The industrial strain EC1118 (Lallemand Inc.—Montreal, QC, Canada) and three natural strains isolated in a vineyard: P301.9, R008, and R31.3 (University of Padova, Padova, Italy).

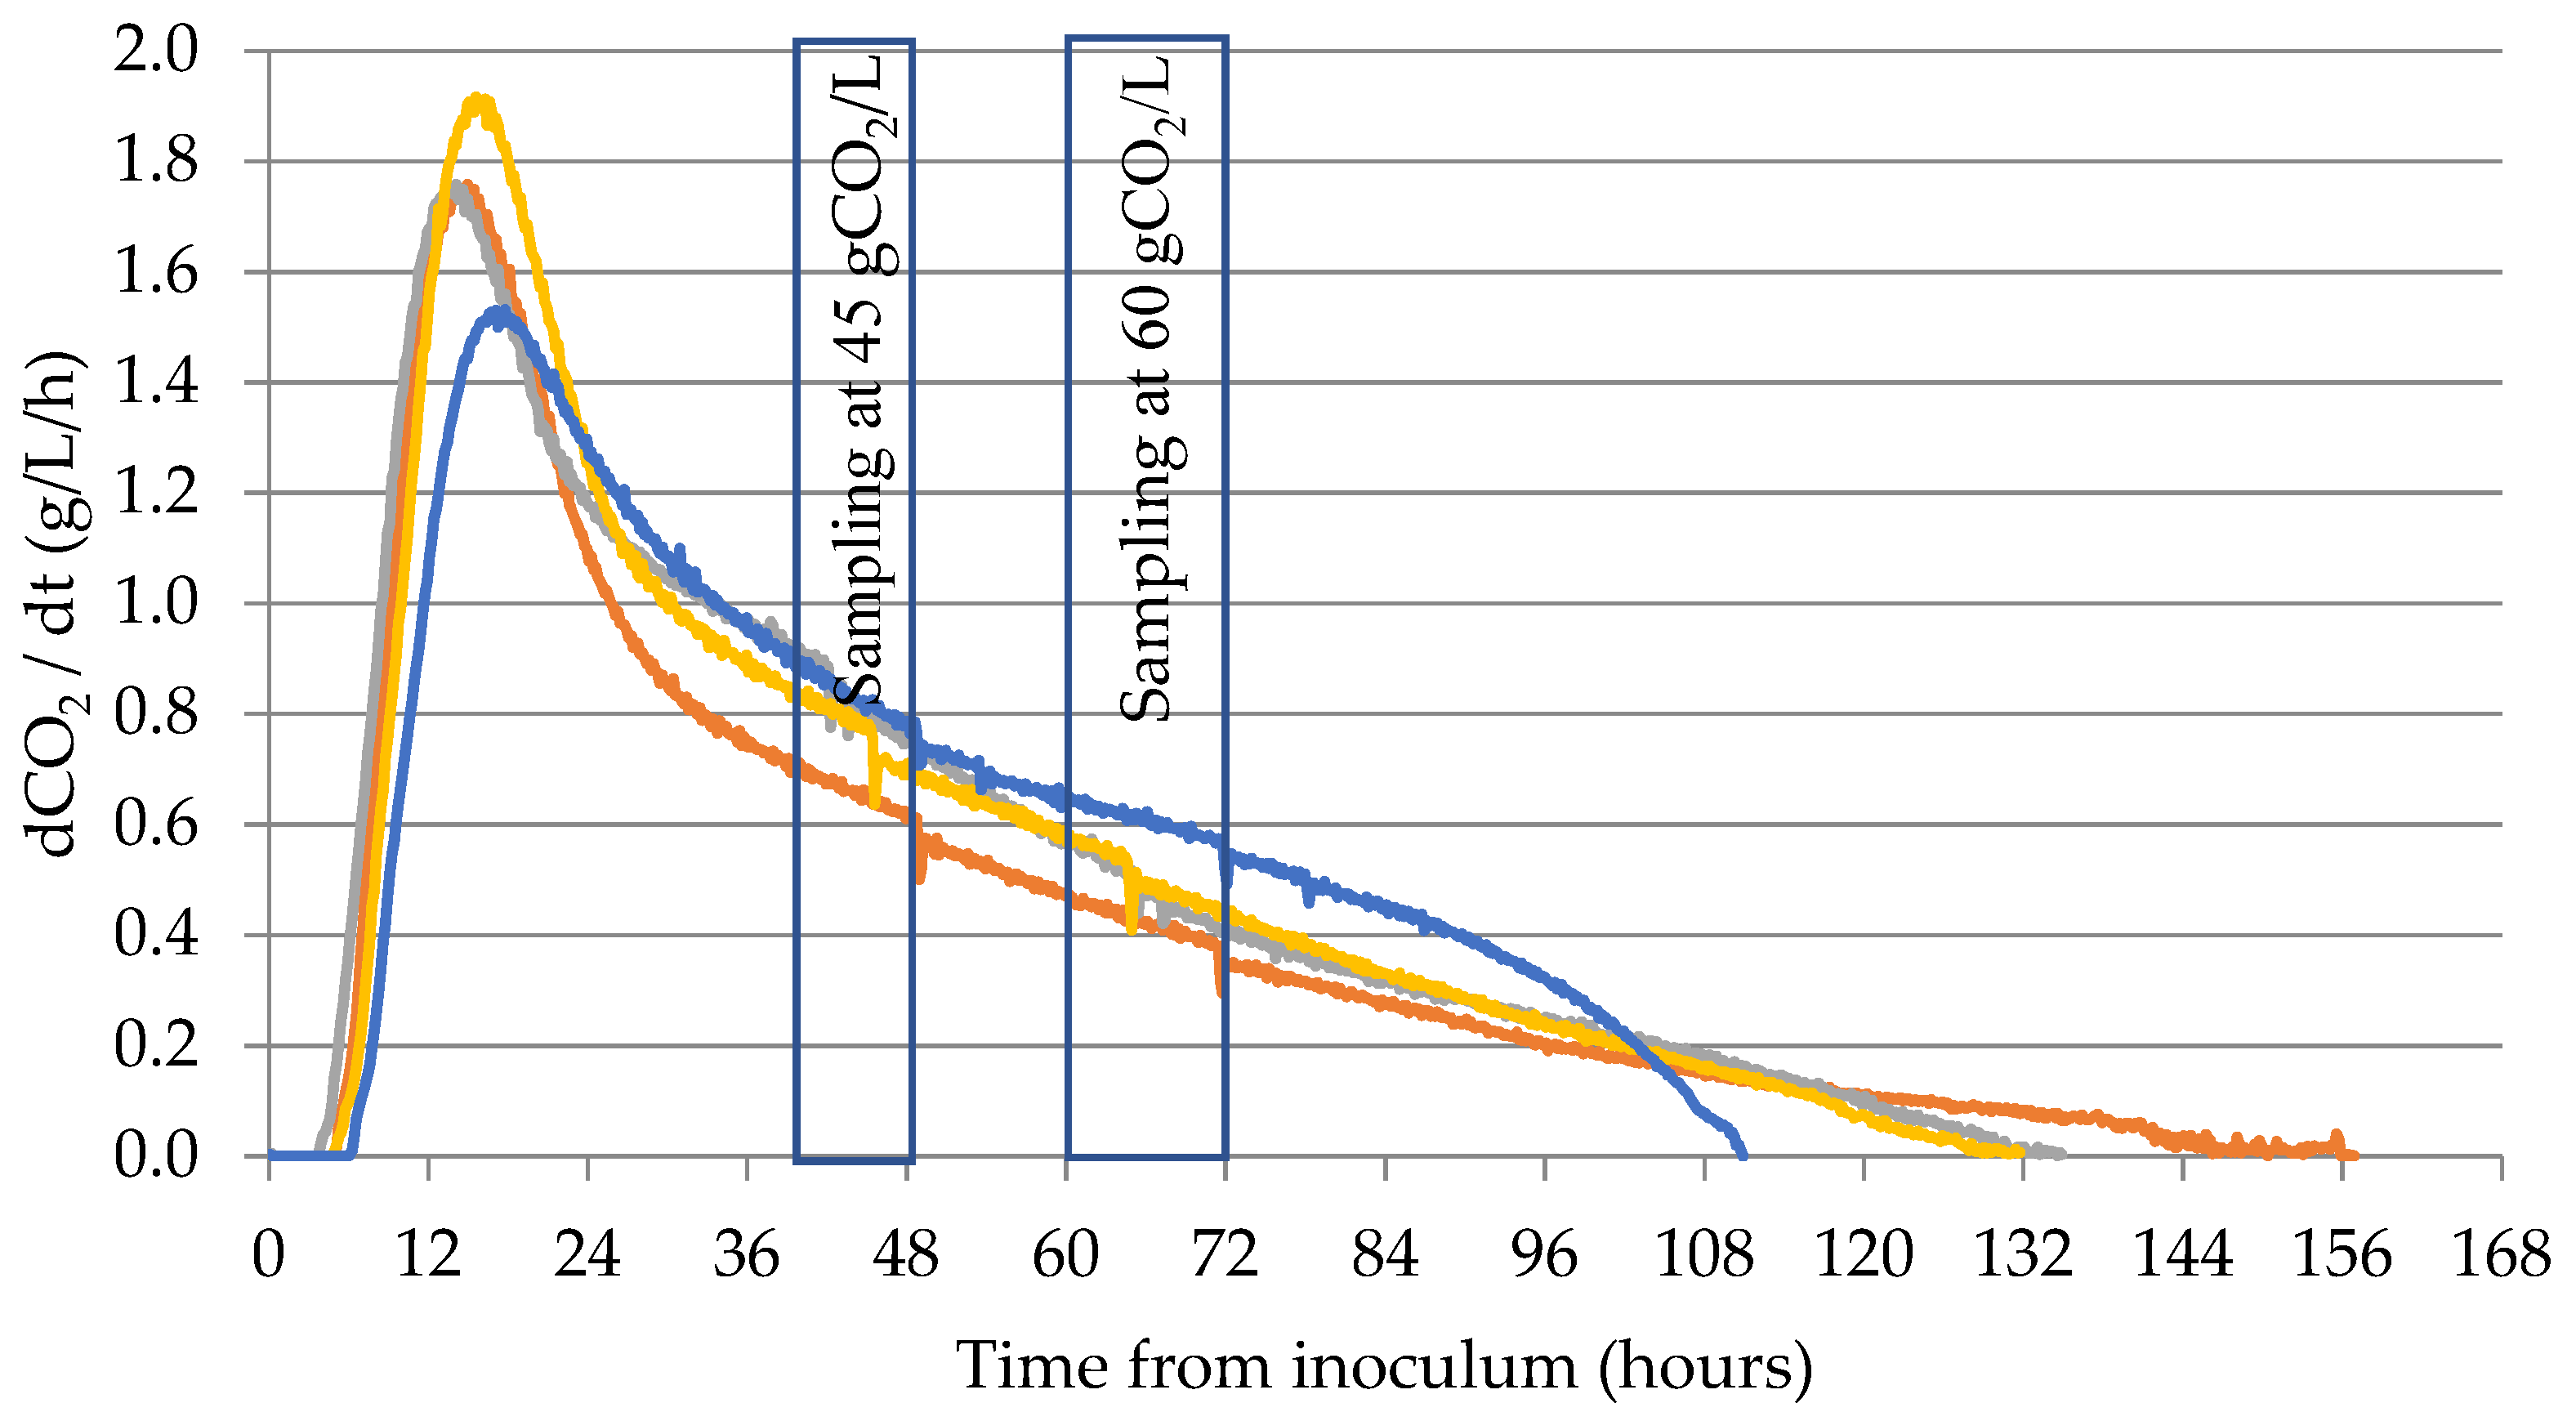
2.2. Fermentation Trial and Samplings

Fermentations were performed at 25 °C in synthetic grape must MS300 [18] modified for the carbon source: 100 g/L of glucose and 100 g/L of fructose were added instead of 200 g/L of glucose. Three independent biological replicates were carried out for each strain in 1 L bioreactors (Multifors, Infors HT, Basel, CH, Switzerland). These instruments are equipped with sensors to monitor temperature and a flow meter to determine CO2 outflow (red-y mod. GSM-A95A-BN00, Infors HT, Basel, CH, Switzerland) (range 1–20 mL/min). Strict anaerobiosis was not imposed, but fermentation conditions were largely anaerobic due to the design of the bioreactor and the effect of CO2 production. CO2 production was monitored by the flow meter every 5 min to determine the rate of CO2 production. For each strain, approximately 3 × 10⁶ cells/mL have been inoculated in 1 L of MS300 must. For each strain, cells were collected for Real Time-PCR assay at two sampling points during the late fermentation phase, when 45 and 60 g/L of CO2 were produced. After sampling, the cells were centrifuged to remove the growth media and immediately frozen at −80 °C. At the same sampling points, 50 mL of fermented media have been collected and frozen for chemical analysis.

2.3. Chemical Analysis

HPLC analysis was performed to determine the concentrations of residual sugars and ethanol, as described by Lemos Junior [19]. Ten microliters of sample was analyzed by the Waters 1525 HPLC binary pump (Waters, Milford, MA, USA) equipped with a 300 × 7.8 mm stainless-steel column packed with Aminex HPX_87H HPLC column (Bio-Rad, Hercules, CA, USA) and a Waters 2414 Refractive Index Detector (Waters, Milford, MA, USA). The analyses were performed isocratically at 0.6 mL/min and 65 °C with a cation-exchange column (300 by 7.8 mm [inner diameter]; Aminex HPX-87H) and a Cation H+ Microguard cartridge (Bio-Rad Laboratories, Hercules, CA, USA), using 0.01 N H2SO4 as the mobile phase. Ammonia and amino nitrogen were measured by means of specific enzymatic kits (Steroglass, Perugia, Italy) according to the manufacturer’s instructions.

2.4. RNA Extraction and Reverse Transcription

Total RNA was extracted using the TRIzol® Plus RNA Purification Kit (Ambion, Austin, TX, USA). The concentration, purity, and integrity of RNA samples were determined by spectrophotometric analysis using the SPARK® multimode microplate reader (Tecan Trading AG, Switzerland), considering the absorbance ratio at 260/280 nm and at 230/260 nm. The quality and integrity of RNAs were confirmed by electrophoresis on 1.5% agarose gels under denaturing conditions (2% formaldehyde, v/v, 20 mM MOPS, 5 mM sodium acetate, 1 mM EDTA, pH 7.0). To obtain DNA-free RNA, the total RNA previously extracted (1 μg) was treated with DNase I (Fermentas, Waltham, MA, USA) according to the manufacturer’s instructions. cDNA was synthesized using Revert Aid Reverse Transcriptase (Fermentas, Waltham, MA, USA) according to the manufacturer’s instructions using both polyT (16) primers (MWG-biotech; 0.5 μg/μL) and random hexamers (Promega; 0.5 μg/μL). Samples were stored at −20 °C until Real-Time PCR was run.
The quality control of cDNAs was checked by end-point PCR in a PTC200 thermal cycler (MJ Research Inc., Waltham, MA, USA). Amplification of the gene APE2 (F—TGCGCATCAATGTAATGTGGAAGCAGAGTA, R—TGAAATCAGGTTCCACGGTTAAATCGTAGTGT) was performed on cDNAs both for checking the reverse-transcription efficiency and for excluding genomic DNA contamination. Amplified samples were run on 1.5% agarose gel containing 1X GelRedTM Nucleic Acid Gel Stain (Biotium, Fremont, CA, USA). Run was performed on a horizontal electrophoresis apparatus with TBE 0.5x as the running buffer (44.5 mM Tris, 44.5 mM boric acid, 1 mM EDTA) and the bands were visualized by UV trans-illumination.

2.5. Primer Design

PCR primers of the investigated genes for real-time assays are listed in Table 1. They were designed using Primer-BLAST (http://www.ncbi.nlm.nih.gov/tools/primer-blast/, accessed on 5 May 2017). The yeast database was used to check primer specificity on sequences of other yeast species. Special attention was given to primer length (15–25 bp), annealing temperature (58–62 °C), nucleotides composition, 3′-end stability, and amplicon size (80–200 bp). All primers were synthesized and OPC purified by Metabion International AG (Metabion International AG, Planegg, Germany). After synthesis, the primer specificity was tested by end-point PCR and gel electrophoresis.
For each different primer pair, the efficiency of RT-PCR (E), slope values, and correlation coefficients (R2) were determined using serial 1:5 dilutions of the template cDNA on the CFX96 cycler—Real-Time PCR Detection System (Bio-Rad Laboratories, Hercules, CA, USA). Efficiency was considered adequate when ranging from 95% to 105%, and R2 was considered acceptable when greater than 0.98.

2.6. Real-Time PCR

Real-Time PCR was carried out on a CFX96 Cycler-Real Time PCR Detection System (Bio-Rad Laboratories, Inc., Hercules, CA, USA), in white-walled PCR plates (96 wells). A ready-to-use master-mix containing a fast proof-reading Polymerase, dNTPs, stabilizers, MgCl2, and Eva Green dye was used according to the manufacturer’s instructions ( Bio-Rad Laboratories, Hercules, CA, USA). Reactions were prepared in a total volume of 15μL containing 400 nM each primer (MWG), 1× Sso Fast Eva Green Supermix 2× (Bio-Rad Laboratories, Hercules, CA, USA), and 5 μL cDNA. The cycle conditions were set as follows: Initial template denaturation at 98 °C for 30 s, followed by 40 cycles of denaturation at 98 °C for 2 s, and combined primer annealing/elongation at 60 °C for 10 s. The amount of fluorescence for each sample, given by the incorporation of Eva Green into dsDNA, was measured at the end of each cycle and analyzed via CFX-Manager Software v2.0 (Bio-Rad Laboratories, Inc., Hercules, CA, USA). Melting curves of PCR amplicons were obtained using temperatures ranging from 65 °C to 95 °C. Data acquisition was performed for every 0.5 °C temperature increase with a 1-s step. For each target gene, each sample was analyzed in triplicate and no-template controls for each primer pair were included in all plates. Gene expression analysis was performed using the CFX-Manager Software v2.0, adopting the 2−ΔΔCT method. Four housekeeping genes have been used in Real-Time PCR gene expression analysis: The ALG9 and UBC6 primers designed by Teste [20]; andthe FBA1 and PFK1 primers designed by Cankorur-Cetinkaya [21] and Nadai [22], respectively (Table 2). In this study, the lettering “total expression” indicates the sum of the normalized expression values of the genes, for each strain, relative to one of the two sampling points (45 or 60 g/L of produced CO2).

2.7. Statistical Analysis

The statistical data analysis was performed using XLSTAT software, vers. 2016.02 (Addinsoft, Paris, France). Data were subjected to Student’s t-test or simple analysis of variance (one-way ANOVA) followed by the Tukey’s post-hoc test. The analysis was carried out comparing the averages of three independent replicates, and differences were considered statistically significant for p-value lower than 0.05.

3. Results

3.1. Yeasts Fermentation Process

Fermentations in synthetic must were run using three S. cerevisiae strains, P301.9, R31.3, and R008, isolated from a vineyard and the commercial starter EC1118. The aim was to check strain behavior during the alcoholic fermentation focusing on the last part of the fermentation, starting form half of the total expected CO2 (45 g/L) to the end of the process (late fermentation phase).
The fermentation profiles of the four strains were determined monitoring the fermentation rate (dCO2/dt) (Figure 1).
During fermentation process, the fermentation rate peaked (Vmax) just before the entry into the yeast stationary growth phase and declined thereafter until the end of the fermentation [23]. Strain P301.9 showed the highest Vmax value (1.93 gCO2/L/h), reached after 15.58 h from inoculum, while the lowest was obtained for EC1118 (1.53 gCO2/L/h) reached in 16.75 h from inoculum. Intermediate values were registered for strains R008 and R31.3 (Table 3).
During the late fermentation phase, strains R008, R31.3, and P301.9 showed a marked decrease of the fermentation rate that is more evident in the last part of the fermentation. This trend was responsible for the increase of the fermentation time, with respect to the commercial strain EC1118. Therefore, EC1118 was the first strain to complete the fermentation, followed by P301.9, R31.3, and R008.
Despite the different fermentation trends, EC1118, P301.9, and R31.3 completed the sugar transformation, while R008 left a fructose residue of 7.62 g/L (Table 4). The ethanol concentration at the end of the fermentation reflected the sugar consumption. No significant differences in ethanol production were found among strains EC1118, P301.9, and R31.3. Strain R008 did not reach the same ethanol level, due to the sugar residues (Table 4).
During the late fermentation phase, two samplings were performed at 45 g/L (half of the CO2 produced) and 60 g/L of CO2 produced. Due to differences in strain fermentation rates, these values were reached at different times.
The mean total sugar residue of the four strains was 79.69 ± 4.17 g/L at 45 g/L of CO2 produced and 40.80 ± 5.96 g/L at 60 g/L of CO2 produced (Supplementary Table S1). ANOVA analysis of variance found no significant differences among the strains’ sugar residue at both sampling points (alpha = 0.05). This result indicates that the sampling time have been correctly chosen in order to harvest cells in the same physiological state.
At 45 g/L of CO2 produced, strain EC1118 showed the lowest ratio between fructose and the total sugar residue (60.30%), corresponding to the most balanced intake of fructose and glucose with respect to the other strains, which have shown significantly higher ratios. The same pattern has been observed at 60 g/L of produced CO2. For all strains, this ratio increased from 45 to 60 g/L of produced CO2, during the late fermentation phase, confirming the glucophilic aptitude of S. cerevisiae (Table 5). Strain R31.3 showed the highest increase of the ratio between fructose and the total sugar residue from 45 to 60 g/L of produced CO2 (12.27%), followed by P301.9 (10.11%), R008 (8.92%), and EC1118 (6.57%).
At the two sampling points, assimilable nitrogen (ammonium and amino acids) residues were measured. At the beginning of the fermentation process, the assimilable nitrogen present in the synthetic must (300 mg/L) was at a high level and provided the suitable nitrogen amount required by the yeast strains to complete the fermentation when 200 g/L of sugar are present in the must [24]. Generally, ammonium nitrogen is completely consumed during the first part of the fermentation (up to Vmax) that corresponds to the last part of the exponential growth [23]. The amino-nitrogen residues are reported in Table 5 for each sampling point.
The amino-nitrogen residues reflected strain fermentation rates during the exponential growth phase. The three strains that showed high Vmax values left lower amino-nitrogen residues than EC1118. Among the three strains, different nitrogen consumptions were observed. R31.3 and P301.9, which showed a similar fermentation trend, revealed different nitrogen consumptions. Between the two sampling points, no further nitrogen consumption was apparently registered. This could be due to the nitrogen release by cell lysis that occurred during the stationary phase [14].

3.2. Expression of Hexose Transporters Genes during Late Fermentation

During the late fermentation phase, two cell samplings were performed, at 45 and 60 g/L of CO2 produced, to analyze the gene expression of hexose transporters that are known to be active during the fermentation process, namely HXT 1-8, GAL2, and FSY1. All the investigated genes were present in the strain genome, but FSY1 was not found in strain R008 [11].
Comparing strains gene expression (Figure 2), each strain evidenced a specific pattern both at 45 and at 60 g/L of CO2 produced.
The global expression rate was calculated by summing the expression rate of each single gene analyzed. At 45 g/L of CO2 produced, EC1118 showed the highest expression rate (15.48) and strain R008 showed the lowest (6.35). EC1118 was the only strain that decreased the global expression rate at 60 g/L of CO2 produced (10.76), reaching a global expression rate value lower than P301.9 and R31.3 (13.08 and 14.25, respectively). R008, which left a sugar residue at the end of the fermentation, showed the lowest level of the global expression rate at both sampling times. Regarding the good fermenting yeasts (EC1118, P301.9, and R31.3), in the two vineyard strains, the expression of the tested genes increased at 60 g/L of CO2 produced. On the contrary, in EC1118, most of the tested genes showed a decrease of expression.
When the expression of each gene was compared among the four strains (Table 6), different expression levels were always detected suggesting a strain-specific expression pattern at the two sampling points and trend.
HXT3 was the most expressed gene at 45 g/L (in EC1118 relative expression 3.004). This gene encodes a low-affinity transporter, and its expression requires the presence of glucose, but it is only weakly dependent on sugar concentration [25]. It has been demonstrated that, among the HXT family, HXT3 has the highest capacity to support fermentation. In fact, Hxt3p is the only carrier that is expressed throughout the fermentation, consistent with the fact that it plays a key role in the process [26]. The robust expression and high stability of Hxt3p during the stationary phase is consistent with its capacity to maintain a high fermentation rate during starvation when expressed alone [7].
Transport-kinetic data support the idea that Hxt3p is the primary low-affinity transporter during stationary phase. All these previous findings were related to strain V5 isolated from Champagne [26], such as EC1118. In the other vineyard strains, the expression level is nearly half, and at 65 g/L, it decreased in EC1118, R008, and R31.3 but increased in P301.9. In the two vineyard strains that completed fermentation (P301.9 and R008), HXT3 was not the most expressed strain both at 45 and 60 g/L of produced CO2. This finding caused us to rethink the role of the Hxt3 transporter during fermentation. The main contribution of HXT3 to maintain a high fermentation ratio during the late fermentation phase, as suggested by the literature, could be limited to specific yeast genotypes.
The second most expressed gene at 45 g/L of produced CO2 was GAL2. Substrate-inducible and glucose repressible galactose transporter Gal2p, which is more than 60% identical to the Hxt transporters, mediates the transport of galactose by the mechanism of facilitated diffusion. It has been demonstrated that the Gal2p also mediates the transport of glucose in the HXT1-7 null mutant [27]. This finding suggested that GAL2 can play a role when glucose concentration is low such as in the late fermentation phase, although the expression level is reduced at 60 g/L of CO2 produced with the exception of P301.9.
The HXT6 and HXT7 genes encode the most closely related (they differ only in two amino acid residues), high-affinity transporters. Due to this high sequence similarity, the same primer couple was used for qPCR quantification. They are highly expressed at very low glucose concentrations, non-fermentable carbon sources (ethanol, glycerol), maltose and/or galactose, and repressed by moderate and high glucose concentrations [25]. Previous findings evidenced that the two genes displayed a similar expression profile during alcoholic fermentation. In strain V5, they displayed a strong burst of expression following the entry into the stationary phase and the respective proteins remained abundant through the late fermentation phase [26]. The EC1118 expression value at 45 g/L and 60 g/L of CO2 produced confirmed the previous finding. The vineyard strains evidence an opposite trend. At 60 g/L, an increase in the expression level was observed for all the strains. These findings suggest that HXT6 and HXT7 have a major role in maintaining the high fermentation rate during the late fermentation phase.
The expression pattern and function of the hexose transporter encoded by HXT8 is still poorly defined [28]. It has 70% similarity with HXT6 [29]. It appears to be unable to support growth on glucose of the HXT1-7 null strain [30]. However, when overexpressed in an HXT1–17 GAL2 null strain, it was able to restore growth on glucose, fructose, and mannose, confirming that it is a functional hexose transporter [31]. The expression of Hxt8p is induced by low and repressed by high levels of glucose [32]. This finding was confirmed by the gene expression values displayed by the four strains. All yeast showed an increase in the expression level from 45 to 60 g/L of CO2 produced, particularly in EC1118 and R31.3 that registered the highest expression values.
Hxt5p has a moderate affinity for glucose and a low affinity for fructose and for mannose [33]. It is apparently regulated by the growth rate of the cells rather than by the external glucose concentration [34]. In addition, it is upregulated upon nitrogen and carbon starvation [35]. Therefore, it could be of interest during the late fermentation phase. The expression level in EC1118 is stable at 45 and 60 g/L, and in vineyard strains, a marked increase was evidenced, particularly in the case of R31.3 where the expression level rose almost 5-fold.
The HXT2 and HXT4 genes, as well as HXT5, have been classified as genes encoding transporters with moderate affinity for glucose (Km values around 10 mM) [27,36] that are maximally expressed at a low concentration of glucose and repressed in the presence of high glucose concentrations [25,37]. Despite moderate affinity, the HXT2 expression pattern showed a decreasing expression level from 45 to 60 g/L, and specially for vineyard strains was very low. These results were consistent with previous findings that evidenced a strong activation of the HXT2 gene only during the first hours of fermentation, returning to very low levels during the growth phase. This transient induction of HXT2 is somewhat contradictory to the known regulation of this gene, as it has been shown to be repressed by high glucose concentrations [38]. HXT2 appeared to be able to bypass glucose repression during the lag phase but returned to a repressed state as growth resumed. Conversely, they did not observe an induction of HXT2 at the end of fermentation when the hexose concentration became low and sub-repressive [26].
On the contrary, HXT4 expression showed a strain-mediated trend: Decreasing in EC1118 and markedly so in R31.3, constant in R008, and increasing in P301.9.
HXT1, as well as HXT3, is a low-affinity carrier and it is strongly expressed at the beginning of fermentation, while its expression level decreased rapidly during the growth phase, consistent with the HXT1 gene being induced by high sugar concentrations [26]. R31.3 seemed to confirm this previous finding as it showed a very low expression level decreasing from 45 to 60 g/L produced CO2. At the two sampling points, similar expression levels were found in EC1118 and R008. Surprisingly, P301.9 showed a notably increased value at 60 g/L of CO2 suggesting a role of HXT1 in supporting the fermentation ratio during the late fermentation phase. The FSY1 gene was firstly isolated in Saccharomyces pastorianus and its protein was the first fructose permease identified in a yeast species [39]. The EC1118 complete genome sequence revealed the presence of a gene sequenced responsible for a protein highly similar to that encoded by the S. pastorianus’ specific fructose symporter FSY1 gene [10]. The functional analysis of the EC1118 FSY1 gene demonstrated that it encodes for a high-affinity fructose/H+ symporter [3]. Since hexoses are transported by facilitated diffusion via hexose carriers (Hxt), which prefer glucose to fructose, the utilization of fructose by wine yeast is critically important in the late phase of the fermentation where fructose is the most present sugar. Previous findings demonstrated that, in EC1118, FSY1 was repressed by high concentrations of glucose or fructose and was highly expressed on ethanol as the sole carbon source [3]. Interestingly, the FSY1 expression pattern was very different between EC1118 and the other strains that possessed this gene (R31.3 and P301.9). Indeed, they showed a marked increase of the expression level at 60 g/L of CO2 produced. This finding suggested that due to the expression level, this gene could have a different impact on strain fermentation rate during late fermentation.
The expression percentage of each transporter-coding gene is reported in Figure 3.
In EC1118, the decrease in the expression level from 45 to 60 g/L of produced CO2 is 30,5%, while in the other strains the increase is from +15.4 in R008 to +70% in P301.9. At 45 g/L in EC1118, the expression of HXT3, GAL2, and HXT6/7 accounted for more than 50% of the overall gene expression and at 60 g/L, HXT8 was the most expressed gene. At 45 g/L in P301.9, FSY1 is the most expressed gene followed by HXT6/7 and HXT3. At 60 g/L, all these genes showed an increase in the expression level that is more evident in FSY1. In R31.3 at 45 g/L, GAL2 is the most expressed gene and HXT6/7, HXT8, and FSY1 showed similar expression percentages. At 60 g/L, they accounted for more than 50% of the overall gene expression the showed the highest increase in total expression (+76%), followed by R31.3 and R008. At 45 g/L of produced CO2, strain EC1118 showed the highest total expression followed by R31.3, P301.9, and R008, while at 60 g/L of produced CO2, strain R31.3 showed the highest total expression followed by P301.9, EC1118, and R008 (Figure 3).
At 45 g/L of produced CO2, the most expressed genes in EC1118 were HXT3, GAL2, and HXT6/7. The expression pattern of HXT3 and HXT6/7 confirmed previous findings that assessed HXT3 as the most highly expressed HXT gene during alcoholic fermentation and HXT6/7, expressed throughout fermentation [40]. HXT3 and HXT8 (together with HXT1) were the most expressed gene in R008, although at lower levels than that of EC1118. Interestingly, in P301.9, the most expressed gene was FSY1 followed by HXT6/7 and HXT3; in R31.3, FSY1 showed an expression level similar to the most expressed genes, HXT8 and GAL2. At 60 g/L of produced CO2 in EC1118, a strong increase of HXT8 was registered, while in P301.9, FSY1 reached the 25% of the total gene expression. In R31.3, the GAL2 gene expression strongly dropped down, while FSY1, HXT8, HXT6/7, and HXT5 increased. Although the general low gene expression level in R008 caused an increase in the expression of HXT5 and HXT6/7, HXT8 was found (Figure 3).

4. Discussion

The hexose transporters’ activity during late fermentation phase is crucial to ensure the complete transformation of the sugar into ethanol. In fact, a high fructose/glucose ratio may cause sluggish and stuck fermentations with high levels of fructose residue, which is a major problem in the wine industry [3,41].
The transport of glucose and fructose in the yeast Saccharomyces cerevisiae plays a crucial role in controlling the rate of wine fermentation, and the yeast fermentation performance is strongly influenced by the hexose carrier set-up [7,26,42]. Saccharomyces cerevisiae is the organism provided with the highest number of hexose transporter genes. In its genome, twenty genes encode hexose transporter-like proteins (HXT1 to HXT17, GAL2, SNF3, and RGT2) [43].
The molecular function of these hexose transporters is redundant, as none of these transporters are essential for growth on glucose. The cooperation among the involved transporters determines the effectiveness of the sugar-uptake systems. In S. cerevisiae, two uptake systems have been described: The first, a constitutive low-affinity system involving HXT2, HXT6, and HXT7, and the second, a glucose-repressed high-affinity system responsible for the high-affinity transporters, HXT1, HXT3, or HXT4 [27]. In contrast, the expression of HXT5 [33] is influenced by the growth rate of cells and not by the extracellular glucose concentration. Strains lacking HXT1 through HXT7 genes are unable to grow on glucose, fructose, or mannose and have no glycolytic flux [8,27]. Despite extensive research, the functions of Hxt8-Hxt17 have remained poorly defined. HXT8, induced by low levels of glucose, appears to function as a glucose transporter since it can partially complement the glucose growth defect of the hxt null mutant [30]. Only recently, Treu and colleagues [44] found that the HXT8 gene was expressed during the first stage of synthetic grape must fermentation, although at a lower level than HXT1–7 genes. HXT12 was found to be a pseudogene and only recently Jordan and co-workers [45] described Hxt13p, Hxt15p, Hxt16p, and Hxt17p as a novel type of polyol transporters, not involved in glucose and fructose transport. Another gene with similarity to the HXT family is present in the yeast genome: GAL2. It encodes a galactose transporter that is also a high-affinity glucose transporter [36]. The FSY1 gene, encoding for a fructose/H+ symporter, previously identified in S. pastorianus [39], has been discovered and characterized in the EC1118 Saccharomyces cerevisiae strain [3,5]. In 2014, Treu and colleagues [11] found the fructose transporter in a vineyard strain (P301) with the same origin as the strains tested in this study. Following P301 transcriptome analysis under fermentation conditions reported that FSY1 gene was expressed at lower levels with respect to other hexoses transporter genes [44]. Notwithstanding, FSY1 gene is potentially very interesting as in the late fermentation phase, fructose is the main sugar residue due to yeast glucophilic behavior.
With the aim to evaluate the role of the different hexose transporter gene expressions in the strain ability to complete sugar fermentation, four S. cerevisiae strains were considered: he industrial wine EC1118 and the vineyard P301.9, R31.3, and R008. Previous results found that the strain R008 genome does not contain the FSY1 gene [11].
Kinetics of carbon dioxide production differed among the tested strains, evidencing optimal (EC1118), intermediate (P301.9 and R31.3), and poor (R008) fermentation trends. During early fermentation (up to the fermentation rate peak, Vmax) that was consistent with the yeast exponential growth phase [23], vineyard strains showed better fermentation performance than EC1118, particularly P301.9. During late fermentation (after the fermentation rate peak to the end of the process), an opposite trend was observed. EC1118 kept the fermentation rate at a higher level than the other strains and completed the fermentation earlier. Strain R008 showed the lowest fermentation rate during the late fermentation phase, leaving a fructose residue and producing about 1% less ethanol. The fermentation trends were consistent with the fructose/total sugar ratio and amino acid consumption found at 45 g/L. EC1118 that showed the lowest fermentation level during early fermentation consumed the lowest amount of amino acid and fructose. P301.9 showed the highest Vmax value and consumed the highest number of amino acids, although the fructose/total sugar ratio showed no significant difference with the other vineyard strains. No significant differences were found between amino acid residues at 45 and 60 g/L in EC1118 and P301.9, the best fermenting strains. On the opposite, R31.3 and R008 showed a significant increase in amino nitrogen residues. This could be due to higher cell mortality level at 60 g/L that could also be responsible for the longer fermentation time.
All the HXT genes involved in glucose/fructose transport (HXT1-8) and GAL2 and FSY1 genes were tested by means of Real-Time PCR, and their relative gene expression has been determined. The results evidenced that all the genes tested were expressed during late fermentation regardless of their attitude to be inhibited by high or low glucose regulation pathways.
High-affinity transporter gene HXT6-7, intermediate affinity HXT2 and HXT4, HXT8, and GAL2 are induced by a low glucose concentration, therefore an increase in their expression is expected. On the contrary, low-affinity transporter genes HXT1 and HXT3, induced by high glucose, were supposed to decrease their expression. EC1118 showed a decrease expression for all the genes, except for HXT8. In P301.9, all gene expressions increased, except for HXT2 that remained unchanged. R31.3 showed a similar trend to EC1118, except for HXT6/7 and HXT8 that increased their expression level. Despite the very low total expression level, R008 showed an intermediate trend as HXT6/7 and HXT8 increased as in P301.9 and HXT2, HXT3, and GAL2 decreased as in EC1118. These results suggested that the “low-glucose” signal that controls high- and intermediate-affinity transporters gene expression turned up at higher sugars concentration in EC1118 cells than the others. On the contrary, the “high-glucose” signal that controls low-affinity transporters gene expression turned up at higher sugar concentrations in P301.9 cells than the others.
HXT5 gene expression was maximally induced upon glucose and nitrogen depletion [34]. In this work, the HXT5 gene expression increased in R31.3, P301.9, and R008 from 45 to 60 g/L of produced CO2, while EC1118 remained low and constant. These findings are consistent with strain nitrogen consumption values as the vineyard strains consumed more nitrogen that EC1118 during early fermentation.
Previous works demonstrated that in EC1118, FSY1 was repressed by high concentrations of glucose or fructose and was highly expressed on ethanol as the sole carbon source [3]. Surprisingly, in this study, FSY1 was only poorly expressed at 45 and at 60 g/L in EC1118, evidencing a decrease in the expression from 45 to 60 g/L. On the contrary, in the two other strains containing this gene, the expression level was very high, and a marked increase was evident from 45 to 60 g/L. Therefore, the FSY1 gene seems to play an important role in the sugar uptake of these yeast strains. EC1118 possessed the lowest “fructose/total residual sugars” ratio values (F/T ratio) at both sampling times. These data suggested that EC1118 is more capable of handling the F/T ratio than the other strains during early fermentation, leaving less fructose during late fermentation. In this condition, P301.9 and R31.3 took advantage of the high-affinity fructose/H+ symporter FSY1 to complete sugar consumption. Therefore, the high level of expression assured the fructose consumption during the late fermentation phase. This is not the case for R008, as they do not possess the FSY1 gene. The lack of this gene, together with a low gene expression of all the genes of the HXT transport system, could be the cause of the poor fermentation performance during late fermentation.

5. Conclusions

In the fermentation trial, all the hexose transporter genes were expressed at both 45 and 60 g/L CO2. This indicated that the corresponding sugar concentration range supported both the high and low glucose-dependent transporters.
The very low total gene expression of the transporters and the poor fermentation performance of R008 suggested that the overall expression level is a determinant to maintain a high fermentation rate during the late fermentation phase.
Each yeast showed a specific gene expression profile that was strongly variable among the strains. This led to rethinking the importance of the HXT3 that was previously considered to play a major role in sugar transport during the overall fermentation process. The main contribution of HXT3 to maintain a high fermentation ratio during late fermentation phase [7,40] could be limited to specific yeast genotypes. In different genetic contexts, other genes such as HXT6/7, HXT8, and FSY1 were the most expressed and therefore responsible for sugar transport in the late fermentation phase.
Finally, two trends emerged from the data collected: EC1118, that reduced the gene expression of “low/high glucose”-induced genes, and P301.9, showing a gene expression increase. These findings suggest a strain-specific response of the “high/low glucose”-dependent genes that control most of the sugar transport in the yeast cell.

Supplementary Materials

The following are available online at https://www.mdpi.com/article/10.3390/fermentation7030164/s1, Table S1: Residual sugars at 45 and 60 g/L of produced CO2.

Author Contributions

Conceptualization: V.C.; formal analysis: C.N. and G.C.; investigation: C.N. and G.C.; resources: V.C. and A.G., writing—original draft preparation: V.C., G.C. and C.N.; supervision: V.C.; project administration: V.C.; funding acquisition: A.G. and V.C. All authors have read and agreed to the published version of the manuscript.

Funding

This work was funded by Regione Veneto through its Programme FSE 2014–2020 (Grant No. 2105/32/2121/2015). G.C. was financially supported by University of Padova PhD Grant.

Institutional Review Board Statement

Not applicable.

Informed Consent Statement

Not applicable.

Data Availability Statement

Not applicable.

Conflicts of Interest

The authors declare no conflict of interest.

References

  1. Guillaume, C.; Delobel, P.; Sablayrolles, J.-M.; Blondin, B. Molecular Basis of Fructose Utilization by the Wine Yeast Saccharomyces cerevisiae: A Mutated Hxt3 Allele Enhances Fructose Fermentation. Appl. Environ. Microbiol. 2007, 73, 2432–2439. [Google Scholar] [CrossRef] [Green Version]
  2. Berthels, N.; Corderootero, R.; Bauer, F.; Thevelein, J.; Pretorius, I. Discrepancy in Glucose and Fructose Utilisation during Fermentation by Wine Yeast Strains. FEMS Yeast Res. 2004, 4, 683–689. [Google Scholar] [CrossRef] [Green Version]
  3. Galeote, V.; Novo, M.; Salema-Oom, M.; Brion, C.; Valério, E.; Gonçalves, P.; Dequin, S. FSY1, a Horizontally Transferred Gene in the Saccharomyces cerevisiae EC1118 Wine Yeast Strain, Encodes a High-Affinity Fructose/H+ Symporter. Microbiology 2010, 156, 3754–3761. [Google Scholar] [CrossRef] [Green Version]
  4. Blateyron, L.; Sablayrolles, J.M. Stuck and Slow Fermentations in Enology: Statistical Study of Causes and Effectiveness of Combined Additions of Oxygen and Diammonium Phosphate. J. Biosci. Bioeng. 2001, 91, 184–189. [Google Scholar] [CrossRef]
  5. Anjos, J.; Rodrigues de Sousa, H.; Roca, C.; Cássio, F.; Luttik, M.; Pronk, J.T.; Salema-Oom, M.; Gonçalves, P. Fsy1, the Sole Hexose-Proton Transporter Characterized in Saccharomyces Yeasts, Exhibits a Variable Fructose:H+ Stoichiometry. Biochim. Biophys. Acta Biomembr. 2013, 1828, 201–207. [Google Scholar] [CrossRef] [PubMed] [Green Version]
  6. de Sousa, H.R.; Spencer-Martins, I.; Gonçalves, P. Differential Regulation by Glucose and Fructose of a Gene Encoding a Specific Fructose/H+ Symporter In Saccharomyces Sensu Stricto Yeasts. Yeast 2004, 21, 519–530. [Google Scholar] [CrossRef] [PubMed] [Green Version]
  7. Luyten, K.; Riou, C.; Blondin, B. The Hexose Transporters of Saccharomyces cerevisiae Play Different Roles during Enological Fermentation. Yeast 2002, 19, 713–726. [Google Scholar] [CrossRef] [Green Version]
  8. Boles, E.; Hollenberg, C.P. The Molecular Genetics of Hexose Transport in Yeasts. FEMS Microbiol. Rev. 1997, 21, 85–111. [Google Scholar] [CrossRef]
  9. Kim, D.; Song, J.-Y.; Hahn, J.-S. Improvement of Glucose Uptake Rate and Production of Target Chemicals by Overexpressing Hexose Transporters and Transcriptional Activator Gcr1 in Saccharomyces cerevisiae. Appl. Environ. Microbiol. 2015, 81, 8392–8401. [Google Scholar] [CrossRef] [Green Version]
  10. Novo, M.; Bigey, F.; Beyne, E.; Galeote, V.; Gavory, F.; Mallet, S.; Cambon, B.; Legras, J.-L.; Wincker, P.; Casaregola, S.; et al. Eukaryote-to-Eukaryote Gene Transfer Events Revealed by the Genome Sequence of the Wine Yeast Saccharomyces cerevisiae EC1118. Proc. Natl. Acad. Sci. USA 2009, 106, 16333–16338. [Google Scholar] [CrossRef] [Green Version]
  11. Treu, L.; Toniolo, C.; Nadai, C.; Sardu, A.; Giacomini, A.; Corich, V.; Campanaro, S. The Impact of Genomic Variability on Gene Expression in Environmental Saccharomyces cerevisiae Strains: Genome Analysis of Environmental Yeast Strains. Environ. Microbiol. 2014, 16, 1378–1397. [Google Scholar] [CrossRef]
  12. Marsit, S.; Mena, A.; Bigey, F.; Sauvage, F.X.; Couloux, A.; Guy, J.; Legras, J.L.; Barrio, E.; Dequin, S.; Galeote, V. Evolutionary Advantage Conferred by an Eukaryote-to-Eukaryote Gene Transfer Event in Wine Yeasts. Mol. Biol. Evol. 2015, 32, 1695–1707. [Google Scholar] [CrossRef] [Green Version]
  13. Devia, J.; Bastías, C.; Kessi-Pérez, E.I.; Villarroel, C.A.; De Chiara, M.; Cubillos, F.A.; Liti, G.; Martínez, C.; Salinas, F. Transcriptional Activity and Protein Levels of Horizontally Acquired Genes in Yeast Reveal Hallmarks of Adaptation to Fermentative Environments. Front. Genet. 2020, 11, 293. [Google Scholar] [CrossRef] [PubMed]
  14. Alexandre, H.; Ansanay-Galeote, V.; Dequin, S.; Blondin, B. Global Gene Expression during Short-Term Ethanol Stress in Saccharomyces cerevisiae. FEBS Lett. 2001, 498, 98–103. [Google Scholar] [CrossRef] [Green Version]
  15. Boer, V.M.; de Winde, J.H.; Pronk, J.T.; Piper, M.D.W. The Genome-Wide Transcriptional Responses of Saccharomyces cerevisiae Grown on Glucose in Aerobic Chemostat Cultures Limited for Carbon, Nitrogen, Phosphorus, or Sulfur. J. Biol. Chem. 2003, 278, 3265–3274. [Google Scholar] [CrossRef] [PubMed] [Green Version]
  16. Gibson, B.R.; Boulton, C.A.; Box, W.G.; Graham, N.S.; Lawrence, S.J.; Linforth, R.S.T.; Smart, K.A. Carbohydrate Utilization and the Lager Yeast Transcriptome during Brewery Fermentation. Yeast 2008, 25, 549–562. [Google Scholar] [CrossRef] [PubMed]
  17. Wu, J.; Zhang, N.; Hayes, A.; Panoutsopoulou, K.; Oliver, S.G. Global Analysis of Nutrient Control of Gene Expression in Saccharomyces cerevisiae during Growth and Starvation. Proc. Nat. Acad. Sci. USA 2004, 101, 3148–3153. [Google Scholar] [CrossRef] [PubMed] [Green Version]
  18. Bely, M.; Sablayrolles, J.; Barre, P. Description of Alcoholic Fermentation Kinetics: Its Variability and Significance. Am. J. Enol. Viticult. 1990, 40, 319–324. [Google Scholar]
  19. Lemos Junior, W.J.F.; Nadai, C.; Crepalde, L.T.; de Oliveira, V.S.; de Matos, A.D.; Giacomini, A.; Corich, V. Potential Use of Starmerella bacillaris as Fermentation Starter for the Production of Low-Alcohol Beverages Obtained from Unripe Grapes. Int. J. Food Microbiol. 2019, 303, 1–8. [Google Scholar] [CrossRef]
  20. Teste, M.-A.; Duquenne, M.; François, J.M.; Parrou, J.-L. Validation of Reference Genes for Quantitative Expression Analysis by Real-Time RT-PCR in Saccharomyces cerevisiae. BMC Mol. Biol. 2009, 10, 99. [Google Scholar] [CrossRef] [Green Version]
  21. Cankorur-Cetinkaya, A.; Dereli, E.; Eraslan, S.; Karabekmez, E.; Dikicioglu, D.; Kirdar, B. A Novel Strategy for Selection and Validation of Reference Genes in Dynamic Multidimensional Experimental Design in Yeast. PLoS ONE 2012, 7, e38351. [Google Scholar] [CrossRef]
  22. Nadai, C.; Campanaro, S.; Giacomini, A.; Corich, V. Selection and Validation of Reference Genes for Quantitative Real-Time PCR Studies during Saccharomyces cerevisiae Alcoholic Fermentation in the Presence of Sulfite. Int. J. Food Microbiol. 2015, 215, 49–56. [Google Scholar] [CrossRef]
  23. Rossignol, T.; Dulau, L.; Julien, A.; Blondin, B. Genome-Wide Monitoring of Wine Yeast Gene Expression during Alcoholic Fermentation. Yeast 2003, 20, 1369–1385. [Google Scholar] [CrossRef] [PubMed]
  24. Vendramini, C.; Beltran, G.; Nadai, C.; Giacomini, A.; Mas, A.; Corich, V. The Role of Nitrogen Uptake on the Competition Ability of Three Vineyard Saccharomyces cerevisiae Strains. Int. J. Food Microbiol. 2017, 258, 1–11. [Google Scholar] [CrossRef] [PubMed] [Green Version]
  25. Zaman, S.; Lippman, S.I.; Schneper, L.; Slonim, N.; Broach, J.R. Glucose Regulates Transcription in Yeast through a Network of Signaling Pathways. Mol. Syst. Biol. 2009, 5, 245. [Google Scholar] [CrossRef] [PubMed] [Green Version]
  26. Perez, M.; Luyten, K.; Michel, R.; Riou, C.; Blondin, B. Analysis of Hexose Carrier Expression during Wine Fermentation: Both Low- and High-Affinity Hxt Transporters Are Expressed. FEMS Yeast Res. 2005, 5, 351–361. [Google Scholar] [CrossRef] [PubMed] [Green Version]
  27. Reifenberger, E.; Boles, E.; Ciriacy, M. Kinetic Characterization of Individual Hexose Transporters of Saccharomyces cerevisiae and Their Relation to the Triggering Mechanisms of Glucose Repression. Eur. J. Biochem. 1997, 245, 324–333. [Google Scholar] [CrossRef]
  28. Horák, J. Regulations of Sugar Transporters: Insights from Yeast. Curr. Genet. 2013, 59, 1–31. [Google Scholar] [CrossRef]
  29. Leandro, M.J.; Sychrová, H.; Prista, C.; Loureiro-Dias, M.C. ZrFsy1, a High-Affinity Fructose/H+ Symporter from Fructophilic Yeast Zygosaccharomyces rouxii. PLoS ONE 2013, 8, e68165. [Google Scholar] [CrossRef] [Green Version]
  30. Leandro, M.J.; Fonseca, C.; Gonçalves, P. Hexose and Pentose Transport in Ascomycetous Yeasts: An Overview. FEMS Yeast Res. 2009, 9, 511–525. [Google Scholar] [CrossRef] [PubMed] [Green Version]
  31. Wieczorke, R.; Krampe, S.; Weierstall, T.; Freidel, K.; Hollenberg, C.P.; Boles, E. Concurrent Knock-out of at Least 20 Transporter Genes Is Required to Block Uptake of Hexoses in Saccharomyces cerevisiae. FEBS Lett. 1999, 464, 123–128. [Google Scholar] [CrossRef] [Green Version]
  32. Özcan, S.; Johnston, M. Function and Regulation of Yeast Hexose Transporters. Microbiol. Mol. Biol. Rev. 1999, 63, 554–569. [Google Scholar] [CrossRef] [PubMed] [Green Version]
  33. Diderich, J.A.; Merijn Schuurmans, J.; Van Gaalen, M.C.; Kruckeberg, A.L.; Van Dam, K. Functional Analysis of the Hexose Transporter Homologue HXT5 in Saccharomyces cerevisiae. Yeast 2001, 18, 1515–1524. [Google Scholar] [CrossRef] [PubMed]
  34. Verwaal, R.; Paalman, J.W.G.; Hogenkamp, A.; Verkleij, A.J.; Verrips, C.T.; Boonstra, J. HXT5 Expression is Determined by Growth Rates in Saccharomyces cerevisiae. Yeast 2002, 19, 1029–1038. [Google Scholar] [CrossRef] [PubMed] [Green Version]
  35. Buziol, S.; Becker, J.; Baumeister, A.; Jung, S.; Mauch, K.; Reuss, M.; Boles, E. Determination of in Vivo Kinetics of the Starvation-Induced Hxt5 Glucose Transporter Of. FEMS Yeast Res. 2002, 2, 283–291. [Google Scholar] [CrossRef] [Green Version]
  36. Maier, A.; Völker, B.; Boles, E.; Fuhrmann, G.F. Characterisation of Glucose Transport in Saccharomyces cerevisiae with Plasma Membrane Vesicles (Countertransport) and Intact Cells (Initial Uptake) with Single Hxt1, Hxt2, Hxt3, Hxt4, Hxt6, Hxt7 or Gal2 Transporters. FEMS Yeast Res. 2002, 2, 539–550. [Google Scholar] [CrossRef] [PubMed] [Green Version]
  37. Ozcan, S.; Johnston, M. Two Different Repressors Collaborate to Restrict Expression of the Yeast Glucose Transporter Genes HXT2 and HXT4 to Low Levels of Glucose. Mol. Cell Biol. 1996, 16, 5536–5545. [Google Scholar] [CrossRef] [Green Version]
  38. Ozcan, S.; Johnston, M. Three Different Regulatory Mechanisms Enable Yeast Hexose Transporter (HXT) Genes to Be Induced by Different Levels of Glucose. Mol. Cell Biol. 1995, 15, 1564–1572. [Google Scholar] [CrossRef] [Green Version]
  39. Gonçalves, P.; Rodrigues de Sousa, H.; Spencer-Martins, I. FSY1, a Novel Gene Encoding a Specific Fructose/H+ Symporter in the Type Strain of Saccharomyces carlsbergensis. J. Bacteriol. 2000, 182, 5628–5630. [Google Scholar] [CrossRef] [Green Version]
  40. Varela, C.; Cárdenas, J.; Melo, F.; Agosin, E. Quantitative Analysis of Wine Yeast Gene Expression Profiles under Winemaking Conditions: Gene Expression ‘in’ Wine Fermentation. Yeast 2005, 22, 369–383. [Google Scholar] [CrossRef]
  41. Bisson, L. Stuck and Sluggish Fermentations. Am. J. Enol. Vitic. 1999, 50, 107–119. [Google Scholar]
  42. Pritchard, L.; Kell, D.B. Schemes of Flux Control in a Model of Saccharomyces cerevisiae Glycolysis: Flux Control in Yeast Glycolysis. Europ. J. Biochem. 2002, 269, 3894–3904. [Google Scholar] [CrossRef] [PubMed] [Green Version]
  43. Kayikci, Ö.; Nielsen, J. Glucose Repression in Saccharomyces Cerevisiae. FEMS Yeast Res. 2015, 15, fov068. [Google Scholar] [CrossRef] [Green Version]
  44. Treu, L.; Campanaro, S.; Nadai, C.; Toniolo, C.; Nardi, T.; Giacomini, A.; Valle, G.; Blondin, B.; Corich, V. Oxidative Stress Response and Nitrogen Utilization Are Strongly Variable in Saccharomyces cerevisiae Wine Strains with Different Fermentation Performances. Appl. Microbiol. Biotechnol. 2014, 98, 4119–4135. [Google Scholar] [CrossRef]
  45. Jordan, P.; Choe, J.-Y.; Boles, E.; Oreb, M. Hxt13, Hxt15, Hxt16 and Hxt17 from Saccharomyces cerevisiae Represent a Novel Type of Polyol Transporters. Sci. Rep. 2016, 6, 23502. [Google Scholar] [CrossRef] [PubMed] [Green Version]
Figure 1. CO2 production kinetics of strains R008 (), R31.3 (), P301.9 (), and EC1118 (). Data of dCO2/dt are the average of three biological replicates.
Fermentation 07 00164 g001
Figure 2. Gene expression pattern of hexose transporters. Letters indicate significant differences in the gene expression values obtained from ANOVA analysis of variance followed by the Tukey post-hoc test between the strains, at 45 or 60 g/L of CO2 (alpha = 0.05). (***) p < 0.001, (**) p < 0.01, (*) p < 0.05 between gene expression values at 45 and 60 g/L of produced CO2 by Student’s t test for each yeast strain.
Fermentation 07 00164 g002aFermentation 07 00164 g002b
Figure 3. Different utilization of the tested hexose transporter genes among yeast strains. Data per each gene are expressed as percentage calculated on the total expression, for each strain and time point (45–60 g/L of produced CO2). The difference between the total expression values from 45 to 60 g/L of produced CO2 is reported as percentage of variation.
Fermentation 07 00164 g003
Table 1. List of the investigated genes and details of primers and amplicons for each gene.
GeneMolecular Function
(SGD Curated)
Primer Sequence
[5′ → 3′]
Amplicon LengthEfficiency %R2
HXT1HeXose Transporter (low-affinity glucose transporter)F: 5′-GAA GCT GGC AGA ATC GAC GA-3′71 bp102.90.996
R: 5′-TAT GGA TGG TCA GGT GGG CA-3′
HXT2HeXose Transporter (high-affinity glucose transporter)F: 5′-TGA ACT CCC AGC AAA GCC AA-3′90 bp104.90.992
R: 5′-TCC CAA CCA AAG ACA AAC CCA-3′
HXT3HeXose Transporter (low affinity glucose transporter)F: 5′-CAC GTT ATT TGG TTG AAG CTG GT-3′93 bp101.30.998
R: 5′-GTT GAA TGA ATG GAT GGT CTG GG-3′
HXT4HeXose Transporter (high-affinity glucose transporter)F: 5′-TGG TGG TAT GAC ATT CGT TCC-3′101 bp104.70.989
R: 5′-CGC TGA CCT TAT TTG AAA GAG CA-3′
HXT5HeXose Transporter (moderate affinity for glucose)F: 5′-TCC AAA TCG CCT CCA TTG ACA-3′77 bp102.50.983
R: 5′-AAT ACC ACC AAC GCC CAG TC-3′
HXT6/7HeXose Transporter (high-affinity glucose transporter)F: 5′-GAC TTT GGA AGA AGT CAA CAC CA-3′106 bp100.00.998
R: 5′-TTC TTC AGC GTC GTA GTT GGC-3′
HXT8Protein of unknown function with similarity to hexose transportersF: 5′-AAT TCT GTC CAG TGG CGT GT-3′81 bp95.20.991
R: 5′-CGG AAC AAA CGT CAT ACC ACC-3′
FSY1Fructose/H+ symporter (Galeote et al., 2010)F: 5′-CGA TGT TAA AGG CGG GTG GA-3′98 bp95.10.989
R: 5′-AAC GTG GTG ACT CGG GTA AG-3′
GAL2GALactose metabolism (also able to transport glucose)F: 5′-GGG TCT GAA GGC TCC CAA AG-3′85 bp104.70.981
R: 5′-ACA AAC AAA GCA AGG AAA CGG T-3′
Table 2. List of the reference genes and details of primers and amplicons for each gene.
GeneReferencePrimer Sequence [5′ → 3′]Amplicon LengthEfficiency %R2
ALG9[20]F: 5′-CAC GGA TAG TGG CTT TGG TGA ACA ATT AC-3′156 bp95.70.996
R: 5′-TAT GAT TAT CTG GCA GCA GGA AAG AAC TTG GG-3′
UBC6[20]F: 5′-GAT ACT TGG AAT CCT GGC TGG TCT GTC TC-3′272 bp99.00.985
R: 5′-AAA GGG TCT TCT GTT TCA TCA CCT GTA TTT GC-3′
FBA1[21]F: 5′-GGT TTG TAC GCT GGT GAC ATC GC-3′125 bp102.40.998
R: 5′-CCG GAA CCA CCG TGG AAG ACC A-3′
PFK1[22]F: 5′-GAG GTT GAT GCT TCT GGG TTC CGT-3′138 bp97.70.998
R: 5′-TGT GGC GGT TTC GTT GGT GTC G-3′
Table 3. Parameters of the fermentation kinetics.
StrainCO2 Production Peak (g/L/hours)Peak Time (hours)Sampling Time 45 g/L (hours)Sampling Time 60 g/L (hours)Fermentation Time (hours)
EC11181.53 ± 0.05 A16.75 ± 0.85 B50.3 ± 2.7 A73.9 ± 3.7 B110.2 ± 1.7 A
R0081.76 ± 0.00 B14.91 ± 0.33 A46.3 ± 4.9 A67.5 ± 3.1 AB156.9 ± 1.0 C
R31.31.76 ± 0.05 B14.08 ± 1.08 A41.8 ± 1.2 A64.6 ± 1.2 A134.9 ± 4.2 B
P301.91.93 ± 0.05 C15.58 ± 0.84 AB43.2 ± 4.1 A63.5 ± 1.5 A131.7 ± 4.2 B
Data are expressed as the average of three biological replicates ± standard deviation. Uppercase letters indicate significant differences obtained from Tuckey post-hoc test after ANOVA analysis of variance between the strains (alpha = 0.05).
Table 4. Ethanol and sugar residues at the end of the fermentations.
Ethanol (% vol.)Glucose (g/L)Fructose (g/L)
EC111811.49 ± 0.04 Bndnd
P301.911.45 ± 0.04 Bndnd
R31.311.38 ± 0.26 Bndnd
R00810.64 ± 0.07 And7.62 ± 0.04
Data are expressed as the average of three biological replicates ± standard deviation. Uppercase letters indicate significant differences obtained from Tuckey post-hoc test after ANOVA analysis of variance between the strains (alpha = 0.05). nd: not detected.
Table 5. Fructose/total sugars ration and amino nitrogen residue at 45 and 60 g/l of produced CO2.
Fructose/Total Sugars (%)NH2 (mg/L)
45 g/L60 g/Lp45 g/L60 g/L
EC111860.30 ± 0.43 A66.87 ± 0.70 A<0.0001 ***61.17 ± 2.3559.87 ± 3.10Ns
R00866.05 ± 0.29 B74.97 ± 1.65 B0.012 *55.75 ± 1.9563.10 ± 1.70*
R31.367.01 ± 1.08 B79.27 ± 1.84 B0.016 *51.93 ± 7.3556.57 ± 6.33*
P301.966.56 ± 0.74 B76.67 ± 1.72 B0.002 **38.03 ± 4.2939.20 ± 3.21Ns
Data are expressed as the average of three biological replicates ± standard deviation. Uppercase letters indicate significant differences obtained from Tukey post-hoc test after ANOVA analysis of variance between the strains (alpha = 0.05). (***) p < 0.001, (**) p < 0.01, (*) p < 0.05, Ns (not significative) between the percentage of fructose on total sugar residue at 45 and 60 g/L of produced CO2 by Student’s t test.
Table 6. Normalized expression of hexose transporter genes.
GeneStrain45 g/L of CO2 Produced60 g/L of CO2 Produced
GAL2EC11182.660 ± 0.655C1.533 ± 0.434B
R0080.775 ± 0.184A0.465 ± 0.082A
R31.31.801 ± 0.519B0.851 ± 0.521A
P301.90.862 ± 0.236A0.914 ± 0.131AB
HXT1EC11180.925 ± 0.239B0.771 ± 0.130B
R0080.996 ± 0.125B1.072 ± 0.116BC
R31.30.475 ± 0.045A0.356 ± 0.075A
P301.90.849 ± 0.111B1.300 ± 0.254C
HXT2EC11181.364 ± 0.565B0.536 ± 0.385B
R0080.304 ± 0.198A0.089 ± 0.017A
R31.30.399 ± 0.044A0.084 ± 0.045A
P301.90.181 ± 0.052A0.167 ± 0.035A
HXT3EC11183.004 ± 0.977B1.385 ± 0.134BC
R0081.257 ± 0.106A1.031 ± 0.123AB
R31.31.454 ± 0.395A0.648 ± 0.101A
P301.91.117 ± 0.183A1.662 ± 0.399C
HXT4EC11181.642 ± 0.455C1.090 ± 0.224C
R0080.578 ± 0.234A0.640 ± 0.126B
R31.31.065 ± 0.230B0.240 ± 0.128A
P301.90.686 ± 0.194AB1.209 ± 0.474C
HXT5EC11181.028 ± 0.466B0.859 ± 0.257A
R0080.806 ± 0.281AB1.673 ± 0.754A
R31.30.731 ± 0.158AB3.341 ± 1.546B
P301.90.505 ± 0.116B1.301 ± 0.338A
HXT6/7EC11182.252 ± 0.181C1.439 ± 0.050A
R0081.045 ± 0.129A1.502 ± 0.499A
R31.31.511 ± 0.447B2.782 ± 0.938B
P301.91.267 ± 0.277AB1.931 ± 0.613AB
HXT8EC11181.354 ± 0.496B2.430 ± 0.870B
R0080.593 ± 0.097A0.862 ± 0.314A
R31.31.613 ± 0.390B2.782 ± 1.106B
P301.90.606 ± 0.213A1.289 ± 0.692A
P301_O30021EC11181.254 ± 0.496A0.712 ± 0.256A
R31.31.709 ± 0.308A3.164 ± 1.018B
P301.91.617 ± 0.203A3.301 ± 0.727B
Uppercase letters indicate significant differences in the gene expression values obtained from ANOVA analysis of variance followed by the Tukey post-hoc test between the strains, at 45 or 60 g/L of CO2 (alpha = 0.05).
Publisher’s Note: MDPI stays neutral with regard to jurisdictional claims in published maps and institutional affiliations.

