Article

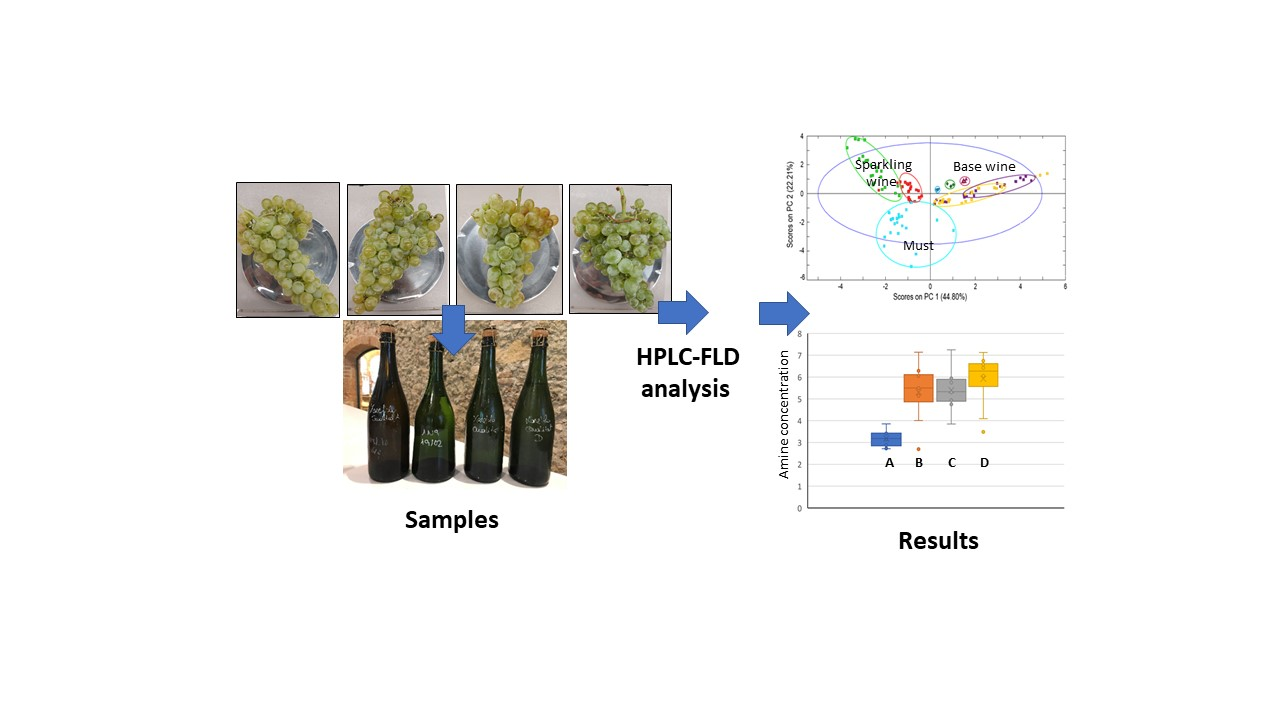
Oenological Processes and Product Qualities in the Elaboration of Sparkling Wines Determine the Biogenic Amine Content

by
Aina Mir-Cerdà
1,
Anaïs Izquierdo-Llopart
1,
Javier Saurina
1,* and
Sonia Sentellas
1,2
1
Department of Chemical Engineering and Analytical Chemistry, University of Barcelona, 08028 Barcelona, Spain
2
Serra Húnter Lecturer, Generalitat de Catalunya, 08007 Barcelona, Spain
*
Author to whom correspondence should be addressed.
Fermentation 2021, 7(3), 144; https://doi.org/10.3390/fermentation7030144
Submission received: 28 June 2021 / Revised: 30 July 2021 / Accepted: 30 July 2021 / Published: 4 August 2021
(This article belongs to the Special Issue Implementation of Digital Technologies on Beverage Fermentation)

Abstract

:
The biogenic amine (BA) content in wines is dependent on the fermentation processes and other oenological practices, as well as on grape quality. These compounds can participate in different cellular functions in humans; however, the intake of high amounts can provoke some toxicological effects. For that reason, controlling the evolution of biogenic amines in wine production processes is of extreme importance. This work aims to assess the occurrence of biogenic amines in sparkling wines and related samples, including musts, base wines, stabilized wines, and three-month and seven-month aged sparkling wines obtained from Pinot Noir and Xarel lo grape varieties. The determination of BA content relies on liquid chromatography with fluorescence detection (HPLC–FLD) with precolumn derivatization of analytes with dansyl chloride. The analysis has shown that putrescine is the most abundant amine in these types of samples. Ethanolamine, tyramine, spermine, and histamine concentrations are also remarkable. Principal component analysis has been applied to try to extract featured information concerning overall patterns dealing with wine production steps and qualities. Interesting conclusions have been drawn on BA formation depending on different factors. BA concentrations are quite low in must but rise, especially after the first alcoholic fermentation. Moreover, BA levels are much lower in the range of products elaborated with grapes of the best qualities while they significantly increase when using grapes of lower qualities. The results obtained pointed out the analytical potential of using BAs to control the quality of wine and its production processes, thus providing valuable information for both wineries and consumers.

Graphical Abstract

1. Introduction

Biogenic amines (BAs) are low molecular nitrogenous compounds present in different types of food, but are especially abundant in wine, cheese, meat, and fish as well as in spoiled products [1,2,3,4]. In addition, the presence of high amounts of BAs in foods can be a sign of processing under poor hygiene conditions [5].
BAs are bioactive compounds that can participate in different cellular functions of humans but toxicological problems, such as migraines, headaches, hypo- or hypertension, effects on the vascular or nervous system, and even anaphylactic shocks, can occur when ingested in high concentrations [4,6]. More specifically, histamine has been extensively studied because it can be related to most biogenic amine foodborne intoxication, causing headaches, hypotension, and digestive problems. Histamine, together with other amines such as tyramine and serotonin, can also affect, directly or indirectly, the human vascular and nervous system. Aromatic amines (tyramine and phenylethylamine) can cause migraines and hypertension. Moreover, tyramine, tryptamine, and phenylethylamine show vasoconstrictor activity while others (histamine and serotonin) present a vasodilator effect. Psychoactive amines, like dopamine and serotonin, are neurotransmitters of the central nervous system, while tyramine and histamine act as hormonal mediators in humans and animals. As a complementary aspect, some BA can react with nitrite to generate carcinogenic nitrosamines [7,8,9]. Finally, it is worth mentioning that the presence of ethanol in alcoholic beverages may potentiate BA toxicological effects due to the inhibition of amino oxidases which are the enzymes responsible for their metabolism. As far as we know, legislation concerning BA in foods and beverages does not exist and just some recommendations regarding the upper limit for histamine are given, in general in the range from 2 mg to 8 mg L−1 [10]. Therefore, effective and selective methods are required for the determination of these amines in food products to assess their quality and avoid the commercialization of dangerous or spoiled foodstuffs [11,12,13,14].
Sparkling wine (cava) is generally elaborated using the traditional Champenoise method [15,16,17] from white or rosé base wines. When grapes arrive at the cellar, they are carefully pressed in batches separated by variety and quality to produce the must. Next, the alcoholic fermentation is developed in stainless steel tanks from 15 to 18 °C, thus resulting in the base wine. If necessary, malolactic fermentation (MLF) is applied after this step. Subsequently, different base wines are blended depending on the sparkling wine to be produced and the mix is clarified and stabilized to avoid further precipitation of tartrate salts. The key step in the elaboration of a cava is the second fermentation that takes place in the bottle, triggered by adding the tirage liquor—a mixture of wine, sugars, and yeasts—to the stabilized base wine. Cava is aged in contact with the yeast for at least a minimum of nine months before its commercialization to consolidate its organoleptic features [15].
Cava is mainly produced from the classical Catalonian varieties of white grapes Macabeu, Xarel lo, and Parellada. In recent years, however, other white (e.g., Chardonnay) and red varieties (e.g., Pinot Noir) have been introduced as well [18]. Xarel lo and Pinot Noir varieties have been selected for this study. Xarel lo is characterized by medium-sized and round white grapes with thin skin. It offers freshness, acidity, and high alcohol content, thus resulting in an excellent grape variety for long-aged wines. Pinot Noir is a typical French grape: small, round, and with an intense violet color. It gives aroma and color to the product and promotes the formation of bubbles in the sparkling wine cup.
BA concentrations may provide valuable information regarding the quality of cava as well as the fermentation processes underwent during its production. This issue has been scarcely studied [19,20,21,22,23]. Furthermore, interesting conclusions have been extracted, indicating that BA content is low in the must and more remarkable after fermentations. The content of amino acids and biogenic amines in wine depends on agricultural practices involved in the production of the grapes as well as on the vinification and aging processes. Nitrogen fertilization of the soil, poor health status of the grape due to molds, and the high must pH are factors that can favor the moderate occurrence of biogenic amines in the must. Subsequently, during alcoholic and malolactic fermentation, the presence of certain yeasts and bacteria significantly increases BA content in wine. BAs are generated by the decarboxylation of specific amino acids by the action of microorganisms. The activity of decarboxylases under the specific conditions of pH, temperature, etc., will determine the amount of BA produced, which can vary substantially depending on the oenological conditions and, especially, on microorganisms and strains used in the fermentation processes. In addition, it is worth highlighting the high stability of these compounds once generated. The most abundant BA in wines is, in general, putrescine, ethanolamine, tyramine, and histamine [24,25,26]. As commented, beyond toxicological and quality issues, the role of BAs as descriptors of different wine features should not be underestimated. For instance, Garcia-Villar et al. concluded that this family of components could be used as a source of information to classify wines according to aging into young, crianza, reserve, and grand reserve classes [27]. Conclusions on the grape varieties could be extracted as well. For characterization purposes, modern analytical platforms offer excellent possibilities for the generation of great amounts of data, thus resulting in complex tables/datasets that should be conveniently interpreted to try to extract the underlying analytical information. In this regard, multivariate statistics and chemometric methods of analysis may be fundamental to achieve a comprehensive insight into the set of samples under study [24].
In this paper, the compositional profiles of BAs in various types of samples from sparkling wine (cava) production has been evaluated to try to extract information on the influence of different oenological factors such as winemaking steps, grape/wine quality, and variety. An HPLC–FLD method with offline derivatization with dansyl chloride (Dns-Cl) has been applied to determine the BA content. Once all of the samples have been analyzed, chemometric methods have been applied to find trends and descriptors within the groups of samples. As a result, data can be more effectively interpreted, and more solid and global conclusions can be extracted than when explored more conventionally.

2. Materials and Methods

2.1. Reagents

Formic acid (>96%, Merck KGaA, Darmstadt, Germany), phosphoric acid (85% w/w, Merck), acetonitrile (UHPLC PAI-ACS SuperGradient, Panreac, Castellar del Valles, Barcelona, Spain), methanol (UHPLC-Supergradient, Panreac ApplyChem, Castellar del Valles, Barcelona, Spain), and water (Elix3, Millipore, Bedford, MA, USA) were used to prepare the solvents and mobile phases of the chromatographic method.
Biogenic amines were obtained from the following sources: 1,5-diaminopentane (cadaverine, 98%), 1,4-diaminobutane dihydrochloride (putrescine, 99%), spermidine trihydrochloride (99%), and spermine tetrahydrochloride (99%) were from Alfa Aesar (Kandel, Germany); histamine hydrochloride (≥99%), 2-phenylethylamine hydrochloride (≥99%), tryptamine hydrochloride (≥98%), tyramine hydrochloride (≥97%), octopamine hydrochloride (≥99%), and agmatine sulfate (≥99%) were from Fluka (Buchs, Switzerland); ethanolamine hydrochloride (≥98%) and hexylamine (≥98%) were from TCI (Tokyo, Japan), the latter was used as the internal standard. Lysine monohydrochloride (99%) was obtained from Fluka (Buchs, Switzerland). Pure standard stock solutions of each amine at a concentration of 1000 mg L−1 were prepared in Milli-Q water. These stock solutions were stored at 4 °C until use and were used to prepare mixtures of the working standard solutions within a concentration range from 0.1 to 50 mg L−1.
Amines were derivatized with dansyl chloride (dansyl-Cl 98%, Thermo Fisher Scientific, Waltham, MA, USA). The reagent solution was prepared by dissolving 100 mg of dansyl-Cl in 10 mL of acetone (LichroSolv, Merck, Darmstadt, Germany). The buffer solution consisted of 0.1 mol L−1 sodium tetraborate (Analytical grade, Merck KGaA, Darmstadt, Germany). Chloroform (≥99.8%, Fluka, Buchs, Switzerland) was used for the extraction of derivatives.

2.2. Samples

A total of 40 samples including musts, wines, and sparkling wines were kindly provided by the Raventós Codorníu Group (Sant Sadurni d’Anoia, Spain), corresponding to white (from Xarel lo grapes) and rosé (from Pinot Noir grapes) cavas (vintage of 2020) produced in Penedès and Costers del Segre regions (both from Catalonia, Spain). For each variety, four musts, eight wines (four monovarietal and four stabilized), and eight sparkling wines (four of three months in rhyme and four of seven months) were available. In each class, four different qualities were defined according to the quality of grapes, namely: A, B, C, and D, with A referring to the best ones and D the ones of the lowest quality. The quality was ranked by the cava manufacturer and depended on multiple factors such as the type of soil, the type of grape plantation (ecological or conventional), the type of harvest and transport (manual for class A or mechanized for B, C, and D), the climatic conditions, the age of the vines, the yield of grapes obtained (ca. from 6000 for A to 10,000 kg per hectare or more for D), the type of yeasts, etc. Moreover, for grapes of C and D qualities, malolactic fermentation was required to reduce the wine acidity. More specific details on these issues were confidential and have not been provided by the company. Additional information on the codes of samples according to classes, qualities, and varieties is given in Table 1.
Samples were analyzed in triplicate, from three independent derivatization processes. Furthermore, quality control (QC) samples were prepared by mixing 50 µL of each must/wine/cava sample. Specific QC for Xarel lo and Pinot Noir samples were prepared as well. QCs were used to evaluate the reproducibility of the analytical methods and the significance of the PCA models.

2.3. Amine Derivatization

A precolumn offline derivatization was performed to enhance the sensitivity of the detection of the analytes as well as to facilitate their separation. The procedure described elsewhere was followed with some modifications [28,29,30,31]. Briefly, the reaction was carried out in a glass vial mixing a 250 µL biogenic amine standard (or sample) solution, 250 µL dansyl-Cl reagent solution, and 250 µL buffer solution. The reaction took place at pH 9.2 in a thermostatic water bath (Tectron 473-100, J.P. Selecta, Barcelona, Spain) for 60 min at 40 °C. Next, 750 µL of chloroform was added to the reaction vial and the solution was shaken for 10 min (Vortex 3 IKA, Staufen, Germany with a VG 3.31 Test tube attachment accessory) to extract derivatives from the mixture. Then the organic phase was separated. This extraction process was repeated 3 times to quantitatively extract the corresponding derivatives. Subsequently, the organic fractions were pooled, evaporated to dryness under a nitrogen current, and re-dissolved in 600 µL of acetonitrile/water (50:50, v/v). The resulting solutions were ready to be analyzed chromatographically.

2.4. Chromatographic Method

An Agilent 1100 Series HPLC instrument was used which was equipped with degasser (G1379A), binary pump (G1312A), automatic injector (G1392A), diode-array UV-vis detector (G1315B), and fluorescence detector (FLD, G1321A), all of them from Agilent Technologies (Waldbronn, Germany). Data were acquired and processed with Agilent Chemstation software (Rev. A 10.02).
Compounds were separated by reversed-phase mode using a Kinetex C18 column (150 mm × 2.6 mm I.D., 2.6 µm particle size) from Phenomenex (Torrance, CA, USA) and 0.1% (v:v) formic acid aqueous solution and acetonitrile (ACN) as the components of the mobile phase. The elution gradient profile was as follows: 0 to 14 min, 55 to 75% ACN; 14 to 20 min, 75 to 95% ACN; 20 to 22 min, 95% ACN (column cleaning); 22 to 22.1, 95 to 55% ACN; 22.1 to 25 min, 55% ACN (column stabilization). The flow rate was 0.7 mL min−1 and the injection volume was 10 µL. Chromatograms were acquired at 254 nm in the UV absorption detection mode and selecting 320/523 nm as the excitation and emission wavelength in FLD. Samples were analyzed randomly, and the QCs were repeatedly injected every 10 samples.
The LC–MS system used for structure confirmation was the Agilent 1100 Series liquid chromatograph—described above—coupled to an AB Sciex 4000 QTrap hybrid triple quadrupole/linear ion trap mass spectrometer (AB Sciex, Framingham, MA, USA). Chromatographic conditions were as indicated above. BA derivatives were detected in positive electrospray ionization (ESI) tandem mass spectrometry (MS/MS) in the multiple reaction monitoring (MRM) mode. The ion spray voltage was set at 4500 V. The source temperature was set at 500 °C. Nitrogen was used as nebulizer and auxiliary gas and was set at 10, 50, and 50 arbitrary units for the curtain gas, ion source gas 1 and ion source gas 2, respectively. Declustering potential (DP), collision energy (CE), collision exit cell potential (CXP), and ion transitions pairs were optimized for each analyte and are given in Table S1.

2.5. Data Analysis

The huge amount of information resulting from the analysis of the large set of samples required the application of multivariate methods such as Principal Component Analysis (PCA) for a more efficient recovery of the underlying chemical patterns related to the overall vinification process as well as each given stage or quality. The chemometric software used was the PLS-Toolbox for MATLAB (Mathworks, Natick, MA, USA). Other preliminary and statistical studies were carried out with Microsoft Excel (Microsoft, Redmon WA, USA). The resulting data, which consisted of concentrations of the biogenic amines in the different samples, was arranged in a matrix of responses (X matrix) in which each column corresponded to a given analyte and each row referred to a sample. As a result, dimensions of the X matrix were 135 × 11, for 120 samples plus 15 QCs and 11 amines, respectively (see structures of analytes in Figure S1 in Supplementary Material).
PCA is highly powerful and versatile for exploratory studies dealing with the influence of grape qualities and vinification process on the content of BAs. PCA allows the chemical information contained originally to be concentrated into the so-called principal components (PCs). Commonly, the scatter plot of scores, for instance of PC1 vs PC2, is used to find out some sample patterns that, in this case, could be related to features such as grape qualities, varieties, and winemaking practices. Complementarily, the plot of loadings may show relationships or correlations among variables (i.e., among the levels of BAs) and, even more importantly, it may reveal the most significant descriptors or biomarkers of the different sample classes. Additional information on PCA can be found elsewhere [32].

3. Results and Discussion

3.1. Method Development and Validation

The HPLC–FLD method used in this paper was based on previous publications [24,25,26,27]. Slight modifications in the experimental conditions were applied to adapt the separation to the current circumstances of the analytical column, the internal standard used to control the extraction step, and the sample matrix features. In particular, the elution gradient was optimized for the core-shell Kinetex C18 column to achieve a good chromatographic separation of common BA present on different kinds of fermented foodstuffs, with the minimum running time to speed up the analysis, which is especially critical when dealing with large sets of samples. Regarding the derivatization, it was confirmed by LC–MS (MRM mode) the formation of mono derivatives of ethanolamine, tryptamine, hexylamine, and phenylethylamine, di-dansyled derivatives for cadaverine, putrescine, histamine, agmatine and tyramine, and tri- and tetra-dansyled derivatives for spermidine and spermine, respectively (Table S1). As an example, Figure S2 shows the FLD chromatogram of a dansyl derivatized standard solution of amines at a concentration of 2 mg L−1 each. As can be seen, a good separation resolution among all the analytes was obtained in a reasonably short time of analysis (25 min, including column cleaning and conditioning steps).
In addition, the performance of the method was evaluated by estimating some quality parameters under the optimal conditions of the HPLC–FLD method (see Table 2). Results are summarized in Table S2 in the Supplementary Material. Briefly, the relationship between peak areas and concentrations was linear at least up to 20 mg L−1, with determination coefficients (R2) higher than 0.994. Limits of detection and quantification ranged from 0.006 (cadaverine) to 0.15 (tyramine) mg L−1 and from 0.021 to 0.49 mg L−1, respectively. In terms of repeatability, RSD values were below 0.4% for retention time and below 0.9% for peak areas. Compared with other existing methods for BA determination, the proposed one provides high sampling throughput, quite a low detection limit (for some analytes in the order of magnitude of 10 ng L−1 or below), and other remarkable figures of merit, thus being high, appropriate for the analysis of a large series of samples such as those generated in the quality control of cavas.

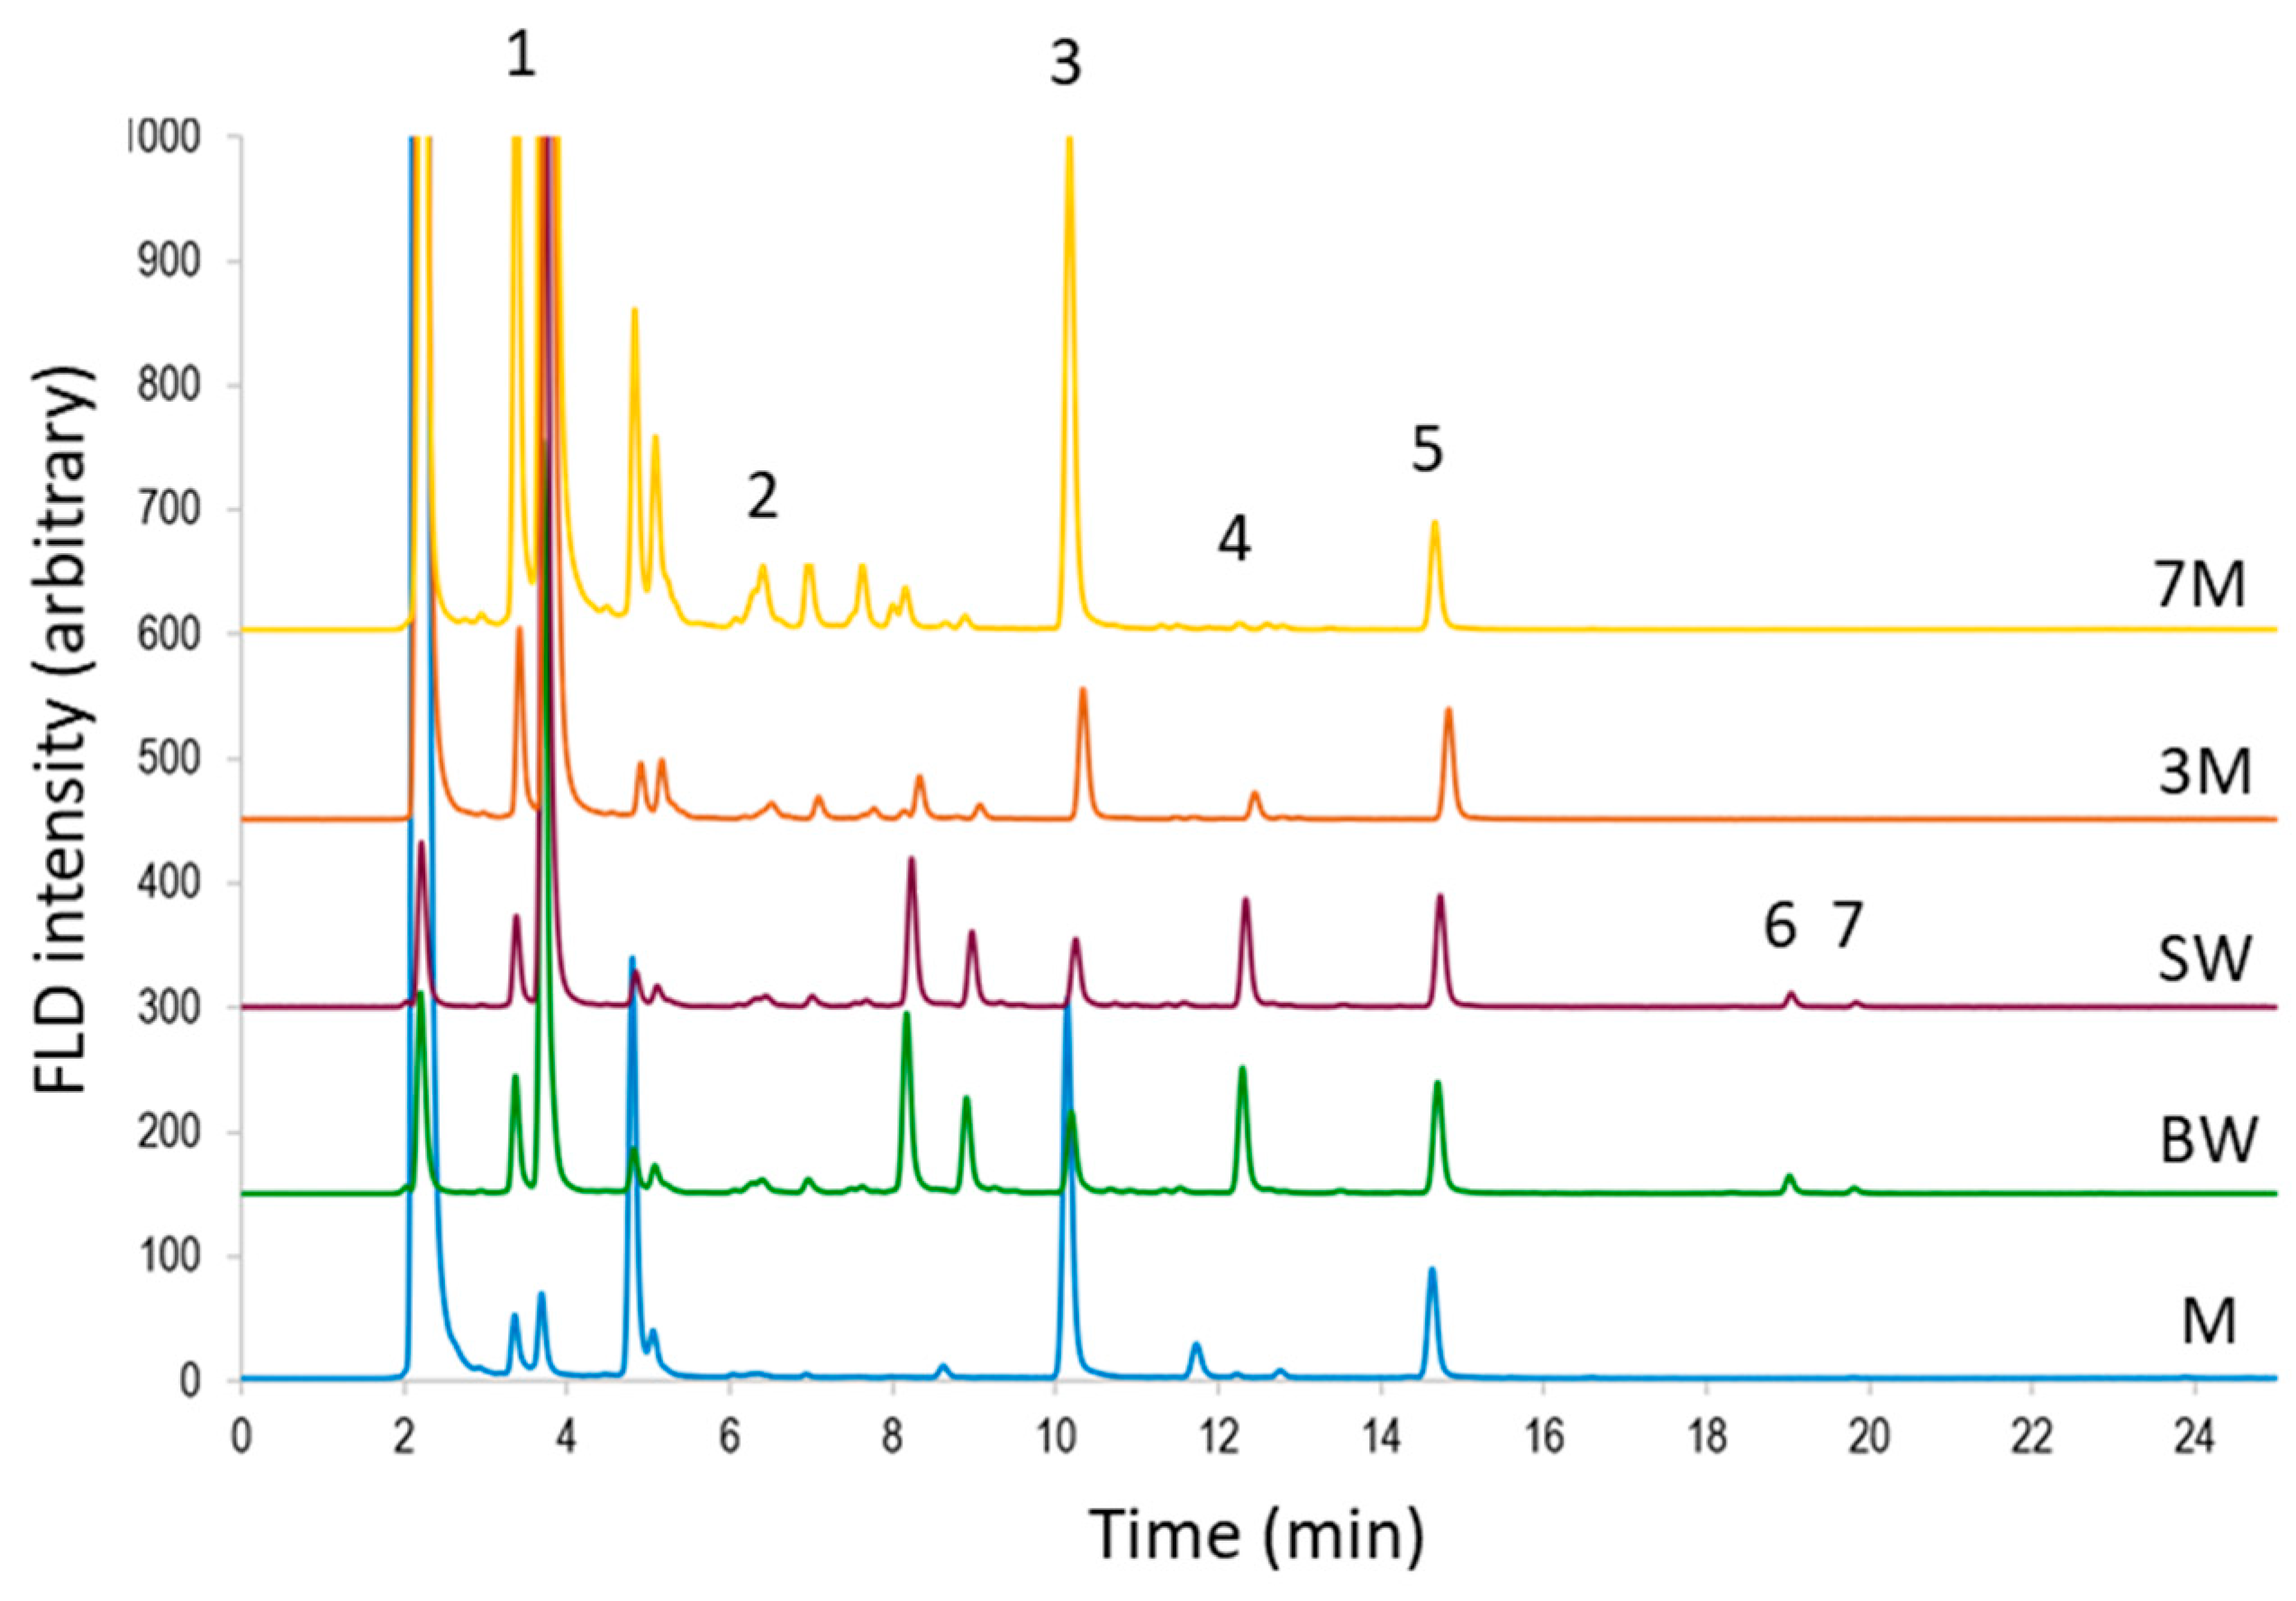
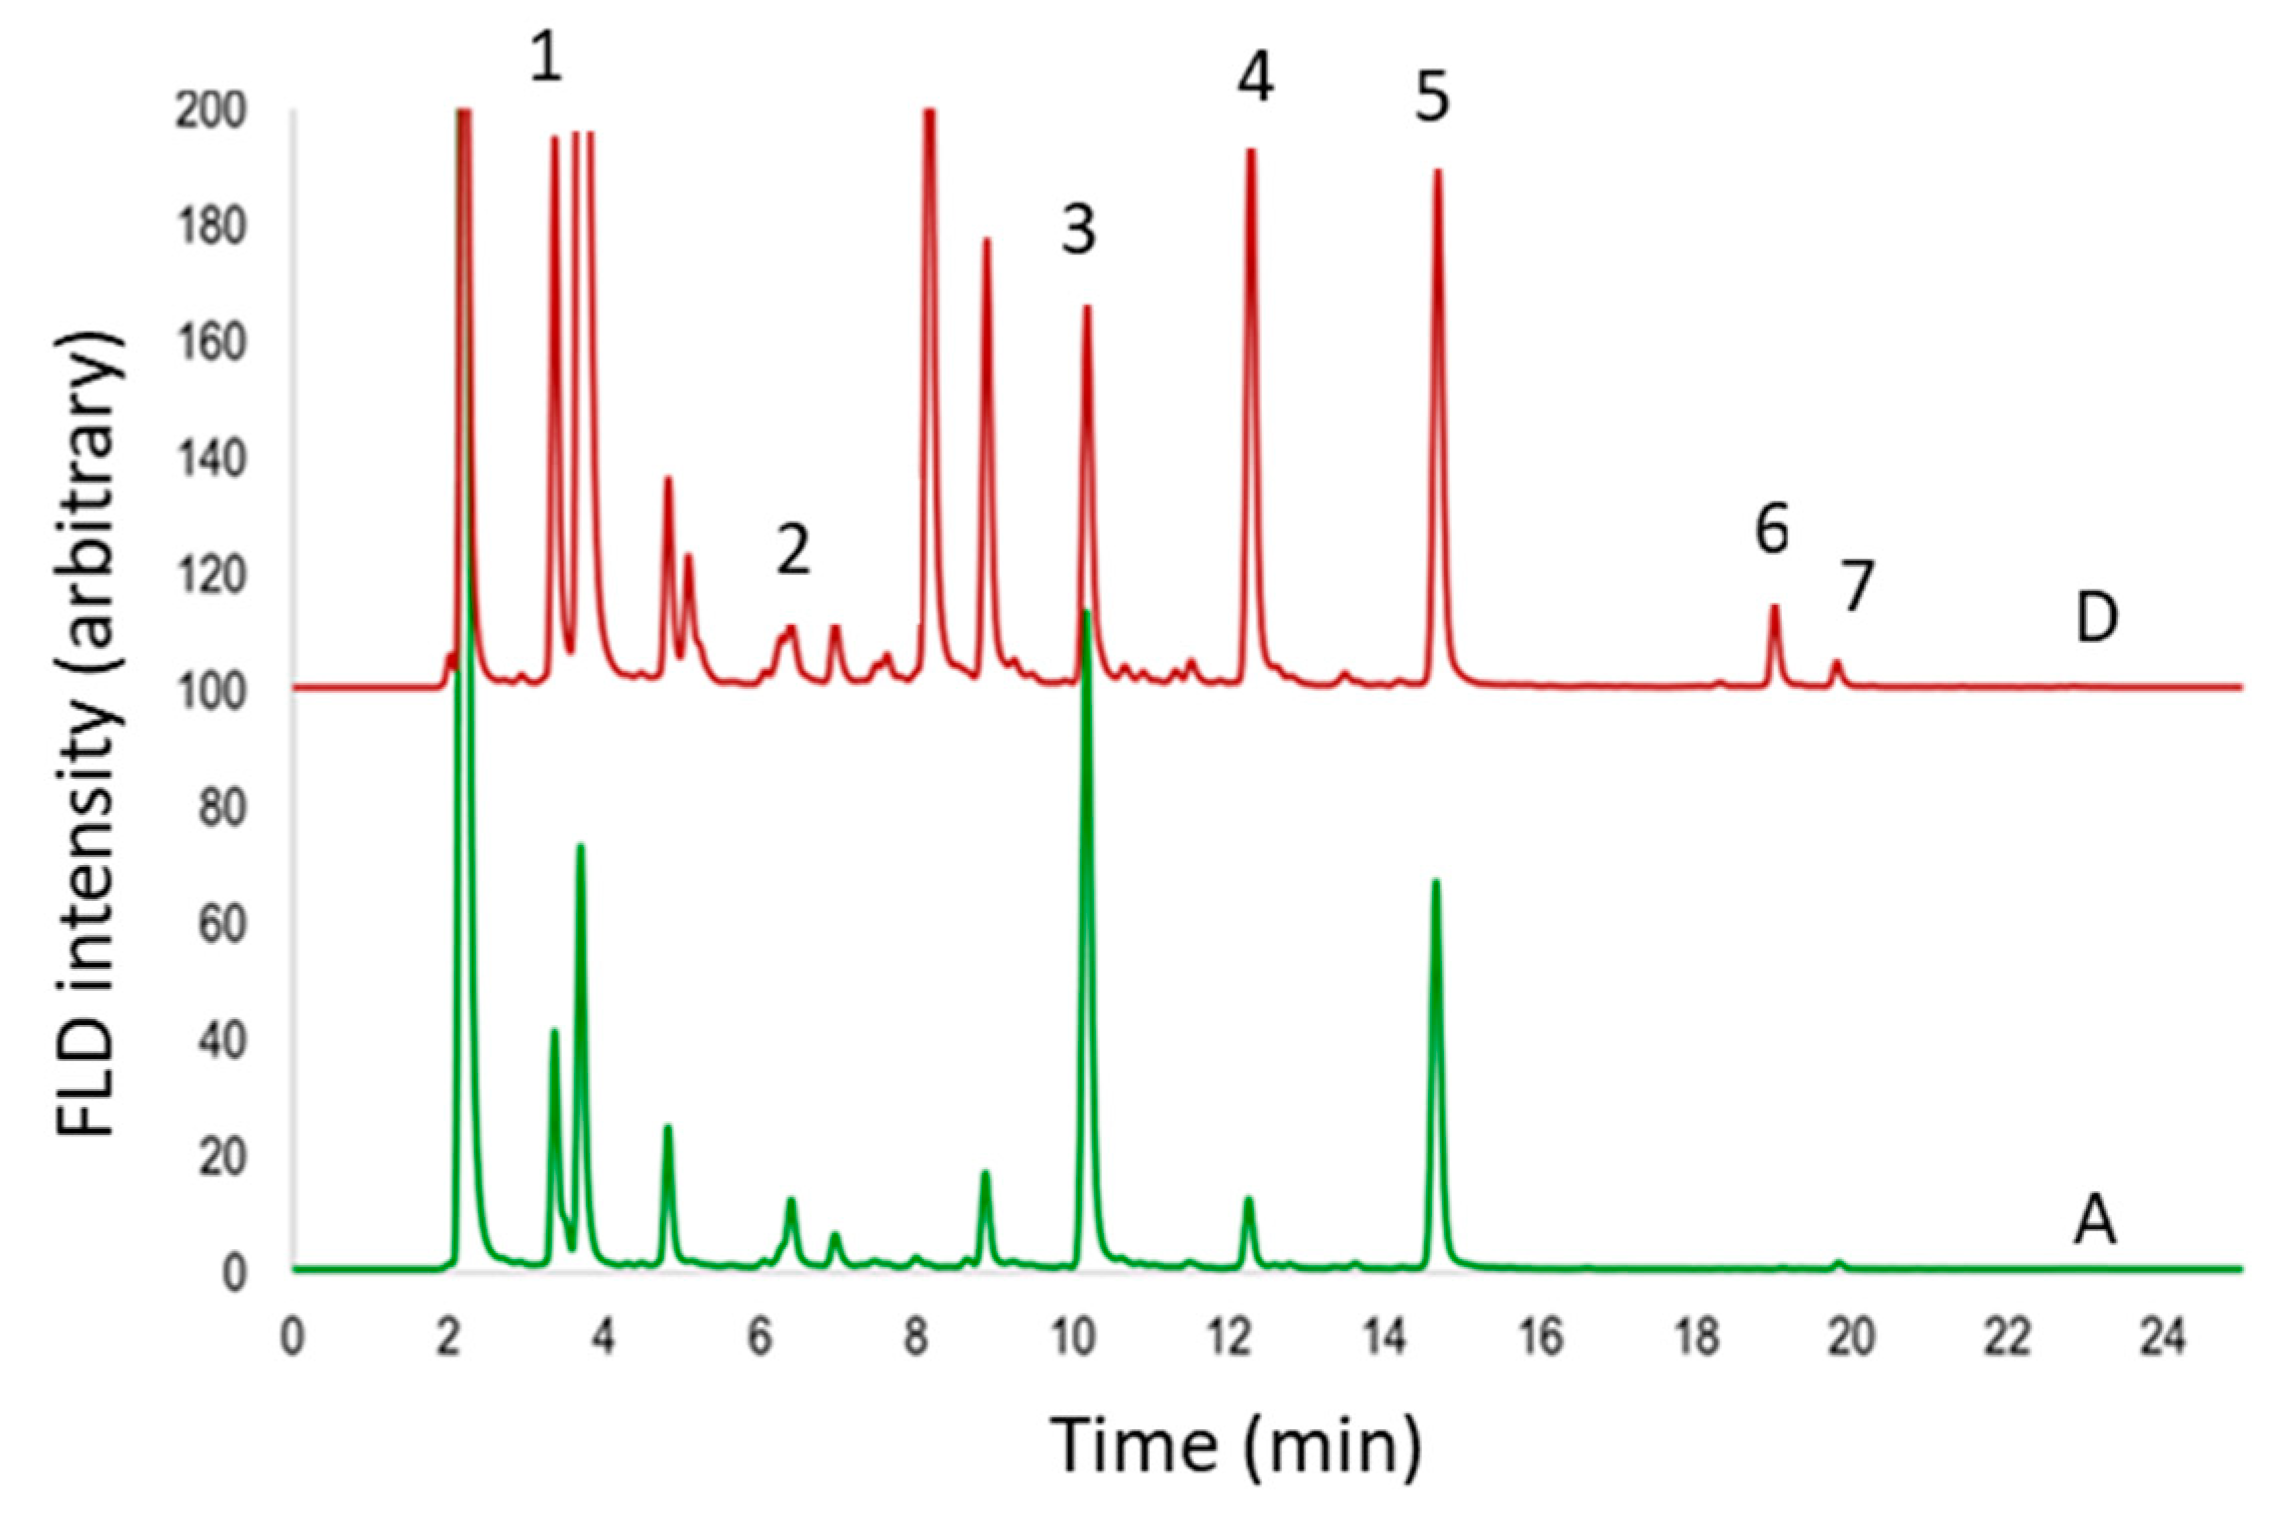
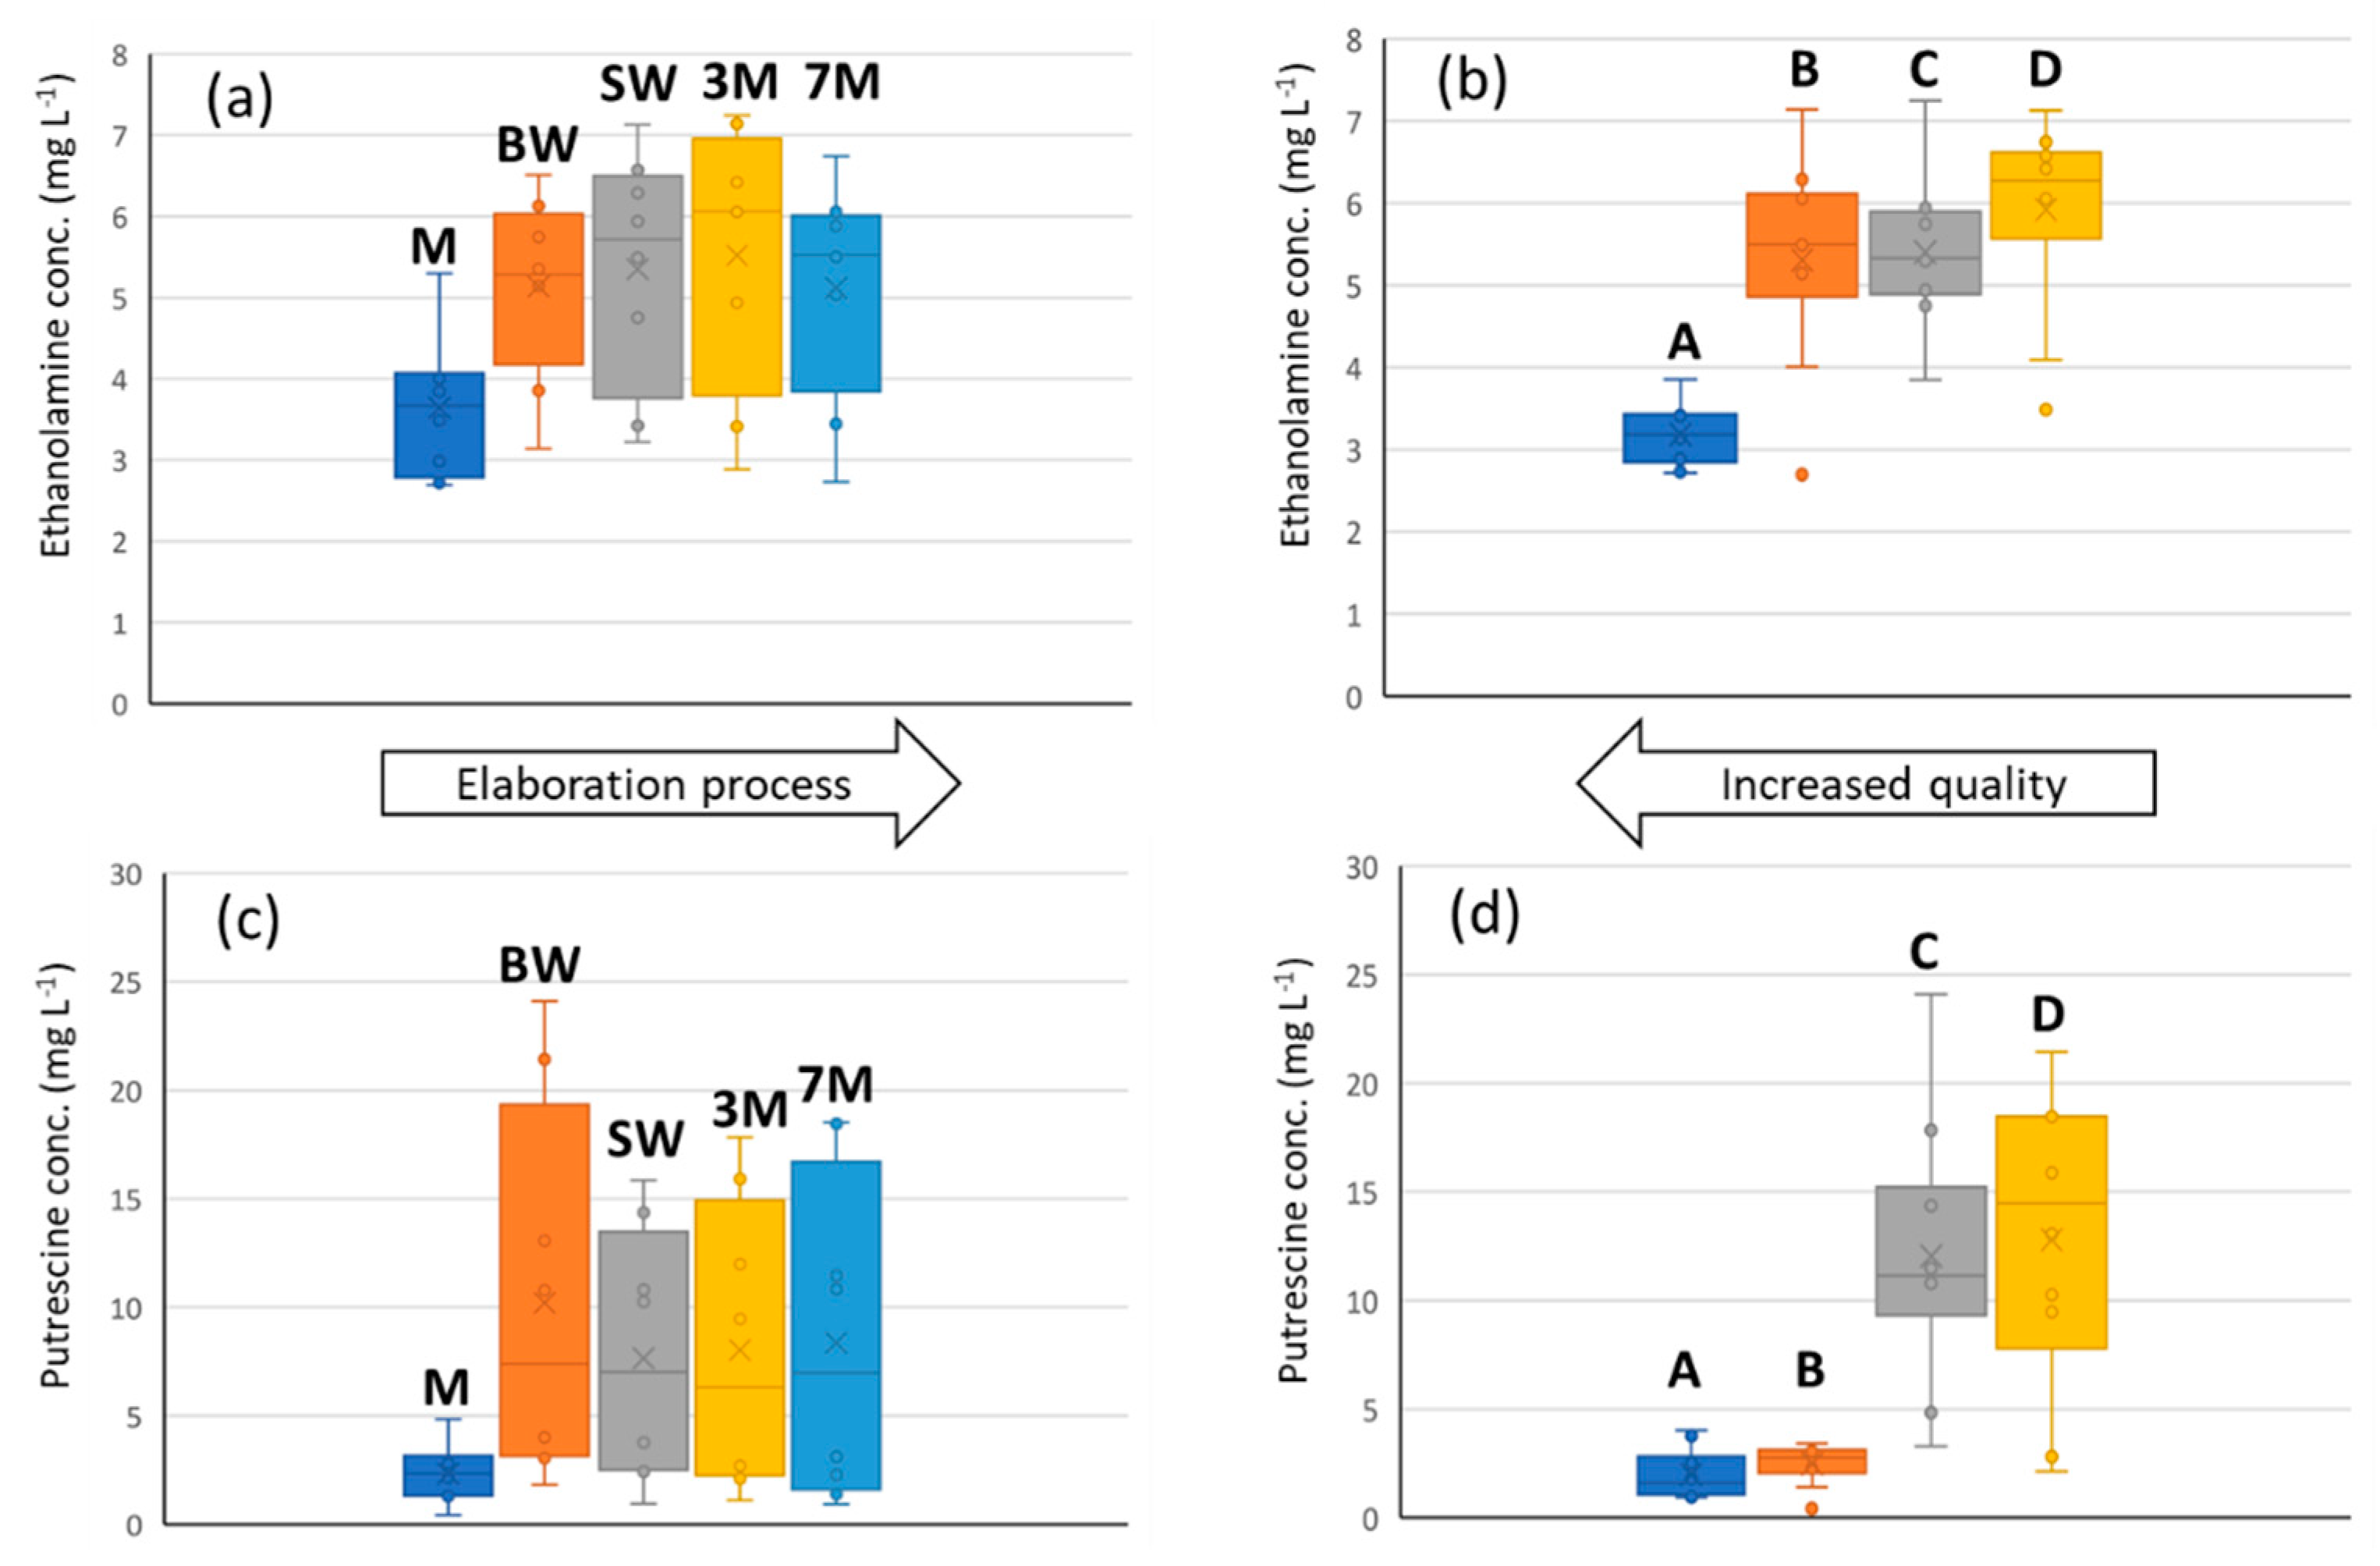
3.2. Sample Analysis

The set of 40 samples, including musts, base wines, stabilized wines, and aged sparkling wines, was analyzed according to the proposed HPLC–FLD method (see details in the experimental section). As an example, Figure 1 shows various representative FLD chromatograms of dansyled derivatives of Pinot Noir samples of quality D taken throughout the different vinification steps. Some remarkable differences can be observed suggesting the occurrence of important compositional changes associated with the processes. Furthermore, apart from biogenic amines, other peaks identified as derivatives of free amino acids were also detected in the chromatograms. These compounds appeared in the time range from 2 to 10 min with lysine, ornithine, cysteine, leucine/isoleucine, and phenylalanine being the most prominent ones.
A preliminary statistical analysis was performed by calculating the mean concentration and standard deviation of each amine in the full set of samples (Table S2). In terms of abundance and variability among classes, putrescine was the most remarkable amine, with an average concentration of 7 mg L−1 and a standard deviation of 6 mg L−1, meaning that putrescine concentrations varied dramatically depending on the oenological practices as well as on the grape quality. Ethanolamine was the second most abundant amine with an average concentration of 5 mg L−1 and a standard deviation of 1.5 mg L−1. Ethanolamine was even present at ca. 3 mg L−1 in the must samples. Tyramine, spermine, and histamine, with concentrations between 1 and 3 mg L−1 were also important quantitatively. Tyramine and histamine displayed interesting variations in their concentration levels as a function of sample type while spermine was quite homogeneous. Phenylethylamine, cadaverine, and spermidine occurred in amounts below 1 mg L−1; despite being trace amines, their potential descriptive ability should not be underestimated since variations in their profiles among sample classes were noticeable. Finally, agmatine was detected at concentrations of ca. 0.1 mg L−1 while tryptamine and octopamine were not detected.
A preliminary comparison of varieties showed that, in general, BA levels in Pinot Noir were higher than in Xarel lo. ANOVA studies showed that these differences were significant. For instance, for some representative amines such as ethanolamine and putrescine, p-values of 1.3 × 10⁻¹¹ and 3.1 × 10⁻¹⁵ were respectively obtained. Except for ethanolamine, this difference is more noticeable among base and stabilized wines as can be seen in Figure S3 showing the boxplots of the most important amines (ethanolamine, putrescine, histamine, and tyramine).
The first comparison of sample classes revealed that musts contained the lowest contents of biogenic amines, among which ethanolamine and putrescine occurred at levels higher than 1 mg L−1, while cadaverine, histamine, spermine, or agmatine if detected, were approximately 0.1 mg L−1. Samples of monovarietal base wines and stabilized wines displayed quite similar chromatographic profiles, with 2- to 4-fold higher concentrations of ethanolamine and putrescine, compared with musts with remarkable levels of histamine and tyramine (above 2 mg L−1) and smaller concentrations of the others. The rise in the concentrations of BAs in these two types of samples was attributed to the influence of alcoholic fermentation. In addition, samples elaborated with C and D qualities were subjected to malolactic fermentation (MLF) to reduce the tart character of wines while providing more creamy notes. During the transformation of malic acid to lactic acid, lactic bacteria also produce the decarboxylation of a percentage of free amino acids, thus MLF being one of the main processes contributing to the formation of BAs.
With regard to the further stages of cava elaboration, two different behaviors were observed depending on the amine. For ethanolamine, a slight increase in the amine levels after the second fermentation and during the aging process was found. In contrast, concentrations of putrescine, tyramine, putrescine, and histamine slightly decreased with aging after the second fermentation. Hence, a certain degradation of these amines with time was detected after the rise in the maximum levels at the stage of base wine.
As indicated above, apart from BAs, chromatograms of dansyl derivatives also showed several peaks corresponding to amino acids. The more polar nature of amino acid derivatives with respect to amines makes their elution faster, so most of them corresponded to those peaks in the time range from 2 to 10 min. Interestingly, as can be seen in Figure 1, one of the most outstanding peaks in the chromatograms, very abundant in all of the samples, corresponded to lysine (retention time 10.1 min) which is the precursor of cadaverine. Due to the importance of lysine, we decided to include this compound in our datasets when PCA was performed.
Beyond the influence of the winemaking stages on BA content, amine concentrations may also depend on the quality of the grapes in origin as well as the precautions during their manipulation, from harvesting and transport to must pressing. For instance, Figure 2 shows the comparison of two base wines of Pinot Noir of A and D qualities. All of the peaks in the chromatogram of D base wine are more intense than those in A base wine, except for lysine.
Figure 3 shows the boxplots of concentrations of two representative amines—ethanolamine and putrescine—as a function of sample product type, from must to sparkling wines and grape qualities. It can be seen that there is a significant rise in concentration from must to base wine. In the case of ethanolamine, the maximum concentration is achieved after the second fermentation while for putrescine it is found in the base wine. Regarding the wine quality, A samples show the lowest levels, and C and D samples show much higher concentrations. For the B type, the behavior of the two amines is quite different.
In order to try to isolate the contribution of the quality from that of the MLF on the formation of BAs an ANOVA study was applied. Samples from each variety (Pinot Noir and Xarel lo) were evaluated separately. For each amine, concentrations of equivalent samples of A and B qualities were compared with those from C and D counterparts. When MLF was not applied (i.e., pre-fermentation samples such as musts), no significant differences among A/B and C/D samples were found in most of the cases, with the only exception being ethanolamine in Pinot Noir and putrescine in Xarel lo. However, differences among A/B and C/D samples were always significant for post-fermentation products, thus proving that MLF was a much more crucial factor than quality on the formation of BAs. Results from this study can be found in Table S3 in the Supplementary Material.
However, some subtle details and relationships may have escaped our consideration so this approach may fail in complex situations, such as those presented here. At this stage, chemometric methods have proved their great performance in the analysis of large sets of multivariate data involving the simultaneous study of many samples of different characteristics.

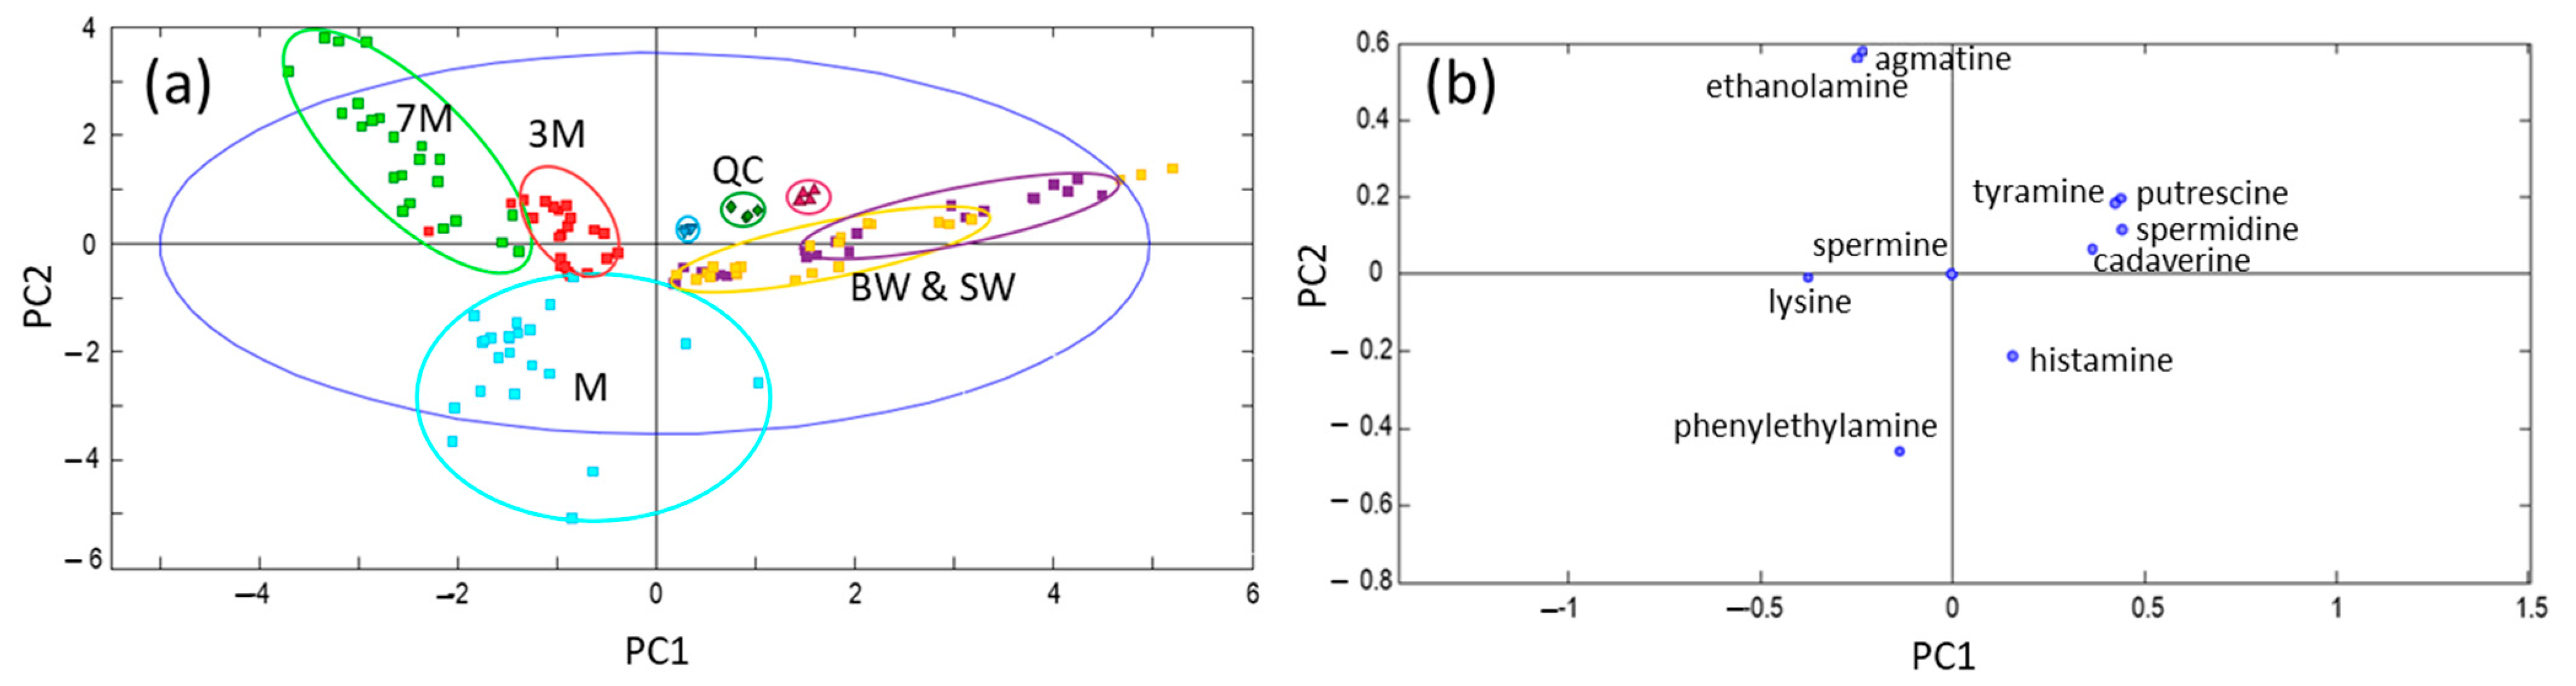
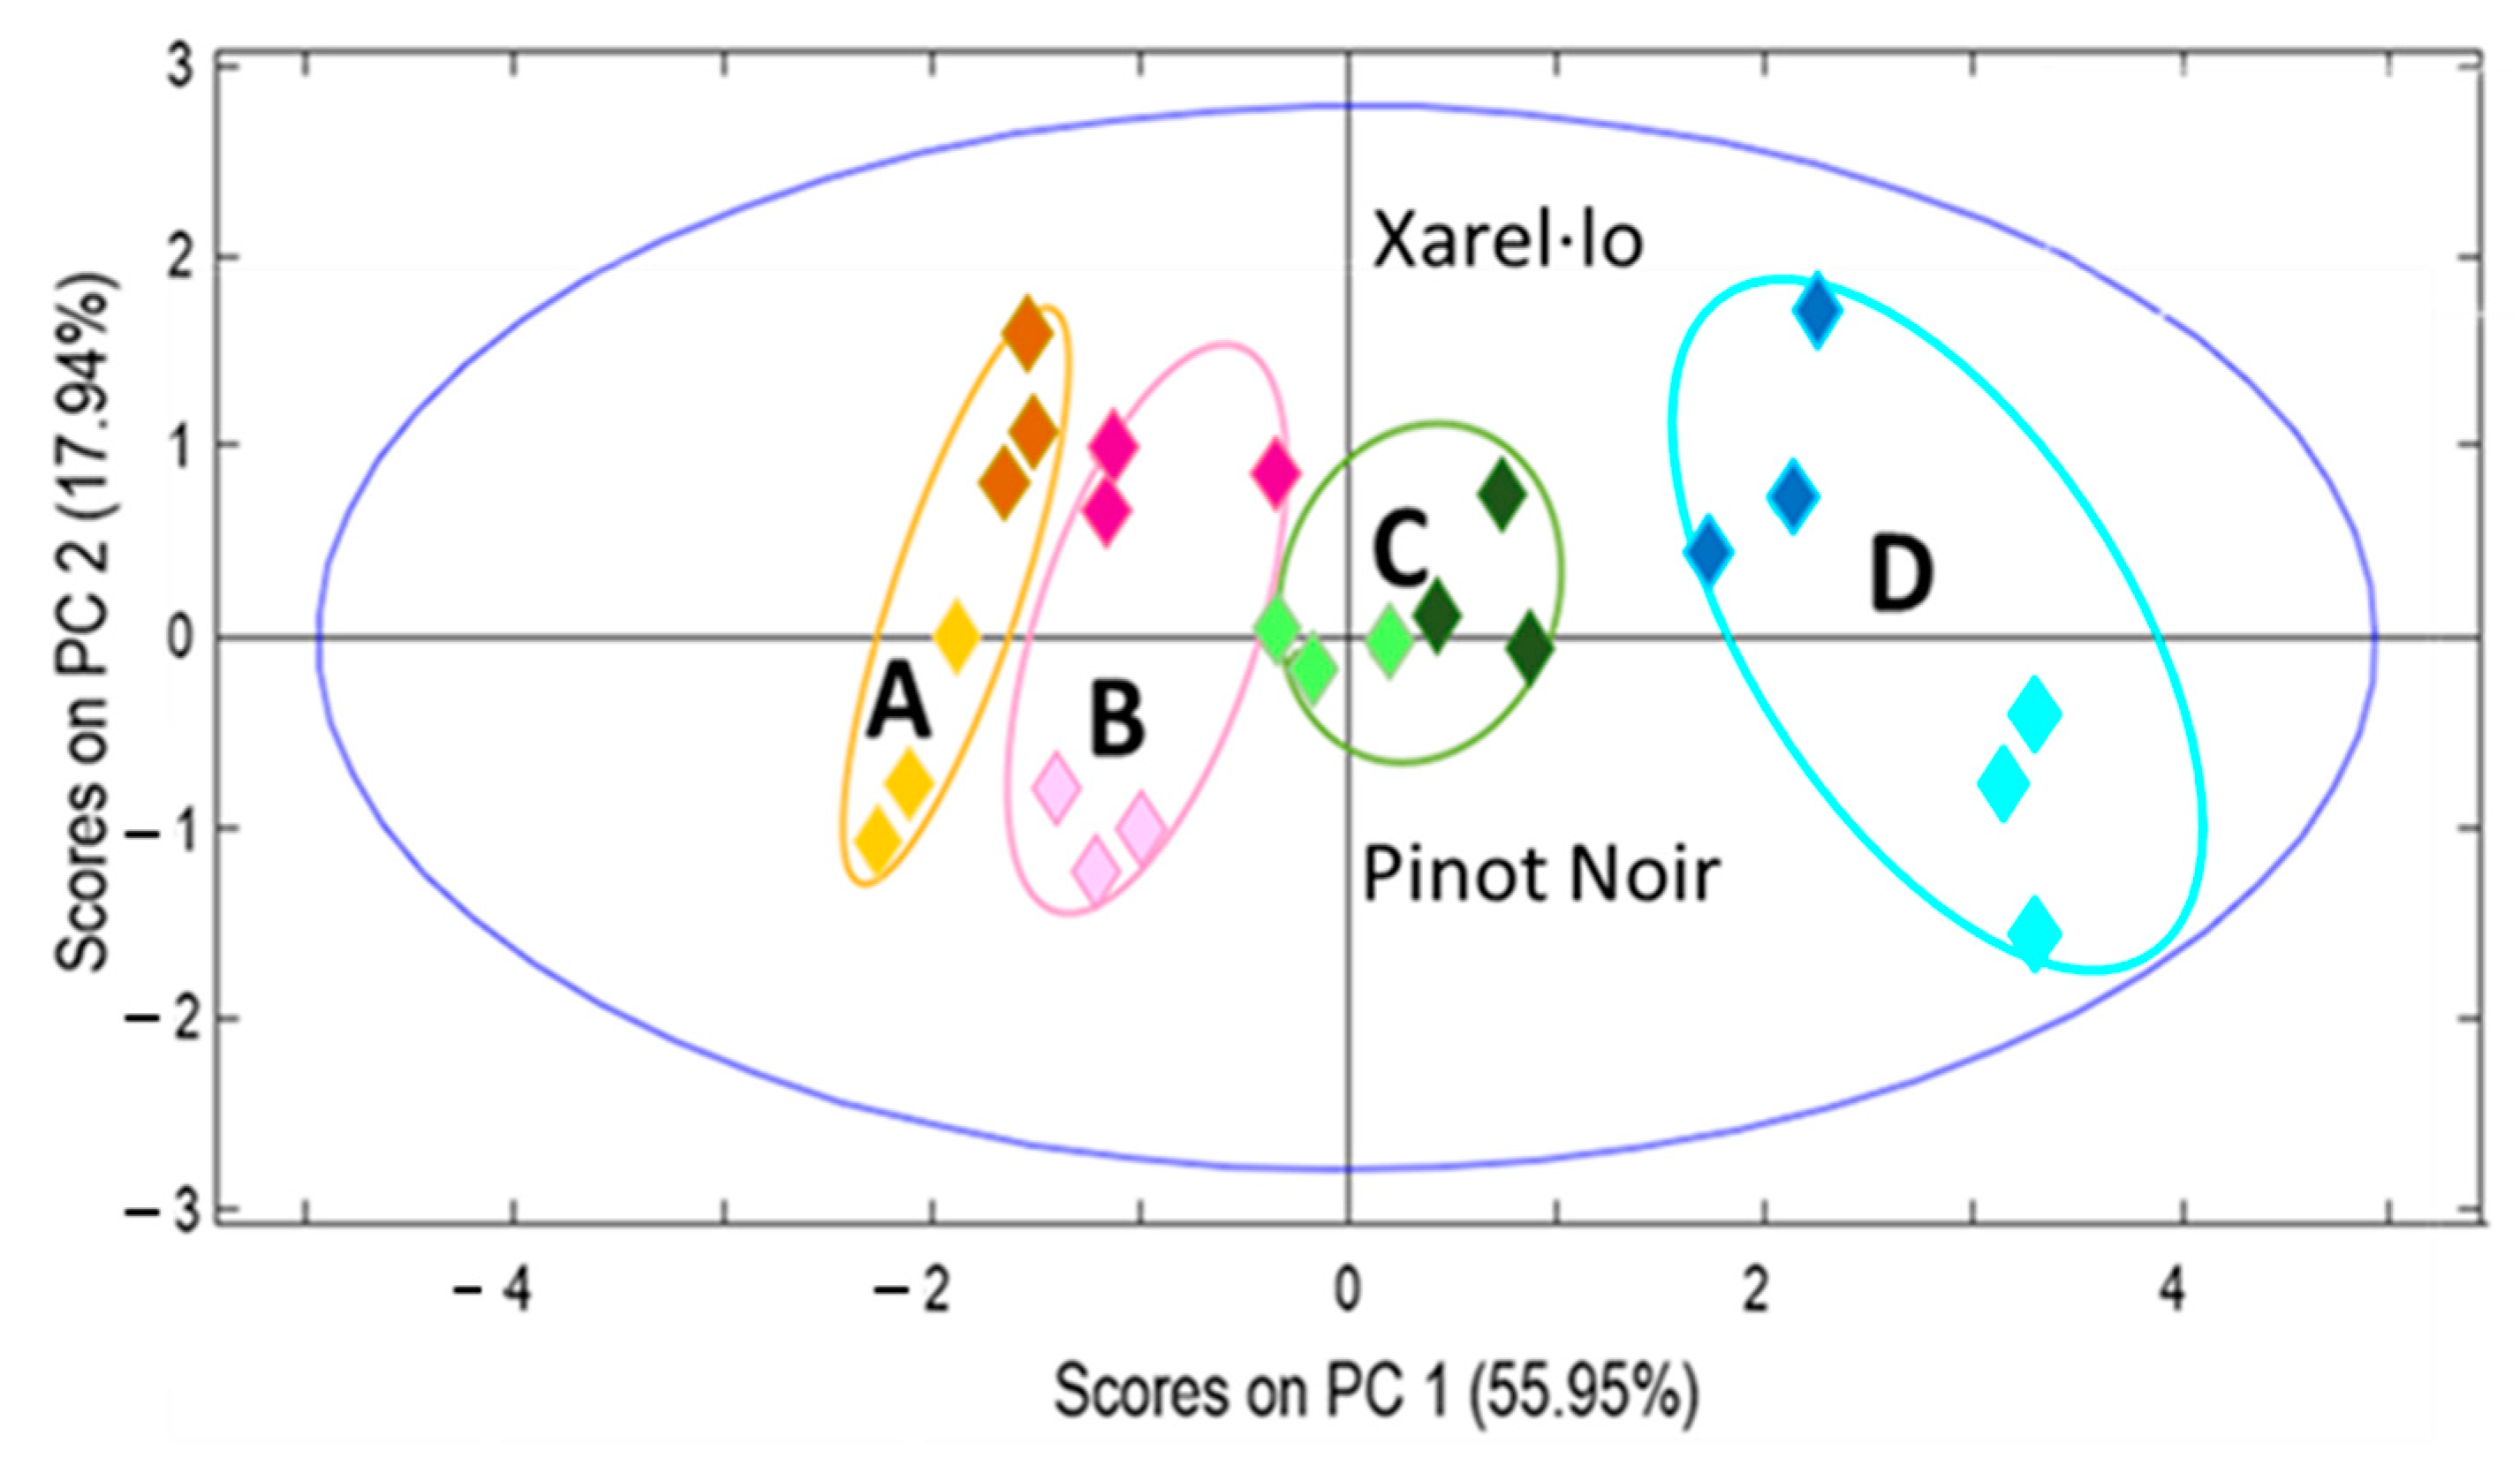
3.3. Principal Component Analysis

PCA was applied to explore the dependence of BA (and lysine) contents with fermentations and other oenological practices. The influence of the grape quality was assessed as well. For such a purpose, the X matrix of responses was built, which consisted of concentrations of BAs in the set of samples. Prior to PCA, data were autoscaled to equalize the descriptive relevance of all (major and minor) amines.
First, a model was calculated considering all of the samples under study to follow the evolution of BAs throughout the vinification. Two PCs were able to retain more than 66% of the total variance so the scatter plot of the scores of PC1 vs PC2 displayed a great portion of relevant information contained in the data. As shown in Figure 4, samples were clearly structured according to the main types, with musts predominating at the bottom left sector, sparkling wines at the top left sector, and base and stabilized wines on the right. Regarding sparkling wines, 3- and 7-month aged classes were, in general, well-separated, thus indicating that aging was a relevant factor in the evolution of the BA content. Conversely, base and stabilized wines were mixed in the same area and their distribution depended on additional features such as grape quality and variety. Moreover, all QCs were grouped in a compact group in the center of the model which supported the reproducibility of the chromatographic data and the significance of the chemometric results.
Concerning the map of variables, the plot of loadings showed that PC1 mainly explained the overall contribution of BAs, with some of the most abundant amines located to the right side (including putrescine, cadaverine, tyramine, spermidine, and histamine). Concentrations of these amines were correlated, thus indicating that, in general, they followed similar patterns. Determination coefficients R2 were better than 0.7 and correlations were significant statistically (p < 0.05), with the correlation among putrescine and histamine (R2 = 0.96 and p = 2 × 10⁻²⁸) being especially remarkable. In contrast, they were not correlated with the polyamines, ethanolamine, and agmatine, thus suggesting that they followed different formation pathways. PC2 mainly explained the behavior of ethanolamine.
The simultaneous study of scores and loadings provided interesting conclusions on the descriptors or biomarkers which were up- or down-regulated depending on the different classes: musts, wines, or cava samples. It was found that base and stabilized wines, especially those subjected to MLF, reached the highest overall levels of BAs, such as putrescine, tyramine, and histidine. Sparkling wines resulting from the second fermentations showed a small decay in diamine and monoamine levels, except for ethanolamine, which slightly increased in parallel to the rise in the alcoholic content undergone after the second fermentation. In contrast, musts were characterized by low levels of all of the types of BAs.
When other sample features such as grape quality or grape type were explored in a similar way considering the full set of samples, no clear conclusions on the sample behavior were obtained, thus suggesting that the vinification stage was the most dramatic factor influencing the evolution of the content of BAs in the samples. However, it was evidenced that the initial quality of the grapes, assigned in origin as A, B, C, and D types (from best to worse quality), and the care in their further manipulations (maximum neatness for A type) were other key aspects in the BA content. In the preliminary statistical analysis, a noticeable overall increase in BA levels was evidenced from A to D qualities. Thus, to study the influence of each quality more thoroughly, various sample subsets focused on musts, base and stabilized wines, and sparkling wines separately were created to be submitted to PCA. Hence, specific PCA models were evaluated. The example depicted in Figure 5 shows the graph of scores of PC1 vs PC2 for both Pinot Noir and Xarel lo sparkling wines aged for a period of seven months. Samples were distributed along PC1, from left to right, as a function of the grape quality with a compact group on the left side containing both A and B types while C and D sparkling wines were spread on the right section. As deduced from ANOVA, this discrimination was mainly due to amines such as putrescine (p = 6.4 × 10⁻¹⁴), while others such as ethanolamine did not influence this behavior. PC2 especially described differences among Xarel lo and Pinot Noir, in which samples from each variety were mainly located at the upper and lower areas, respectively. This behavior was attributed to the significant differences in the concentrations of some important amines, also confirmed by ANOVA. The most significant differences were found for cadaverine, ethanolamine, and agmatine with p-values of 2.1 × 10⁻⁵, 0.0043 and 0.0088, respectively. Regarding the variables, it was again confirmed that the lower the quality, the higher the BA content. Similar conclusions were obtained from models for the exploratory analysis of the other sample classes.

4. Conclusions

This paper explores the influence of grape/wine quality and vinification processes of sparkling wines (wines of Cava PDO—Protected Designation of Origin) on the occurrence of BAs. Samples of different characteristics (musts, base wines, stabilized base wines, and sparkling wines with 3 and 7 months of aging), different product qualities, and different grape varieties have been analyzed by HPLC–FLD. Conclusions from ANOVA and Principal Component Analysis (PCA) have shown that the concentrations of BAs increase significantly from musts to base wines. This rise is even more noticeable for wines subjected to malolactic fermentation. Subsequently, in general, BA levels remain constant or slightly decrease with aging after the second fermentation. From PCA results, the plot of scores has shown well-separated clusters corresponding must, base and stabilized wines, and sparkling wines while the plot of loadings has revealed that compounds such as putrescine, ethanolamine, and lysine are important descriptors. Regarding the quality, products of higher quality contain much lower amounts, meaning BA levels are notably lower if care and neatness are maintained throughout the process. This finding is even more noticeable for products subjected to malolactic fermentation, which is identified as one of the main sources responsible for the formation of BAs. When comparing the two varieties, Pinot Noir products, in general, display higher BA levels than Xarel lo ones.
BA profiles (as well as their precursors and related species) are potential biomarkers to determine wine quality and control the manufacturing processes. In this sense, the descriptive ability of lysine should be noted, thus suggesting that other amino acids, as BA precursors, could also be a complementary source of information. As indicated, at the must stage, high levels of amines can be associated with lower grape quality, and less careful harvesting and processing conditions. This trend regarding quality can be generalized to the other winemaking steps, therefore, for similar types of cava wines, the lower the amine levels, the better the products. Therefore, BA data can be essential for both producers and consumers to recognize the qualities of wine and cava samples, especially since this type of information is difficult to achieve by other means such as from sensory parameters.

Supplementary Materials

The following are available online at https://www.mdpi.com/article/10.3390/fermentation7030144/s1, Figure S1: Structures of the most common biogenic amines in fermented foodstuffs, Figure S2: FLD chromatograms of a derivatized standard solution of BAs at 2 mg L−1 each. Peak assignment: (a) ethanolamine; (b) agmatine; (c) tryptamine; (d) phenylethylamine; (e) putrescine; (f) cadaverine; (g) histamine; (h) hexylamine (IS); (i) octopamine; (j) tyramine; (k) spermidine; (l) spermine, Figure S3. Boxplots with whiskers representing the concentration of ethanolamine, putrescine, histamine, and tyramine in base and stabilized wines for Pinot Noir (light color) and Xarel lo (dark color) varieties, Table S1: MRM transitions for the detection of dansyl derivatives of biogenic amines by LC-MS/MS, Table S2: Concentration (mg L−1) of biogenic amines in the different type of samples, Table S3: ANOVA applied to the study of quality and MLF factors.

Author Contributions

Conceptualization, A.I.-L. and J.S.; methodology, A.M.-C., A.I.-L. and S.S.; software, A.M.-C.; formal analysis, J.S. and S.S.; investigation, A.M.-C.; writing—original draft preparation, S.S. and J.S.; writing—review and editing, S.S. and J.S.; supervision, A.I.-L. and J.S. All authors have read and agreed to the published version of the manuscript.

Funding

This research was funded by the “Agencia Estatal de Investigación”, grant number PID2020-114401RB-C22.

Institutional Review Board Statement

Not applicable.

Informed Consent Statement

Not applicable.

Acknowledgments

Authors thank the Raventós Codorníu Group for providing the samples.

Conflicts of Interest

The authors declare no conflict of interest.

References

  1. Jaguey-Hernández, Y.; Aguilar-Arteaga, K.; Ojeda-Ramirez, D.; Añorve-Morga, J.; González-Olivares, L.G.; Castañeda-Ovando, A. Biogenic amines levels in food processing: Efforts for their control in foodstuffs. Food Res. Int. 2021, 144, 110341. [Google Scholar] [CrossRef]
  2. Sivamaruthi, B.S.; Kesika, P.; Chaiyasut, C. A narrative review on biogenic amines in fermented fish and meat products. J. Food Sci. Technol. 2021, 58, 1623–1639. [Google Scholar] [CrossRef] [PubMed]
  3. Costantini, A.; Vaudano, E.; Pulcini, L.; Carafa, T.; Garcia-Moruno, E. An Overview on Biogenic Amines in Wine. Beverages 2019, 5, 19. [Google Scholar] [CrossRef] [Green Version]
  4. Ruiz-Capillas, C.; Herrero, A.M. Impact of biogenic amines on food quality and safety. Foods 2019, 8, 62. [Google Scholar] [CrossRef] [PubMed] [Green Version]
  5. Simon Sarkadi, L. Amino acids and biogenic amines as food quality factors. Pure Appl. Chem. 2019, 91, 289–300. [Google Scholar] [CrossRef]
  6. Wójcik, W.; Łukasiewicz, M.; Puppel, K. Biogenic amines: Formation, action and toxicity—A review. J. Sci. Food Agric. 2021, 101, 2634–2640. [Google Scholar] [CrossRef]
  7. Önal, A. A Review: Current Analytical Methods for the Determination of Biogenic Amines in Foods. Food Chem. 2007, 103, 1475–1486. [Google Scholar] [CrossRef]
  8. Marcobal, A.; Polo, M.C.; Martín-Álvarez, P.J.; Moreno-Arribas, M.V. Biogenic Amine Content of Red Spanish Wines: Comparison of a Direct ELISA and an HPLC Method for the Determination of Histamine in Wines. Food Res. Int. 2005, 38, 387–394. [Google Scholar] [CrossRef]
  9. Marcobal, Á.; Martín-Álvarez, P.J.; Polo, M.C.; Muñoz, R.; Moreno-Arribas, M.V. Formation of Biogenic Amines throughout the Industrial Manufacture of Red Wine. J. Food Prot. 2006, 69, 397–404. [Google Scholar] [CrossRef] [PubMed]
  10. Guo, Y.Y.; Yang, Y.P.; Peng, Q.; Han, Y. Biogenic Amines in Wine: A Review. Int. J. Food Sci. Technol. 2015, 50, 1523–1532. [Google Scholar] [CrossRef]
  11. Zhang, Y.J.; Zhang, Y.; Zhou, Y.; Li, G.H.; Yang, W.Z.; Feng, X.S. A review of pretreatment and analytical methods of biogenic amines in food and biological samples since 2010. J. Chromatogr. A 2019, 1605, 360361. [Google Scholar] [CrossRef] [PubMed]
  12. Ordóñez, J.L.; Troncoso, A.M.; García-Parrilla, M.D.C.; Callejón, R.M. Recent trends in the determination of biogenic amines in fermented beverages—A review. Anal. Chim. Acta 2016, 939, 10–25. [Google Scholar] [CrossRef]
  13. Sentellas, S.; Núñez, O.; Saurina, J. Recent Advances in the Determination of Biogenic Amines in Food Samples by (U)HPLC. J. Agric. Food Chem. 2016, 64, 7667–7678. [Google Scholar] [CrossRef] [PubMed] [Green Version]
  14. Hernández-Cassou, S.; Saurina, J. Derivatization strategies for the determination of biogenic amines in wines by chromatographic and electrophoretic techniques. J. Chromatogr. B Anal. Technol. Biomed. Life Sci. 2011, 879, 1270–1281. [Google Scholar] [CrossRef]
  15. AECAVA. Available online: https://aecava.com/en/ (accessed on 4 August 2021).
  16. Izquierdo-Llopart, A.; Saurina, J. Liquid chromatographic approach for the discrimination and classification of cava samples based on the phenolic composition using chemometric methods. Beverages 2020, 6, 54. [Google Scholar] [CrossRef]
  17. Izquierdo-Llopart, A.; Carretero, A.; Saurina, J. Organic Acid Profiling by Liquid Chromatography for the Characterization of Base Vines and Sparkling Wines. Food Anal. Methods 2020, 13, 1852–1866. [Google Scholar] [CrossRef]
  18. Izquierdo-Llopart, A.; Saurina, J. Characterization of sparkling wines according to polyphenolic profiles obtained by HPLC-UV/Vis and principal component analysis. Foods 2019, 8, 22. [Google Scholar] [CrossRef] [PubMed] [Green Version]
  19. Pérez-Magariño, S.; Ortega-Heras, M.; Martínez-Lapuente, L.; Guadalupe, Z.; Ayestarán, B. Multivariate analysis for the differentiation of sparkling wines elaborated from autochthonous Spanish grape varieties: Volatile compounds, amino acids and biogenic amines. Eur. Food Res. Technol. 2013, 236, 827–841. [Google Scholar] [CrossRef]
  20. Ivit, N.N.; Loira, I.; Morata, A.; Benito, S.; Palomero, F.; Suárez-Lepe, J.A. Making natural sparkling wines with non-Saccharomyces yeasts. Eur. Food Res. Technol. 2018, 244, 925–935. [Google Scholar] [CrossRef]
  21. Martínez-Lapuente, L.; Apolinar-Valiente, R.; Guadalupe, Z.; Ayestarán, B.; Pérez-Magariño, S.; Williams, P.; Doco, T. Polysaccharides, oligosaccharides and nitrogenous compounds change during the ageing of Tempranillo and Verdejo sparkling wines. J. Sci. Food Agric. 2018, 98, 291–303. [Google Scholar] [CrossRef] [PubMed]
  22. Martínez-Lapuente, L.; Guadalupe, Z.; Ayestarán, B.; Pérez-Magariño, S. Role of major wine constituents in the foam properties of white and rosé sparkling wines. Food Chem. 2015, 174, 330–338. [Google Scholar] [CrossRef] [PubMed]
  23. Pérez-Magariño, S.; Martínez-Lapuente, L.; Bueno-Herrera, M.; Ortega-Heras, M.; Guadalupe, Z.; Ayestarán, B. Use of Commercial Dry Yeast Products Rich in Mannoproteins for White and Rosé Sparkling Wine Elaboration. J. Agric. Food Chem. 2015, 63, 5670–5681. [Google Scholar] [CrossRef] [PubMed]
  24. Saurina, J. Characterization of wines using compositional profiles and chemometrics. TrAC Trends Anal. Chem. 2010, 29, 234–245. [Google Scholar] [CrossRef]
  25. Ivit, N.N.; Kemp, B. The impact of non-Saccharomyces yeast on traditional method sparkling wine. Fermentation 2018, 4, 73. [Google Scholar] [CrossRef] [Green Version]
  26. Restuccia, D.; Loizzo, M.R.; Spizzirri, U.G. Accumulation of biogenic amines in wine: Role of alcoholic and malolactic fermentation. Fermentation 2018, 4, 6. [Google Scholar] [CrossRef] [Green Version]
  27. García-Villar, N.; Hernández-Cassou, S.; Saurina, J. Characterization of wines through the biogenic amine contents using chromatographic techniques and chemometric data analysis. J. Agric. Food Chem. 2007, 55, 7453–7461. [Google Scholar] [CrossRef] [PubMed]
  28. Dugo, G.; Vilasi, F.; La Torre, G.L.; Pellicanò, T.M. Reverse phase HPLC/DAD determination of biogenic amines as dansyl derivatives in experimental red wines. Food Chem. 2006, 95, 672–676. [Google Scholar] [CrossRef]
  29. Proestos, C.; Loukatos, P.; Komaitis, M. Determination of biogenic amines in wines by HPLC with precolumn dansylation and fluorimetric detection. Food Chem. 2008, 106, 1218–1224. [Google Scholar] [CrossRef]
  30. Pineda, A.; Carrasco, J.; Peña-Farfal, C.; Henríquez-Aedo, K.; Aranda, M. Preliminary evaluation of biogenic amines content in Chilean young varietal wines by HPLC. Food Control 2012, 23, 251–257. [Google Scholar] [CrossRef]
  31. Tuberoso, C.I.G.; Congiu, F.; Serreli, G.; Mameli, S. Determination of dansylated amino acids and biogenic amines in Cannonau and Vermentino wines by HPLC-FLD. Food Chem. 2015, 175, 29–35. [Google Scholar] [CrossRef]
  32. Massart, D.L.; Vandeginste, B.G.M.; Buydens, L.M.C.; de Jong, S.; Lewi, P.J.; Smeyers-Verbeke, J. Handbook of Chemometrics and Qualimetrics; Elsevier: Amsterdam, The Netherlands, 1997. [Google Scholar]
Figure 1. FLD chromatograms of the five types of sample classes from Pinot Noir variety using grapes of D quality. Sample assignment: M = must; BW = base wine; SW = stabilized wine; 3M = sparkling wine of 3 months aging; 7M = sparkling wine of 7 months aging. Peak assignment: 1 = Ethanolamine; 2 = Agmatine; 3 = Lysine; 4 = Cadaverine; 5 = Internal standard; 6 = Tyramine; 7 = Spermidine.
Fermentation 07 00144 g001
Figure 2. FLD chromatograms of two base wines of A and D qualities from Pinot Noir variety. Peak assignment: Peak assignment: 1 = Ethanolamine; 2 = Agmatine; 3 = Lysine; 4 = Cadaverine; 5 = Internal standard; 6 = Tyramine; 7 = Spermidine.
Fermentation 07 00144 g002
Figure 3. Boxplots with whiskers representing the concentration of ethanolamine and cadaverine in the samples. (a) Ethanolamine as a function of the sample types; (b) Ethanolamine as a function of the qualities; (c) Putrescine as a function of the sample types; (d) Putrescine as a function of the qualities. Sample assignment: M = must; BW = base wine; SW = stabilized wine; 3M = sparkling wine of 3 months aging; 7M = sparkling wine of 7 months aging. A = quality A; B = quality B; C = quality C; D = quality D. Error bars indicate the minimum and maximum values.
Fermentation 07 00144 g003
Figure 4. Characterization of product samples by PCA using the compositional profiles of amines as the data. (a) Scatter plot of scores of PC1 vs PC2; (b) Scatter plot of loadings of PC1 vs PC2. Sample assignment: M = must (light blue); BW = base wine (light ochre); SW = stabilized wine (purple); 3M = sparkling wine of 3 months aging (red); 7M = sparkling wine of 7 months aging (green); QC = quality control.
Fermentation 07 00144 g004
Figure 5. Characterization of sparkling wines aged for a period of seven months by PCA using the compositional profiles of amines as the data. Scatter plot of scores of PC1 vs PC2. Dark colors correspond to Xarel lo.
Fermentation 07 00144 g005
Table 1. List of samples under study. Sample codes are as follows: M, must; BW, base wine; SW, stabilized wine; C3, 3 months in rhyme cava wine (sparkling wine); C7, 7 months in rhyme cava wine (sparkling wine); P, Pinot Noir; X, Xarel lo; A, quality A; B, quality B; C, quality C; D, quality D.
Grape VarietyQualityMustBase WineStabilized Wine3 Months Sparkling Wine7 Months Sparkling Wine
Pinot NoirAMPABWPASWPAC3PAC7PA
BMPBBWPBSWPBC3PBC7PB
CMPCBWPCSWPCC3PCC7PC
DMPDBWPDSWPDC3PDC7PD
Xarel loAMXABWXASWXAC3XAC7XA
BMXBBWXBSWXBC3XBC7XB
CMXCBWXCSWXCC3XCC7XC
DMXDBWXDSWXDC3XDC7XD
Table 2. Quality parameters obtained for the derivatized amines using the HPLC–FLD optimized method.
Amine aSensitivity
(If min L mg−1) b
Determination Coefficient
(R2)
Retention Time Repeatability
(RSD, %)
Peak Area Repeatability
(RSD, %)
LOD
(mg L−1)
LOQ
(mg L−1)
Agm0.003550.9950.40.70.150.511
Tryp0.02170.99910.30.60.0450.149
Phe0.031950.9950.30.50.0190.064
Put0.073350.9960.20.50.0110.037
Cad0.084650.99920.20.50.0060.021
His0.002150.9980.20.90.0380.128
Oct0.004730.99930.20.70.1580.527
Tyr0.00980.9990.10.40.1470.488
Smd0.06670.9980.10.40.0270.089
Spm0.071450.9980.10.30.0070.022
Eth0.03320.9970.10.40.0150.050
a Amine identification: Agm: agmantine; Tryp: tryptamine; Phe: phenylethylamine; Put: putrescine; Cad: cadaverine; His: histamine; Oct: octopamine; Tyr: tyramine; Smd: spermidine; Spm: spermine; Eth: ethanolamine b If: fluorescence intensity in arbitrary units.
Publisher’s Note: MDPI stays neutral with regard to jurisdictional claims in published maps and institutional affiliations.

