Article

Lactic Acid Fermented Green Tea with Levilactobacillus brevis Capable of Producing γ-Aminobutyric Acid

Department of Food and Biotechnology, Korea University, Sejong 30019, Korea
*
Author to whom correspondence should be addressed.
The author contributed equally to this work and should be considered as co-first author.
Fermentation 2021, 7(3), 110; https://doi.org/10.3390/fermentation7030110
Submission received: 3 June 2021 / Revised: 28 June 2021 / Accepted: 5 July 2021 / Published: 9 July 2021
(This article belongs to the Special Issue Lactic Acid Fermentation and the Colours of Biotechnology 3.0)

Abstract

:
The antioxidative activity and bioactive compounds content of lactic acid fermented green tea (LFG) fermented with an outstanding GABA-producing strain under optimised fermentation conditions were evaluated. Levilactobacillus strain GTL 79 was isolated from green tea leaves and selected based on acid production, growth potential, catechin resistance, and GABA production to be applied to LFG. Through 16S rRNA gene sequence analysis, the strain was identified as Levilactobacillus brevis. The optimised conditions were defined as fermentation at 37 °C with supplementation of 1% fermentation alcohol, 6% glucose, and 1% MSG and was determined to be most effective in increasing the lactic acid, acetic acid, and GABA content in LFG by 522.20%, 238.72% and 232.52% (or 247.58%), respectively. Initial DPPH scavenging activity of LFG fermented under the optimised conditions was 88.96% and rose to 94.38% by day 5. Polyphenols may contribute to the initial DPPH scavenging activity, while GABA and other bioactive compounds may contribute to the activity thereafter. Consequently, as GABA and other bioactive compounds found in green tea have been reported to have health benefits, future studies may prove that optimally fermented LFG by L. brevis GTL 79 could be useful in the food and health industries.

1. Introduction

Tea is a well-known beverage made from the leaves of the Camelia sinensis plant. According to Harbowy et al. [1] the practice of infusing leaves into water to make tea historically dates back to 2737 B.C. in China and has been enjoyed over thousands of years throughout East Asia. Tea can be classified as green tea (unoxidised), oolong tea (semi-oxidised), and black tea (fully oxidised) depending on the level of oxidation of the tea leaves [2]. Green tea, in particular, has been an important part of daily life in Japan for at least the past 800 years [3]. Green tea, as focused on in this study, is made from fresh leaves with minimal withering or oxidation and is reported to contain many functional compounds including polyphenols, catechins, caffeine, γ-aminobutyric acid (GABA), and vitamins which carry antioxidative, anti-mutagenic, anti-carcinogenic, and anti-obesity effects [4,5,6].
Lactic acid fermentation by lactic acid bacteria (LAB) has been used to improve the nutritional quality, while also extending the shelf-life, of many fruit, vegetable, dairy, and meat products [7]. It has been reported that the lactic acid produced by LAB has antioxidative [8,9] and anti-inflammatory [10] effects, while LAB-produced acetic acid is anti-diabetic [11], anti-hypertensive [12], and hypocholesterolemic [13]. Representative LAB such as Lactobacillus, Bifidobacterium and Streptococcus have been used as starter cultures in the fermentation of foods and as probiotics [14]. A recent review by Sanlier et al. [15] outlined that lactic acid fermented foods that have used Lactobacillus spp. as a starter culture have anti-obesity, anti-diabetic, anti-dyslipidemic, anti-atherogenic, anti-hypertensive, anti-inflammatory effects. While as a probiotic, the species has the potential to be used in the treatment and prevention of diarrheal disease [16,17].
Research has also been conducted using LAB with high GABA production to manufacture cheese with a high GABA content via a mix starter culture including Lactococcus lactis [18] and fermented sausages with increased GABA content via fermentation with Levilactobacillus brevis (formerly Lactobacillus brevis) [19]. GABA is a non-protein amino acid produced by the decarboxylation of L-glutamate by microorganisms with the enzyme L-glutamic acid decarboxylase [20]. It is known that GABA has diuretic, tranquilizer, and antidiabetic effects [20,21,22]. Due to outstanding health-promoting effects of GABA, studies on successive or simultaneous optimisation of fermentation conditions, such as carbohydrate, nitrogen, MSG, pH, and fermentation temperature, have been intensively conducted to raise GABA production by LAB through lactic acid fermentation [22,23,24,25]. For the optimisation process, one-factor-at-a-time (OFAT) and statistical methods have been frequently applied as representative successive and simultaneous optimisation techniques, respectively [25,26]. An OFAT method examines the effect of changing only one factor while keeping others constant [25,26]. The method has been extensively used for the initial stage of the optimisation process to identify the fermentation conditions which are significant parameters for the production of metabolites. However, this methodology has difficulty in estimating the interactions between the conditions [25,26]. Statistical methods, including response surface methodology (RSM), can overcome such drawbacks by considering such interactions simultaneously [26,27] but have disadvantages that the experimental run size and cost for optimisation process could be significantly higher than the OFAT method when the number of factors increases [27]. Taking the abovementioned into account, the use of bacteria with high GABA production as well as optimisation of fermentation conditions in lactic acid fermentation may help in the enhancement of the functionalities of fermented food products.
Since the functionalities of green tea have been intensively studied and proven, Kim, Lee, and Jeong [28] suggested that research on the development of green tea-based food products with functional properties is required. Meanwhile, kombucha is one of the green tea-based fermented beverages which is commonly fermented using yeast [29]. Several studies have reported on the enhancement of the functionality of kombucha by adding LAB [30,31]. However, as yeast is mandatory for the fermentation of kombucha [29], green tea fermented with only LAB is a different end product. Besides, studies on GABA-enhanced green tea fermented with GABA-producing LAB have not been reported. As such, the current study focused on selecting LAB strains with outstanding GABA production isolated from green tea leaves and optimising fermentation conditions to enhance the metabolic activity and GABA production of the LAB during lactic acid fermentation. The antioxidative activity derived from bioactive compounds (i.e., GABA and polyphenols) found in lactic acid fermented green tea (LFG) fermented with the LAB strains using the optimised fermentation conditions was also examined and discussed.

2. Materials and Methods

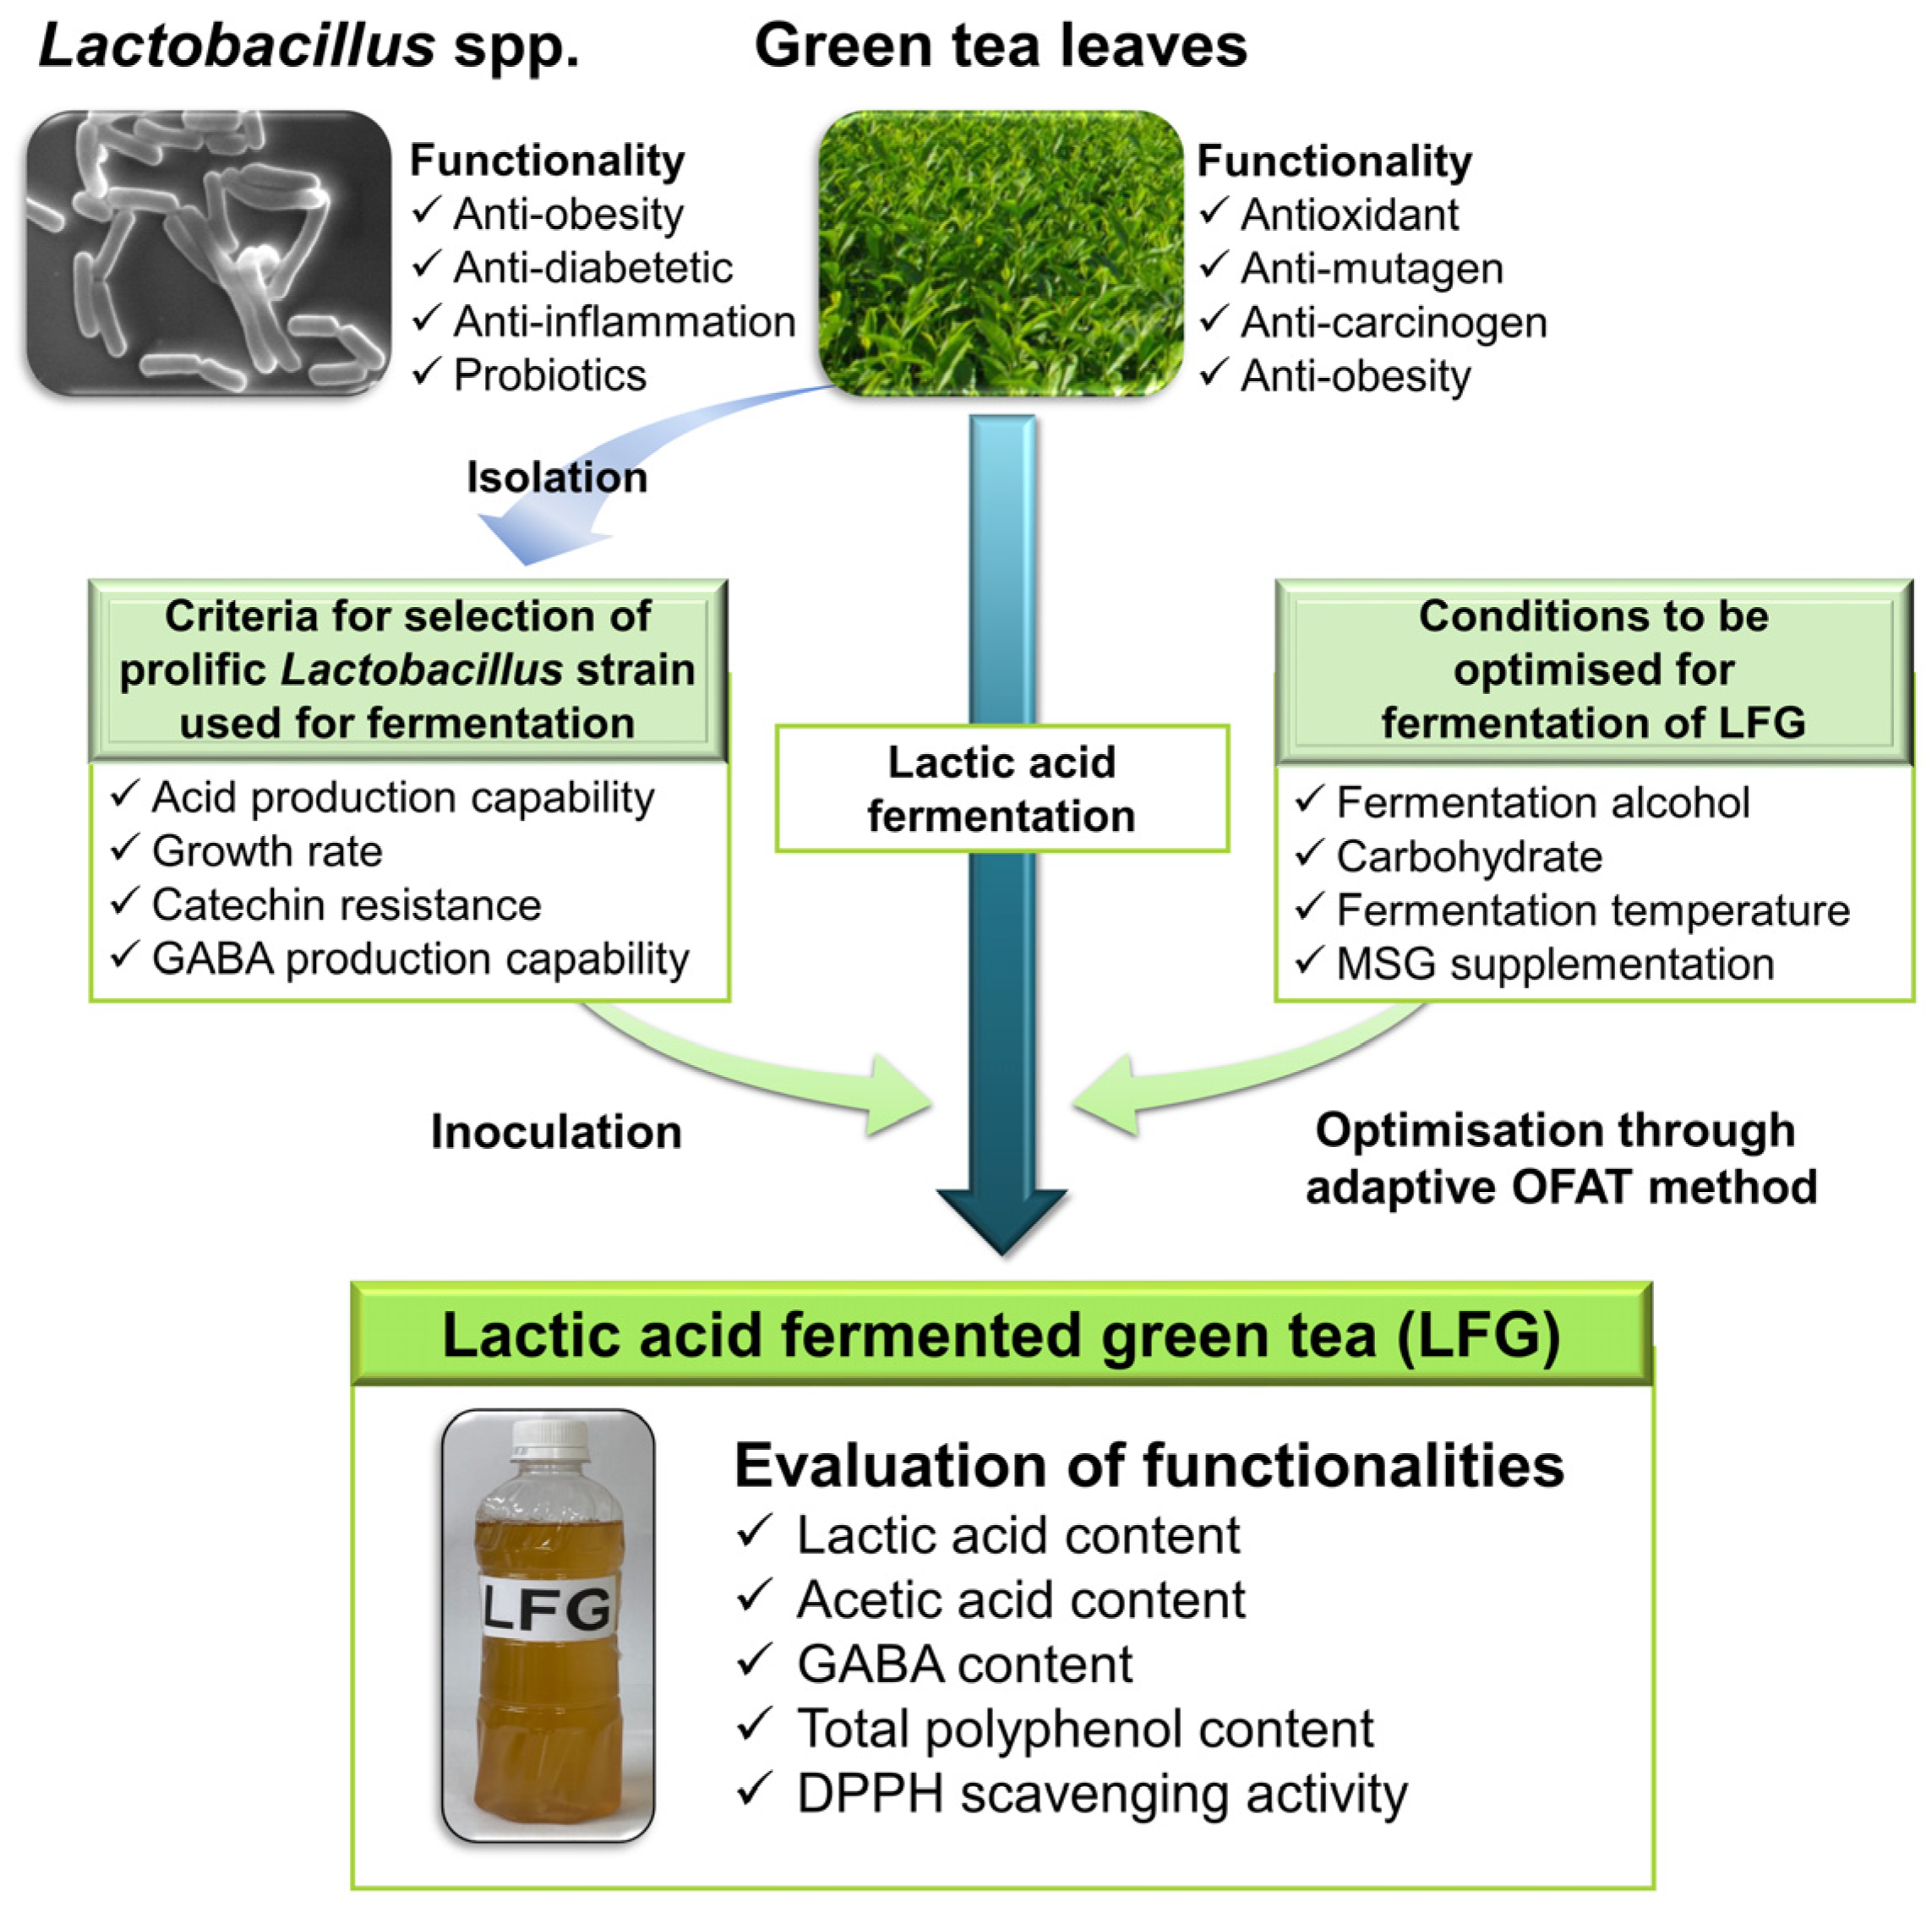
2.1. Isolation and Identification of Lactobacillus Strains from Green Tea Leaves

Commercial dried green tea leaves (Camellia sinensis var. sinensis) were purchased from several retail markets in Seoul, Republic of Korea. The products were stored at room temperature in a darkroom until experimentation. Within two weeks of storage, strains of Lactobacillus (hereafter “Lactobacillus” refers to the all-new genera reclassified such as Lactobacillus and Levilactobacillus, unless mentioned otherwise) were isolated from the products as follows. Dried green tea leaves were also used for green tea fermentation experiments (Figure 1; see also Section 2.4)
To isolate Lactobacillus strains, 10 g of dried green tea leaves were homogenised with 90 mL of sterile 0.1% peptone saline using a stomacher (Laboratory Blender Stomacher 400, Seward, Ltd., Worthing, UK). The homogenate was 10-fold serially diluted with sterile 0.1% peptone saline. A 100 μL aliquot of each dilution was spread on de Man, Rogosa, and Sharpe (MRS; Conda, Madrid, Spain) agar supplemented with 0.06% bromocresol purple (w/v, Sigma-Aldrich Chemical Co., St. Louis, MO, USA) in duplicate and incubated anaerobically at 37 °C for 48 h. Anaerobic incubation was achieved using an anaerobic chamber (Coy Lab. Products, Inc., Grass Lake, MI, USA) containing an atmosphere of 95% nitrogen and 5% hydrogen. After incubation, all colonies on plates with 10–300 colonies [32] were streaked on MRS agar to isolate individual bacterial strains and incubated under the same conditions. The single colonies were streaked again on MRS agar and incubated under the same conditions to obtain pure cultures. Then, the single colonies were transferred into 5 mL of MRS broth and incubated aerobically at 37 °C for 48 h. The cultured broth was stored as a glycerol stock (final concentration of 20%, v/v) in a deep freezer (−70 °C).
Lactobacillus spp. were characterised and selected based on information in Bergey’s manual [33]. Selected strain Lactobacillus strain GTL 79 was further identified at the species level based on 16S rRNA gene sequence analysis and used for green tea fermentation.
L. brevis KCTC 3498 and Lactiplantibacillus plantarum KCTC 3108 were purchased from the Korean Collection for Type Cultures (KCTC; Daejeon, Republic of Korea) and served as reference strains to which GABA production capability of the isolated strains were compared.

2.2. Selection of Lactobacillus Strain for Enhancing GABA Content and Functionality of LFG

To enhance GABA content and functionality of LFG, the isolated Lactobacillus strain ultimately used in LFG was selected based on its acid production, growth potential, catechin resistance, and GABA production capability. A loopful (10 μL) of glycerol stock of each strain (either each reference strain or each isolated strain) was inoculated in 5 mL of MRS broth and incubated aerobically at 37 °C for 48 h. After incubation, 100 μL of the cultured broth was transferred into 5 mL of MRS broth and incubated under the same conditions. The culture was used for the screening process as follows (Figure S1).

2.2.1. Acid Production Capability

One hundred microliters of the culture were transferred into 5 mL of MRS broth and incubated at 37 °C for 48 h. After incubation, 2 mL of the cultured broth were mixed with 18 mL of distilled water using a vortex (Vortex-Genie, Scientific industries, Bohemia, NY, USA). The pH of the mixture was measured using a pH meter (Orion 3-star pH Benchtop Thermo Scientific, Waltham, MA, USA).

2.2.2. Growth Potential

Ten microliters of the culture (OD600 of 1.0 ± 0.1) were transferred into 340 μL of MRS broth and incubated at 37 °C for 48 h. After incubation, optical density of the broth was measured at 600 nm using an automated turbidmetric system (Bioscreen C, Labsystems, Helsinki, Finland).

2.2.3. Catechin Resistance

Ten microliters of the culture (OD600 of 1.0 ± 0.1) were transferred into 340 μL of MRS broth containing green tea (prepared as described in Section 2.4) at a given final concentration of 10% (v/v) and incubated at 37 °C for 48 h. During incubation, optical density of the broth was measured at 600 nm every 3 h using the Bioscreen C. Specific growth rate and lag time were calculated based on the values generated from the Bioscreen apparatus using spreadsheet software (Excel 2016; Microsoft Co., Redmond, WA, USA) and a mathematical model developed by Baranyi and Roberts [34]. The relative lag time is a ratio of the lag time of the tested LAB strain and that of the reference LAB strain (L. brevis GTL 79) with the shortest lag time. On the basis of the formula, a value of 1.00 indicates the shortest lag time.

2.2.4. GABA Production Capability

GABA production by the Lactobacillus strains was determined using the procedure described by Park and Oh. [35] with minor modifications. Briefly, 1 mL of the culture was transferred into 10 mL of MRS broth containing L-glutamic acid monosodium salt hydrate (MSG, Sigma, St. Louis, MO, USA) at a final concentration of 1% (w/v). After aerobic incubation at 37 °C for 48 h, the cultured broth was filtered using a 0.45 μm-pore size syringe filter (Futecs Co. Ltd., Daejeon, Republic of Korea) and used for GABA analysis by HPLC (see Section 2.7).

2.3. Preparation of Bacterial Suspension for LFG

The bacterial suspension was prepared as follows. Briefly, 100 μL of the glycerol stock of L. brevis GTL 79 strain were inoculated in 5 mL of MRS broth and incubated aerobically at 37 °C for 48 h. After incubation, 100 μL of the cultured broth were transferred to 5 mL of MRS broth and incubated under the same conditions. To obtain a sufficient amount of bacterial cell culture, 5 mL of the culture were transferred into 250 mL of MRS broth. After incubation at 37 °C for 48 h, the cultured broth was centrifuged at 8000× g for 5 min at 4 °C. The supernatant was discarded, and the pellet was washed three times and resuspended in a sterile M/15 Sörensen’s phosphate buffer. The buffer was prepared as follows: 5.675 g of Na2HPO4 and 3.630 g of KH2PO4 (all from Sigma) were dissolved in 1 L of distilled water and autoclaved at 121 °C for 15 min. The final concentration of bacterial cells in the suspension was adjusted to 9 Log CFU/mL, and the bacterial suspension was further used for green tea fermentation (see Section 2.4).

2.4. Optimisation of Fermentation Conditions of LFG Fermented with Levilactobacillus brevis GTL 79

Adaptive OFAT method, one of the major successive optimisation processes, was applied as suggested by previous studies [24,25,26,27]. To optimise the fermentation conditions for LFG fermented with L. brevis GTL 79, various concentrations of fermentation alcohol (Ethanol Sales World Co. Ltd., Jeonju, Korea) and carbohydrates including glucose, fructose, and sucrose (all from Junsei Chemical Co., Tokyo, Japan) and fermentation temperatures were tested in in situ LFG fermentation experiments (Section 2.4.1, Section 2.4.2, Section 2.4.3). Changes in pH, lactic acid bacterial counts, and lactic acid and acetic acid content were measured every 24 h during fermentation.

2.4.1. Optimisation of Fermentation Alcohol Concentration

The green tea fermentation experiments were conducted following the procedure described in a previous study [36] with minor modifications. Briefly, 80 g of dried green tea leaves were added to 2 L of boiling distilled water and allowed to infuse for 5 min after which the infusion was filtered using a sterile sieve. After cooling to room temperature, fermentation alcohol at concentrations of 0, 1, 3, and 5% (v/v) were added. To avoid microbial contamination, the filtered infusion was aseptically filtered again through a 0.2 µm-pore size cellulose nitrate membrane filter (Whatman, GE Healthcare UK Ltd., Buckinghamshire, UK). Approximately 200 mL of the filtrate was aseptically poured into a sterile 500 mL Erlenmeyer flask that had been previously autoclaved at 121 °C for 15 min. Bacterial suspension was added to the green tea sample at a final concentration of 7 Log CFU/mL, and the Erlenmeyer flask was plugged with a sterile porous silicon stopper. The inoculated green tea samples were aerobically fermented at 37 °C for 5 days.

2.4.2. Optimisation of Carbohydrate Type and Concentration

The green tea was prepared as above (Section 2.4.1) with modifications as follows. After infusing the green tea leaves in boiling distilled water for 5 min and filtering through the sterile sieve, 10% (w/v) of each carbohydrate (glucose, fructose, and sucrose) was immediately dissolved in the hot filtered infusion. After cooling to room temperature, fermentation alcohol at concentrations of 1% (v/v; as optimised in Section 3.2) was added and the proceeding filtration, inoculation, and fermentation were carried out as in Section 2.4.1.
After optimisation of the type of carbohydrate, the concentration of glucose (see Section 3.2) dissolved into the sample was further optimised by adjusting the supplementing concentration (0, 2, 4, 6, 8, and 10%).

2.4.3. Optimisation of Fermentation Temperature

The green tea was prepared as above (Section 2.4.2) with modifications as follows. After infusing the green tea leaves in boiling distilled water for 5 min and filtering through the sterile sieve, 6% of glucose (w/v; as optimised in Section 3.2) was immediately dissolved in the hot filtered infusion and the proceeding supplementation with 1% fermentation alcohol, filtration, and inoculation were carried out as in Section 2.4.2. The inoculated green tea samples were aerobically fermented at 25, 30, 35, or 40 °C for 5 days.

2.5. Effect of MSG Supplementation on Microbial GABA Production in LFG

The green tea was prepared using the optimised fermentation alcohol and glucose concentrations and fermentation temperature conditions selected in Section 3.2. One percent MSG (w/v) was added simultaneously with the fermentation alcohol. Changes in GABA content were measured every 24 h during fermentation.

2.6. Experimental Groups for Evaluation of Functional Compounds and Antioxidative Activity of LFG

To investigate the influencing factors such as inoculum, supplementation (i.e., 1% fermentation alcohol, 6% glucose, and 1% MSG), and green tea on GABA content, total polyphenol content, and DPPH scavenging activity, LFG samples were divided into five experimental groups as follows: NN group (non-inoculated LFG samples with no supplementation; ●), NS group (non-inoculated LFG samples with supplementation; ○), IN group (inoculated LFG samples with no supplementation; ■), IS group (inoculated LFG samples with supplementation; □), and B group (blank group, the same as IS group except for green tea replaced with water; data not shown). The samples belonging to respective experimental groups were aerobically fermented at 37 °C for 5 days. Changes in pH, lactic acid bacterial counts, GABA content, total polyphenol content, and DPPH scavenging activity were measured during fermentation.

2.7. Measurements of Physicochemical and Microbial Properties

The physicochemical properties of green tea samples were measured as described below. Two milliliters of the samples were mixed with 18 mL of distilled water using a vortex. The pH of the mixture was measured using a pH meter.
The enumeration of lactic acid bacteria in the LFG samples was conducted using MRS agar as follows. Five milliliters of the samples were mixed with 45 mL of sterile 0.1% peptone saline in a sterile plastic bag using a stomacher. The mixture was 10-fold serially diluted with sterile 0.1% peptone saline up to 10−5, and 100 μL of each dilution was spread on MRS agar in duplicate. After anaerobic incubation at 37 °C for 48 h, the bacterial concentrations of the LFG samples were calculated by enumerating the colonies on the plates with 10–300 colonies [32] and adjusting for the dilution.

2.8. Ion Chromatography Analysis of Organic Acids

Quantitative analysis of the organic acids in the LFG samples was carried out as follows. The LFG samples were filtered through a 0.22 μm hydrophilic filter (EMD Millipore Corp., Billerica, MA, USA). Stock standard solutions of organic acids, including lactic acid and acetic acid, were prepared at a concentration of 10,000 mg/L in deionized water. Working solutions at concentrations of 0, 100, 500, and 1000 mg/L were prepared by diluting the stock solution in deionized water. All chemicals were of analytical-reagent grade (Sigma) and filtered through a 0.22 μm hydrophilic filter. Filtered solutions of the LFG samples were kept at −25 °C until analysed, and the standard solution was prepared just prior to use. Fifty microliters of the filtered solutions were injected into the following ion chromatography system for analysis.
The quantification of organic acids was performed by ion chromatography on a Dionex ICS-2500 system (Dionex, Sunnyvale, CA, USA), consisting of a GS50 gradient pump, an ED50 electrochemical detector, and an AS50 autosampler, equipped with an ICE-AS6 column. Chemical suppression was achieved by an anion-ICE micromembrane suppressor (AMMS-ICE 300, Dionex) with 5.0 mM tetrabutyl-ammonium hydroxide (Sigma) solution at a flow rate of 5 mL/min. The organic acids were eluted isocratically with 0.4 mM heptafluorobutyric acid (Sigma) in deionized water at a flow rate of 1 ml/min over a period of 25 min. Each sample was run three times nonconsecutively. Data acquisition and analysis were performed using the Chromeleon software (6.80 SR5; Dionex).

2.9. GABA Analyses in LFG Samples and Bacterial Cultures

2.9.1. GABA Extraction from LFG Samples and Bacterial Cultures

Quantification of GABA content in LFG sample was conducted as previously described by Baum et al. [37] and modified by Park and Oh [35]. Briefly, 800 µL of mixed organic solvent solution (methanol: chloroform: distilled water = 12:5:3, volume basis) were added to 200 µL of the LFG sample. The mixture was centrifuged at 13,000× g for 15 min at 4 °C, and the supernatant was collected and centrifuged again under the same conditions. The supernatant was then freeze-dried, resuspended in distilled water, and filtered through 0.45 µm filter paper.
The bacterial production of GABA was measured as follows. One milliliter of the culture prepared in Section 2.2 was transferred into 10 mL of MRS broth supplemented with 1% MSG and incubated at 37 °C for 48 h. After incubation, the cultured broth was filtered through sterile 0.2 µm pore-size syringe filter (Millipore).

2.9.2. Derivatisation of Extracts and Standard Solution

Derivatisation of GABA was conducted using AccQ∙Flour reagent kit (Waters, Milford, MA, USA) according to the manufacturer’s instructions with minor modification. Briefly, 20 µL of the extract or standard solution prepared in the previous Section were mixed with 70 µL of borate buffer and 20 µL of 6-aminoquinolyl-N-hydroxysuccinimidyl carbamate. The mixture was incubated at room temperature for 1 min, then at 55 °C for 10 min. The mixture was filtered through 0.2 µm pore-size syringe filter and analyzed by HPLC.

2.9.3. Chromatographic Separation

Chromatographic separation of GABA in the filtrates prepared above (Section 2.9.2) was conducted according to the method developed by Baum et al. [37]. An HPLC unit (YL 9100, Young Lin Instrument, Co., Anyang, Republic of Korea) equipped with a UV–Vis detector (YL 9120, Young Lin) and Autochro-3000 software (Young Lin) was employed. A Nova-Pak C18 4 μm column (150 × 3.9 mm, Waters) held at 37 °C was used with AccQ∙Tag Eluent A (solvent A; Waters) and 60% acetonitrile diluted with deionized water (solvent B; SK chemicals, Ulsan, Republic of Korea) as the mobile phases adjusted to a flow rate of 1 mL/min. The gradient elution mode was as follows: 0 min (A:B, 100:0), 0.5 min (98:2), 15 min (93:7), 32 min (67:33), 33 min (67:33), 34 min (0:100), 37 min (0:100), 38 min (100:0), and 50 min (100:0). A 10 µL sample was injected and monitored at 254 nm. Typical chromatograms are shown in Figure 2.

2.10. Catechin Analyses in LFG Samples

Quantitative analysis of catechins in the LFG sample was carried out based on the procedure described in a previous study [38]. Standard solutions with concentrations of 0, 10, 50, 100, and 1000 ppm were prepared for (−)-epigallocatechin gallate (EGCG), (−)-epigallocatechin (EGC), (−)-epicatechin gallate (ECG), and (−)-epicatechin (EC) (all from Sigma). The LFG sample or working standard solution were mixed with the same volume of acetonitrile and filtered through a 0.2 µm pore-size syringe filter. Ten microliters of the filtrate and working standard solution were injected into the following HPLC system for analysis.
Chromatographic separation of catechins was performed according to the method previously described by Henning et al. [38]. An HPLC unit (Young Lin) equipped with a UV/vis detector (Young Lin) and Autochro-3000 data system (Young Lin) was used. For chromatographic separation, a Nova-Pak C18 4 µm column (150 mm × 3.9 mm, Waters) held at room temperature was utilized. The mobile phases were acetonitrile (solvent A; SK chemicals) and a mixture (solvent B) consisting of 0.1% acetic acid (pH 3.5), acetonitrile, and tetrahydrofuran at the ratio of 96:2:2 (volume basis). Catechins were eluted with the following gradient: at time 0 min, 100% B; at time 45 min, 40% B; at time 47 min, 100% B. The equilibration period was 8 min. An analyte was monitored at 260 nm.

2.11. Total Polyphenol Content

Total polyphenol content was measured according to the procedures developed by Zhu et al. [39] and modified by Jeng et al. [40]. To 150 μL of the LFG samples and standards, 750 μL of Folin and Ciocalteu’s phenol reagent (50%; Sigma) were added. After 3 min, 600 μL of sodium carbonate (2%) reagent were also added. Subsequently, the mixture was incubated in the dark at room temperature for 30 min. After incubation, the absorbance was measured at 750 nm with a spectrophotometer (Lambda 35, PerkinElmer Ltd., Waltham, MA, USA). Gallic acid (GA; Sigma) was used as a standard for the calibration curve.

2.12. DPPH (1,1-Diphenyl-2-picrylhydrazyl) Radical Scavenging Activity

As a representative method for the analysis of antioxidative activity of plant extract suggested by previous studies [41,42], DPPH radical scavenging capacity assay was assessed using the method described by Jeng et al. [40]. Briefly, 0.5 mL of freshly prepared 1 mM DPPH radical solution (Sigma) dissolved in 4 mL methanol (SK chemicals) was added to 25 µL of LFG and thoroughly mixed. After incubation at room temperature for 30 min, the absorbance was measured at 517 nm with a spectrophotometer. Ascorbic acid (Sigma) was used as a positive control. The scavenging activity was calculated as follows: DPPH radical scavenging activity (%) = 1 − absorbance of sample/absorbance of control × 100.

2.13. Statistical Analyses

Data were presented as means and standard deviations of triplicates. The significance of differences was determined by one-way analysis of variance (ANOVA) with Fisher’s pairwise comparison module of the Minitab statistical software, version 17 (Minitab Inc., State College, PA, USA), and differences with probability p value of < 0.05 were considered statistically significant.

3. Results and Discussion

3.1. Selection of Lactobacillus Strain with High GABA Production for Fermentation of LFG

In this study, to develop fermented green tea with high GABA content, 565 strains of LAB were isolated from green tea leaves, and strains were tested sequentially (if necessary) for acid production, growth potential, catechin resistance, and GABA production as follows. Of the 565 isolated strain, 113 strains identified as gram-positive rod-shaped bacteria via gram staining were selected as tentative Lactobacillus spp. for the next screening stage. Following, acid production (pH) and growth potential (OD600), as measures of microbial metabolic activity that indicate appropriate fermentation, of the 113 isolates of Lactobacillus spp. were determined. Since many strains of L brevis and L. plantarum have been shown to produce GABA [43], L. brevis KCTC 3498 and L. plantarum KCTC 3108 were also tested and used as reference strains to compare the two measures to those of the selected isolated strains. Consequently, 25 isolates with either higher acid production (i.e., lower pH) or growth potential (i.e., higher OD600) than the reference strains were selected for the final screening process (Table 1). In the final screening stage, catechin resistance and GABA production capability of the 25 isolates of Lactobacillus spp. were examined. It has been reported that the catechins found in green tea act as microbial growth inhibitors [44,45,46]. Therefore, the 25 isolates were subjected to a catechin resistance test, and all 25 strains showed a higher growth potential and shorter lag phase than the reference strains, thus concluding the strains have high resistance to catechins. To enhance the GABA content of LFG, the GABA production of the 25 isolates was measured. Compared to the GABA production of reference strains L. brevis KCTC 3498 and L. plantarum KCTC 3108 (13.39–17.08 µg/mL) and the other isolated candidates (0.90–2.05 µg/mL), Lactobacillus strain GTL 79 showed the most outstanding GABA production (324.07 ± 62.04 µg/mL) and was ultimately selected for lactic acid fermentation of green tea. In summary, Lactobacillus strain GTL 79 showed similar or greater metabolic activity and catechin resistance, and the highest GABA production compared to both the reference strains and all other isolated Lactobacillus strains (Table 1). Through 16S rRNA sequencing, Lactobacillus strain GTL 79 was identified at Levilactobacillus brevis.
It has been reported that the catechins of green tea have antimicrobial activity to inhibit the growth of both pathogenic bacteria and LAB [44,45,46,47]. According to Tabasco et al. [46], the sensitivity of LAB to catechins might be genus-dependent, species-dependent and/or strain-dependent and may be caused by catechin degradation. Therefore, the level of resistance to catechin of L. brevis GTL79 may be attributed to catechin degradation. This speculation was supported by our supplementary experiment that measured catechin degradation in LFG fermented with L. brevis GTL 79 (Figure S2).
Meanwhile, various GABA-producing LAB, such as L. brevis, L. plantarum, Lentilactobacillus buchneri (formerly Lactobacillus buchuneri), Latilactobacillus sakei (formerly Lactobacillus sakei), Lacticaseibacillus rhamnosus (formerly Lactobacillus rhamnosus), Levilactobacillus namurensis (formerly Lactobacillus namurensis), L. bulgaricus, and L. helveticus, have been isolated from kimchi, fermented pickle, cheese, fermented sausage, fermented seafood, and other fermented foods [22,43,48]. Furthermore, such LAB strains from various sources were applied to industrial production of GABA supplement [49] or enhancement of GABA content in some fermented foods such as fermented soymilk and dairy products [22,43,48]. Particularly, L. brevis has been reported to have significantly higher GABA production than other LAB and is therefore often used in starter cultures for fermented foods [43]. Of the GABA-producing Lactobacillus strains isolated from green tea leaves in this study, the ultimately selected L. brevis GTL 79 strain showed the highest GABA production. Consequently, the selected strain has the potential to be used as a starter culture in functional fermented foods, particularly LFG. In addition, a L. brevis strain isolated from fish, a protein-rich food, was reported to produce higher levels of GABA [49] than the L. brevis GTL 79 originated from green tea leaves, protein-poor food materials, in the current study. It seems to be inevitable that the former is more capable of producing GABA than the latter, considering the difference in the protein content of the food sources from which the strains were isolated. Therefore, it may also be valuable to apply such prolific GABA-producing LAB strains from protein-rich foods to lactic acid fermentation of green tea in the future. Nevertheless, when exogenous or heterogeneous LAB strains are introduced into the fermentation, many factors such as safety, security, and unexpected risks should be considered in addition to functionality.

3.2. Optimisation of Fermentation Conditions of LFG for Enhancement of Microbial Metabolic Activity

Using L. brevis GTL 79 as the inoculum for lactic acid fermentation of green tea, various fermentation conditions, including fermentation alcohol concentration, carbohydrate type and concentration, and fermentation temperature, were optimised to enhance the metabolic activity of the fermenting microorganism. According to the adaptive OFAT method, one of the major successive optimisation processes suggested by previous reports [24,25,26,27], once one condition was optimised, it was applied in the following stage to optimise the next fermentation condition and so on until all factors were optimised. In each optimisation stage, pH and lactic acid bacterial counts were measured and used as indicators of appropriate fermentation. As lactic acid and acetic acid are the main fermentation metabolites produced by L. brevis, the content of these organic acids was also determined concurrently.
Fermentation alcohol has been used to enhance the metabolic activity of acetic acid bacteria (AAB) used in the acetic fermentation of foods [50]. Furthermore, previous research has shown that, while the concentration of fermentation alcohol can extend the shelf-life of lactic acid fermented foods [51], depending on the methods used in the studies, concentrations of above 2.5% or 4% can inhibit the growth of LAB [51,52]. However, studies on the use of fermentation alcohol for acetic acid production by LAB have not been reported. Therefore, the current study examined the effect of various concentrations (0, 1, 3, and 5%) of fermentation alcohol to determine the optimal supplementation concentration to be used in LFG. An LFG sample without fermentation alcohol served as the control. In our preliminary tests (data not shown), the initial pH of the control and all LFG samples supplemented with fermentation alcohol was 5.49–5.58 and fell to 4.70–4.91 throughout the fermentation period. The control and LFG samples supplemented with either 1% or 3% fermentation alcohol showed no significant differences in pH during fermentation. However, LFG samples with 5% fermenting alcohol had relatively higher pH values. The initial lactic acid bacterial counts of all samples were within the range 6.63–7.07 Log CFU/mL and slightly decreased to 6.22–6.54 Log CFU/mL during the fermentation period. Similarly, the control and LFG samples supplemented with either 1% or 3% fermentation alcohol showed no significant differences in lactic acid bacterial counts during fermentation, while the samples supplemented with 5% fermentation alcohol contained relatively lower counts. The lactic acid and acetic acid content in all samples were both 0 µg/mL at the start of fermentation and gradually rose to 44.59–86.59 µg/mL and 52.06–83.64 µg/mL, respectively, by the end of the experiment. The LFG samples supplemented with either 1% or 3% fermentation alcohol contained relatively higher concentrations of lactic and acetic acid than both the control and LFG samples with 5% fermentation alcohol. Particularly, organic acid production was highest in the LFG sample supplemented with 1% fermentation alcohol. Therefore, as seen in Figure 3, supplementation with 1% fermentation alcohol was selected as the optimal condition in this step.
The type and concentration of carbohydrates, such as glucose, fructose, and sucrose, can have an impact on the growth and metabolic activity of LAB [53]. Therefore, in the second optimisation step, LFG samples were prepared with 10% supplementation of either glucose, fructose, or sucrose along with 1% fermentation alcohol selected in optimisation step 1. The carbohydrate with the best overall results in terms of pH, lactic acid bacterial counts, and organic acid production was selected, and the test was run again at various concentrations (2, 4, 6, 8, and 10%) to further optimise fermentation conditions. An LFG sample without carbohydrate supplementation was run alongside as the control. In our preliminary tests (data not shown), the initial pH of 5.69–5.70 gradually fell to 3.69–5.15 throughout fermentation in all the LFG samples. While all the supplemented LFG samples (with 10% supplementation of each carbohydrate) showed significantly lower pH than the control after the fermentation period, there was no significant difference between the supplemented samples. The lactic acid bacterial counts of all samples were relatively similar and remained at a constant 6.72–6.82 Log CFU/mL throughout the fermentation period. All samples started with lactic acid and acetic acid content of 0 µg/mL which rose to 83.15–155.23 µg/mL and 40.37–57.09 µg/mL, respectively, by the end of the fermentation period. While all the supplemented LFG samples showed significantly higher organic acid production than the control, samples supplemented with glucose resulted in the highest organic acid production. Therefore, glucose was chosen as the optimal carbohydrate and the effect of various supplemental concentrations (2, 4, 6, 8, and 10%) were consequently compared. The pH of the control and LFG samples supplemented with glucose at different concentrations dropped from the initial 5.62–5.66 to 3.95–5.20 by the end of the experimental period. All the glucose-supplemented samples had significantly lower pH than the control, with supplementation of 2%, 4%, and 6% glucose resulting in significantly lower pH than samples with 8% or 10% glucose supplementation. Although the lactic acid bacterial counts of all glucose-supplemented samples and the control remained at a consistent 6.53–7.05 Log CFU/mL, the counts of the control slightly decreased whereas that of the supplemented LFG samples either slightly increased or did not change. Nevertheless, there was no significant difference between the lactic acid bacterial counts of the samples. The lactic acid and acetic acid content of all samples rose from 0 µg/mL to 19.90–232.85 µg/mL and 21.93–136.28 µg/mL, respectively, by day 5. The glucose-supplemented samples resulted in organic acid concentrations much higher than the control, with glucose supplementation of 6% significantly showing the highest organic acid production among all the samples throughout the fermentation period. As such, a carbohydrate supplementation of 6% glucose was ultimately chosen as the optimal fermentation condition in optimisation step 2.
It has been reported that the optimal temperature for the growth and metabolic activity of L. brevis varies depending on strain and fermentation condition [22,43]. As such, the current study examined fermentation at various temperatures (25, 30, 35, and 40 °C) in the third stage of optimisation alongside supplementation of 1% fermentation alcohol and 6% glucose selected in steps 1 and 2. In our preliminary tests (data not shown), there was no significant difference in the pH of all LFG samples fermented at different temperatures throughout the fermentation period. While most LFG samples showed no significant change in the lactic acid bacterial counts, the samples fermented at 40 °C showed a steady decline in the counts throughout the fermentation period. The lactic acid and acetic acid content of the LFG sample fermented at 35 °C was the highest on day 5 of fermentation with values of 159.53 µg/mL and 99.39 µg/mL respectively (Figure 3, ◇). Although fermentation at 35 °C was the most optimal among the temperatures tested in optimisation step 3, it was not as beneficial to the pH, lactic acid bacterial counts, and organic acid content of LFG as the temperature used in step 2 (37 °C). Therefore 37 °C was selected as the optimal fermentation temperature (Figure 3, ■).
The changes in pH, lactic acid bacterial count, and organic acid content obtained under optimal conditions selected in each optimisation step are compiled in Figure 3. The pH of all fermentation optimisation stages gradually fell from 5.49–6.01 to 4.20–5.38 during the fermentation period. The pH change caused by the optimal supplementation of 1% fermentation alcohol was insignificant when compared to the control. However, the pH of the LFG sample supplemented with 1% fermentation alcohol and 6% glucose, selected as the optimum in stage 2, fell to 4.20 by day 5 of fermentation and was confirmed to be the lowest pH among those obtained in all optimisation steps. The lactic acid bacterial counts of each optimisation stage were similar, within the range 6.54–7.07 Log CFU/mL. The lactic acid bacterial counts in stage 1 gradually fell, and although the counts slightly rose at the beginning of the fermentation period in optimisation stage 2, by day 5 the count fell back down to the initial baseline. The initial lactic acid and acetic acid content of all optimisation stages was 0 µg/mL and rose to 44.59–232.85 µg/mL and 57.09–136.28 µg/mL, respectively. The organic acid content on day 5 increased with each successive optimisation stage. As the fermentation temperature of 37 °C used in optimisation stage 2 was more beneficial to pH, lactic acid bacterial counts, and organic acid content than the results of fermentation at 35 °C in stage 3, together with the results above, the optimal fermentation conditions of LFG for the enhancement of microbial metabolic activity were ultimately selected to be supplementation with 1% fermentation alcohol and 6% glucose and fermentation at 37 °C.
In the current study, the adaptive OFAT method was applied for the optimisation of fermentation conditions of LFG for the enhancement of microbial metabolic activity. This method can reduce the experimental run size compared to other statistical methods by successively testing a single factor and carrying the best result to the following optimisation step in testing the next factor [27]. If the results of an optimisation step show worse results than a previous step, that factor is then omitted from future optimisations [27]. Unlike statistical methods, this prevents redundant and insignificant experiments from being included in the experimental procedure. Besides, as studies on the optimisation of fermentation conditions of LFG have not been found in the literature, an adaptive OFAT method may be the most suitable for the initial stage of the optimisation process as suggested by previous reports [25,26].
It has been reported that the lactic acid produced by LAB, has various functionalities such as anti-oxidative [8,9] and anti-inflammatory [10] effects, while acetic acid has been reported to be anti-diabetic [11], anti-hypertensive [12], and hypocholesterolemic [13]. Fermentation alcohol has been used in acetic acid fermentation by AAB to enhance microbial metabolic activity [50]. However, the use of fermentation alcohol for acetic acid production by LAB is lacking in scientific literature. The current study confirmed that L. brevis GTL 79 is able to produce increased amounts of both lactic acid and acetic acid with fermentation alcohol supplementation. The conversion of ethanol to acetic acid by alcohol dehydrogenase and acetaldehyde dehydrogenase enzymes found in some L. brevis strains may explain this increased acetic acid content [54,55]. Therefore, when fermentation alcohol and the strain are used together in lactic acid fermentation, the benefits resulting from the production of acetic acid, along with those of lactic acid, are expected to be seen in the fermented product.

3.3. Effect of MSG Supplementation on Microbial GABA Production in LFG

MSG is a sodium salt of glutamic acid that can be bio-converted into GABA in some microorganisms via glutamic acid decarboxylase [23]. Several studies reported that supplementation of appropriate levels of MSG may enhance GABA production rate. Komatsuzaki et al. [56] found that as MSG supplementation concentration increased, the GABA production of Lacticaseibacillus paracasei (formerly Lactobacillus paracasei) also increased. Conversely, an MSG concentration of above 2–4% has been shown to increase the osmotic pressure of bacterial cells and hinder metabolic activity and by extension, GABA production [57,58]. Additionally, depending on the food product, an MSG concentration of over 1% may be detrimental to the sensory qualities of the food [59]. Based on these previous studies, the current research examined whether MSG supplementation of 1%, used along with the optimised fermentation conditions selected in Section 3.2, increased the GABA production of LFG fermented by L. brevis GTL 79.
The initial GABA content of LFG samples fermented under non-optimal conditions (i.e., non-supplemented) was 2.83 µg/mL and approximately tripled to 8.59 µg/mL by the end of fermentation. LFG samples fermented under optimal conditions and supplemented with 1% MSG contained an initial GABA content of 4.20 µg/mL, which then significantly increased to 28.49 µg/mL during fermentation. Previous research has confirmed the GABA content enhancing effects of fermentation temperature [22,28] as well as moderate supplementation of fermentation alcohol [60,61] and carbohydrates [48], while the current study confirmed the GABA content enhancing effect of MSG supplementation (Figure 4). Therefore, supplementation with 1% fermentation alcohol, 6% glucose, and 1% MSG at 37 °C, was ultimately chosen as the final optimised fermentation conditions to enhance not only the microbial metabolic activity, but also the GABA production capability, of LFG. Meanwhile, pH adjustment and supplementation of peptone and pyridoxal phosphate have been reported to affect in vitro GABA production of LAB [22,49]. Thus, in the future at the industrial level, it may be necessary to provide knowledge about the influence of such factors on the enhancement of GABA production in LFG, although those may lead to adverse changes in unique organoleptic properties of green tea expected by consumers.
Although LFG is similar with kombucha as a fermented green tea-based beverage, the former is only fermented with LAB while yeast is compulsory in the fermentation of the latter [29]. In addition, in terms of GABA content, there is no research on GABA in kombucha, while in this study, an increase of GABA content was observed during the fermentation of LFG. As GABA exhibits anti-depressant [62], anti-hypertensive [63], anti-diabetic [64], and anti-inflammatory [65] effects, it has the benefit of being used in the prevention and treatment of depression, hypertension, diabetes, and inflammation. An animal study [66] has shown LFG to have effective anti-adipogenic and anti-obesity effects, which may be due to the high content of polyphenols and other functional compounds [67]. Thus, it is expected that LFG high in organic acids and GABA via the optimised fermentation conditions, together with the antioxidative activity of polyphenols found in green tea, would be beneficial to health. Clinical research could be useful to examine whether LFG would have the benefits for humans.

3.4. Evaluation of Functional Compounds and DPPH Scavenging Activity of LFG

It is well known that green tea contains a wide variety of polyphenols which have beneficial functions including antioxidative activity [6]. As such, the antioxidative activity derived from the total polyphenol content and the GABA content of LFG fermented with L. brevis GTL79 using the optimised conditions was evaluated by DPPH radical scavenging capacity assay as suggested by previous studies [41,42]. pH and lactic acid bacterial counts were measured and used as indicators of appropriate fermentation.
As seen in Figure 5a, the initial pH of all groups was 5.18–5.23. The pH of both the B group (data not shown) and the non-inoculated groups (NN group and NS group) gradually fell to 4.78–5.07 by the end of the fermentation period. Conversely, the pH of the inoculated groups (IN group and IS group) decreased to 4.25 and 4.52, respectively, which was lower than that of the non-inoculated groups and indicates that LFG was appropriately fermented. As expected, LAB were not detected in non-inoculated groups, while the lactic acid bacterial counts of inoculated groups remained at 7.04–7.06 Log CFU/mL throughout the whole fermentation. Conversely, the lactic acid bacterial counts of the B group gradually fell from an initial 7.17 Log CFU/mL to 4.14 Log CFU/mL by day 5, indicating that green tea may provide micronutrients and/or growth factors that are lacking in water [33].
The change in GABA content is shown in Figure 5b. The initial GABA content of all groups was 1.42–2.29 µg/mL. While the GABA content of non-inoculated groups slightly decreased to 0.99–1.12 µg/mL during fermentation, that of inoculated groups (IN and IS groups) increased to 12.21 µg/mL and 30.25 µg/mL, respectively. Particularly, on day 1 of fermentation, the GABA content of the IS group sharply rose to 19.46 µg/mL, and then slightly increased thereafter. This confirms that the ultimately selected optimised fermentation conditions led to an increase in GABA content in LFG. Meanwhile, the B group, in comparison had an initial GABA content of 1.20 µg/mL, which then increased to 4.11 µg/mL, far below both of the inoculated groups, by the end of fermentation. This indicates that even without supplementation, the bioactive compounds found in green tea are necessary for the growth of microorganisms and eventually influence microbial GABA production. While further research is needed to confirm conclusively which compounds in green tea leaves contribute to GABA production, methods developed by this study can be applied to other natural substances with similar functionalities as green tea leaves. Through the use of such methods in natural food products similar to green tea, the anti-depressant, anti-hypertensive, anti-diabetic, and anti-inflammatory effects of GABA [68] may also be observed.
The total polyphenol content change during fermentation is presented in Figure 5c. With the exception of the B group from which no polyphenols were detected, the other groups contained an initial total polyphenol content of 1057.26–1063.448 µg/mL which is similar to the value (1150 µg/mL) found by Fukushima et al. [69]. While the total polyphenol content of both the non-inoculated and inoculated groups decreased as the experiment progressed, the content of the former groups (866.52–904.79 µg/mL; 14.91–18.04% reduction) fell significantly more than that of the latter groups (973.61–1001.45 µg/mL; 5.74–8.23% reduction). Wang et al. [70] found that major green tea catechins such as EGCG, EGC, ECG, and EC degrade over time in storage. The degradation of green tea catechins, including EGCG, ECG, and EC (except for EGC, not detected), was also observed in our preliminary test (Figure S2). Such results may be due to polyphenol oxidase in green tea leaves [71], resulting in a decrease in the total polyphenol content. It is noteworthy that a lesser reduction of total polyphenol content of inoculated groups than non-inoculated groups was observed, which can be explained by a decrease in pH during the fermentation period. Teng et al. [72] reported that the activity of polyphenol oxidase isolated from green tea leaves remarkably decreased when the environmental pH value was lower than 5.5. Regardless of such speculation, in the current study, total polyphenol content of the inoculated groups slightly increased on day 2 of fermentation. As previous studies using LAB, including L. brevis, in the fermentation of sourdough have shown an increase in total polyphenol content [73,74], the polyphenol production rate of L. brevis GTL 79 used in the inoculated groups of the current study might also offset the degradation rate of polyphenols. As such, future research is needed to confirm whether these hypotheses are in fact the case.
The change in DPPH scavenging activity throughout fermentation is shown in Figure 5d. With the exception of the B group, the initial DPPH scavenging activity of all other groups was 87.99–89.09%. The DPPH scavenging activity of the non-inoculated groups remained constant throughout the experimental duration, while that of the inoculated groups rose sharply to 92.74–93.72% by day 1 and slightly increased to 94.38–95.11% by day 5. As it is known that DPPH scavenging activity is influenced by the total polyphenol content [75], the initial activity observed in this study seems to be attributed to the initial polyphenol content in green tea. However, the DPPH scavenging activity of the inoculated groups gradual increased even though there was a slight decrease in total polyphenol content, which suggests that some substances other than polyphenols caused the increase in DPPH scavenging activity in LFG. Liu et al. [76] reported that GABA also influences DPPH scavenging activity. This can explain the increase in DPPH scavenging activity in the inoculated groups. The slight increase in DPPH scavenging activity in the B group can also be explained by this speculation as the GABA content increased while polyphenols were not detected. On the other hand, although the GABA content of the IS group was higher than that of the IN group (30.25 µg/mL and 12.21 µg/mL, respectively), there was no significant difference in the DPPH scavenging activity between the two groups. Thus, it is speculated that lactic acid [8,9], acetic acid [77], and other metabolic compounds produced during fermentation might also influence DPPH scavenging activity. As the functional compounds responsible for such changes in DPPH scavenging activity of LFG are still unconfirmed, research is needed to conclusively identify the influencing compounds. Meanwhile, based on previous studies [41,42], the DPPH radical scavenging capacity assay may be suitable for estimating in vitro antioxidative activity of plant-based extracts. These studies found that there are strong positive correlations between the assays used to analyse in vitro antioxidative activity, such as DPPH, FRAP (ferric reducing antioxidant power), and ABTS (2,2′-azino-bis-3-ethylbenzthiazoline-6-sulphonic acid), and suggested that it might be redundant to estimate the activity by using more than one assay. For further application to clinical and food industries, it is necessary to evaluate the antioxidative activity using more than two assays as well as in vivo and clinical tests.

4. Conclusions

Existing literature on GABA production and content in green tea is limited. In this study, therefore, to develop fermented green tea with high GABA content, L. brevis GTL 79 with outstanding capability of producing GABA was selected. Furthermore, this strain has the potential to be used as a starter culture in LFG as well as other functional fermented foods, and the catechin-degrading capability of L. brevis GTL 79 might be valuable for use in the food and medical industries.
Through the process of optimising the fermentation conditions of LFG, fermentation at 37 °C with supplementation of 1% fermentation alcohol, 6% glucose, and 1% MSG were determined to be the most effective at improving the content of bioactive compounds in LFG. By using these optimal conditions, the lactic acid, acetic acid, and GABA content of LFG increased by 522.20%, 238.72% and 232.52% (or 247.58%), respectively. Such an intensive optimisation process can be extended to other lactic acid fermented products to increase their bioactive compound content.
While the initial DPPH scavenging activity of LFG is attributed to polyphenols, as fermentation progresses, the effect of bioactive compounds such as lactic acid, acetic acid, and GABA produced by L. brevis GTL 79 appears to be more significant. Lactic acid, acetic acid, GABA, and polyphenols have been reported to provide various health promoting properties. Therefore, as the optimally fermented LFG in this study might have the effects derived from the bioactive compounds, in-depth clinical studies are suggested.
Taken together, although this study was conducted to build fundamental knowledge about GABA fortification of green tea through lactic acid fermentation, all the research outcomes may be valuable in industrial application. Therefore, it is expected that research on the scale-up process for industrial production will be conducted in the future.

Supplementary Materials

The following are available online at https://www.mdpi.com/article/10.3390/fermentation7030110/s1, Figure S1: Flow chart of screening process for selecting strain used for LFG. Figure S2: Degradation of (−)-epigallocatechin gallate (EGCG), (−)-epicatechin gallate (ECG), and (−)-epicatechin (EC) in LFG fermented with L. brevis GTL 79 strain under optimal fermentation conditions.

Author Contributions

Conceptualization, J.-H.M.; Investigation, Y.H.J., J.H.H., J.-H.L., H.Y. and S.J.Y.; Writing—original draft preparation, Y.H.J., J.H.H. and J.-H.M.; Writing—review and editing, A.M.P. and J.-H.M.; Supervision, J.-H.M. All authors have read and agreed to the published version of the manuscript.

Funding

This study was supported by a grant from the Ottogi Foundation (14-010).

Acknowledgments

Y.H.J. and J.H.H. were supported by the Brain Korea 21 Fostering Outstanding Universities for Research from the Korean Ministry of Education. A.M.P was supported by the Korea Government Scholarship Program (KGSP) from the National Institute for International Education (NIIED).

Conflicts of Interest

The authors declare no conflict of interest.

References

  1. Harbowy, M.E.; Balentine, D.A.; Davies, A.P.; Cai, Y. Tea chemistry. Crit. Rev. Plant Sci. 1997, 16, 415–480. [Google Scholar] [CrossRef]
  2. Lee, J.E.; Lee, B.J.; Chung, J.O.; Shin, H.J.; Lee, S.J.; Lee, C.H.; Hong, Y.S. 1H NMR-based metabolomic characterization during green tea (Camellia sinensis) fermentation. Food Res. Int. 2011, 44, 597–604. [Google Scholar] [CrossRef]
  3. Fujiki, H.; Suganuma, M.; Imai, K.; Nakachi, K. Green tea: Cancer preventive beverage and/or drug. Cancer Lett. 2002, 188, 9–13. [Google Scholar] [CrossRef]
  4. Sharma, V.K.; Bhattacharya, A.; Kumar, A.; Sharma, H.K. Health benefits of tea consumption. Trop. J. Pharm. Res. 2007, 6, 785–792. [Google Scholar] [CrossRef]
  5. Suzuki, Y.; Miyoshi, N.; Isemura, M. Health-promoting effects of green tea. Proc. Jpn. Acad. Ser. B 2012, 88, 88–101. [Google Scholar] [CrossRef] [PubMed] [Green Version]
  6. Suzuki, T.; Pervin, M.; Goto, S.; Isemura, M.; Nakamura, Y. Beneficial effects of tea and the green tea catechin epigallocatechin-3-gallate on obesity. Molecules 2016, 21, 1305. [Google Scholar] [CrossRef] [PubMed] [Green Version]
  7. Caplice, E.; Fitzgerald, G.F. Food fermentations: Role of microorganisms in food production and preservation. Int. J. Food Microbiol. 1999, 50, 131–149. [Google Scholar] [CrossRef]
  8. Groussard, C.; Morel, I.; Chevanne, M.; Monnier, M.; Cillard, J.; Delamarche, A. Free radical scavenging and antioxidant effects of lactate ion: An in vitro study. J. Appl. Physiol. 2000, 89, 169–175. [Google Scholar] [CrossRef]
  9. Kim, J.Y.; Lee, M.Y.; Ji, G.E.; Lee, Y.S.; Hwang, K.T. Production of γ-aminobutyric acid in black raspberry juice during fermentation by Lactobacillus brevis GABA100. Int. J. Food Microbiol. 2009, 130, 12–16. [Google Scholar] [CrossRef]
  10. Hearps, A.C.; Tyssen, D.; Srbinovski, D.; Bayigga, L.; Diaz, D.J.D.; Aldunate, M.; Cone, R.A.; Gugasyan, R.; Anderson, D.J.; Tachedjian, G. Vaginal lactic acid elicits an anti-inflammatory response from human cervicovaginal epithelial cells and inhibits production of pro-inflammatory mediators associated with HIV acquisition. Mucosal Immunol. 2017, 10, 1480–1490. [Google Scholar] [CrossRef] [Green Version]
  11. Fushimi, T.; Suruga, K.; Oshima, Y.; Fukiharu, M.; Tsukamoto, Y.; Goda, T. Dietary acetic acid reduces serum cholesterol and triacylglycerols in rats fed a cholesterol-rich diet. Br. J. Nutr. 2006, 95, 916–924. [Google Scholar] [CrossRef] [PubMed] [Green Version]
  12. Kondo, S.; Tayama, K.; Tsukamoto, Y.; Ikeda, K.; Yamori, Y. Antihypertensive effects of acetic acid and vinegar on spontaneously hypertensive rats. Biosci. Biotechnol. Biochem. 2001, 65, 2690–2694. [Google Scholar] [CrossRef] [PubMed]
  13. Salbe, A.D.; Johnston, C.S.; Buyukbese, M.A.; Tsitouras, P.D.; Harman, S.M. Vinegar lacks antiglycemic action on enteral carbohydrate absorption in human subjects. Nutr. Res. 2009, 29, 846–849. [Google Scholar] [CrossRef]
  14. Ashraf, R.; Shah, N.P. Selective and differential enumerations of Lactobacillus delbrueckii subsp. bulgaricus, Streptococcus thermophilus, Lactobacillus acidophilus, Lactobacillus casei and Bifidobacterium spp. in yoghurt—A review. Int. J. Food Microbiol. 2011, 149, 194–208. [Google Scholar] [CrossRef] [PubMed]
  15. Şanlier, N.; Gökcen, B.B.; Sezgin, A.C. Health benefits of fermented foods. Crit. Rev. Food Sci. Nutr. 2019, 59, 506–527. [Google Scholar] [CrossRef]
  16. Park, H.; Cho, D.; Huang, E.; Seo, J.Y.; Kim, W.G.; Todorov, S.D.; Ji, Y.; Holzapfel, W.H. Amelioration of Alcohol Induced Gastric Ulcers Through the Administration of Lactobacillus plantarum APSulloc 331261 Isolated from Green Tea. Front. Microbiol. 2020, 11, 420. [Google Scholar] [CrossRef] [PubMed] [Green Version]
  17. Gorbach, S.L. Probiotics and gastrointestinal health. Am. J. Gastroenterol. 2000, 95, S2–S4. [Google Scholar] [CrossRef]
  18. Nomura, M.; Kimoto, H.; Someya, Y.; Furukawa, S.; Suzuki, I. Production of γ-Aminobutyric acid by cheese starters during cheese ripening. J. Dairy Sci. 1998, 81, 1486–1491. [Google Scholar] [CrossRef]
  19. Yu, H.H.; Choi, J.H.; Kang, K.M.; Hwang, H.J. Potential of a lactic acid bacterial starter culture with gamma-aminobutyric acid (GABA) activity for production of fermented sausage. Food Sci. Biotechnol. 2017, 26, 1333–1341. [Google Scholar] [CrossRef]
  20. Bown, A.W.; Shelp, B.J. The metabolism and functions of γ-aminobutyric acid. Plant Physiol. 1997, 115, 1–5. [Google Scholar] [CrossRef] [Green Version]
  21. Adeghate, E.; Ponery, A.S. GABA in the endocrine pancreas: Cellular localization and function in normal and diabetic rats. Tissue Cell 2002, 34, 1–6. [Google Scholar] [CrossRef]
  22. Dhakal, R.; Bajpai, V.K.; Baek, K.H. Production of GABA (γ-aminobutyric acid) by microorganisms: A review. Braz. J. Microbiol. 2012, 43, 1230–1241. [Google Scholar] [CrossRef] [Green Version]
  23. Zhang, Y.; Song, L.; Gao, Q.; Yu, S.M.; Li, L.; Gao, N.F. The two-step biotransformation of monosodium glutamate to GABA by Lactobacillus brevis growing and resting cells. Appl. Microbial. Biotechnol. 2012, 94, 1619–1627. [Google Scholar] [CrossRef]
  24. Tajabadi, N.; Ebrahimpour, A.; Baradaran, A.; Rahim, R.A.; Mahyudin, N.A.; Manap, M.Y.A.; Baker, F.A.; Saari, N. Optimization of γ-aminobutyric acid production by Lactobacillus plantarum Taj-Apis362 from honeybees. Molecules 2015, 20, 6654–6669. [Google Scholar] [CrossRef] [PubMed] [Green Version]
  25. Lim, H.S.; Cha, I.T.; Roh, S.W.; Shin, H.H.; Seo, M.J. Enhanced production of gamma-aminobutyric acid by optimizing culture conditions of Lactobacillus brevis HYE1 isolated from kimchi, a Korean fermented food. J. Microbiol. Biotechnol. 2017, 27, 450–459. [Google Scholar] [CrossRef] [PubMed] [Green Version]
  26. Singh, V.; Haque, S.; Niwas, R.; Srivastava, A.; Pasupuleti, M.; Tripathi, C.K.M. Strategies for fermentation medium optimization: An in-depth review. Front. Microbiol. 2017, 7, 2087. [Google Scholar] [CrossRef] [PubMed]
  27. Frey, D.D.; Wang, H. Adaptive one-factor-at-a-time experimentation and expected value of improvement. Technometrics 2006, 48, 418–431. [Google Scholar] [CrossRef]
  28. Kim, S.H.; Lee, M.H.; Jeong, Y.J. Current trends and development substitute tea and plan in the Korean green tea industry. Food Ind. Nutr. 2014, 19, 20–25. [Google Scholar]
  29. Laureys, D.; Britton, S.J.; De Clippeleer, J. Kombucha tea fermentation: A review. J. Am. Soc. Brew Chem. 2020, 78, 165–174. [Google Scholar] [CrossRef]
  30. Xia, X.; Wang, B.; Fang, F. Enhancement of kombucha fermentation by adding lactic acid bacteria. Food Ferment. Ind. 2018, 44, 185–192. [Google Scholar]
  31. Nguyen, N.K.; Dong, N.T.N.; Nguyen, H.T.; Le, P.H. Lactic acid bacteria: Promising supplements for enhancing the biological activities of kombucha. Springerplus 2015, 4, 91. [Google Scholar] [CrossRef] [Green Version]
  32. International Organization for Standardization. ISO 7218:2007. In Microbiology of Food and Animal Feeding Stuffs—General Requirements and Guidance for Microbiological Examinations; ISO: Geneva, Switzerland, 2007. [Google Scholar]
  33. Hammes, W.P.; Hertel, C. Genus Lactobacillus Beijerinck. In Bergey’s Manual of Systematic Bacteriology, 1st ed.; Vos, P.D., Garrity, G., Jones, D., Krieg, N.R., Ludwig, W., Rainey, F.A., Schleifer, K.-H., Whitman, W.B., Eds.; Springer: New York, NY, USA, 2009; Volume 3, pp. 465–511. [Google Scholar]
  34. Baranyi, J.; Roberts, T.A. A dynamic approach to predicting bacterial growth in food. Int. J. Food Microbiol. 1994, 23, 277–294. [Google Scholar] [CrossRef]
  35. Park, K.B.; Oh, S.H. Enhancement of γ-aminobutyric acid production in Chungkukjang by applying a Bacillus subtilis strain expressing glutamate decarboxylase from Lactobacillus brevis. Biotechnol. Lett. 2006, 28, 1459–1463. [Google Scholar] [CrossRef] [PubMed]
  36. Jayabalan, R.; Subathradevi, P.; Marimuthu, S.; Sathishkumar, M.; Swaminathan, K. Changes in free-radical scavenging ability of kombucha tea during fermentation. Food Chem. 2008, 109, 227–234. [Google Scholar] [CrossRef]
  37. Baum, G.; Lev-Yadun, S.; Fridmann, Y.; Arazi, T.; Katsnelson, H.; Zik, M.; Fromm, H. Calmodulin binding to glutamate decarboxylase is required for regulation of glutamate and GABA metabolism and normal development in plants. EMBO J. 1996, 15, 2988–2996. [Google Scholar] [CrossRef] [PubMed]
  38. Henning, S.M.; Fajardo-Lira, C.; Lee, H.W.; Youssefian, A.A.; Go, V.L.; Heber, D. Catechin content of 18 teas and a green tea extract supplement correlates with the antioxidant capacity. Nutr. Cancer 2003, 45, 226–235. [Google Scholar] [CrossRef]
  39. Zhu, Q.Y.; Hackman, R.M.; Ensunsa, J.L.; Holt, R.R.; Keen, C.L. Antioxidative activities of oolong tea. J. Agric. Food Chem. 2002, 50, 6929–6934. [Google Scholar] [CrossRef]
  40. Jeng, K.C.; Chen, C.S.; Fang, Y.P.; Hou, R.C.W.; Chen, Y.S. Effect of microbial fermentation on content of statin, GABA, and polyphenols in Pu-Erh tea. J. Agric. Food Chem. 2007, 55, 8787–8792. [Google Scholar] [CrossRef] [PubMed]
  41. Clarke, G.; Ting, K.N.; Wiart, C.; Fry, J. Radical scavenging, ferric reducing activity potential and total phenolics content indicates redundancy in use of all three assays to screen for antioxidant activity of extracts of plants from the Malaysian rainforest. Antioxidants 2013, 2, 1–10. [Google Scholar] [CrossRef] [PubMed] [Green Version]
  42. Chaves, N.; Santiago, A.; Alías, J.C. Quantification of the antioxidant activity of plant extracts: Analysis of sensitivity and hierarchization based on the method used. Antioxidants 2020, 9, 76. [Google Scholar] [CrossRef] [Green Version]
  43. Wu, Q.; Shah, N.P. High γ-aminobutyric acid production from lactic acid bacteria: Emphasis on Lactobacillus brevis as a functional dairy starter. Crit. Rev. Food Sci. Nutr. 2017, 57, 3661–3672. [Google Scholar] [CrossRef] [PubMed] [Green Version]
  44. Juneja, V.K.; Bari, M.L.; Inatsu, Y.; Kawamoto, S.; Friedman, M. Control of Clostridium perfringens spores by green tea leaf extracts during cooling of cooked ground beef, chicken, and pork. J. Food Prot. 2007, 70, 1429–1433. [Google Scholar] [CrossRef]
  45. García-Ruiz, A.; Bartolomé, B.; Martínez-Rodríguez, A.J.; Pueyo, E.; Martín-Álvarez, P.J.; Moreno-Arribas, M.V. Potential of phenolic compounds for controlling lactic acid bacteria growth in wine. Food Control 2008, 19, 835–841. [Google Scholar] [CrossRef]
  46. Tabasco, R.; Sánchez-Patán, F.; Monagas, M.; Bartolomé, B.; Moreno-Arribas, M.V.; Peláez, C.; Requena, T. Effect of grape polyphenols on lactic acid bacteria and bifidobacteria growth: Resistance and metabolism. Food Microbiol. 2011, 28, 1345–1352. [Google Scholar] [CrossRef] [PubMed]
  47. Sirk, T.W.; Brown, E.F.; Sum, A.K.; Friedman, M. Molecular dynamics study on the biophysical interactions of seven green tea catechins with lipid bilayers of cell membranes. J. Agric. Food Chem. 2008, 56, 7750–7758. [Google Scholar] [CrossRef] [PubMed]
  48. Kook, M.C.; Cho, S.C. Production of GABA (gamma amino butyric acid) by lactic acid bacteria. Korean J. Food Sci. Anim. Resour. 2013, 33, 377–389. [Google Scholar] [CrossRef]
  49. Hsueh, Y.-H.; Yang, J.-H.; Ou, S.-F.; Chen, S.-T.; Kuo, J.-M.; Wu, C.-H. Mass production of γ-Aminobutyric acid by semi-continuous fermentation using ceramic support by Lactobacillus brevis RK03. LWT-Food Sci. Technol. 2021, 140, 110640. [Google Scholar] [CrossRef]
  50. Saeki, A.; Taniguchi, M.; Matsushita, K.; Toyama, H.; Theeragool, G.; Lotong, N.; Adachi, O. Microbiological aspects of acetate oxidation by acetic acid bacteria, unfavorable phenomena in vinegar fermentation. Biosci. Biotechnol. Biochem. 1997, 61, 317–323. [Google Scholar] [CrossRef]
  51. Kang, M.; Jung, H.; Seo, H.Y. Effect of addition of ethanol on the quality of kimchi paste. Korean J. Food Cook Sci. 2015, 31, 725–732. [Google Scholar] [CrossRef] [Green Version]
  52. Capucho, I.; San Romao, M.V. Effect of ethanol and fatty acids on malolactic activity of Leuconostoc oenos. Appl. Microbiol. Biotechnol. 1994, 42, 391–395. [Google Scholar] [CrossRef]
  53. Hassan, S.S.; bt Abd Malek, R.; Atim, A.; Jikan, S.S.; Mohd Fuzi, S.F.Z. Effects of different carbon sources for high level lactic acid production by Lactobacillus casei. Appl. Mech. Mater. 2015, 695, 220–223. [Google Scholar] [CrossRef]
  54. Ahn, Y.-T.; Kim, Y.-H.; Bae, J.-S.; Lim, K.-S.; Huh, C.-S.; Yang, W.-Y.; Kim, H.-S.; Baek, Y.J. Effect of Lactobacillus brevis HY7401 intake on the serum ethanol concentration in rats. Korean J. Food Sci. Technol. 2004, 36, 604–608. [Google Scholar]
  55. Niefind, K.; Müller, J.; Riebel, B.; Hummel, W.; Schomburg, D. The crystal structure of R-specific alcohol dehydrogenase from Lactobacillus brevis suggests the structural basis of its metal dependency. J. Mol. Biol. 2003, 327, 317–328. [Google Scholar] [CrossRef]
  56. Komatsuzaki, N.; Shima, J.; Kawamoto, S.; Momose, H.; Kimura, T. Production of γ-aminobutyric acid (GABA) by Lactobacillus paracasei isolated from traditional fermented foods. Food Microbiol. 2005, 22, 497–504. [Google Scholar] [CrossRef]
  57. Lu, X.; Xie, C.; Gu, Z. Optimisation of fermentative parameters for GABA enrichment by Lactococcus lactis. Czech. J. Food Sci. 2009, 27, 433–442. [Google Scholar] [CrossRef] [Green Version]
  58. Villegas, J.M.; Brown, L.; de Giori, G.S.; Hebert, E.M. Optimization of batch culture conditions for GABA production by Lactobacillus brevis CRL 1942, isolated from quinoa sourdough. LWT-Food Sci. Technol. 2016, 67, 22–26. [Google Scholar] [CrossRef]
  59. Kawamura, Y.; Kare, M.R. Umami: A basic taste. Physiology, biochemistry, nutrition, food science. J. Nutr. 1987, 117, 1644. [Google Scholar]
  60. Sun, B.S.; Zhou, L.P.; Jia, X.Q.; Sung, C.K. Response surface modeling for g-aminobutyric acid production by Monascus pilosus GM100 under solid-state fermentation. Afr. J. Biotechnol. 2008, 7, 4544–4550. [Google Scholar]
  61. Wang, J.J.; Lee, C.L.; Pan, T.M. Improvement of monacolin K, c-aminobutyric acid and citrinin production ratio as a function of environmental conditions of Monascus purpureus NTU 601. J. Ind. Microbiol. Biotechnol. 2003, 30, 669–676. [Google Scholar] [CrossRef]
  62. Okada, T.; Sugishita, T.; Murakami, T.; Murai, H.; Saikusa, T.; Horino, T.; Onoda, A.; Kajimoto, O.; Takahashi, T. Effect of the defatted rice germ enriched with GABA for sleeplessness, depression, autonomic disorder by oral administration. J. Jpn. Soc. Food Sci. Technol.-Nippon Shokuhin Kagaku Kogaku Kaishi 2000, 47, 596–603. [Google Scholar] [CrossRef] [Green Version]
  63. Pouliot-Mathieu, K.; Gardner-Fortier, C.; Lemieux, S.; St-Gelais, D.; Champagne, C.P.; Vuillemard, J.C. Effect of cheese containing gamma-aminobutyric acid-producing lactic acid bacteria on blood pressure in men. Pharma Nutr. 2013, 1, 141–148. [Google Scholar] [CrossRef]
  64. Huang, C.Y.; Kuo, W.W.; Wang, H.F.; Lin, C.J.; Lin, Y.M.; Chen, J.L.; Kuo, C.H.; Chen, P.K.; Lin, J.Y. GABA tea ameliorates cerebral cortex apoptosis and autophagy in streptozotocin-induced diabetic rats. J. Funct. Food. 2014, 6, 534–544. [Google Scholar] [CrossRef]
  65. Han, D.O.; Kim, H.Y.; Lee, H.J.; Shim, I.S.; Hahm, D.H. Wound healing activity of gamma-aminobutyric acid (GABA) in rats. J. Microbiol. Biotechnol. 2007, 17, 1661–1669. [Google Scholar] [PubMed]
  66. Wang, L.C.; Pan, T.M.; Tsai, T.Y. Lactic acid bacteria-fermented product of green tea and Houttuynia cordata leaves exerts anti-adipogenic and anti-obesity effects. J. Food Drug Anal. 2018, 26, 973–984. [Google Scholar] [CrossRef]
  67. Tu, Y.Y.; Xia, H.L.; Watanabe, N. Changes in catechins during the fermentation of green tea. Appl. Biochem. Microbiol. 2005, 41, 574–577. [Google Scholar] [CrossRef]
  68. Quílez, J.; Diana, M. Gamma-aminobutyric acid-enriched fermented foods. In Fermented Foods in Health and Disease Prevention, 1st ed.; Frias, J., Martinez-Villaluenga, C., Peñas, E., Eds.; Academic Press: Cambridge, MA, USA, 2017; pp. 85–103. [Google Scholar]
  69. Fukushima, Y.; Ohie, T.; Yonekawa, Y.; Yonemoto, K.; Aizawa, H.; Mori, Y.; Watanabe, M.; Takeuchi, M.; Hasegawa, M.; Taguchi, C.; et al. Coffee and green tea as a large source of antioxidant polyphenols in the Japanese population. J. Agric. Food Chem. 2009, 57, 1253–1259. [Google Scholar] [CrossRef]
  70. Wang, L.F.; Kim, D.M.; Lee, C.Y. Effects of heat processing and storage on flavanols and sensory qualities of green tea beverage. J. Agric. Food Chem. 2000, 48, 4227–4232. [Google Scholar] [CrossRef]
  71. Öztürk, C.; Aksoy, M.; Küfrevioğlu, Ö.İ. Purification of tea leaf (Camellia sinensis) polyphenol oxidase by using affinity chromatography and investigation of its kinetic properties. J. Food Meas. Charact. 2020, 14, 31–38. [Google Scholar] [CrossRef]
  72. Teng, J.; Gong, Z.; Deng, Y.; Chen, L.; Li, Q.; Shao, Y.; Lin, L.; Xiao, W. Purification, characterization and enzymatic synthesis of theaflavins of polyphenol oxidase isozymes from tea leaf (Camellia sinensis). LWT-Food Sci. Technol. 2017, 84, 263–270. [Google Scholar] [CrossRef]
  73. Saa, D.T.; Di Silvestro, R.; Dinelli, G.; Gianotti, A. Effect of sourdough fermentation and baking process severity on dietary fibre and phenolic compounds of immature wheat flour bread. LWT-Food Sci. Technol. 2017, 83, 26–32. [Google Scholar] [CrossRef]
  74. Skrajda-Brdak, M.; Konopka, I.; Tańska, M.; Czaplicki, S. Changes in the content of free phenolic acids and antioxidative capacity of wholemeal bread in relation to cereal species and fermentation type. Eur. Food Res. Technol. 2019, 245, 2247–2256. [Google Scholar] [CrossRef] [Green Version]
  75. Roy, M.K.; Koide, M.; Rao, T.P.; Okubo, T.; Ogasawara, Y.; Juneja, L.R. ORAC and DPPH assay comparison to assess antioxidant capacity of tea infusions: Relationship between total polyphenol and individual catechin content. Int. J. Food Sci. Nutr. 2010, 61, 109–124. [Google Scholar] [CrossRef] [PubMed]
  76. Liu, C.; Zhao, L.; Yu, G. The dominant glutamic acid metabolic flux to produce γ-amino butyric acid over proline in Nicotiana tabacum leaves under water stress relates to its significant role in antioxidant activity. J. Integr. Plant Biol. 2011, 53, 608–618. [Google Scholar] [CrossRef]
  77. Scalzo, R.L. Organic acids influence on DPPH scavenging by ascorbic acid. Food Chem. 2008, 107, 40–43. [Google Scholar] [CrossRef]
Figure 1. Conceptual scheme of LFG fermentation with a GABA-producing Lactobacillus strain under optimised fermentation conditions.
Fermentation 07 00110 g001
Figure 2. Typical HPLC chromatograms of GABA in (a) standard solution, (b) bacterial culture, and (c) LFG.
Fermentation 07 00110 g002
Figure 3. Changes in (a) pH, (b) lactic acid bacterial counts, (c) lactic acid content, and (d) acetic acid content of LFG during each step of the optimisation process to enhance the microbial metabolic activity. ●: control (fermentation without supplementation), △: optimisation step 1 (fermentation with supplementation of 1% fermentation alcohol), ■: optimisation step 2 (fermentation with supplementation of 1% fermentation alcohol and 6% glucose), ◇: optimisation step 3 (fermentation at 35 °C, ineffective). Fermentation alcohol supplementation was based on a previous article, and the concentration was optimised. Glucose was selected based on the effects of several carbohydrates at the same concentration, and the glucose concentration was subsequently optimised. Fermentation at 35 °C was selected through fermentation tests at several fermentation temperatures, but fermentation at 37 °C tested in the previous stage was more effective. So, the results obtained at 35 °C was plotted with dotted line. Error bars indicate standard deviations determined from triplicate experiments.
Fermentation 07 00110 g003
Figure 4. Changes in GABA content of LFG before and after fermentation optimisation. ■: control (fermentation under non-optimal conditions), □: optimised (fermentation with supplementation of 1% MSG along with optimal conditions in Figure 3). MSG was supplemented to enhance GABA production based on previous articles [56,57,58,59]. Values of bars in the same color with different letters (A–E) are significantly different (p < 0.05). * Asterisk represents a statistically insignificant difference between the values of the two bars in the same fermentation period (p > 0.05), while pairs of bars without an asterisk indicate a significant difference (p < 0.05). Error bars indicate standard deviations determined from triplicate experiments.
Fermentation 07 00110 g004
Figure 5. Changes in (a) pH, (b) GABA content, (c) total polyphenol content, and (d) DPPH radical scavenging activity of LFG under optimal fermentation conditions. ●: NN group (non-inoculated green tea with no supplementation), ○: NS group (non-inoculated green tea with supplementation), ■: IN group (green tea fermented with L. brevis 79 strain with no supplementation), □: IS group (green tea fermented with L. brevis 79 strain with supplementation; optimal fermentation conditions). The results obtained from non-inoculated green tea were plotted with a dotted line. Supplementation consisted of 1% fermentation alcohol, 6% glucose, and 1% MSG. Error bars indicate standard deviations determined from triplicate experiments.
Fermentation 07 00110 g005
Table 1. Selection of Lactobacillus strain for lactic acid fermentation of green tea based on acid production, growth, catechin resistance, and GABA production capability.
Bacterial StrainspH 1Growth Potential (OD600) 1Catechin Resistance 2GABA Production (µg/mL) 4
Specific Growth Rate (h−1)Relative Lag Time 3
Lactobacillus Strains Isolated From Green Tea Leaves
L. brevis GTL 794.49 ± 0.00 52.19 ± 0.000.07 ± 0.001.00 ± 0.00324.07 ± 62.04
 Other candidate strains5.29 ± 1.041.17 ± 1.110.15 ± 0.011.33 ± 0.231.43 ± 0.67
 (n = 24 6)(3.69–5.01) 7(1.46–2.44)(0.11–0.16)(1.00–1.80)(0.90–2.05)
Reference Strains Known as GABA-Producing LAB Species
L. plantarum KCTC 31084.51 ± 0.032.06 ± 0.050.02 ± 0.0018.01 ± 0.0013.39 ± 1.56
L. brevis KCTC 34984.48 ± 0.062.05 ± 0.010.06 ± 0.0012.31 ± 0.0017.08 ± 5.57
1 pH and optical density (600 nm) of MRS broth culture of each strain were measured as parameters of acid production and growth, respectively. 2 Catechin resistance was expressed as a specific growth rate and a relative lag time calculated based on the absorbance measured from the MRS broth culture of each strain containing 10% green tea. 3 Ratio of each lag time and shortest lag time (1.00). 4 GABA content in MRS broth culture of each strain containing 1% MSG was measured as a parameter of GABA production capability. 5 Mean ± standard deviation obtained from a single strain. 6 The number of the strains screened based on either acid production or growth among 113 Gram-positive rod-shaped strains. 7 Mean ± standard deviation (the range from minimum to maximum) obtained from multiple strains.
Publisher’s Note: MDPI stays neutral with regard to jurisdictional claims in published maps and institutional affiliations.

