Article

Determination of Foam Stability in Lager Beers Using Digital Image Analysis of Images Obtained Using RGB and 3D Cameras

by
Emmanuel Karlo Nyarko
1,
Hrvoje Glavaš
1,*,
Kristina Habschied
2,* and
Krešimir Mastanjević
2
1
Faculty of Electrical Engineering, Computer Science and Information Technology Osijek, Josip Juraj Strossmayer University of Osijek, Kneza Trpimira 2B, 31000 Osijek, Croatia
2
Faculty of Food Technology, Josip Juraj Strossmayer University of Osijek, 31000 Osijek, Croatia
*
Authors to whom correspondence should be addressed.
Fermentation 2021, 7(2), 46; https://doi.org/10.3390/fermentation7020046
Submission received: 21 February 2021 / Revised: 21 March 2021 / Accepted: 24 March 2021 / Published: 26 March 2021
(This article belongs to the Special Issue Implementation of Digital Technologies on Beverage Fermentation)

Abstract

:
Foam stability and retention is an important indicator of beer quality and freshness. A full, white head of foam with nicely distributed small bubbles of CO2 is appealing to the consumers and the crown of the production process. However, raw materials, production process, packaging, transportation, and storage have a big impact on foam stability, which marks foam stability monitoring during all these stages, from production to consumer, as very important. Beer foam stability is expressed as a change of foam height over a certain period. This research aimed to monitor the foam stability of lager beers using image analysis methods on two different types of recordings: RGB and depth videos. Sixteen different commercially available lager beers were subjected to analysis. The automated image analysis method based only on the analysis of RGB video images proved to be inapplicable in real conditions due to problems such as reflection of light through glass, autofocus, and beer lacing/clinging, which make it impossible to accurately detect the actual height of the foam. A solution to this problem, representing a unique contribution, was found by introducing the use of a 3D camera in estimating foam stability. According to the results, automated analysis of depth images obtained from a 3D camera proved to be a suitable, objective, repeatable, reliable, and sufficiently sensitive method for measuring foam stability of lager beers. The applied model proved to be suitable for predicting changes in foam retention of lager beers.

1. Introduction

Ancient beer displayed weak or no foam. Uncontrolled fermentation, no addition of hops, and subsequent low carbonation resulted in a foam-less beverage. Research conducted by [1] on ancient Finnish beer Sahti showed that the investigated ancient beverage had no foam and showed a distinctive difference between today’s beers, especially regarding flavor and aroma. Today’s brewing industries are far from the ancient manufacturers, and stable and retentive foam head is one of the main indicators of beer freshness and quality. Even though a big and rich head of foam is a property of certain types of beer (lager, pilsner, and wheat beer among others), every consumer seeks freshness in a preferable label. Some people do not appreciate foam in their glass, regardless of the beer style, some love the lacy pattern at the bottom of the finished beer, but the majority of beer-lovers like the crystal-clear glass after finishing the last sip [2]. Cling can be described as the adhesion of beer foam to the side of the glass during beer consumption, commonly known as “lacing”. For example, Belgium is known for beers that leave a lacy glass. According to BJCP Beer Style Guidelines [3], “Belgian Lace is a characteristic and persistent latticework pattern of foam left on the inside of the glass as a beer is consumed. The look is reminiscent of fine lacework from Brussels or Belgium, and is a desirable indicator of beer quality in Belgium.” According to Bamforth [2], foam quality is described by many properties such as stability, retention, viscosity, whiteness, bubble size, and density. As described by Gonzalez Viejo et al. [4], the most presentable indicators of foam behavior are foamability (capacity of foam formation) and foam stability. Many factors affect foam stability and the physics behind the foam is extensive, but in short, foams are colloids comprising gas bubbles dispersed in liquid [2]. A detailed description of the physics of foam formation and stability is well described by Bamforth [2] and Hackbarth [5]. Many other authors also did an excellent job in reporting and describing the physics of foam [6,7,8,9]. A more recent contribution was provided by Gonzalez Viejo et al. [4] in an extensive review. According to [5], a decrease in surface tension reduces foam stability. This can be influenced by high fermentation temperatures resulting in fusel oils accumulation, yeast autolysis (re-leases lipids and protease A), an unpasteurized beer that allows protease A, or unclean or improperly rinsed serving glasses. Agents that aid foam stability are high molecular weight (MW > 5000) malt proteins (Z4, LTP1, lipid binding indolines, and hordeins). The choice of raw material, malting process conditions, kilning temperatures, mashing-in temperatures, excessive boiling, and excessive use of chillproofing filter-aids can influence the foam stability. A reaction between malt proteins and isomerized hop alpha acids also helps in foam stability.
Due to its importance for the brewing industry, many scholars and professionals came up with several methods for the determination and measurement of foam stability and quality [10,11,12,13,14,15,16,17,18,19,20,21]. Many of these properties, such as determination of foam stability or head retention, lacing, bubble size, whiteness, foam density, foam viscosity, foam strength, etc., are well described in a review paper by Bamfort [2]. However, modern methodologies and approaches tend to be less or even non-invasive and are therefore suitable for application in foam measurements [22,23,24,25]. Among the most popular methods are currently image analysis methods. These methods, however, have some drawbacks, especially in scenarios with automated procedures. The first problem is the reflection of light on the surface and within the beer glass, as reported by Lukinac et al. [26]. Another problem that may arise is focusing; the measuring set-up must be made under controlled directional light conditions that entail lower illuminance values and automated focusing. The third and biggest problem is foam lacing or clinging, which makes it impossible to detect the actual level of foam.
Electrode-involving method is excellent for measuring foam height (its decrease over time, and therefore its stability), but it demands regular cleaning and maintenance and is more time-consuming. The use of a camera in foam assessment demands no cleaning and is a low-maintenance, cheap, and easy method that requires minimal input from the employees, applicable in every laboratory. The implementation of a simple, easy, affordable, and non-invasive method that could solve or, at least, derail all of the above-mentioned problems would greatly help the brewing industry in an objective assessment of beer foam stability.
The aim of this paper was to analyze the applicability of an automated non-invasive, objective, and cheap image analysis method under real conditions, to follow up and measure the foam stability of lager beers produced and available on the Croatian market.

2. Materials and Methods

Sixteen samples of commercially available light lager beers packaged in brown or green glass bottles (0.5 L) were set to be analyzed using the methods described below. Ten were domestic beers and six others were foreign (Germany, Czech Republic, Denmark, and Holland). Beer samples were held at room temperature (20 °C) for two days, in order to reduce the influence of temperature fluctuations. Glasses (0.5 L; generic brand, model Lilith, h = 185 mm, Ø = 0.75 mm) were bought, washed, and degreased then rinsed in demineralized water and left to dry two days prior to the analysis. All glasses were identical and held at room temperature for two days prior to analysis. Beer was hand-poured into a degreased glass, according to the standard MEBAK (Middle European Brewing Analysis Commission) procedure (method 2.23.1) [27], at an angle of 135°. The pourer took extra care to pour every sample evenly and uniformly into the glass (Figure 1). When the pouring was done, the sample was placed on a designated spot, and cameras were set to measure the foam stability. According to MEBAK, foam in lager beers should be stable for 3–5 min.
Two vision-based approaches to measuring foam stability were implemented: image analysis of RGB video and depth measurement using a 3D camera. Over a period of 5 min, a visual RGB camera (Canon PowerShot G16; Ota City, Tokyo, Japan) was used to take a video recording of the beer. Simultaneously, a 3D camera (Orbbec Astra S; Orbbec 3D Technology International, Inc., Troy, MI, USA) was also used to take depth measurements. Figure 1 shows the experimental setup used in data collection.

2.1. Image Analysis of Video

A visual RGB camera (Canon G16) was used to take a video recording of each sample over a period of 5 min. The recorded video had a frame rate of 30 fps. Image analysis was performed on the recorded video. The image analysis procedure to determine the height of beer foam is explained in the following seven steps below:
Step 1: For a given frame of the recorded video, define a region of interest (ROI) of known width (w) and height (l) in the image that contains beer and foam, as shown in Figure 2a. It is important that the ROI covers the whole height of the foam and part of the beer. All the following image processing steps are performed on this ROI. This ensures that all the image processing steps are directed or focused on segmenting the foam head from the rest of the image within the ROI.
Step 2: Perform color segmentation by filtering (thresholding) the ROI in HSV color space by defining the lower and upper values of the color of the foam (Figure 2b). HSV color space separates color information (chroma) from intensity (luma). Since the value is separated, thresholding can theoretically be performed using only saturation and hue. More robust color thresholding over simpler parameters can be performed in HSV color space than in RGB color space. For the purposes of the results presented in this paper, the lower HSV boundary of (0,0,230)was used, while the upper boundary was defined as (43,18,255).
Step 3: Generate a binary image of the thresholded ROI in HSV color space (Figure 2c and Figure 3a), i.e., all pixels that have values within the defined boundaries are marked as white pixels (values are set to 255), while the remaining pixels are marked as black (values are set to 0).
Step 4: Perform morphological operations of erosion followed by dilation on the binary image (Figure 2d and Figure 3b). These operations are needed in order to eliminate small white noises or white artifacts that appear in the binary image.
Step 5: Determine the largest contour from the list of all contours on the binary image (Figure 2e). A contour is a curve joining all the continuous points or connected components (along the boundary) having the same color or intensity. This step basically segments or marks the boundary of the foam/head.
Step 6: Determine the area (A) of the region defined by the largest contour.
Step 7: The average height (h) of the beer foam in pixels can be determined using Equation (1):
h = A/w.
Using the notation where ht represents the height of foam (in pixels) at a given point in time t (in seconds), the maximum height, hmax, is defined as:
hmax = max {ht: t = 0, 1, …,300},
and the minimum height, hmin, is defined as
hmin = min {ht: t = 0, 1, …,300}.
Based on these definitions, we define the normalized foam height at time t, ht_norm, as:
ht_norm = (hthmin)/(hmaxhmin).
Since the beer glass is always located in the same position, the seven steps provided above can be implemented as a program to automate the procedure. One advantage of this procedure is that it can be run in both offline and online mode. For the purposes of this paper, a script written in the Python programming language [28] using the OpenCV library [29] was implemented in order to automate the process of determining the beer foam height from the recorded videos. Every 10 s, five consecutive frames were taken and the height of foam determined for each frame. The average height in pixels for these five measurements was taken to represent the height of foam every 10 s.

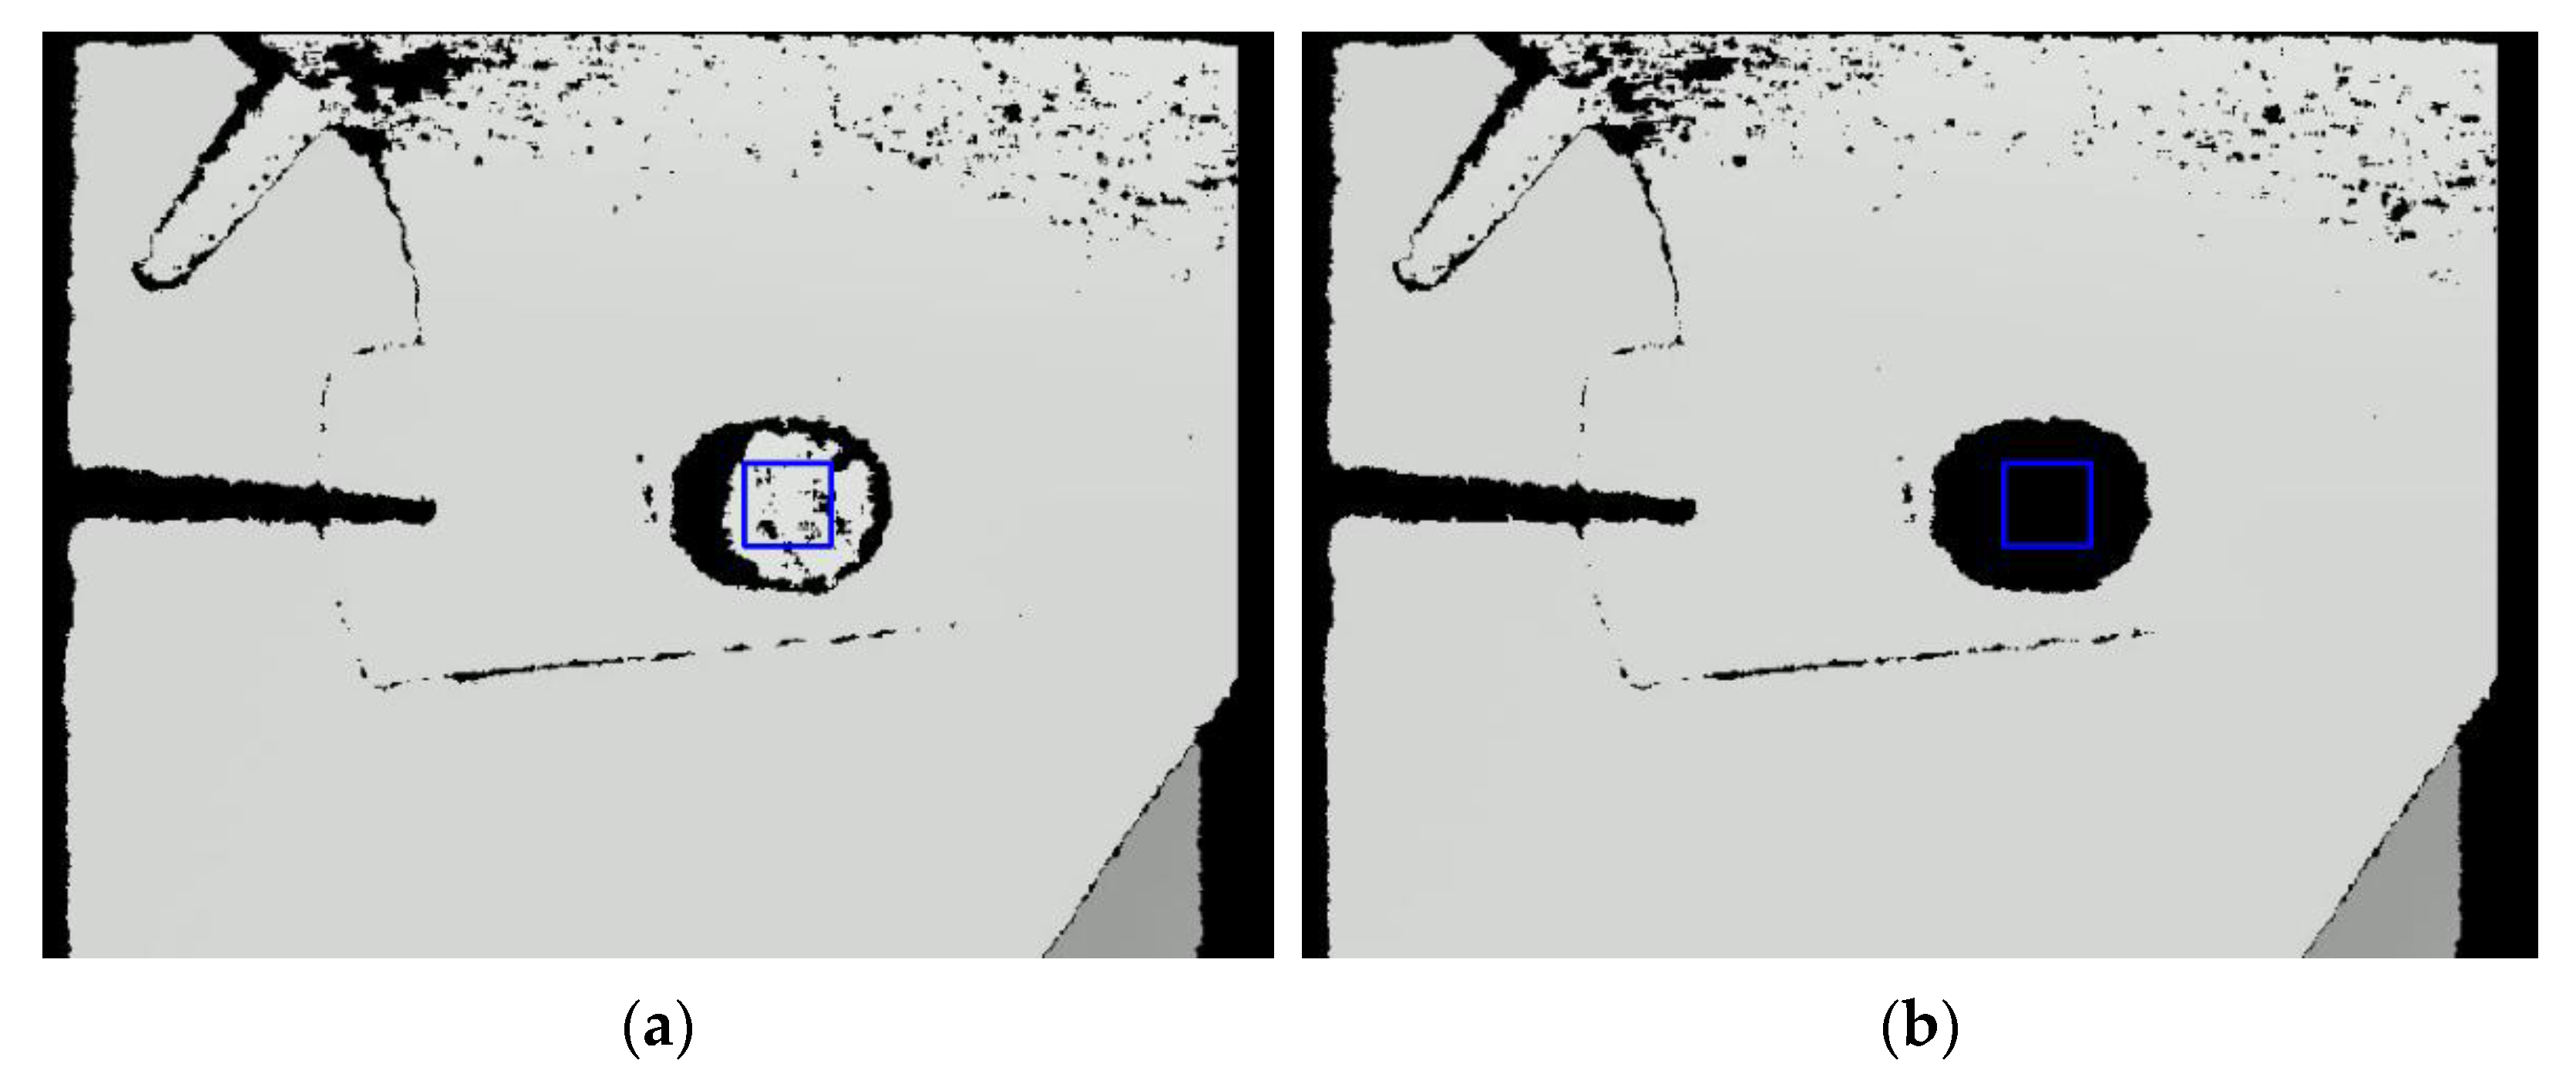
2.2. Depth Measurement Using a 3D Camera

A 3D camera provides a depth map or a depth image where each pixel in the image relates to the distance between the surface of the object being viewed and the camera or image plane. The Orbbec Astra S 3D camera used in this paper is based on the Structured-Light technology. The 3D camera consists of an infrared laser projector and a proprietary Infra-Red (IR) depth sensor. The depth sensor interprets 3D scene information based on continuously projected infrared structured light. It should also be mentioned that Orbbec Astra S 3D camera also consists of an RGB camera. However, this RGB camera was not used in the experiments for the purpose of this paper. An example of a depth image generated by the 3D camera is shown in Figure 4.
Orbbec Astra S depth sensor has a camera resolution of 640 × 480 and a maximum frame rate of 30 Hz. Its measurement range is from 0.4 to 2 m and has a field of view of 60° horizontally and 49.5° vertically. It also has an accuracy of +/−1–3 mm at 1 m.
One drawback of the sensor is that it cannot detect glass nor liquids, so for example, in Figure 4, it can be seen that the edge of the beer glass cannot be detected (pixels displayed in black), and when the foam disappears no depth information can be obtained.
As displayed in Figure 1, the 3D camera was placed above the beer glass. Hence, all measurements obtained from the 3D camera actually provided the distance of the top of the foam head from the 3D camera. Thus, measurements of the distance of the foam for a given sample increased with time, as the foam in the glass decreased.
Similar to the measurements performed when using the video camera in the previous section, since the beer glass was always located in the same position, a fixed ROI was defined (Figure 4a), and a Python script was used in order to automate the process of determining the distance of the beer foam height from the camera. Every 10 s, five consecutive frames were taken, and the average distance of foam from the camera was determined for each frame. This average distance was determined using only the pixels within the defined ROI having a depth value. Pixels without depth values were excluded. The mean distance of these average distances for the five measurements was taken to represent the distance of foam from the camera every 10 s.
If dt represents the distance of foam (in mm) from the camera at a given point in time (t = 0, 1, …,300 s), and dtable represents the distance of the table (in mm) from the camera (dtable = 654 mm. Figure 1.), the height of the foam from the top of the table at time t, difft, is given by
difft = dtabledt.
The maximum height of the foam from the top of the table, diffmax, is defined as:
diffmax = max {difft: t = 0, 1, …,300},
and the minimum height, diffmin, is defined as
diffmin = min {difft: t = 0, 1, …,300}.
Based on these definitions, the normalized foam height at time t, ht_norm, is given by:
ht_norm = (difftdiffmin)/(diffmaxdiffmin).
It is important to emphasize that the images displayed in Figure 4 represent depth images. Areas in the images having shades of gray have depth information, while those marked in black do not. The edge of the beer glass cannot be detected in Figure 4a due to the fact that (a) the sensor cannot detect glass, since the transmitted light is not reflected, and (b) the non-defined area near the beer glass is also extended as a result of parallax, since the emitter and the sensor on the 3D camera are separated by about 7.5 cm. In Figure 4b, after the foam disappears, the transmitted beam of the 3D sensor cannot be reflected by the beer surface, and therefore it is impossible to detect the depth of the beer surface. This criterion was used for ending measurements in situations when the foam disappeared before 5 min.

3. Results and Discussion

RGB and depth video recordings were obtained for 16 samples (denoted by s01…s16), each lasting 5 min. Using the procedures described in Section 2.1 and Section 2.2, the estimated height (in pixels) and distance of foam from the camera (in mm) were obtained from the RGB video and depth video, respectively, every 10 s. The results of the measurements are displayed in Table 1 and Table 2. Figure 5 and Figure 6 display the corresponding normalized foam heights (%) obtained by performing image analysis on RGB images and from depth images, respectively. The actual normalized values obtained are provided in Table A1 and Table A2.
The processed results of the measurements obtained using the visual RGB camera are displayed in Table 1. Even though the results are displayed in pixels, the corresponding height of beer foam can be obtained by using the conversion of 1 mm = 6.6 px. The sign “-” in the table indicates that measurements were stopped since there was no foam.
A graphical representation of the normalized measurement results obtained by performing image analysis on RGB videos can be seen in Figure 5 (actual data is provided in Table A1). The behavior of the s02 sample is due to the increase in foam levels during the measurement as a result of erratic CO2 bubbles that formed unstable foam, as can be seen in Figure 6. According to Bamforth [2], low surface tension is an important factor for foam formation. Constant surface tension withholds a pressure within a bubble that is inversely proportional to its diameter, so the gas makes an effort to pass from a smaller to larger bubble (disproportionation), so the more gas there is in foam, the greater the disproportionation, which was the case for most samples, but sample s02 was particularly erratic. If the gas fraction in liquid (beer) foams is high, the bubbles cannot form exclusively spheres, but they take forms of polyhedra separated by thin layers of the liquid phase called lamellae. Another important phenomenon is that hydrophobic particles adsorbed at the gas–liquid interface tend to compress together as bubbles contract to form barriers that prevent the continuation of disproportionation. At constant pressure, the size of bubbles is directly proportional to the surface tension. Thus, materials with lower surface tension also give smaller bubbles [2]. Coalescence or merging of two bubbles occurs upon rupture of the membrane that divides them. This leads to coarsening of foam with visible larger bubbles–fish eyes in the foam body [4]. The Young–Laplace equation describes the disproportionation as the differential pressures between the inside and outside of a bubble due to surface tension. This pressure is inversely proportional to the bubble radius, causing CO2 gas to diffuse from smaller bubbles where pressure is higher into larger bubbles. According to Hackbath [4], “as the foam structure coarsens and larger bubbles continue to expand, their membranes thin until they reach a critical thickness. Film ruptures can be spontaneous or can be caused by fats that interfere with the film’s external surface. Collapse occurs at the crown surface by rupture or by diffusion of dipolar CO2 directly to the atmosphere through the CO2 permeable bubble film”. Comprehension of all stated data could explain the behavior of foam in sample s02. It can be presumed that this is due to the storage in unsuitable conditions in the supermarket storage space. All samples were purchased in January, when it was cold in the storage rooms of the market place, and all analyses were done in January. The temperature fluctuations in the storage room, where it is cooler, then sudden transfer to higher temperatures at the market place could cause this kind of foaming properties loss in most of the samples. As for the sample s02, it could be some type of production error in this particular batch. Apart from sample s02, samples s16 and s07 seemed to show a more stable foam in comparison to all the other samples. It appears that this foam showed significantly more stable properties, even though all samples were kept at the same temperature. This hypothesis has yet to be confirmed by detailed laboratory testing, although preliminary analysis of new samples obtained in March (which show normal behavior) lead us to this conclusion.
Depth measurements were also being taken simultaneously using a 3D camera. The distance of the beer foam surface (in mm) from the top of the table measured over time, difft, for the 16 beer samples is displayed in Table 2. The sign “-” indicates that measurements were not possible since there was no foam head.
A graphical representation of the normalized distance of beer foam (%) from 3D camera can be seen in Figure 7 (actual data is provided in Table A2). Comparing Figure 5 and Figure 6, similar conclusions about the foam stability can be made.
One major drawback of the non-invasive automated image analysis of RGB images is that it is sensitive to foam lacing or clinging. For example, s06 has a foam height of 26 px (or about 4 mm) after 40 s (see Table 1). Figure 8 shows the RGB video frame after 40 s. On the other hand, depth measurements of the foam surface by the 3D camera were not possible after 30 s, since there was no foam on the liquid surface (scenario similar to Figure 4b). This feedback (lack of depth information) from the 3D sensor was then used to stop further measurement. It should also be noted that the measurements after 10 s (see Table 2) for samples s01 and s13 should basically be ignored, since this were unreliable measurements provided by the 3D sensor in situations where there was basically no foam.

4. Conclusions

Beer foam stability is an important beer quality indicator. Stable beer foam after production does not have to correlate with beer foam after a certain period of storage and transport. In this research, we presented an algorithm for an automated non-invasive procedure for measuring foam height by applying image analysis of RGB images or videos. The procedure showed off as relatively robust and applicable in online and offline mode. One major drawback of this method appeared to be its sensitivity to foam lacing or cling due to poor CO2 distribution or low foam active/stabilizing compounds concentrations (proteins or hop compounds) in beer where the camera, placed laterally in regards to the sample, could not distinguish the lacing from foam height. However, this problem was resolved by using a 3D camera, which generates depth videos or images. A 3D camera mounted directly above the glass containing the beer sample was able to measure the distance of the foam surface from the camera. By measuring the change in the distance of the foam surface from the 3D camera over time, information about the foam stability was obtained. Due to the technology used in measuring the distance of objects from the 3D camera, the camera was able to detect and recognize the foam surface, but was not able to detect the liquid surface, and therefore the distance of the liquid surface from the camera could not be measured. This usual drawback of this camera is actually an advantage in this scenario, since it provides information about the disappearance of the beer foam. Information about the lack of foam is triggered by the lack of depth information within the ROI. In any case, this could be a novel, quick, robust, precise, and accurate method for foam stability measurement.

Author Contributions

Conceptualization: K.H. and E.K.N.; methodology: E.K.N. and H.G.; software: E.K.N.; formal analysis: H.G.; investigation: K.M.; writing—original draft preparation: K.H.; writing—review and editing: E.K.N. and K.M. All authors have read and agreed to the published version of the manuscript.

Funding

This research received no external funding.

Institutional Review Board Statement

Not applicable.

Informed Consent Statement

Not applicable.

Data Availability Statement

The data presented in this study are available on request from the corresponding author.

Conflicts of Interest

The authors declare no conflict of interest.

Appendix A

Table A1. Normalized foam height (%) determined by performing image analysis on RGB videos of 16 beer samples.
Time (s)s01s02s03s04s05s06s07s08s09s10s11s12s13s14s15s16
0043100100100100100100100100100100100100100100
10-21333452436856827461220778488
20-111011221152306145260-566186
30-3200604010502912--425573
40-36--0133039151--342963
50-46---028130120--281855
60-61----230389---221148
70-50----18-296---18040
80-54----14-94---16-34
90-82----10-32---12-29
100-79----8-00---9-23
110-79----7-0----7-19
120-89----6-3----0-14
130-89----5-3------11
140-75----4-0------11
150-100----4--------8
160-86----3--------6
170-79----3--------4
180-68----2--------8
190-61----2--------6
200-57----2--------5
210-61----2--------4
220-57----2--------4
230-50----1--------3
240-32----2--------3
250-11----0--------2
260-25----1--------2
270-11----0--------1
280-4-------------0
290-4-------------0
300-0-------------0
“-” indicates that no measurements were made since there was no foam head. All values have been rounded up.
Table A2. Normalized distance of beer foam (%) from 3D camera for 16 beer samples.
Time (s)s01s02s03s04s05s06s07s08s09s10s11s12s13s14s15s16
010067100100100100100100100100100100100100100100
10033898485688881889794430858095
20-33021422076527465630-625082
30-33-01206526624131--463074
40-67--4-5611501913--312063
50-67--0-47438116--151055
60-67----4142680--8047
70-67----320185---8042
80-67----26-63---0-34
90-67----21-30---0-29
100-67----15-00---0-24
110-67----9-0----0-18
120-67----6-0----0-16
130-100----6--------11
140-67----3--------8
150-67----3--------5
160-67----0--------3
170-67----0--------3
180-67----0--------3
190-67----0--------0
200-67----0--------0
210-67----0--------0
220-67----0--------0
230-67----0--------0
240-33----0--------0
250-33----0--------0
260-33----0--------0
270-33-------------0
280-0-------------0
290-0-------------0
300-0-------------0
“-” indicates that no measurements were made since there was no foam head. All values have been rounded up.

References

  1. Ekberg, J.; Gibson, B.; Joensuu, J.J.; Krogerus, K.; Magalhães, F.; Mikkelson, A.; Seppänen-Laakso, T.; Wilpola, A. Physicochemical characterization of sahti, an‘ancient’ beer style indigenous to Finland. J. Inst. Brew. 2015, 121, 464–473. [Google Scholar] [CrossRef]
  2. Bamforth, C.W. The foaming properties of beer. J. Inst. Brew. 1985, 91, 370–383. [Google Scholar] [CrossRef]
  3. BJCP. Beer Style Guidelines, Edited by Gordon Strong, Kristen England. Available online: www.bjcp.org (accessed on 6 March 2021).
  4. Gonzalez Viejo, C.; Torrico, D.D.; Dunshea, F.R.; Fuentes, S. Bubbles, Foam Formation, Stability and Consumer Perception of Carbonated Drinks: A Review of Current, New and Emerging Technologies for Rapid Assessment and Control. Foods 2019, 8, 596. [Google Scholar] [CrossRef] [PubMed] [Green Version]
  5. Hackbarth, J.J. Multivariate Analyses of Beer Foam Stand. J. Inst. Brew. 2006, 112, 17–24. [Google Scholar] [CrossRef]
  6. Prins, A.; van Marle, J.T. Foam formation in beer: Some physics behind it. Monogr. Eur. Brew. Conv. 1999, 27, 26–36. [Google Scholar]
  7. Ronteltap, A.; Hollemans, M.; Bisperink, C.G.J.; Prims, A.R. Beer foam physics. Tech. Q. Master Brew. Assoc. Am. 1991, 28, 25–32. [Google Scholar]
  8. Fisher, S.; Hauser, G.; Sommer, K. Influence of dissolved gases on foam. Monogr. Eur. Brew. Conv. 1999, 27, 37–46. [Google Scholar]
  9. Evans, D.E.; Sheehan, M.C. Don’t Be Fobbed Off: The Substance of Beer Foam—A Review. J. Am. Soc. Brew. Chem. 2002, 60, 47–57. [Google Scholar] [CrossRef]
  10. ASBC. Methods of Analysis. Method Beer-22. Foam Collapse Rate. Approved 1962, Rev. 1975; American Society of Brewing Chemists: St. Paul, MN, USA, 2018. [Google Scholar] [CrossRef]
  11. Klopper, W.J. Foam stability and foam cling. In Proceedings of the Eur. Brew. Conv. Congr., Salzburg, Austria; Elsevier Scientific: Amsterdam, The Netherlands, 1973; pp. 363–371. Available online: https://www.kruss-scientific.com/en/explore/research-and-development/research-of-foam (accessed on 21 January 2021).
  12. Rudin, A. Measurement of the foam stability of beers. J. Inst. Brew. 1957, 63, 506–509. [Google Scholar] [CrossRef]
  13. Rasmussen, J.N. Automated analysis of foam stability. Carlsberg Res. Commun. 1981, 46, 25–36. [Google Scholar] [CrossRef] [Green Version]
  14. Jackson, G.; Bamforth, C. The measurement of foam-lacing. J. Inst. Brew. 1982, 88, 378–381. [Google Scholar] [CrossRef]
  15. Constant, M. A practical method for characterizing poured beer foam quality. J. Am. Soc. Brew. Chem. 1992, 0, 37–47. [Google Scholar] [CrossRef]
  16. Vundla, W.; Torline, P. Steps toward the formulation of a model foam standard. J. Am. Soc. Brew. Chem. 2007, 65, 21–25. [Google Scholar] [CrossRef]
  17. Amerine, M.A.; Martini, L.; Mattei, W.D. Foaming Properties of Wine. Ind. Eng. Chem. 1942, 34, 152–157. [Google Scholar] [CrossRef]
  18. Wilson, P.; Mundy, A. An improved method for measuring beer foam collapse. J. Inst. Brew. 1984, 90, 385–388. [Google Scholar] [CrossRef]
  19. Evans, D.E.; Surrel, A.; Sheehy, M.; Stewart, D.C.; Robinson, L.H. Comparison of foam quality and the influence of hop α-acids and proteins using five foam analysis methods. J. Am. Soc. Brew. Chem. 2008, 66, 1–10. [Google Scholar] [CrossRef]
  20. Evans, D.E.; Oberdieck, M.; Red, K.S.; Newman, R. Comparison of the Rudin and NIBEM Methods for Measuring Foam Stability with a Manual Pour Method to Identify Beer Characteristics That Deliver Consumers Stable Beer Foam. J. Am. Soc. Brew. Chem. 2012, 70, 70–78. [Google Scholar] [CrossRef]
  21. Smith, R.J.; Davidson, D.; Wilson, R.J. Natural foam stabilizing and bittering compounds derived from hops. J. Am. Soc. Brew. Chem. 1998, 56, 52–57. [Google Scholar] [CrossRef]
  22. Cimini, A.; Pallottino, F.; Menesatti, P.; Moresi, M. A low-cost image analysis system to upgrade the rudin beer foam head retention meter. Food Bioprocess Technol. 2016, 9, 1587–1597. [Google Scholar] [CrossRef]
  23. Gonzalez Viejo, C.; Fuentes, S.; Li, G.; Collmann, R.; Condé, B.; Torrico, D. Development of a robotic pourer constructed with ubiquitous materials, open hardware and sensors to assess beer foam quality using computer vision and pattern recognition algorithms: RoboBEER. Food Res. Int. 2016, 89, 504–513. [Google Scholar] [CrossRef]
  24. Gonzalez Viejo, C.; Fuentes, S.; Torrico, D.D.; Howell, K.; Dunshea, F.R. Assessment of Beer Quality Based on a Robotic Pourer, Computer Vision, and Machine Learning Algorithms Using Commercial Beers. J. Food Sci. 2018, 83, 1381–1388. [Google Scholar] [CrossRef] [PubMed]
  25. Gonzalez Viejo, C.; Fuentes, S.; Howell, K.; Torrico, D.D.; Dunshea, F.R. Integration of non-invasive biometrics with sensory analysis techniques to assess acceptability of beer by consumers. Physiol. Behav. 2019, 200, 139–147. [Google Scholar] [CrossRef] [PubMed]
  26. Lukinac, J.; Mastanjević, K.; Mastanjević, K.; Nakov, G.; Jukić, M. Computer Vision Method in Beer Quality Evaluation—A Review. Beverages 2019, 5, 38. [Google Scholar] [CrossRef] [Green Version]
  27. Middle European Brewing Analysis Commission (MEBAK); Band II.n Brautechnische Middle European Brewing Analysis Commission (MEBAK). Band II.n Brautechnische Analysenmethoden, 3th ed.; Selbstverlag der MEBAK: Freising-Weihenstephan, Germany, 1997. [Google Scholar]
  28. Python Programming Language. Available online: https://www.python.org/ (accessed on 21 January 2021).
  29. OpenCV. Available online: https://opencv.org/ (accessed on 21 January 2021).
Figure 1. Experimental setup.
Fermentation 07 00046 g001
Figure 2. Estimating foam height from an image. (a) Region of interest (ROI) of known width (w) and height (l) defined for the image. The ROI is marked in blue; (b) thresholding of ROI performed in HSV color space. The pixels satisfying the threshold are marked in red; (c) binary image of ROI thresholded in HSV color space (a magnified image is provided in Figure 3a); (d) morphological operations of erosion followed by dilation performed on binary image to remove artifacts (a magnified image is provided in Figure 3b); (e) largest contour found marked in red. The estimated height of foam in pixels is determined using Equation (1).
Fermentation 07 00046 g002
Figure 3. Magnified images of Figure 2a,b: (a) Initial binary image of ROI thresholded in HSV color space with visible artifacts; (b) Final binary image of ROI thresholded in HSV color space with artifacts removed after performing morphological operations.
Fermentation 07 00046 g003
Figure 4. Examples of depth images obtained using Orbbec Astra S 3D camera. Black pixels indicate that no depth information exists: (a) ROI defined in the middle of the glass containing foam; (b) the same view after a few minutes when the foam disappears.
Fermentation 07 00046 g004
Figure 5. Normalized foam height (%) determined by performing image analysis on RGB videos of 16 beer samples.
Fermentation 07 00046 g005
Figure 6. Changes of foam head of sample s02 over time due to the erratic behavior of CO2 bubbles.
Fermentation 07 00046 g006
Figure 7. A normalized distance of beer foam (%) from 3D camera for 16 beer samples.
Fermentation 07 00046 g007
Figure 8. Sample s06 after 40 s. (a) Foam is detected by automated image analysis of RGB image, even though this is just foam clinging to the beer glass; (b) 3D camera records this as lack of foam.
Fermentation 07 00046 g008
Table 1. Height of foam (pixels) determined by performing image analysis on RGB videos of 16 beer samples (the actual value in mm can be obtained using the conversion 1 mm = 6.6 px).
Time (s)s01s02s03s04s05s06s07s08s09s10s11s12s13s14s15s16
0-469117622920730826432030828018732169124318
10-403267137103231172269236183608138108285
20-37122880451931202121559624-11085280
30-4331049251637718111162--9179246
40-44--3726147581527235--8052219
50-47----135591266333--7241198
60-51----1235814855---6434179
70-48----1115712446---5823158
80-49----101-6941---56-143
90-57----93-5135---50-129
100-56----86-4429---46-115
110-56----84-45----43-103
120-59----82-53----34-91
130-59----80-52------82
140-55----78--------81
150-62----77--------73
160-58----75--------69
170-56----74--------64
180-53----72--------73
190-51----72--------68
200-50----73--------66
210-51----73--------64
220-50----72--------63
230-48----71--------62
240-43----72--------60
250-37----69--------58
260-41----70--------58
270-37----68--------56
280-35-------------54
290-35-------------54
300-34-------------53
“-” indicates that no measurements were made since there was no foam head. All values have been rounded up.
Table 2. The distance of foam head surface (mm) from the top of the table for 16 beer samples.
Time (s)s01s02s03s04s05s06s07s08s09s10s11s12s13s14s15s16
0158159161172171177181176178167177170134168165191
104115816016916716917717117416617516236166163189
20-158152157156157173163169154165156-163160184
30-158-153148152169156165145155--161158181
40-159--146-166152161137149--159157177
50-159--145-163150157134147--157156174
60-159----161150153133145--156155171
70-159----158149150132---156155169
80-159----156-146131---155-166
90-159----154-145131---155-164
100-159----152-144130---155-162
110-159----150-144----155-160
120-159----149-144----155-159
130-160----149--------157
140-159----148--------156
150-159----148--------155
160-159----147--------154
170-159----147--------154
180-159----147--------154
190-159----147--------153
200-159----147--------153
210-159----147--------153
220-159----147--------153
230-159----147--------153
240-158----147--------153
250-158----147--------153
260-158----147--------153
270-158-------------153
280-157-------------153
290-157-------------153
300-157-------------153
“-” indicates that no measurements were made since there was no foam head. All values have been rounded up.
Publisher’s Note: MDPI stays neutral with regard to jurisdictional claims in published maps and institutional affiliations.

