Article

Effect of Substrate Characteristics on the Growth and Sporulation of Two Biocontrol Microorganisms during Solid State Cultivation

1
Biosystems and Agricultural Engineering, University of Kentucky, Lexington, KY 40506, USA
2
Department of Food Science, Indonesia International Institute for Life Sciences, Jakarta Timur 13210, Indonesia
*
Author to whom correspondence should be addressed.
Fermentation 2020, 6(3), 69; https://doi.org/10.3390/fermentation6030069
Submission received: 27 June 2020 / Revised: 14 July 2020 / Accepted: 14 July 2020 / Published: 17 July 2020
(This article belongs to the Special Issue Solid State Fermentations)

Abstract

:
Biocontrol agents are a group of naturally occurring organisms capable of interrupting the lifespan and suppressing the propagation of disease organisms. The use of biocontrol agents offers an environment-friendly and sustainable solution to the synthetic agrochemicals. In this study, we investigated parboiled rice and millets as substrates for spore production of two model biocontrol microorganisms (Bacillus pumilus and Streptomyces griseus) under solid state cultivation (SSC) conditions. The effects of cultivation parameters such as initial moisture content, water activity, and cultivation time on microbial growth and spore production were studied. Furthermore, texture profile analysis was performed to test the stress and strain curve and the hardness and stickiness of the substrates. The greatest spore production occurred at 50% moisture content with millets as a substrate, yielding a count of 1.34 × 10⁸ spores/g-wet-substrate enumerated with plate count analysis and 1.70 × 10⁸ events/g-wet-substrate using flow cytometry analysis. Substrate texture profile was highly correlative to the initial moisture content and substrate type and all proved to be essential process variables in controlling the bacterial growth and sporulation during SSC processes.

1. Introduction

Soybeans are the foremost oilseed in the United States, recording 90 percent of U.S. oilseed yield. In the year of 2018, soybeans with ~89.2 million planted acres, account for the second-most-planted field crop in the U.S. after corn [1]. Soybean rust is a type of disease that damages soybeans and related legumes. Primarily caused by the pathogenic fungus Phakopsora pachyrhizi [2,3], the disease was first reported in Japan, and has since spread to other parts of Asia, Africa, Australia, and North America [4]. Symptoms first present themselves as small brownish-red dots, or lesions, that appear on the upper side of leaves, with raised pustules forming on the underside [5]. These pustules eventually burst open and release spores, causing the infected leaves to fall off and leading to a premature shutdown of the plant. Consequently, widespread disease can result in severely decreased yield size (up to 80 percent) and smaller seed size, negatively impacting soybean industries [4,5]. While several other methods of management and disease control have been suggested, such as better cultural practices, genetic resistance research, and fungal vaccines, the use of foliar fungicides is still currently the most effective method of managing the disease. Classes such as chlorothalonil and azoxystrobin have been shown to have the most significant impact, but continued research in other fungicides is being conducted [2,6,7].
The broad use of fungicides has led to decreased sensitivity and resistance in P. pachyrhizi [4]. Also, it has been reported that many agrochemicals are toxic and detrimental to both human health and ecological systems [8]. Therefore, incorporating alternative approaches to disease management is critical to provide the best possible means of effectively controlling soybean rust disease. Biocontrol agents are naturally occurring microorganisms that could interfere the lifespan of disease organisms. The utilization of biocontrol agents provides an environmentally friendly alternative option to the use of synthetic agrochemicals [4,9]. Bacillus, Simplicillium, and Streptomyces species, isolated from soil, have been reported effective in inhibiting P. pachyrhizi and other pathogenic fungi in vitro and are being examined as potential biocontrol agents [8,10]. Several studies have proposed that the antifungal amino sugars, lytic enzymes and mannosyl lipids produced by B. pumilus, Streptomyces griseus, and Simplicillium lanosoniveum, respectively, are the active biocontrol compounds [11,12,13]. However, field application of those biocontrol agents usually requires inoculation of the microorganisms in forms of living cells or dormant spores, while the latter is often preferred due to stability and long shelf life [14,15].
The production of biocontrol agents in synthetic medium (using glucose and nitrogen salts and other micronutrients) has been adopted by biotechnology industry using submerged fermentation [16]. However, there are a few challenges associated with existing technology, such as the high cost of synthetic medium and the difficulties in producing viable spores (as the marketable products stable throughout the shelf life) under submerged fermentation conditions [17]. Solid-state cultivation (SSC) is more cost-effective than submerged fermentation and offers a few advantages such as low medium cost, high volumetric productivity, lower water consumption, reduced wastewater treatment costs and lower energy consumption [16]. Besides lower production cost, SSC provide suitable conditions for spore production in high yield and stability as it mimics the natural habitant environment of the soil microorganisms [18].
Substrate characteristics and optimization of suitable cultivations parameters are important factors for the proliferation of microorganisms. Substrate in SSC is non-soluble material that provides both physical support and source of nutrients. Natural substrates are widely available and more affordable than synthetic substrates; however, a thermal pretreatment (such as autoclaving) is often needed in order to increase the susceptibility of macromolecules within the substrate by microbial enzymes and loosen up the physical structure to mycelial penetration [19,20]. The addition of nutrients (to balance the carbon and nitrogen ratio) may also be considered for the stimulation of microorganisms growth or to sustain secondary metabolite production [21]. Physical factors of the substrate such as particle sizes, texture, and surface property affect the rate of air penetration and rate of microbial colonization as well as the obtainability of nutrients and oxygen, thus greatly influencing the accessibility of substrate to the microorganisms.
Most of the soil microorganisms used in SSC are classified as mesophilic, which the optimum temperature range between 20 and 40 °C. Starting from neutral pH, the pH of the substrates could engage in changes due to the production of acids by the incomplete oxidation of the substrate, which will lead in the drop of pH. Considering the difficulty in pH control during SSC, microorganisms that could grow over a broad range of pH is preferable [22]. Regarding water activity (aw) in the growth of microorganisms, bacteria generally demand a higher aw value of greater than 0.9, whereas filamentous fungi and yeasts could grow at lower aw such as 0.6–0.7. The microorganisms that are able to grow and perform metabolic activities at lower aw values are favorable in SSC processes [23].
Carbon and nitrogen sources and macro- and micro- nutrients are essential for microbial growth. Both parboiled rice and millet are rich in carbohydrates and protein, although millet has been reported to have higher protein content [24]. Furthermore, according to USDA database, micronutrients such as calcium, magnesium, potassium and phosphorus are abundant in parboiled rice and millets [25]. Production of B. pumilus and S. griseus spores could be achieved using the two widely available substrates without supplementing other nutrients under SSC condition [26,27]. However, the cultivation conditions of B. pumilus and S. griseus on parboiled rice and millet have not been studied previously. In order to achieve maximum microbial growth and spore production, this study aims to investigate the effect of substrate type and initial moisture content on sporulation as the most important factors [28,29]. Substrate textures such as hardness and stickiness were correlated to water activity, microbial growth, and spore yield. Flow cytometry (with propidium iodide staining) was used for spore enumeration and compared with agar plate-based method. This study provides insight in the effect of substrate characteristics on bacterial growth and sporulation of two biocontrol bacteria during SSC.

2. Material and Methods

2.1. Microbial Strains

B. pumilus (DSM 27) and S. griseus (DSM 40236) strains were purchased from Leibniz Institute DSMZ - German Collection of Microorganisms and Cell Cultures. The frozen cultures were stored in cryogenic freezer at −80 °C. Aseptically, B. pumilus and S. griseus were subcultured in BD Difco nutrient broth and tryptone-yeast extract broth (purchased from Fisher Scientific), respectively, with the addition of glucose solution (4%) that was filter sterilized using 0.22 µm syringe filter. All broth cultures were grown at 37 °C for 48 h and aerated with orbital shaking at 200 rpm. The subcultures were grown to reach optical density (OD) between 0.5–1.0 at 600 nm (path length 1 cm). To determine the suitable culturing temperature and pH for the two strains, 50 uL of subculture was spread onto agar plates made of the same media mentioned above and cultured at 25 ± 2 °C, 28 ± 2 °C, and 30 ± 2 °C, each at three pH levels of 5.5, 6.0, and 7.0. The microbial growth on each agar plate was monitored every 24 h for a duration of 120 h.

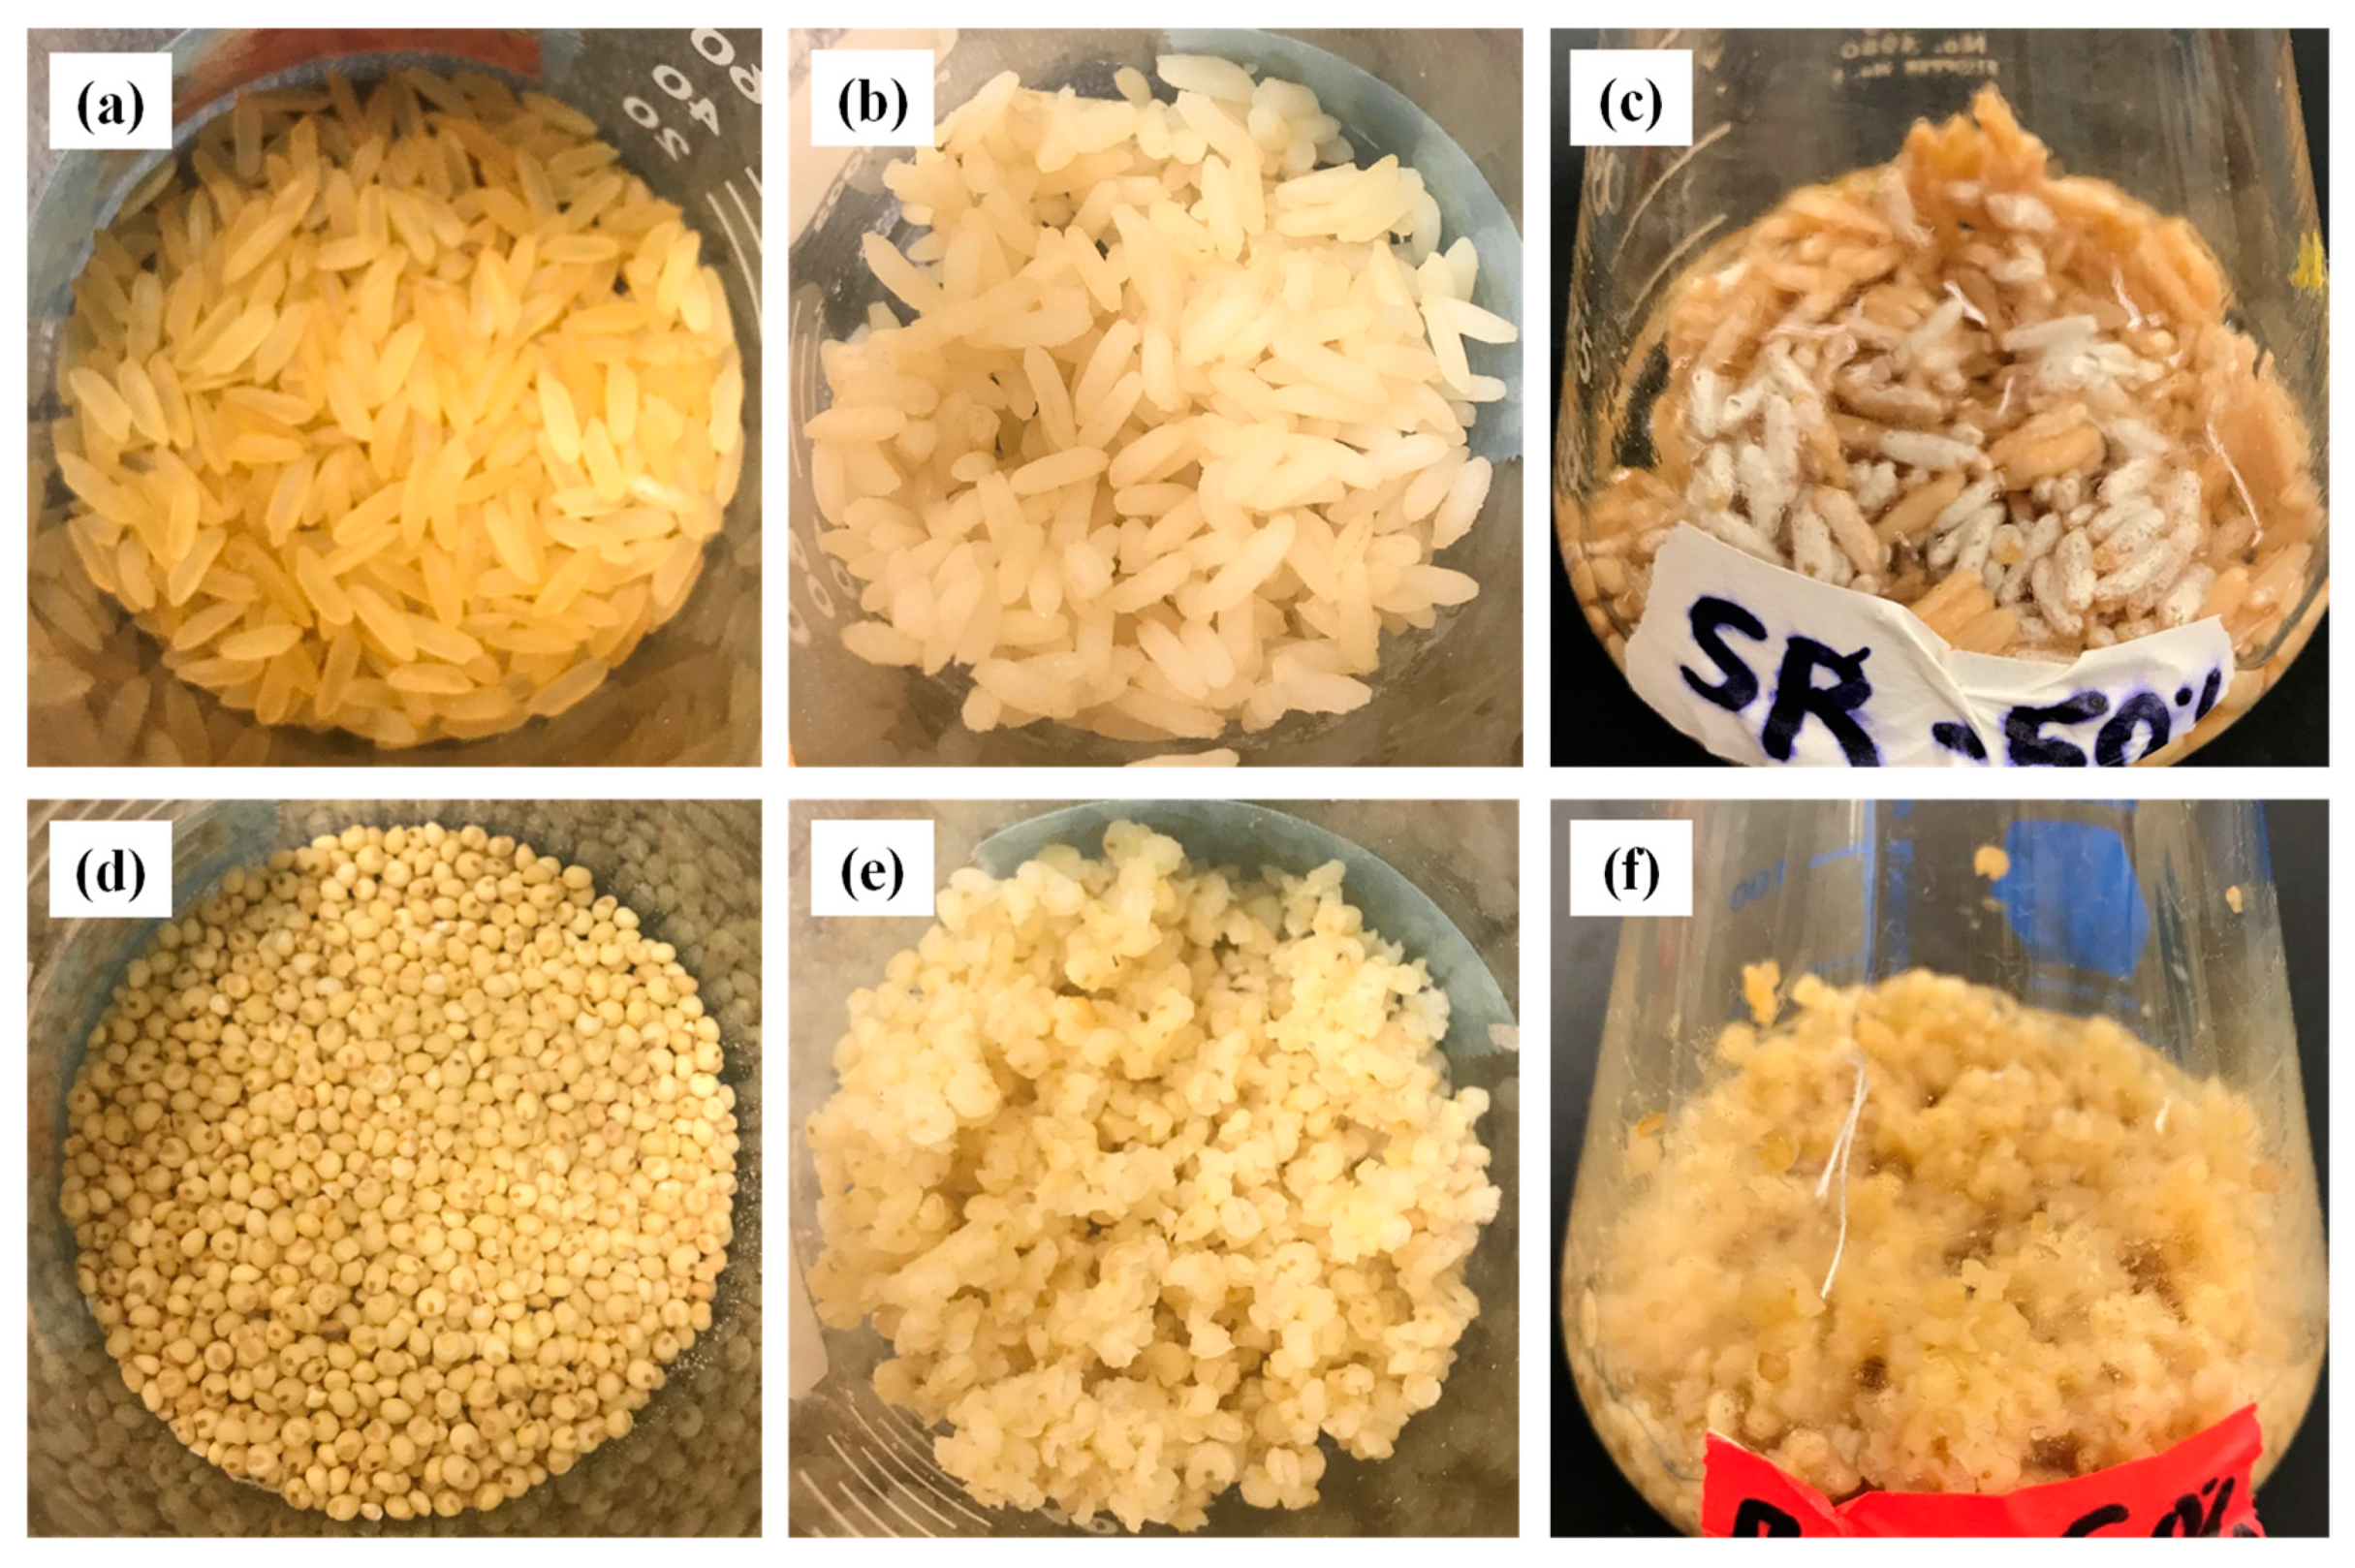
2.2. Substrate Preparation

Parboiled long grain white rice and hulled millets (purchased from a local supermarket, Lexington, KY, USA) were used as substrates for B. pumilus and S. griseus. The carbohydrate and protein contents of the two substrates were estimated to be 77.8%, 8.9%, and 71.6%, 10.5% for parboiled rice and millets, respectively [30]. The moisture contents of parboiled rice and millets were analyzed using oven-dry method. In brief, 10 g of parboiled rice and millets were dried in the oven overnight at 105 °C. The initial and final weight were recorded to calculate moisture content. Parboiled rice and millets were mixed with DI water to give three moisture content: 50%, 55%, and 60% (wet basis). Appropriate volume of deionized water was added into 10 g dry substrate to reach the desirable moisture content. The moist parboiled rice and millets were loaded to 250 mL flasks, covered by aluminum foil, and autoclaved for 15 min at 121 °C before inoculation. The raw and autoclaved parboiled rice and millets at different moisture levels were tested for water activities using Aqua Lab water activity meter (Pullman, WA, USA). Triplicate runs were obtained, and data recorded.

2.3. Texture Analysis and Microscopic Imaging

Raw and autoclaved parboiled rice and millets at different moisture levels were tested for hardness, stickiness, and stress and strain through texture analysis technique using TA. XT Plus Texture Analyzer (Stable Micro Systems, Surrey, UK) using compression test methods. The condition of the test was at compression speed of 10 mm/sec and return distance of 10 mm. The texture parameters were identified from force-deformation curve, which were hardness (g) Force, stickiness (g), Force, stress (MPa), and stress (%). The elastic modulus, E, was calculated from the slope of the initial linear portion of the stress–strain curves [31].
Scanning electron microscopy (SEM) images of the raw and autoclaved parboiled rice and millet samples were obtained by a FEI Quanta 250 FEG SEM operating at SE mode under low vacuum (0.40–0.65 Torr). Samples were prepared for imaging by freeze-drying using an AdVantage 2.0 bench top lyophilizer (SP Scientific, Warminster, PA, USA). The dried samples (both the surface and crosscut section) were sputter-coated in gold and the imaging was performed at beam accelerating voltages of 2 kV.

2.4. Solid-State Fermentation and Spore Production

Subcultures of B. pumilus and S. griseus were inoculated to autoclaved parboiled rice and millets at an inoculation rate of 105 colony-forming unit (CFU)/g substrate on dry basis. The cultures were labeled as (BR) B. pumilus inoculation on rice; (BM) B. pumilus inoculation on millet; (SR) S. griseus inoculation on rice; and (SM) S. griseus inoculation on millet, each at three moisture levels. After inoculation, the substrate was stirred with sterilized glass rods. All flasks were then covered with cheesecloth and incubated without shaking at 28 °C for 360 h.
To harvest the spores, culture flasks were transferred into biosafety cabinet and the substrate was mixed with PBS buffer (90 mL). Flasks were then transferred into an orbital shaking incubator and shaken at 200 rpm for 60 min. Subsequently, an aliquot was taken and serially diluted using PBS buffer 10 × stepwise to 10−7 dilution.

2.5. Flow Cytometry Spore Counting

All samples of 10−4 dilution were evaluated using flow cytometry to estimate the number of spores. In regard to staining, 50 µL of propidium iodide (PI) was used to stain 500 µL of samples. Each sample was incubated in the dark for 5 min at room temperature to permit dye binding. Before injecting to flow cytometer, all samples were homogenized by gentle inversions and vortexed lightly at 5 rpm. Flow cytometry analysis was performed on a BD FASCalibur flow cytometer. PI dyes were excited using 488 nm laser. The flow rate was set up at 550 µL and 2.5 min run time for each sample. All parameters were recorded in logarithmic scale including forwards (FSC) and side scattering (SSC), and up to 1,300,000 total events were counted within G1 gate. The gated spores and cells (R1, R2, R3) events were triggered by using a threshold on both PI and fluorescein isothiocyanate. Dead spores and cells were identified using pulse height for PI fluorescence gated on R3 region. Negative controls were made prior to running actual samples using no PI dyes stained samples. Each sample was recorded in duplicate and averaged for subsequent R3 region event analysis. Flow cytometry results were compared with traditional plate count. Respectively, nutrient agar and tryptone-yeast extract agar were made for sporulated B. pumilus and S. griseus on respective rice and millet. Samples with 10−4, 10−5, 10−6 and 10−7 dilution of BR, BM, SR, and SM with respective moisture levels were plated and incubated for 24h at 28 °C in Heratherm incubator (Thermo Scientific, Waltham, MA, USA). The colonies were enumerated to calculate the number of viable spores.

2.6. Statistical Analysis

All experiments were conducted in duplicates or triplicates and the data are presented as means and standard deviations. The statistical analysis, ANOVA and two-ways Tukey’s test, was performed by SAS® 9.4 (SAS Institute, Cary, NC, US), with a significance level of p < 0.05 for all the data obtained from experiments.

3. Results and Discussion

3.1. Cultivation Condition Optimization on Agar Plates

Qualitative observations on the microbial growth were made every 24 h over a period of 120 h to determine the suitable culturing temperature and pH for the two strains on agar plates cultured at 25 ± 2 °C and 28 ± 2 °C, each at three pH levels of 5.5, 6.0, and 7.0. The plates stored at 28 °C showed the greatest initial growth in the first three days of incubation. This indicates that over a short incubation period temperature plays a vital role in microbial growth. However, over a week the density of cells on the plates did not show distinct visual differences at the two temperatures. The more prominent variable was the pH of the media. It is clear from Figure S1 that both bacteria preferred neutral pH while did not thrive on media at pH < 6. Since both microbes are natural soil habitants, this observation is reasonable. Although, agar plate optimization will not fully represent the growth condition on real SSC, it provides some essential information on the cultivation parameters of the two strains. Based on that, we further optimized the other cultivation factors such as substrate type and initial moisture content. Figure 1 shows the raw parboiled rice and millet, and the autoclaved parboiled rice and millet at 50% initial moisture content, and B. pumilus and S. griseus grown on parboiled rice and millet, respectively at 50% initial moisture content. It can be seen that the shape, size, and texture of the two substrates in their raw and autoclaved form varied a lot. Such variations can be better defined by characterizing the mechanical and structural properties of the substrates.

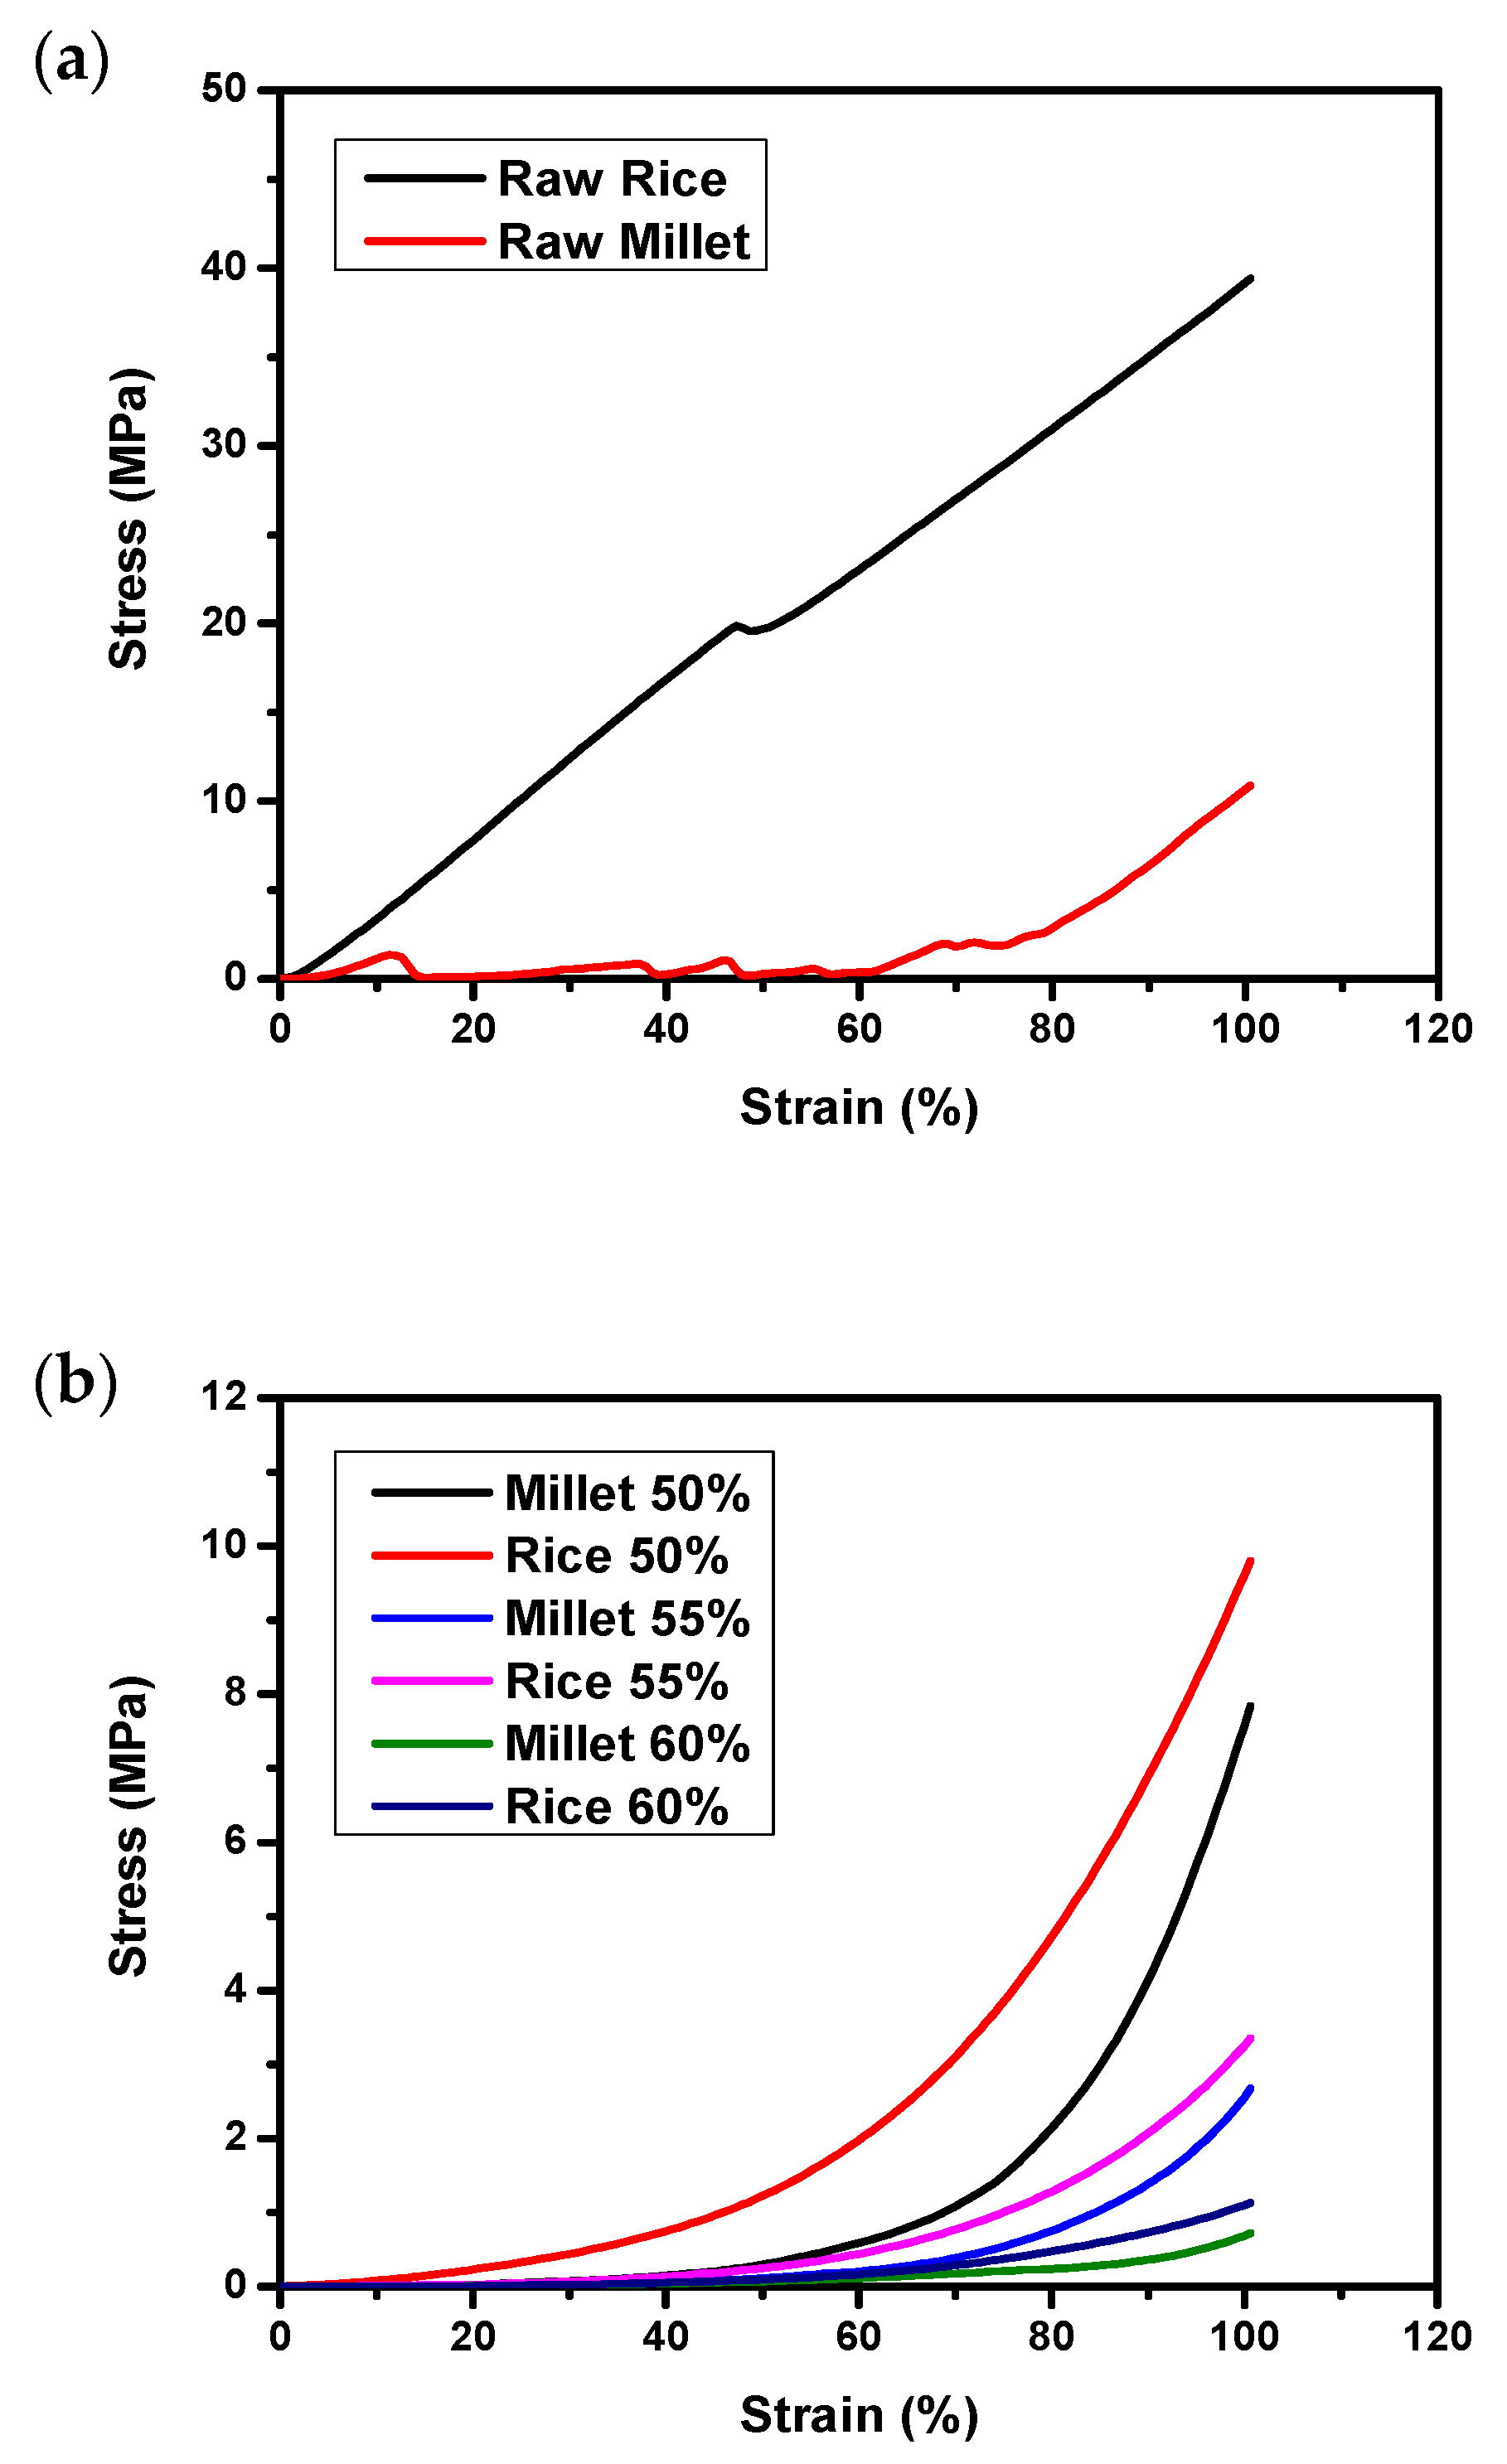
3.2. Texture Profile Analysis (TPA) on Raw and Autoclaved Substrates

A texture profile analysis provides essential information about substrate characteristics in SSC processes. The texture of substrates, parboiled rice and millet, could influence the microbial growth and production of spores. Table 1 shows the Young’s modulus of raw and autoclaved parboiled rice and millet with different moisture contents, which were calculated from the stress–strain curves shown in Figure 2. The Young’s modulus of raw rice was 421.2 kPa, which was significantly higher than that of raw millet, 118.9 kPa. With moisture incorporated during autoclave process, the Young’s modulus reduced remarkably. At 50% of moisture content, the Young’s modulus of the rice and millet decreased to 16.8 and 10.1 kPa, which were around 25 and 12 times lower than the raw grains, respectively. As the moisture content increases, the Young’s modulus further decreases. At 60% moisture content, the Young’s modulus of rice and millet were 4.2 and 2.5 kPa, which were around 400 and 48 times lower than the raw grains, respectively.
It is believed that the texture properties were affected by the ratio of two kinds of starches, amylose and amylopectin [32]. Amylose is a linear long chain polysaccharide composed of primarily α−1,4-linked glucose units, while amylopectin is a highly branched polysaccharide with additional glucose units in α-1,6 linkage. When the grains were autoclaved in the presence of water, the chains of both amylose and amylopectin were substantially disrupted. Although after cooling and drying, the cooked grains retrograded, the disrupted amylose and amylopectin chains have rearranged in a different order, which significantly reduced the stiffness of the raw grains [33]. According to Bora, Krishnakumari and Tahumanavan, millet has a total starch content ranged from 64–79% [34,35]; while the total starch content of parboiled rice ranges from 78% to 86% [36]. Based on USDA’s FoodData Central, the carbohydrate contents of the two substrates were estimated to be 71.6% and 77.8% for millets and parboiled rice, respectively [30]. While parboiled rice contains nearly no total dietary fiber as compared to ~3.2% in millet, parboiled rice contains much higher level of starch carbohydrate than that of millet [30]. The higher starch content in parboiled rice could explain the different Young’s modulus levels of parboiled rice and millet.

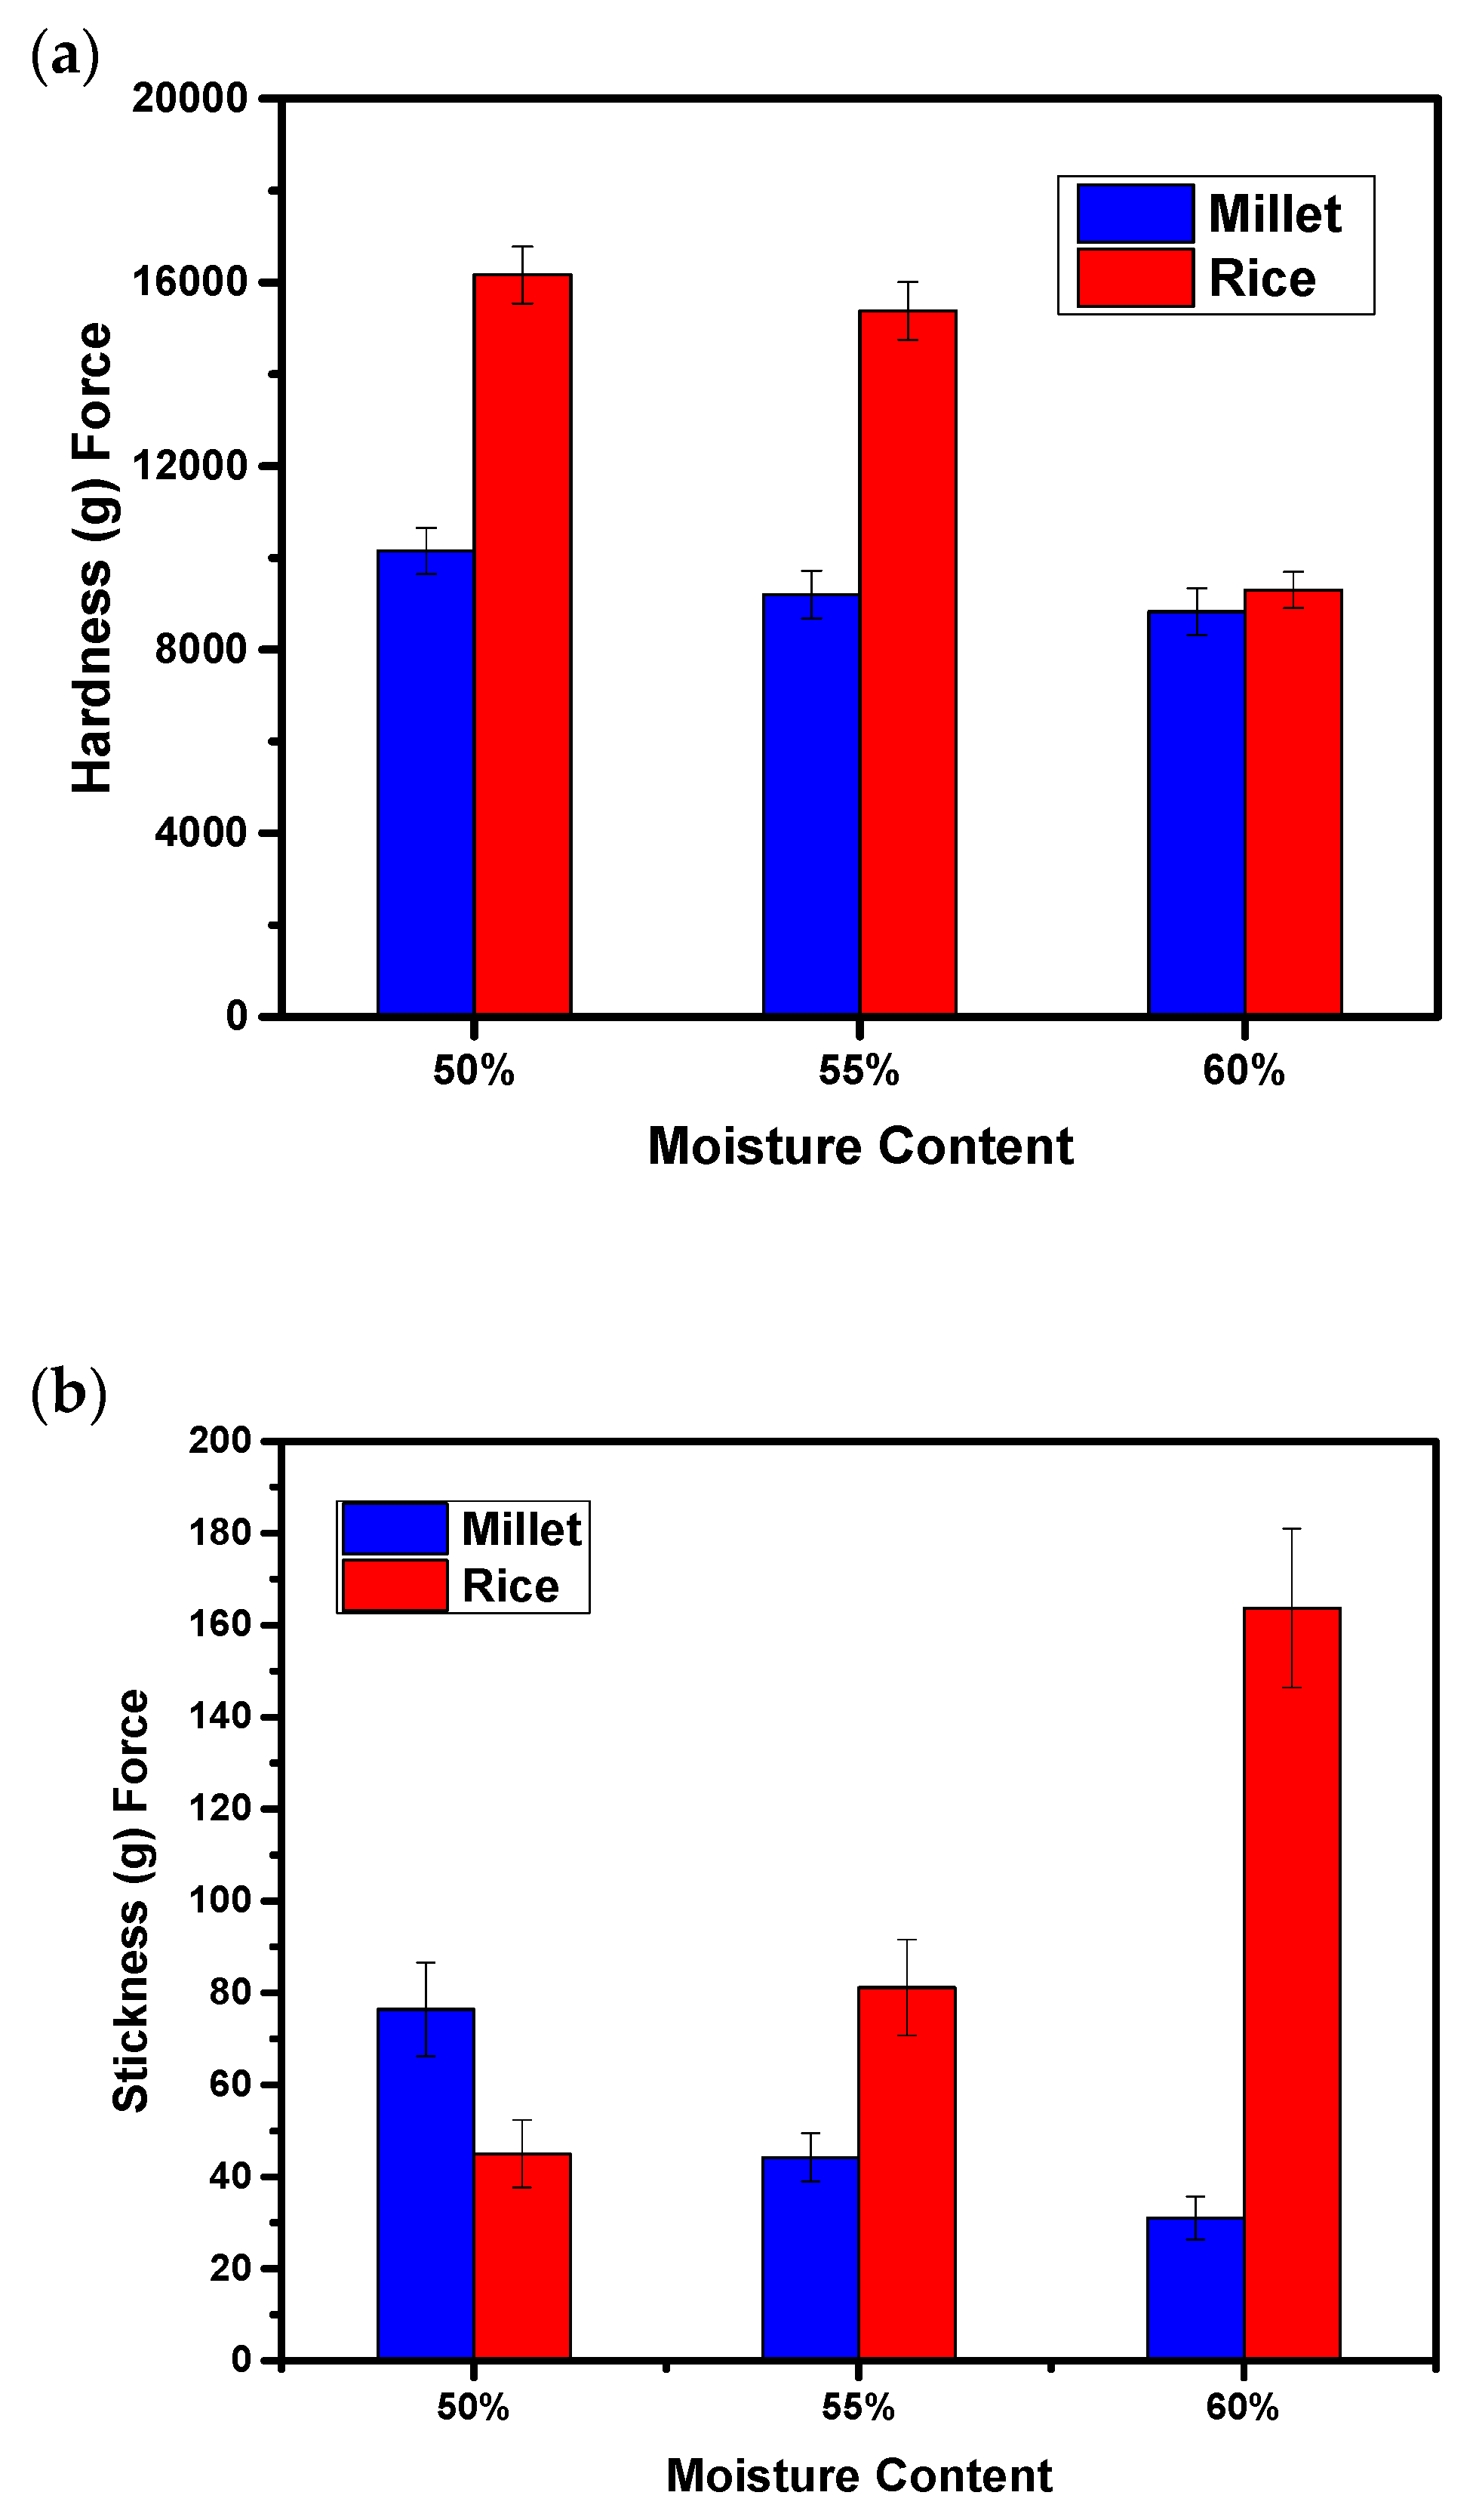
3.3. Hardness and Stickiness

The hardness and stickiness of parboiled rice and millet were correlated with texture profile analysis [29]. During cooking or autoclaving, parboiled rice and millet granules absorb water and swell to larger size than its initial state. The particular granule expansion resulted in ruptures in the grain, causing a decrease in the hardness. Moreover, according to Cuevas et al., amylose and amylopectin molecules are estimated to leach into the surrounding water above the gelatinization temperature [37]. Those leached amylose and amylopectin molecules are prone to play a part in the stickiness of cooked rice [29,38,39]. Thus, the higher amylose leaching leads to higher stickiness level.
In this study, both parboiled rice and millets were autoclaved at the same temperature and time and compared at identical initial moisture contents (MC): 50%, 55%, and 60%, respectively. Based on Figure 3a, the hardness levels of both parboiled rice and millet decreased as the moisture content increased. The hardness level of parboiled rice significantly decreased from 55% MC to 60% MC. However, the hardness level of millet only showed a gradual/slight decrease from 50% to 60% MC. The less significant decrease of the hardness of millet was probably caused by low extent of amylose leaching. A study by Nuwamanya et al. showed that the extent of amylose leaching of millet, was the lowest amongst different varieties of root, tuber and cereal starches [40].
As shown in Figure 3b, the stickiness of parboiled rice, from low to high MC, increased drastically from ~45 to 164 (g) force, whereas the stickiness of millet showed gradual decrement from 76 to 32 (g) force. It appeared that the hardness of the parboiled rice is negatively correlated with stickiness. Recent studies described that stickiness is negatively correlated with amylose content and hardness [36,41,42]. Stickiness is the susceptibility of the cooked rice adhering to one another, which is the force of the rice pulling against the crosshead measured throughout the movement [43]. Nevertheless, as aforementioned, millet has low amylose leaching properties thus exhibited reduction in the stickiness as MC increases. Generally speaking, parboiled rice and millet demonstrated significant differences in hardness and stickiness at different moisture levels likely due to difference in starch content and composition. Such differences in turn could play a major role in supporting microbial growth.

3.4. Water Activity

Water activity (aw) is one of the major factors in the requirements of bacterial growth. Shown in Table 2, raw parboiled rice and millet have the lowest water activity amongst all samples, showing 0.401aw and 0.435aw, respectively. Whereas all moist rice and millet with 50%, 55%, and 60% MC resulted in above 0.90aw with slight increase as moisture content increases. The aw provides an indication of the amount of free water in the substrate and indicates what type of microorganisms could grow on the substrate especially at SSC conditions [44]. Robinson and Nigam suggested that fungal microorganisms are capable of proliferating at lower aw values of 0.6–0.7, making them suitable for SSC at low MC. In general, bacteria grow at higher aw values of about 0.9 [45]; thus all three moisture levels tested in this study, can potentially support the growth of B. pumilus and S. griseus in SSC process. However, the effect of moisture content can be more complicated than just water activity.
The effect of initial moisture content on the texture structure of parboiled rice and millet is exhibited by SEM imaging, as shown in Figure 4. The raw grain, both parboiled rice and millet, showed a relatively rough surface, as well as a solid and dense texture, which can be seen in Figure 4a,b. Similar textures were also observed from the images of the crosscut sections of both grains (Figure 4c,d). The autoclaving process led to penetration of moisture and noticeable changes in the microstructure of parboiled rice and millet grains compared to the raw substrates. At 50% moisture content, the surfaces of autoclaved parboiled rice and millet became swelled and smooth (Figure 4e,f). However, significant changes in texture were observed on the crosscut sections. As shown in Figure 4g,h, a large number of pores can be spotted on the crosscut sections of both grains. As the initial moisture content increased from 50% to 60%, the roughness of the grain surface was further reduced (Figure 4i,j), while the pore structure on the crosscut section further developed (Figure 4k,l). Dobraszczyk et al. reported that the porosity of wheat increases in respect of initial moisture content. The increased level of porosity significantly loosens the endosperm structure and contributes to the soft endosperm texture of wheat [46]. The morphology characterization of the parboiled rice and millet suggests that the increased moisture content contributes to an increase in porosity but decrease in hardness of rice and millet after autoclaving, which is consistent with the Dobraszczyk’s study. The mechanical and morphological changes of the substrates as a function of initial moisture content and autoclaving could lead to better accessibility of the microorganisms to the nutrients.

3.5. Effect of Moisture Content and Substrate Type on Spore Production

Two enumeration methods were used to quantify the viable spores produced after 15-day SSC of the two microorganisms at different moisture contents. By counting the colonies on the agar plate, the highest number of spores were found to be millet with S. griseus subculture (SM), followed by S. griseus on rice (SR), B. pumilus on millet (BM) and B. pumilus on rice (BR) for both 50% and 55% moisture contents. The counted number of spores were significantly lower at 60% moisture. Regardless of moisture contents, it is noted that millet appears as a preferable substrate for spore production. This is possibly due to the fact that millet had lower hardness and stickiness in comparison to parboiled rice, which is more suitable for bacteria to establish and grow on the millet surface. The higher protein content and micronutrient of millet may also contribute to the better microbial growth and sporulation. In general, more spores were produced for S. griseus than for B. pumilus.
Moisture content is a key variable in SSC processes. Over the range of the tested moisture content of 50–60%, the highest spore production, 13.4 × 10⁷ S. griseus spores/g-wet-substrate, occurred at 50% moisture on millet (Figure 5a). Note that microbial growth and sporulation depend on several parameters, including the moisture content, hardness and stickiness, and the starch and other constitutions of the substrate. The poor performance at 60% moisture is probably due to the high stickiness that causes substrates to agglomerate, which could have restricted the diffusion of oxygen and nutrient within the substrate. According to Pandey et al., high moisture content could lead to agglomeration of amylopectin masses owing to the surface phenomenon along with the adsorption by grains causing a thick layer of sticky amylopectin film, as a result causing oxygen transfer limitations [47,48]. Consequently, a significant decrease in the production of microbial metabolites is observed. Thus, it is essential to provide and maintain the moisture content at an optimum level. Of course, the optimal moisture level is substate and microorganism dependent. Results from this study suggest that 50% initial MC can provide the best substrate characteristics for parboiled rice and millets that facilitate microbial growth and sporulation of both microorganisms, S. griseus and B. pumilus.
Flow cytometry provides a rapid and facile method to quantify viable cells in a cell suspension. Propidium iodide (PI) is a commonly used membrane impermeant dye that binds to the double stranded DNA; the dye is generally excluded from viable spores so only the dead spores are stained [49,50,51,52]. PI could be selected as the dye exclusion marker [53,54,55] by the intact cell membrane of viable spores, which is a membrane impermeable red fluorescent nucleic acid dyes [56,57]. In this study, cell-impermeant PI dye was used to determine the number of events of respective samples by staining dead spores or spores in which the inner cell membrane had been physically compromised [58,59,60], spores in region 1 (R1) were the dormant or culturable spore sub-population [59,61], and R4 as the inactivated or non-culturable spores. Spores in R2 regions were categorized as the germinated or culturable, but heat sensitive; while spores in R3 represent a population with some damage of an inner membrane, hence promoting PI dyes to gain access to spores (Figure 6). However, in R3 region, there are other particles that could be detected besides spores such as bacterial cells. Based on Alsharif and Golfrey, R1 represents a live gate around the bacterial population, and R2 and R3 regions correspond to stained bacterial population [62]. Since stained spores could only be detected in R3 region, the number of events in R3 region is calculated and compared to each sample including BR, BM, SR and SM. Based on Figure 5b, the highest number of events is achieved by SM with 50% MC (17.0 × 10⁷ particles/g-wet-substrate), followed by 55% MC (12.9 × 10⁷ particles/g-wet-substrate), and 60% MC (10.6 × 10⁷ particles/g-wet-substrate). While the lowest number of events occurred in BR with 50% MC (2.5 × 10⁷ particles/g-wet-substrate). The trend obtained from flow cytometry assay in general matches with the results based on plate count method. The discrepancies could be due to gating errors; however, they could be improved by introducing a secondary dye such as Syto BC, a green fluorescent nucleic acid dye, which stains RNA and DNA in both live and dead spores. The combination of PI and Syto BC could provide a more accurate enumeration on the total spores and the viable spores.

4. Conclusions

Spores production was achieved by SSC of B. pumilus and S. griseus on parboiled rice and millet. Substrate type and initial moisture content greatly affected substrate texture characteristics such as elasticity, hardness and stickiness, and morphology. The greatest spore production occurred at 50% moisture content with millets as a substrate for S. griseus while lower spore yield was achieved for B. pumilus also at 50% moisture content with millet. Cultivation parameters such as substrate type and nutrient constitution, hardness and stickiness, and water activity all played roles in microbial growth and spore production. Flow cytometry assay gave matching results when compared to plate-count method. Collectively, results from this study lead to a better understanding of the effect of substrate characteristics on bacterial growth and sporulation of two biocontrol bacteria during SSC. This study provides important knowledge toward the development of bacterial SSC process for production of biocontrol agents using cheap resources.

Supplementary Materials

Supplementary materials can be found at https://www.mdpi.com/2311-5637/6/3/69/s1. Figure S1: Optimizing growth conditions of B. pumilus and S. griseus using agar plates.

Author Contributions

G.Y.L. and J.S. conceptualized the research and designed the experiments. G.Y.L., W.L., and U.M.C. carried out experiments, analysed the data and drafted the manuscripts. All authors critically reviewed and approved the manuscript.

Funding

This research was funded by National Institute of Food and Agriculture, U.S. Department of Agriculture under accession number 1018315.

Acknowledgments

The information reported in this paper is part of a project of the Kentucky Agricultural Experiment Station and is published with the approval of the Director. We thank Adedeji Akinbode for allowing us using the texture analyzer and Francis Agbali and Enshi Liu for lab assistance. We thank Donald Cohen and Jennifer Strange for making the flow cytometry facility available to this project.

Conflicts of Interest

The authors declare no conflict of interest.

Disclaimer

Materials in this paper have been submitted to the proceedings of the 2018 American Society of Agricultural and Biological Engineers (ASABE) annual meeting (doi:10.13031/aim.201801000, not peer-reviewed;). ASABE does not consider this paper as having prior publication status and allows for publication in other peer-reviewed journals (source: https://www.asabe.org/Copyright).

References

  1. USDA. Oil Crops Yearbook. In Economic Research Service; USDA: Washington, DC, USA, 2020. [Google Scholar]
  2. Cliff, C.; Hurst, K.; Kirkpatrick, T.; Rupe, J.; Tingle, C.; Trent, M. Asian Soybean Rust; Division of Agriculture, University of Arkansas: Little Rock, AR, USA, 2010. [Google Scholar]
  3. Schneider, R.; Hollier, C.; Whitam, H.; Palm, M.; McKemy, J.; Hernandez, J.; Levy, L.; DeVries-Paterson, R.; Demonty, I.; Edine, N. First report of soybean rust caused by Phakopsora pachyrhizi in the continental United States. Plant Dis. 2005, 89, 774. [Google Scholar] [CrossRef] [PubMed]
  4. Langenbach, C.; Campe, R.; Beyer, S.F.; Mueller, A.N.; Conrath, U. Fighting Asian soybean rust. Front. Plant Sci. 2016, 7, 797. [Google Scholar] [CrossRef] [Green Version]
  5. Giesler, L. Asian Soybean Rust; Institute of Agriculture and Natural Resources, University of Nebraska-Lincoln: Lincoln, NE, USA, 2009. [Google Scholar]
  6. Sconyers, L.E.; Kemerait, R.C.; Brock, J.; Phillips, D.V.; Jost, P.H.; Sikora, E.J.; Gutierrez-Estrada, A.; Mueller, J.D.; Marois, J.J.; Wright, D.L. Asian soybean rust development in 2005: A perspective from the Southeastern United States. Apsnet Feature Article. 2006. Available online: http://www.Apsnet.Org/Online/Feature/Sbr (accessed on 16 July 2020).
  7. Rupe, J.; Sconyers, L. Soybean rust. The plant health instructor. In Proceedings of the American Phytopathological Society, St. Paul, MN, USA, 1 April 2008; Available online: https://www.apsnet.org/edcenter/disandpath/fungalbasidio/pdlessons/Pages/SoybeanRust.aspx (accessed on 16 July 2020).
  8. Wagacha, J.; Muthomi, J.; Mutitu, E.; Mwaura, F. Control of bean rust using antibiotics produced by Bacillus and Streptomyces species-translocation and persistence in snap beans. J. Appl. Sci. Environ. Manag. 2007, 11. [Google Scholar] [CrossRef]
  9. Hurali, M.K. Eco-Friendly Management of Soybean Rust Caused by Phakopsora Pachyrhizi Syd. Master’s Thesis, University of Agricultural Sciences, Dharwad, India, 2008. [Google Scholar]
  10. Ward, N.; Robertson, C.; Chanda, A.K.; Schneider, R. Effects of Simplicillium lanosoniveum on Phakopsora pachyrhizi, the soybean rust pathogen, and its use as a biological control agent. Phytopathology 2012, 102, 749–760. [Google Scholar] [CrossRef] [PubMed] [Green Version]
  11. Serrano, L.; Manker, D.; Brandi, F.; Cali, T. The use of Bacillus subtilis QST 713 and Bacillus pumilus QST 2808 as protectant fungicides in conventional application programs for black leaf streak control. In Proceedings of the VII International Symposium on Banana: ISHS-ProMusa Symposium on Bananas and Plantains: Towards Sustainable Global Production 986, Salvador, Brazil, 10–14 October 2011; pp. 149–155. [Google Scholar]
  12. Dorighello, D.V.; Bettiol, W.; Maia, N.B.; de Campos Leite, R.M.V.B. Controlling Asian soybean rust (Phakopsora pachyrhizi) with Bacillus spp. and coffee oil. Crop Prot. 2015, 67, 59–65. [Google Scholar] [CrossRef]
  13. Le Dang, Q.; Shin, T.S.; Park, M.S.; Choi, Y.H.; Choi, G.J.; Jang, K.S.; Kim, I.S.; Kim, J.-C. Antimicrobial activities of novel mannosyl lipids isolated from the biocontrol fungus Simplicillium lamellicola BCP against phytopathogenic bacteria. J. Agric. Food Chem. 2014, 62, 3363–3370. [Google Scholar] [CrossRef]
  14. Wraight, S.; Jacksonz, M.; De Kock, S. Formulation of Fungal Biocontrol Agents. Fungi Biocontrol Agents Prog. Probl. Potential 2001, 253. [Google Scholar]
  15. Leggett, M.; Leland, J.; Kellar, K.; Epp, B. Formulation of microbial biocontrol agents—An industrial perspective. Can. J. Plant Pathol. 2011, 33, 101–107. [Google Scholar] [CrossRef]
  16. Subramaniyam, R.; Vimala, R. Solid state and submerged fermentation for the production of bioactive substances: A comparative study. Int. J. Sci. Nat. 2012, 3, 480–486. [Google Scholar]
  17. Cawoy, H.; Bettiol, W.; Fickers, P.; Ongena, M. Bacillus-based biological control of plant diseases. Pestic. Mod. World-Pestic. Use Manag. 2011, 273–302. [Google Scholar]
  18. Shi, J.; Chinn, M.S.; Sharma-Shivappa, R.R. Microbial pretreatment of cotton stalks by solid state cultivation of Phanerochaete chrysosporium. Bioresour. Technol. 2008, 99, 6556–6564. [Google Scholar] [CrossRef] [PubMed]
  19. Manpreet, S.; Sawraj, S.; Sachin, D.; Pankaj, S.; Banerjee, U. Influence of process parameters on the production of metabolites in solid-state fermentation. Malays. J. Microbiol. 2005, 2, 1–9. [Google Scholar] [CrossRef]
  20. Mitchell, D.A.; Berovic, M.; Krieger, N. Biochemical engineering aspects of solid state bioprocessing. In New Products and New Areas of Bioprocess Engineering; Springer: Berlin/Heidelberg, Germany, 2000; pp. 61–138. [Google Scholar]
  21. Georgiou, G.; Shuler, M. A computer model for the growth and differentiation of a fungal colony on solid substrate. Biotechnol. Bioeng. 1986, 28, 405–416. [Google Scholar] [CrossRef] [PubMed]
  22. Raimbault, M.; Alazard, D. Culture method to study fungal growth in solid fermentation. Eur. J. Appl. Microbiol. Biotechnol. 1980, 9, 199–209. [Google Scholar] [CrossRef]
  23. Prior, B.; Du Preez, J.; Rein, P. Environmental parameters. Solid Substr. Cultiv. 1992, 65. [Google Scholar]
  24. Singh, M.; Adedeji, A.; Santra, D. Physico-Chemical and Functional Properties of Nine Proso Millet Cultivars. Trans. Asabe 2018, 61, 1165–1174. [Google Scholar] [CrossRef] [Green Version]
  25. USDA. Nutrient Lists from Standard Reference Legacy (2018); Nutrient Data Laboratory, USDA: Washington, DC, USA, 2018. [Google Scholar]
  26. Čihák, M.; Kameník, Z.; Šmídová, K.; Bergman, N.; Benada, O.; Kofroňová, O.; Petříčková, K.; Bobek, J. Secondary metabolites produced during the germination of Streptomyces coelicolor. Front. Microbiol. 2017, 8, 2495. [Google Scholar] [CrossRef] [Green Version]
  27. Sella, S.R.B.R.; Guizelini, B.P.; Vandenberghe, L.P.d.S.; Medeiros, A.B.P.; Soccol, C.R. Lab-Scale production of Bacillus atrophaeus’ spores by solid state fermentation in fifferent types of bioreactors. Braz. Arch. Biol. Technol. 2009, 52, 159–170. [Google Scholar] [CrossRef] [Green Version]
  28. Kladsuk, S.; Sirisomboon, P. Determination of hardness characteristic of cooked rice samples in rice industry. In Proceedings of the 14th TSAE National Conferences, Hua Hin, Thailand, 1–4 April 2013. [Google Scholar]
  29. Ogawa, Y.; Wood, D.F.; Whitehand, L.C.; Orts, W.J.; Glenn, G.M. Compression deformation and structural relationships of medium grain cooked rice. Cereal Chem. 2006, 83, 636–640. [Google Scholar] [CrossRef] [Green Version]
  30. US Department of Agriculture A.R.S. FoodData Central; USDA: Washington, DC, USA, 2019. [Google Scholar]
  31. Nakayama, A.; Kakugo, A.; Gong, J.P.; Osada, Y.; Takai, M.; Erata, T.; Kawano, S. High Mechanical Strength Double-Network Hydrogel with Bacterial Cellulose. Adv. Funct. Mater. 2004, 14, 1124–1128. [Google Scholar] [CrossRef]
  32. Panesar, P.; Kaur, S. Rice: Types and Composition. In Encyclopedia of Food and Health; Academic Press: Waltham, MA, USA, 2016; pp. 646–652. [Google Scholar]
  33. Wang, S.; Li, C.; Copeland, L.; Niu, Q.; Wang, S. Starch retrogradation: A comprehensive review. Compr. Rev. Food Sci. Food Saf. 2015, 14, 568–585. [Google Scholar] [CrossRef]
  34. Bora, P. Nutritional Properties of Different Millet Types and Their Selected Products. Master’s Thesis, The University of Guelph, Guelph, ON, Canada, 2013. [Google Scholar]
  35. Krishnakumari, S.; Thayumanavan, B. Content of starch and sugars and in vitro digestion of starch by α-amylase in five minor millets. Plant Foods Hum. Nutr. 1995, 48, 327–333. [Google Scholar] [CrossRef] [PubMed]
  36. Li, H.; Prakash, S.; Nicholson, T.M.; Fitzgerald, M.A.; Gilbert, R.G. The importance of amylose and amylopectin fine structure for textural properties of cooked rice grains. Food Chem. 2016, 196, 702–711. [Google Scholar] [CrossRef] [Green Version]
  37. Cuevas, R.P.; Daygon, V.D.; Corpuz, H.M.; Nora, L.; Reinke, R.F.; Waters, D.L.; Fitzgerald, M.A. Melting the secrets of gelatinisation temperature in rice. Funct. Plant Biol. 2010, 37, 439–447. [Google Scholar] [CrossRef]
  38. Leelayuthsoontorn, P.; Thipayarat, A. Textural and morphological changes of Jasmine rice under various elevated cooking conditions. Food Chem. 2006, 96, 606–613. [Google Scholar] [CrossRef]
  39. Li, H.; Fitzgerald, M.A.; Prakash, S.; Nicholson, T.M.; Gilbert, R.G. The molecular structural features controlling stickiness in cooked rice, a major palatability determinant. Sci. Rep. 2017, 7, 1–12. [Google Scholar] [CrossRef] [Green Version]
  40. Nuwamanya, E.; Baguma, Y.; Wembabazi, E.; Rubaihayo, P. A comparative study of the physicochemical properties of starches from root, tuber and cereal crops. Afr. J. Biotechnol. 2011, 10, 12018–12030. [Google Scholar]
  41. Yu, S.; Ma, Y.; Sun, D.-W. Impact of amylose content on starch retrogradation and texture of cooked milled rice during storage. J. Cereal Sci. 2009, 50, 139–144. [Google Scholar] [CrossRef]
  42. Liu, D.; Parker, M.L.; Wellner, N.; Kirby, A.R.; Cross, K.; Morris, V.J.; Cheng, F. Structural variability between starch granules in wild type and in ae high-amylose mutant maize kernels. Carbohydr. Polym. 2013, 97, 458–468. [Google Scholar] [CrossRef]
  43. Hamaker, B.R.; Griffin, V.K. Changing the viscoelastic properties of cooked rice through protein disruption. Cereal Chem. 1990, 67, 261–264. [Google Scholar]
  44. Robinson, T.; Nigam, P. Bioreactor design for protein enrichment of agricultural residues by solid state fermentation. Biochem. Eng. J. 2003, 13, 197–203. [Google Scholar] [CrossRef]
  45. Johri, B.N.; Satyanarayana, T.; Olsen, J. Thermophilic Moulds in Biotechnology; Springer Science & Business Media: Dordrecht, The Netherlands, 2013. [Google Scholar]
  46. Dobraszczyk, B.J.; Vincent, J.F. Measurement of mechanical properties of food materials in relation to texture: The materials approach. Food Texture Meas. Percept. 1999, 99–151. [Google Scholar]
  47. Pandey, A.; Selvakumar, P.; Soccol, C.R.; Nigam, P. Solid state fermentation for the production of industrial enzymes. Curr. Sci. 1999, 149–162. [Google Scholar]
  48. Zhao, S.; Xiong, S.; Zhang, S. Paste System on Rice Starch and Its Retrogradation Properties. Chin. Cereals Oils Assoc. 2001, 2. [Google Scholar]
  49. Berney, M.; Hammes, F.; Bosshard, F.; Weilenmann, H.-U.; Egli, T. Assessment and interpretation of bacterial viability by using the LIVE/DEAD BacLight Kit in combination with flow cytometry. Appl. Environ. Microbiol. 2007, 73, 3283–3290. [Google Scholar] [CrossRef] [PubMed] [Green Version]
  50. Leiro, J.; Cano, E.; Ubeira, F.M.; Orallo, F.; Sanmartín, M.L. In vitro effects of resveratrol on the viability and infectivity of the microsporidian Encephalitozoon cuniculi. Antimicrob. Agents Chemother. 2004, 48, 2497–2501. [Google Scholar] [CrossRef] [Green Version]
  51. Leiro, J.M.; Piazzon, C.; Domínguez, B.; Mallo, N.; Lamas, J. Evaluation of some physical and chemical treatments for inactivating microsporidian spores isolated from fish. Int. J. Food Microbiol. 2012, 156, 152–160. [Google Scholar] [CrossRef]
  52. Green, L.; LeBlanc, P.; Didier, E. Discrimination between viable and dead Encephalitozoon cuniculi (microsporidian) spores by dual staining with Sytox Green and Calcofluor White M2R. J. Clin. Microbiol. 2000, 38, 3811–3814. [Google Scholar] [CrossRef] [Green Version]
  53. Lopez-Amoros, R.; Comas, J.; Vives-Rego, J. Flow cytometric assessment of Escherichia coli and Salmonella typhimurium starvation-survival in seawater using rhodamine 123, propidium iodide, and oxonol. Appl. Environ. Microbiol. 1995, 61, 2521–2526. [Google Scholar] [CrossRef] [Green Version]
  54. López-Amorós, R.; Castel, S.; Comas-Riu, J.; Vives-Rego, J. Assessment of E. coli and Salmonella viability and starvation by confocal laser microscopy and flow cytometry using rhodamine 123, DiBAC4 (3), propidium iodide, and CTC. Cytom. J. Int. Soc. Anal. Cytol. 1997, 29, 298–305. [Google Scholar]
  55. Comas, J.; Vives-Rego, J. Assessment of the effects of gramicidin, formaldehyde, and surfactants on Escherichia coli by flow cytometry using nucleic acid and membrane potential dyes. Cytom. J. Int. Soc. Anal. Cytol. 1997, 29, 58–64. [Google Scholar]
  56. Vives-Rego, J.; Lebaron, P.; Nebe-von Caron, G. Current and future applications of flow cytometry in aquatic microbiology. Fems Microbiol. Rev. 2000, 24, 429–448. [Google Scholar] [CrossRef] [PubMed]
  57. Chitarra, L.G. Fluorescence Techniques to Detect and to Assess Viability of Plant Pathogenic Bacteria. Ph.D. Thesis, Wageningen University, Wageningen, The Netherlands, 2001; p. 101. [Google Scholar]
  58. Deligeorgiev, T.G.; Kaloyanova, S.; Vaquero, J.J. Intercalating cyanine dyes for nucleic acid detection. Recent Pat. Mater. Sci. 2009, 2, 1–26. [Google Scholar] [CrossRef]
  59. Mathys, A.; Chapman, B.; Bull, M.; Heinz, V.; Knorr, D. Flow cytometric assessment of Bacillus spore response to high pressure and heat. Innov. Food Sci. Emerg. Technol. 2007, 8, 519–527. [Google Scholar] [CrossRef]
  60. Jue, T. Fundamental Concepts in Biophysics; Springer (Humana Press): Totowa, NJ, USA, 2009; Volome 1. [Google Scholar]
  61. Baiera, D.; Mathysa, A.; Knorra, D. Identification of different physiological states of bacterial spores and distinction from vegetative cells after high pressure treatments via flow cytometry. In Proceedings of the 11th International congress on engineering and food, Athens, Greece, 22–26 May 2011; pp. 357–358. [Google Scholar]
  62. Alsharif, R.; Godfrey, W. Bacterial detection and live/dead discrimination by flow cytometry. Microb. Cytom. Appl. Note Bd Biosci. Immunocytometry Syst. 2002. [Google Scholar]
Figure 1. Photos of (a) raw and (b) autoclaved parboiled rice, (c) Bacillus pumilus grown on parboiled rice at 50% moisture content, (d) raw and (e) autoclaved millet, (f) Streptomyces griseus grown on millet at 50% moisture content.
Fermentation 06 00069 g001
Figure 2. Texture profile analysis of (a) raw and (b) autoclaved parboiled rice and millet with different moisture contents.
Fermentation 06 00069 g002
Figure 3. (a) Hardness and (b) stickiness levels of autoclaved parboiled rice and millet with different moisture contents (means and standard deviation were based on ten replicate tests).
Fermentation 06 00069 g003
Figure 4. SEM imaging of raw and autoclaved moist parboiled rice and millet.
Fermentation 06 00069 g004
Figure 5. Effect of moisture content and substrate type (parboiled rice or millet) on spore production of B. pumilus and S. griseus enumerated after 360 hours of incubation using (a) traditional plate count method, and (b) flow cytometry counting R3 events in particles/g-wet-substrate (107) on each sample. Note: (BR) B. pumilus inoculated on rice; (BM) B. pumilus inoculated on millet; (SR) S. griseus inoculated on rice; (SM) S. griseus inoculated on millet.
Fermentation 06 00069 g005
Figure 6. Representative fluorescein isothiocyanate (FITC) plots of particles without PI (a) and with PI stain (b).
Fermentation 06 00069 g006
Table 1. Young’s modulus of raw and autoclaved parboiled rice and millet at different moisture contents.
Parboiled Rice (kPa)Millets (kPa)
Raw421.2118.9
50% MC16.810.1
55% MC11.35.7
60% MC4.22.5
Table 2. Water activity of raw rice and millet and autoclaved rice and millet at different moisture contents.
Parboiled RiceMillets
Raw0.4010.435
50% MC0.9210.916
55% MC0.9560.962
60% MC0.9960.987

