Article

Robotic Cell Printing for Constructing Living Yeast Cell Microarrays in Microfluidic Chips

by
Charlotte Yvanoff
1,2,*,
Stefania Torino
1,3 and
Ronnie G. Willaert
1,2,4
1
Research Group Structural Biology Brussels, Vrije Universiteit Brussel, 1050 Brussels, Belgium
2
Alliance Research Group VUB-UGent NanoMicrobiology (NAMI), International Joint Research Group VUB-EPFL NanoBiotechnology & NanoMedicine (NANO), Vrije Universiteit Brussel, 1050 Brussels, Belgium
3
Center for Structural Biology, Vlaams Instituut voor Biotechnologie (VIB), 1050 Brussels, Belgium
4
Department Bioscience Engineering, University Antwerp, 2000 Antwerp, Belgium
*
Author to whom correspondence should be addressed.
Fermentation 2020, 6(1), 26; https://doi.org/10.3390/fermentation6010026
Submission received: 31 January 2020 / Accepted: 11 February 2020 / Published: 14 February 2020
(This article belongs to the Special Issue Yeast Biotechnology 3.0)

Abstract

:
Living cell microarrays in microfluidic chips allow the non-invasive multiplexed molecular analysis of single cells. Here, we developed a simple and affordable perfusion microfluidic chip containing a living yeast cell array composed of a population of cell variants (green fluorescent protein (GFP)-tagged Saccharomyces cerevisiae clones). We combined mechanical patterning in 102 microwells and robotic piezoelectric cell dispensing in the microwells to construct the cell arrays. Robotic yeast cell dispensing of a yeast collection from a multiwell plate to the microfluidic chip microwells was optimized. The developed microfluidic chip and procedure were validated by observing the growth of GFP-tagged yeast clones that are linked to the cell cycle by time-lapse fluorescence microscopy over a few generations. The developed microfluidic technology has the potential to be easily upscaled to a high-density cell array allowing us to perform dynamic proteomics and localizomics experiments.

1. Introduction

Cell assays have been miniaturized by growing cells in multiwell plates with increasing well number from 96 to 384 and 1536 wells and decreasing well volume from 280 µL down to 3 µL. These experiments are typically integrated in a robotic analysis platform. Major drawbacks of robotic platforms are the expense of the instrumentation, the cost of experimental consumables, closed systems (batch growth), and still relative medium throughput compared to recently developed microfluidic chips. As cell collections grow, further miniaturization of cell assays is needed to increase parallelism of the analyses. Cell microarrays provide an attractive solution, as they could increase the throughput significantly [1,2,3]. A cellular microarray consists of a solid support wherein small volumes of different biomolecules and cells can be displayed in defined locations, allowing the multiplexed interrogation of living cells and the analysis of cellular responses [4,5]. Living cell microarrays have been combined with microfluidic bioreactors, which provide multiple advantages for multiplex dynamic analyses and high-throughput screening [4,6]. Cellular arrays are emerging as important tools for functional genomics, drug discovery, toxicology, and stem cell research [4,7,8]. A major advantage of cell microarrays over microtiter plates is the opportunity to measure parameters on hundreds of individual single cells and average them, instead of measuring the parameters of a whole cell population. An interesting application where living yeast cell arrays are used is “dynamic proteomics” in which living cell microarrays using a fluorescent protein (e.g. GFP)-tagged yeast clone collection and automated time-lapse microscopy is used for the rapid acquisition of in vivo quantitative data about the dynamic proteome and protein subcellular localization (“localizomics”). This enables the identification of members of protein complexes and coregulated proteins, and the unravelling of signaling pathways such as exposure to stress compounds, antimicrobials, or mating conditions [9,10,11,12,13].
Mechanical cell patterning, where mechanical barriers capture the cells at specified spots, has been frequently used to create cellular microarrays [14] in microfluidic chips. Yeast cells have been mechanically patterned in (single-cell) microwells [15,16], microchambers [17,18], and mechanical trap barriers [19,20,21]. As for the creation of classical DNA microarrays, a fluid-dispensing device can be used to spot or “print” living cells in an array format [4]. Dispensing techniques are categorized as contact and non-contact dispensing [22,23]. Robotic contact printing (e.g. printing DNA microarrays) was initially used to print cells on a semi-solid agar growth medium [24]. Today, mostly non-contact-based devices are used to produce living cellular arrays [25,26,27,28]. Here, the fluid is ejected as a flying droplet or jet toward the surface from a short distance. One concept of non-contact printing is based on syringe–solenoid-driven printers, where a reservoir and a high-speed microsolenoid valve are connected to a high-resolution syringe [29,30]. Typically, droplet volumes of 10 to 20 nanoliter are the lower dispensing limit. Another concept is piezoelectrical dispensing, where a technology similar to the one used in an ink-jet printer is used [31,32]. A piezo actuator is fixed around a glass capillary close to the end of the tip. The squeezing of the capillary forced by the piezo actuation induces droplet ejection out of the capillary. The fast response time of the piezoelectric crystal permits fast dispensing rates (kHz range), and the small deflection of the crystal generates droplets from tens of picoliters to a few nanoliters. Robotic cell printing can be used to easily create a living cell microarray composed of a clone collection and at a positional xy accuracy of a few micrometer.
Here, we developed a perfusion microfluidic chip containing a living GFP-clone collection that can be used to perform dynamic proteomics and localizomics experiments and demonstrate its performance. We combined mechanical patterning and robotic cell printing to produce living cell arrays. Soft lithography was used to create a 102-microwell array in the epoxy resin SU-8 (Structured by UV-8) on top of a glass coverslip substrate. A commercial microchannel top plate was used to close the microfluidic chip. Piezo dispensing was optimized for the development of living yeast cell arrays in microfluidic chips. We demonstrated that a clone collection can successfully be printed into the microwell array and yeast cells can be grown in the microwells in continuous mode. Finally, time-lapse fluorescence imaging was performed using 6 selected GFP-tagged clones demonstrating that the approach is suitable to perform dynamic analyses of protein expression and protein localization in living cells.

2. Materials and Methods

2.1. Yeast Strain and Media

Clones from the S. cerevisiae Yeast GFP Clone Collection (ThermoFisher Scientific, Waltham, MA, USA) were used [33]. We selected 34 clones linked to the cell cycle (Table S1) and revived them from the cryo-stock on YPD-agar plates (yeast extract 10 g/L, peptone 20 g/L, dextrose 20 g/L, agar 15 g/L). Single colonies were then transferred to liquid cultures in Synthetic Complete (SC) medium supplemented with 2% (m/v) glucose. The yeast cells were grown overnight in a shaking incubator at 170 rpm and 30 °C. Prior to cell printing, the cultures were diluted in Phosphate Buffered Saline (PBS) to an optical density at 600 nm (OD600) of 0.5.

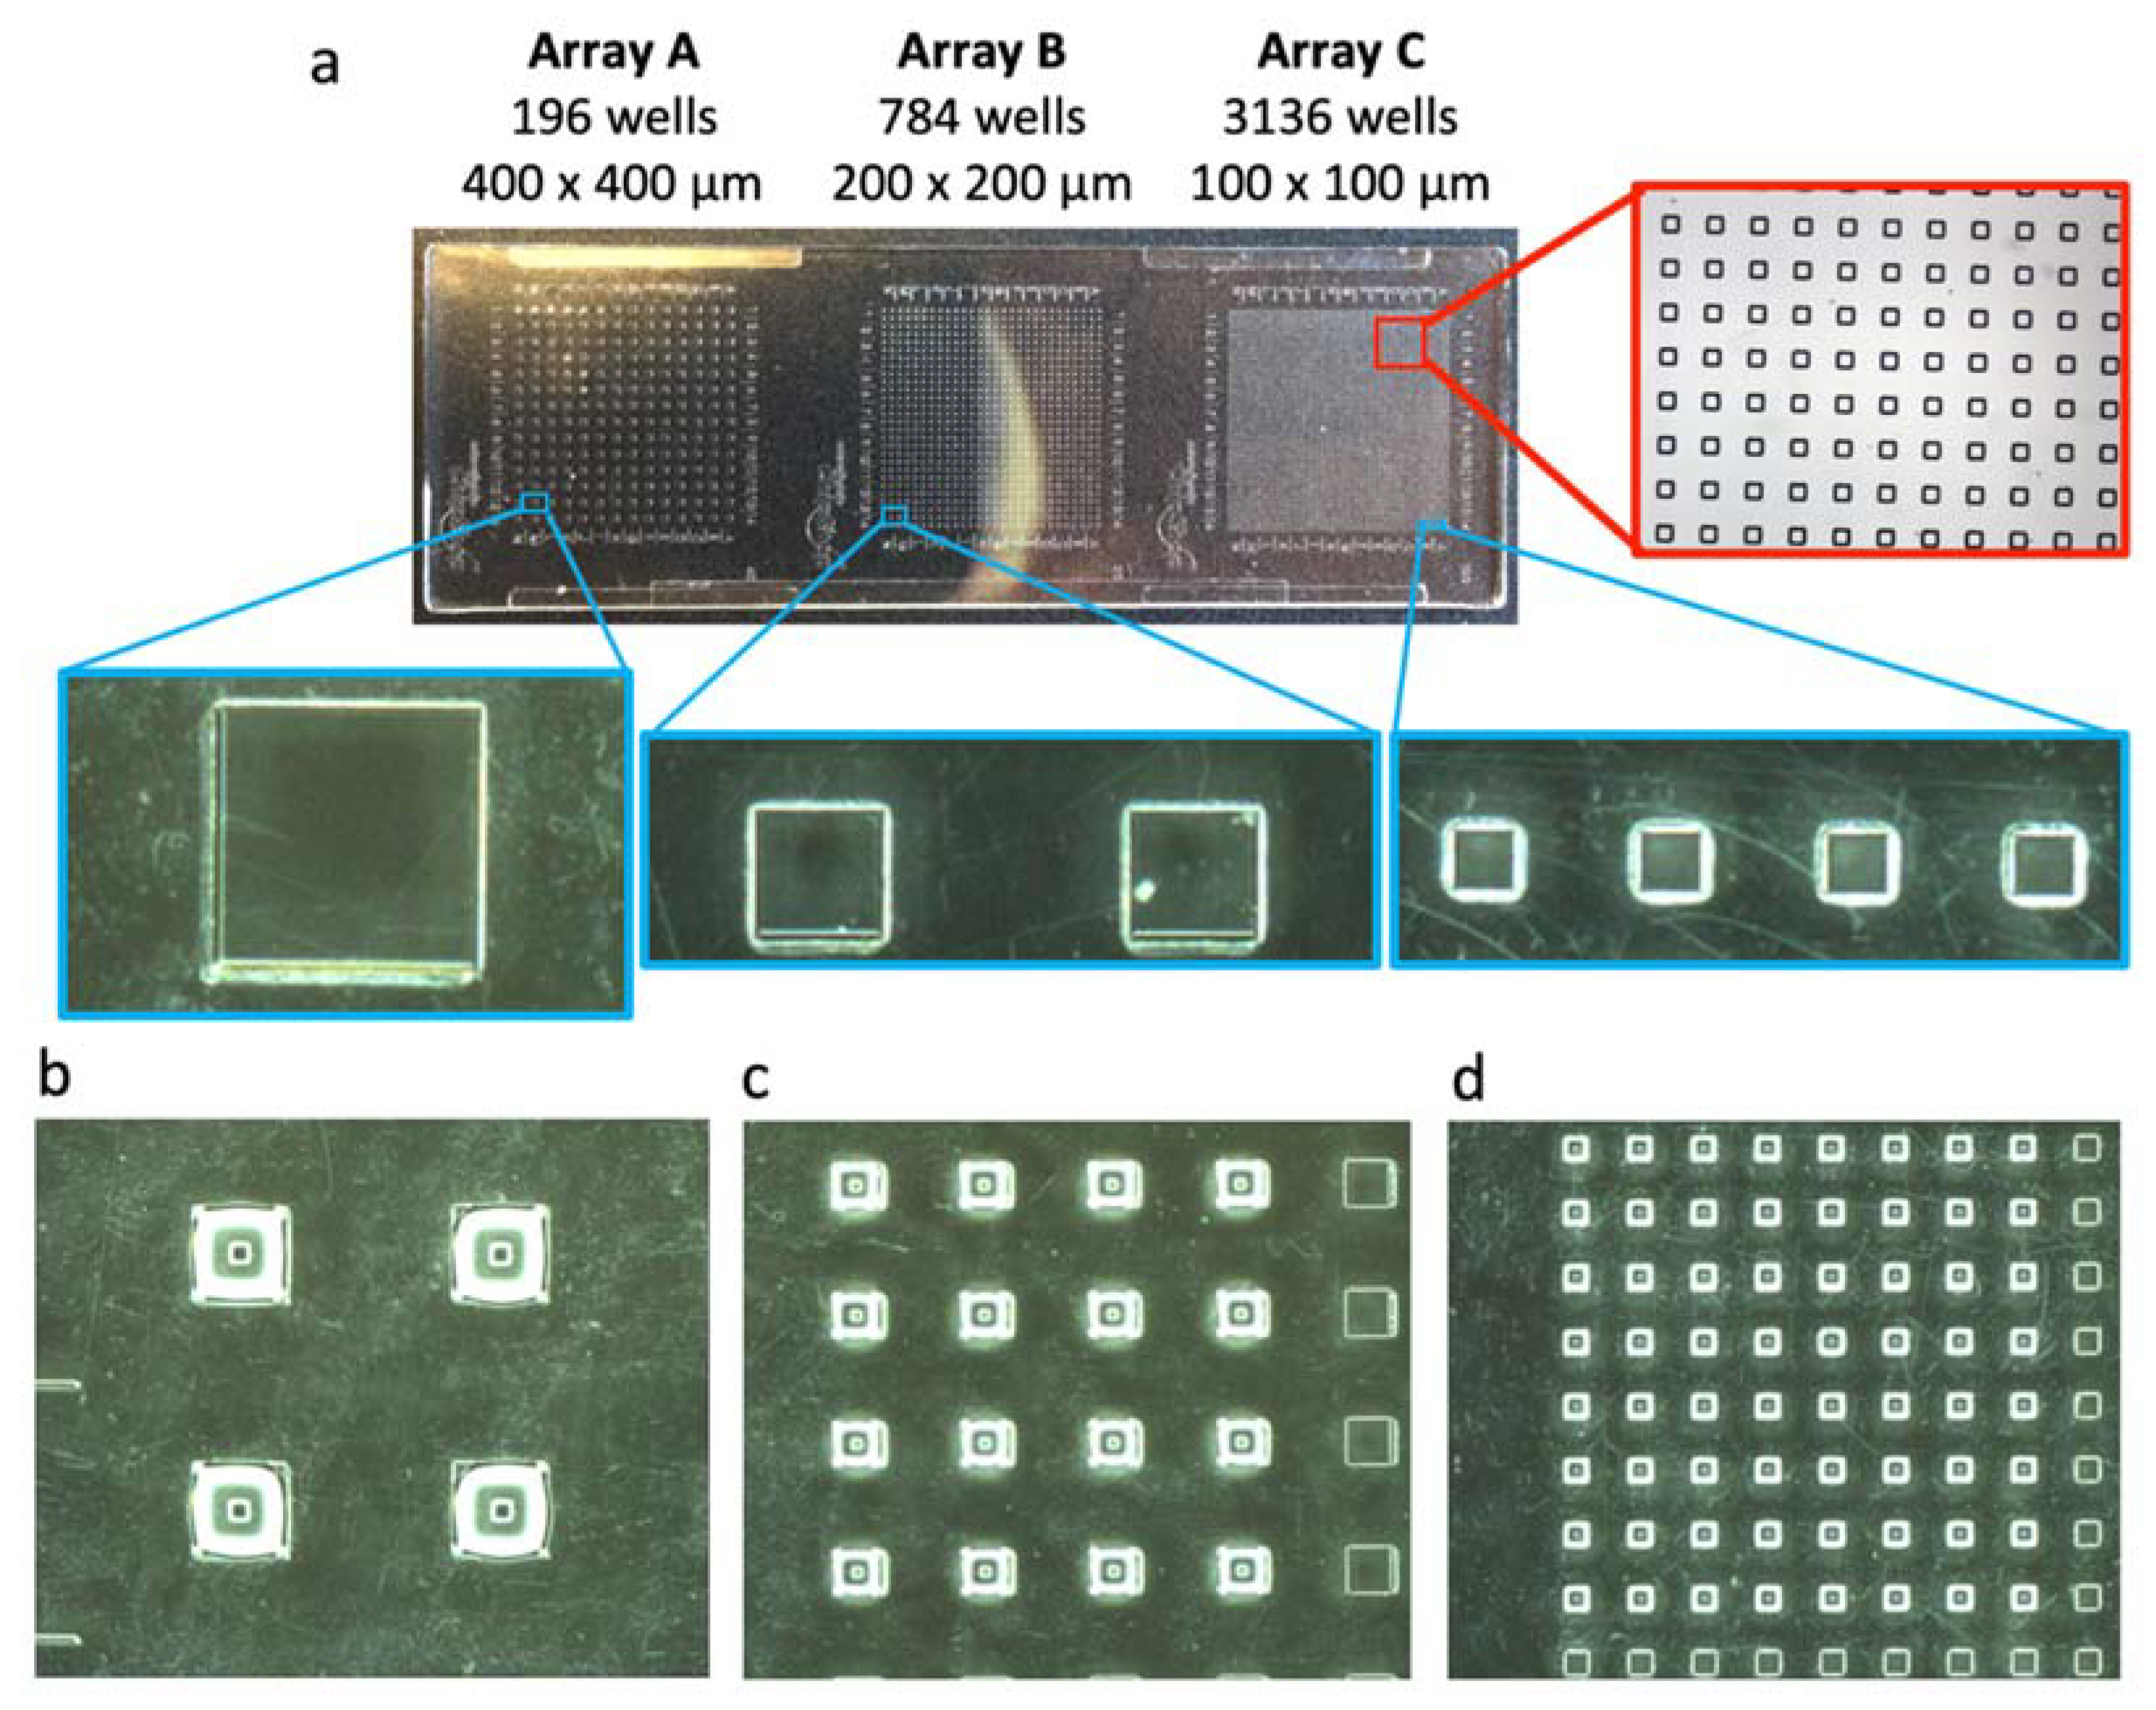
2.2. Fabrication of the Microwell Substrate and the Microfluidic Chip

The microfluidic chip consists of two parts: a bottom glass slide with SU-8 microwells and a top plate containing a microfluidic channel with in- and outlet ports (Figure 1). The microwell substrate was produced in-house whereas the top plate was obtained commercially (sticky-Slide I 0.4 Luer, Ibidi, Gräfelfing, Germany). Microwells were fabricated by SU-8 photolithography on glass coverslips. Glass coverslips (75 × 25 mm, thickness of 170 µm; Ibidi, Gräfelfing, Germany) were cleaned in acetone (Carl Roth, Karlsruhe, Germany) and 2-propanol (Carl Roth, Karlsruhe, Germany) for 15 minutes each, then rinsed with ultrapure water and finally blow-dried. The glass slides were then exposed to air plasma at 100 W, 50 kHz, for 5 minutes (Plasma System Cute, Femto Science, Dongtangiheung-Ro, Korea). The negative photoresist SU-8 2050 (Kayaku Advanced Materials, Westborough, MA, USA) was spin-coated onto the glass slides at 3500 rpm for 30 seconds in order to reach an approximative thickness of 50 µm. Next, the SU-8 was soft-baked for six minutes at 95 °C on a hot plate. The SU-8 slides were then aligned with the photomask (film photomask, Selba, Versoix, Switzerland) in the mask aligner UV-KUB3 (Kloé, Saint-Mathieu-de-Tréviers, France) and illuminated with 365 nm ultraviolet (UV) light (intensity of 35 mW/cm2) for 10 seconds. Following UV exposure, the SU-8 slides were post-baked for six minutes at 95 °C on a hot plate. Finally, the slides were treated with SU-8 developer for seven minutes and next washed with 2-propanol and blow-dried. The dimensions of the wells were then evaluated by optical microscopy (Nikon Eclipse Ti2, Nikon, Tokyo, Japan) with a 10x objective (for the diameter and pitch distance) and with a 3D profilometer (Profilm 3D, Filmetrics, San Diego, CA, USA) for the well’s depth. The microfluidic chip was assembled by pressing the sticky top plate (sticky-Slide I 0.4 Luer, Ibidi, Gräfelfing, Germany) to the microwell substrate.

2.3. Cell Printing

Cell printing was performed using a non-contact iTWO-400 dispenser (M2 Automation, Berlin, Germany) (Figure S2a). The printer is established in an environmental enclosure for live cell printing that contains a HEPA filter and recirculating air is sterilized with a UV lamp. The environmental temperature can be controlled as well as the relative humidity. Moreover, the instrument deck contains a cooling system for source plates and target plates with dew point control, which prevents evaporation during spotting. Samples to be printed are manually dispensed in 384-multiwell plates (ShallowWell 384-multiwell plate, Thermo Fischer Scientific, Waltham, MA, USA), which are then mounted onto the “source plate” locations of the robot (Figure S2a). Likewise, the substrate to be printed is mounted onto the “target plate” locations of the robot (Figure S2a). The actual printing is performed with a piezo dispenser made of a borosilicate glass capillary surrounded by a piezo ceramic actuator (PDMD, M2 automation, Berlin, Germany), which is able to shoot pico- to nanoliter droplets at high frequency with high volume and position accuracies. Finally, the instrument deck is also equipped with a wash station, which enables to clean the tip of the piezo dispenser after sample aspiration and sample printing, in order to avoid cross-contamination. A typical printing run consists in aspirating the sample to be printed from the “source plate”, washing the outside of the tip to get rid of contaminants that could impair the shooting, shooting the sample at its desired position on the “target plate” and finally dispensing the remaining sample at the washing station and washing the outside of the tip so that it is cleaned for the next sample. Each step of this procedure can be specified in the software controlling the robot. Additionally, the robot is equipped with a camera annexed to the piezo dispenser, which enables us to verify the successful printing of the samples.
Ultrapure water was printed with a pulse duration of 15 µs and an amplitude voltage of 75 V. The environmental temperature was around 28 °C, the relative humidity was controlled at 50% and the temperature of the target plate was at 15 °C. These parameters were maintained throughout each of the cell printing experiments. For optimization purposes, ultrapure water was printed on standard glass coverslips (24 × 24 × 0.17 mm) and in microwells of commercial nanotiter plates (Microfluidic ChipShop, Jena, Germany) made of the cyclo-olefin copolymer material Topas.
Prior to cell printing, the SU-8 microwells were coated with a solution of concanavalin A (Con A) (Con A from Canavalia ensiformis, Sigma Aldrich, Overijse, Belgium) at 2 mg/mL in H2O, with 5 mM CaCl2 and 5 mM MnSO4. Sixty drops of Con A were printed per well with the parameters mentioned above and were left to incubate for 15 minutes before being allowed to dry.
Yeast suspensions were prepared at an OD600 of 0.5 in PBS and 40 droplets were printed into each well with the parameters mentioned above. Multiple yeast suspensions were successively printed in different wells of the microfluidic chip. Therefore, the piezo dispenser was thoroughly washed between each sample to avoid cross-contamination. The washing procedure consisted in first discarding the old sample by ejecting 30 µL of liquid at a flow rate of 30 µL/s using the syringe pump and next, flushing the outside of the piezo dispenser with ultrapure water for five seconds at the wash station. The yeast cells were left to sediment for 10 minutes. The microfluidic chip was closed and connected to a syringe filled with SC medium via silicone tubing. SC medium was gently perfused into the channel of the microfluidic chip with a syringe pump (KD Scientific, Holliston, MA, USA) at a flow rate of 25 µL/min. Finally, the complete set-up (microfluidic chip and syringe pump) was installed on a microscope for direct imaging or kept at 4 °C overnight to image the next day.

2.4. Microscopy

The microfluidic chip and syringe pump set-up were installed on a Nikon Eclipse Ti2 epifluorescence microscope (Nikon, Tokyo, Japan) for time-lapse imaging. The microfluidic chip was inserted into a temperature-controlled chamber (Ibidi, Gräfelfing, Germany), which was mounted onto an automated scanning stage (ProScan III, Prior Scientific Instruments, Cambridge, United Kingdom). The syringe pump was placed next to the microscope and the syringe was covered with a syringe heater (New Era Pump Systems, Farmingdale, NY, USA). Both the temperature controller and the syringe heater were set at 30 °C for the duration of the time-lapse experiments.
For the growth experiment with 34 clones, bright field images of yeasts were acquired every 20 minutes, for 18 hours with a 20x objective. At the final time point (18 h), the yeasts were also imaged with a 60x objective in bright field and fluorescence. The GFP fluorescence was observed by exciting the sample with a LED light source (pE-300white, CoolLED, Andover, United Kingdom) and detecting it through a FITC filter. For the growth experiment with six clones, the yeasts were imaged in bright field and fluorescence and images were recorded every 30 minutes for three hours using a 60x objective.

2.5. Image Processing

Images acquired by the camera of the iTWO-400 dispenser were post-processed using Fiji [34]. More precisely, they were stitched together to form the pictures shown in Figure 2, Figure 3, and Figure 4 using the “Grid/Collection Stitching” plugin [35]. The bright field and GFP-fluorescent pictures were also processed with Fiji for background correction and manual stack alignment.

3. Results

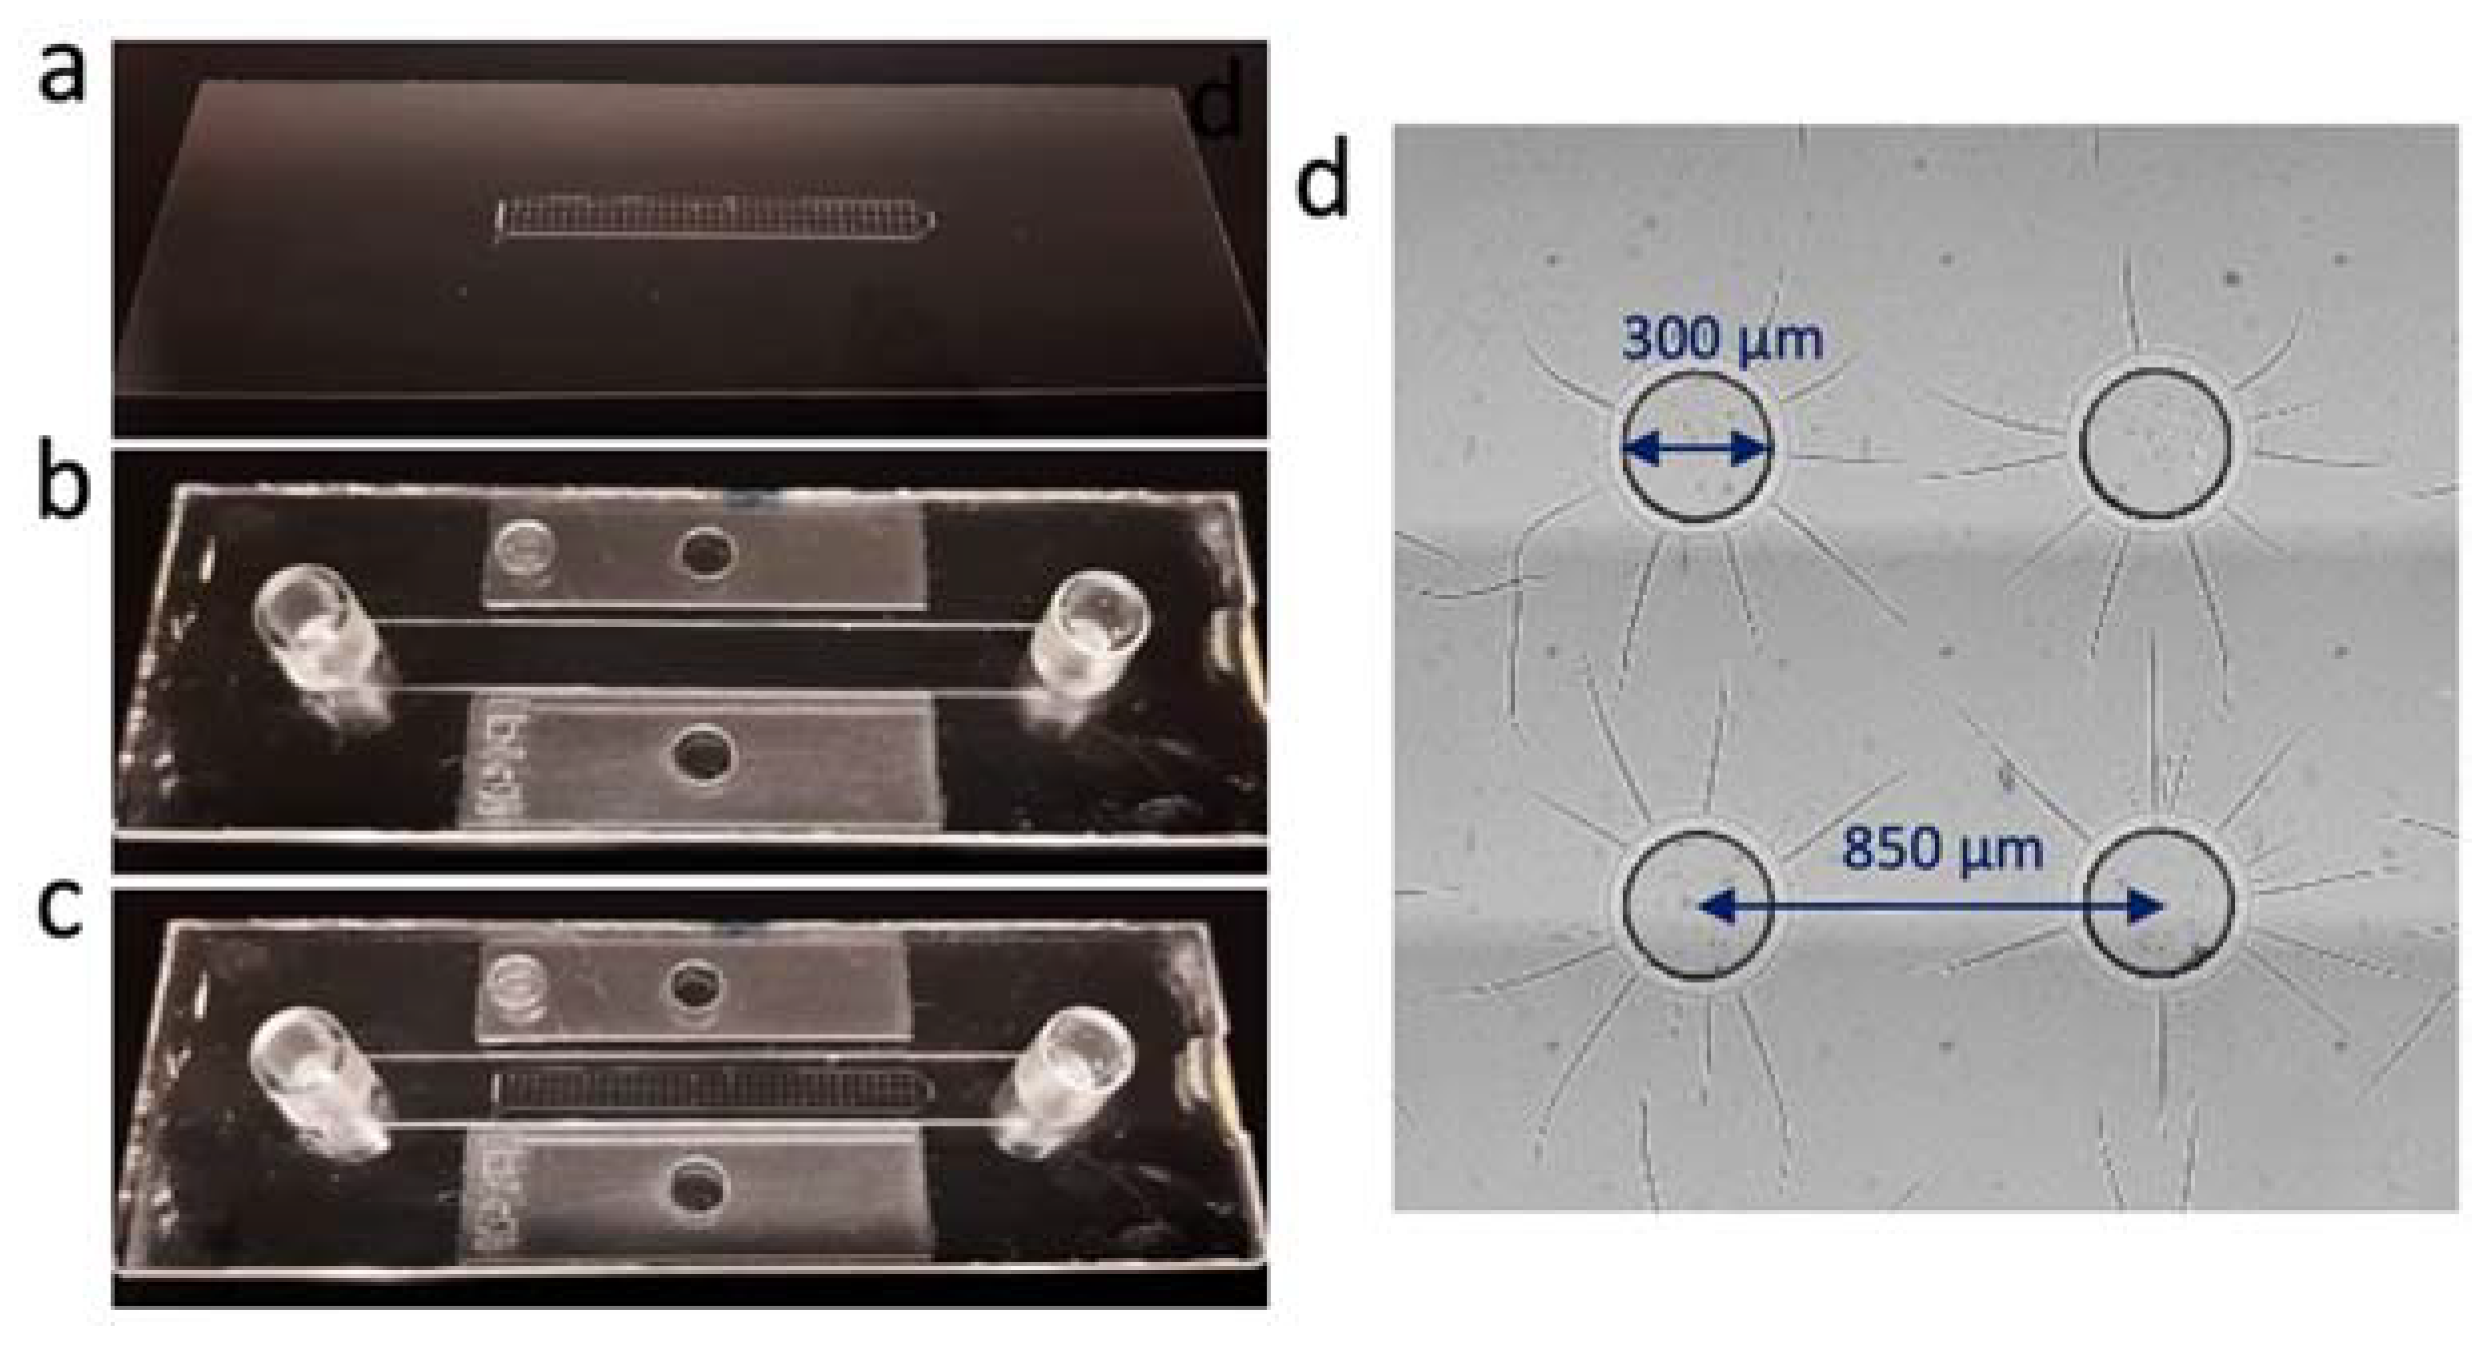
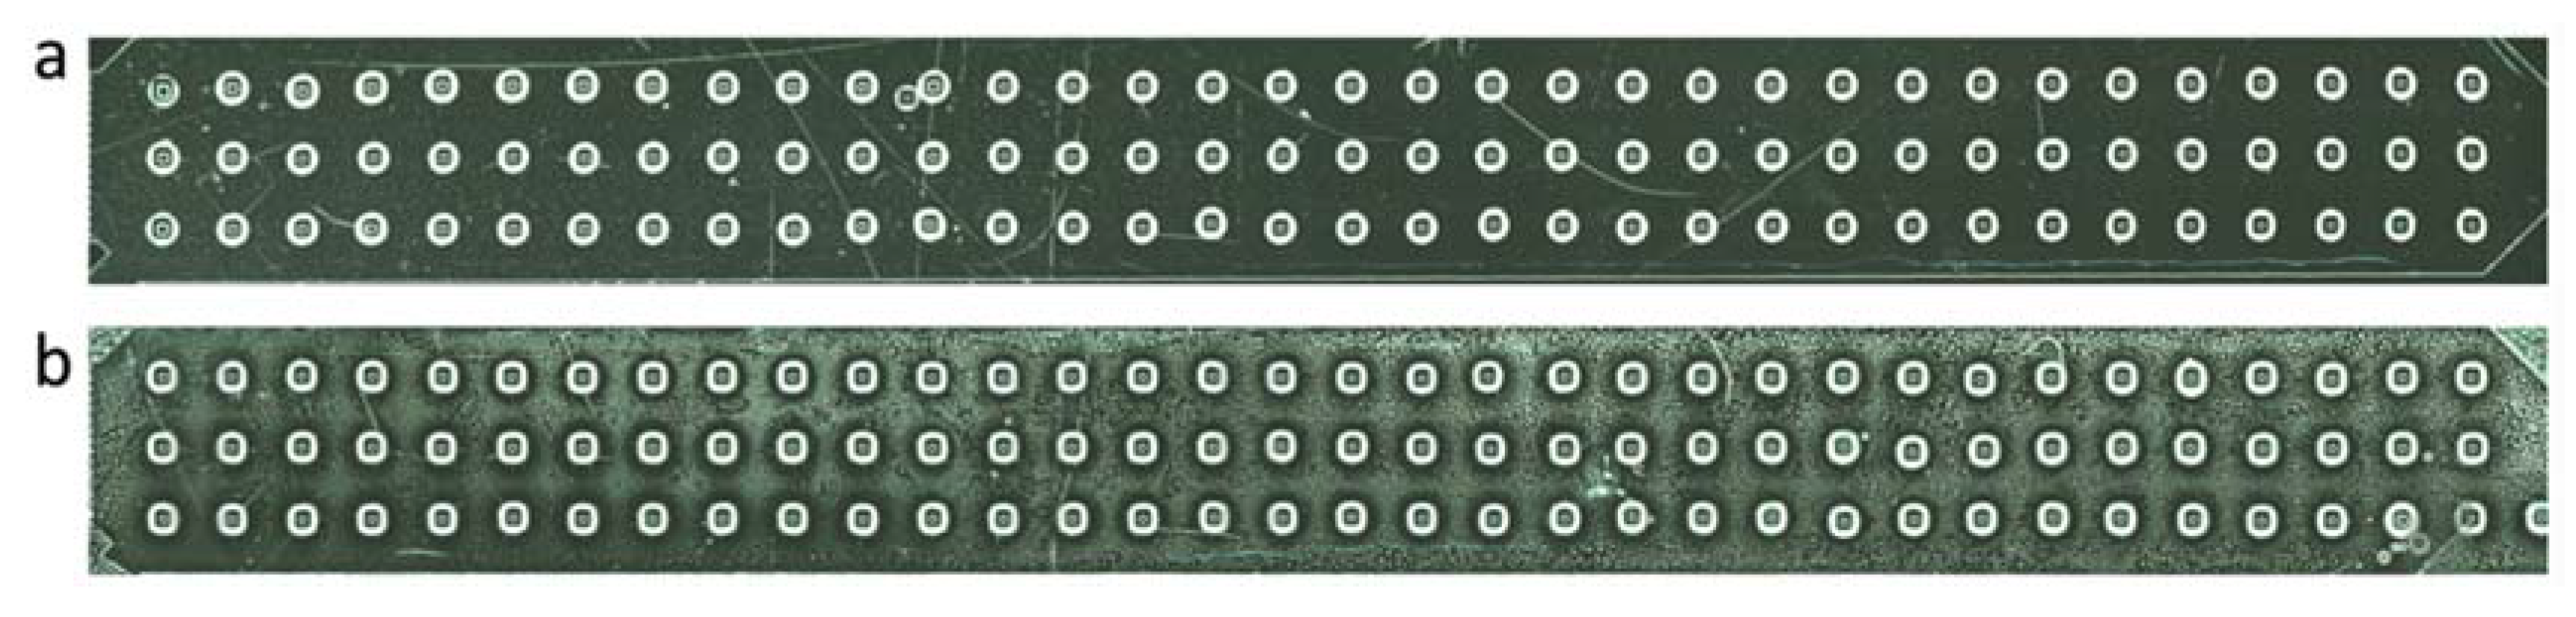
3.1. Construction of the Microfluidic Chip

The microfluidic chip (Figure 1c) was made of two parts: the microwell array on a glass slide (Figure 1a) and the top plate with a microfluidic channel (Figure 1b). The microwell array was produced in the epoxy-based photoresist SU-8 through a standard photolithography protocol. The mask design of the microwell array consisted of three rows of 34 wells with a well diameter of 300 µm and a pitch distance of 850 µm (Figure S1). Visual inspection of the microwells after photolithography showed that the SU-8 wells matched the mask’s dimensions (Figure 1d). Furthermore, the measured well’s depth was approximatively 50 µm (Figure S1b), which fits the expected thickness of the SU-8 layer, according to the protocol mentioned earlier. Altogether, these results prove the photolithography process to be successful and a quick method to produce the microwells in the microfluidic chip.
The overall length and thickness of the microwell array were 28.4 mm and 2.0 mm, respectively. These dimensions fit within the microfluidic channel of the top plate that was used to seal the microfluidic chip and connect the inlet and outlet tubes. The top plate was commercially available and consisted of a channel of 50 × 5 × 0.4 mm (l × w × h) surrounded by a double-sided tape, which enabled us to quickly and easily stick it onto the bottom substrate. Once the microfluidic chip was sealed (after filling with the cells), it was connected to silicone tubing and a syringe filled with SC growth medium. The medium was then perfused at a very low flow rate (25 µL/min) with a syringe pump in order to ensure nutrient renewal for cell growth.

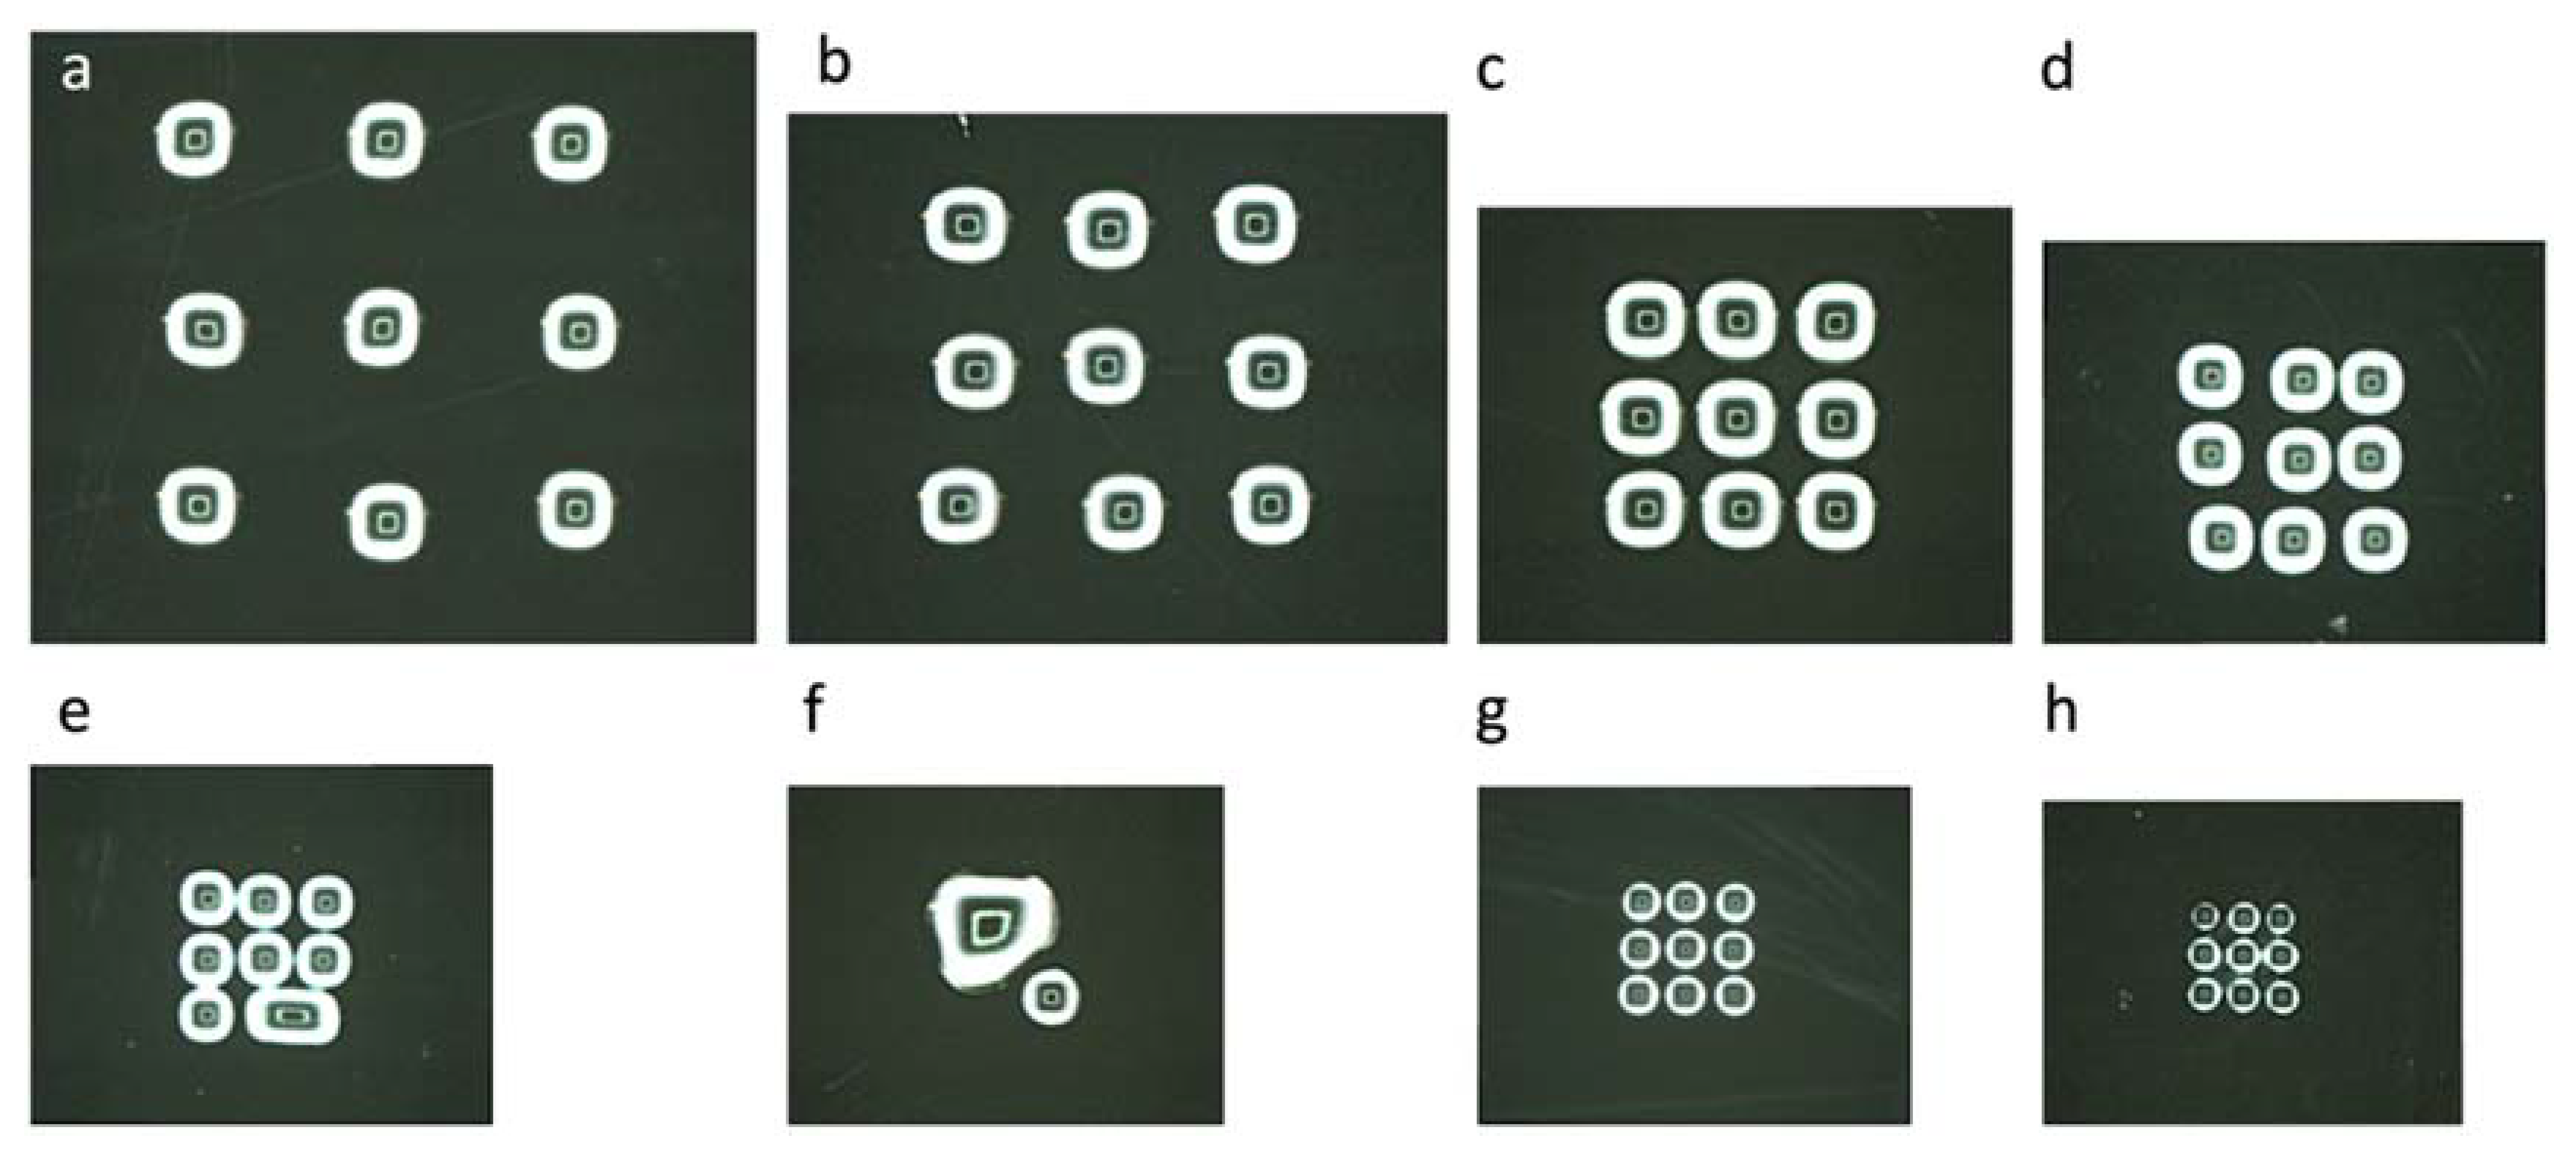
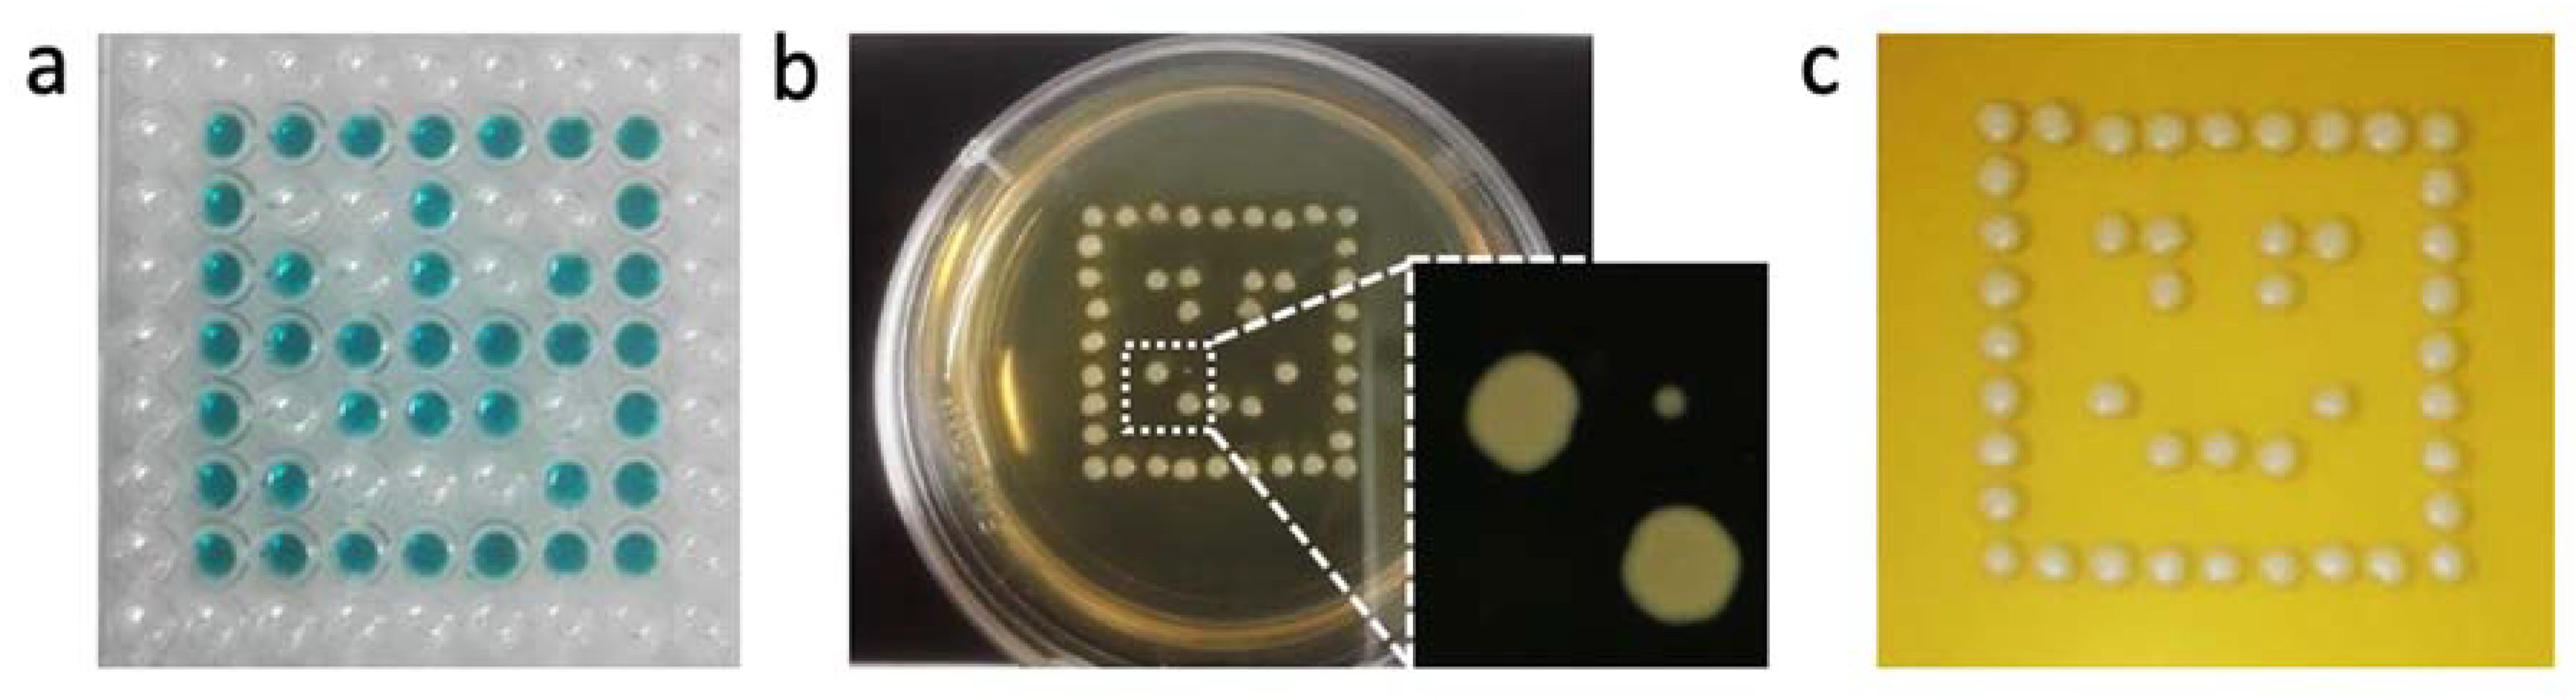
3.2. Living-Cell Microarray Development

First, piezo dispensing parameters were optimized by printing a water droplet array on a glass substrate. Piezo dispensing is accomplished by applying rectangular voltage pulses to the piezo ceramic actuator (Figure S2c). For the duration of each pulse, the actuator tube contracts a few micrometers, thereby initiating a pressure wave that causes the ejection of a droplet. The amplitude and the duration of the pulse influence the volume and the velocity of the droplet. The higher the amplitude (applied voltage) and the longer the pulse, the bigger the droplet and the higher its velocity. The frequency of the pulses is directly correlated to the duration of the pulse and also influences the droplet’s volume. Finally, the viscosity of the sample to dispense also has an influence on the printing parameters. Therefore, piezo dispensing needs to be optimized for each solution that has to be printed. In this work, yeast suspensions were prepared in PBS prior to printing.
Considering that PBS solution and ultrapure water have similar viscosities; we first optimized the piezo dispensing parameters with ultrapure water for simplicity reason. Typically, we started by determining the amplitude and duration of the voltage pulses that were giving a reliable ejection of water droplets. We obtained a stable shooting of ultrapure water with an amplitude of 75 V and a pulse duration of 15 µs. These parameters resulted in a droplet volume ranging between 70 to 80 pL (Figure S2b). Next, we created 3 × 3 arrays of water droplets with decreasing pitch distance on a glass substrate (Figure 2). We started by shooting 100 drops/spot at 50 Hz with a pitch distance of 1000 µm, 750 µm and 500 µm. We could not print arrays with pitch distances lower than 500 µm without merging of neighboring spots. Hence, we reduced the droplet number and printed 50 drops/spot at 25 Hz with a decreasing pitch distance from 400 to 300 and 250 µm. Surprisingly, printing half the droplet number did not allow halving the pitch distance as expected. Additional testing established that five drops/spot at 4 Hz with a pitch distance of 200 µm were the limit parameters at which a 3 × 3 array of water droplets could be stably printed on a glass slide. This optimization process aimed at determining the minimal spot sizes and pitch distances that can be stably printed in order to increase the throughput of the platform.
Secondly, we evaluated the filling of microwells with water droplets using piezo dispensing. Therefore, we initially used a commercially available microtiter plate (size of a microscope slide) that contains squared microwells with dimensions of 400 × 400 µm (array A), 200 × 200 µm (array B), 100 × 100 µm (array C), and height of 20 µm (Figure 3). The pulse duration (15 µs) and amplitude voltage (75 V) were as for printing on the glass substrate. With a frequency of 50 Hz, the number of droplets decreased from 200 drops per well for array A to 25 drops per well for array B and five drops per well for array C.
Once the piezo-dispensing parameters were established with ultrapure water, the printing protocol was optimized for living cells. First, the microwells were filled with 60 droplets of Con A at a pulse duration of 15 µs, amplitude voltage of 75 V and frequency of 50 Hz (Figure 4a). Con A is a lectin, which binds to the mannose glycans at the yeast cell wall [36]. Hence, Con A was used as a coating, which anchored the yeast cells to the bottom of the microwells so that they were not flushed away when SC medium was perfused during continuous cultivation. Next, the density of printed yeast cells per well was optimized. The final objective of this study consisted in developing a method that allowed monitoring the growth of single yeast cells as well as their expression of GFP-tagged proteins by time-lapse fluorescence microscopy. Therefore, the printing process had to deliver only a few cells per well. To do so, two parameters were adapted: the cell density of the yeast suspensions to print and the number of droplets/well. The latter was evaluated first and 40 drops/well provided optimal filling of the microwell without overflowing (Figure 4b). Since this parameter was kept constant for all the living cell experiments, the cell density of the yeast suspensions was then optimized. Yeasts suspensions at OD600 of 0.8, 0.5, and 0.2 were tested (Figure S2d). The suspension at an OD600 of 0.8 proved difficult to print since this high cell concentration increased the viscosity of the sample, thereby preventing the droplet ejection. On the other hand, cell suspensions at an OD600 of 0.2 were possible to shoot but did not deliver yeast cells in every well. The suspension at an OD600 of 0.5 was then selected, as it could be reproducibly printed and guaranteed the presence of a significant number of single cells per well. All the yeast printing experiments were performed with the following optimized parameters: pulse duration of 15 µs, amplitude voltage of 75 V, and a frequency of 50 Hz.
Finally, since the objective was to print multiple clones from the GFP-tagged yeast collection in different wells of the microfluidic chip, a last printing procedure had to be optimized, namely the washing step between samples in order to avoid cross-contamination. The washing step includes the disposal of the printed sample followed by the cleaning of the outside of the piezo dispenser capillary. Discarding the sample can be done either by applying pressure to the liquid path of the robot or by ejecting it with a syringe pump. Indeed, the iTWO-400 robot is equipped with both a pressure unit and a syringe pump, which enable to flow liquid through the piezo dispenser on a passive or active basis, respectively. With the pressure unit, the liquid continuously flows at a fixed fluid flow rate for as long as the pressure is applied. With the syringe pump, a specified volume of liquid flows at a specified flow rate. Cleaning the outside of the piezo dispenser is performed at the washing station of the robot (Figure S2a), and only the washing time can be adapted. To evaluate the efficiency of the washing step on avoiding cross-contamination, wells from a 384-multiwell plate (MTP) were filled with both a yeast suspension in PBS (at OD600 of 0.5) and a colored ink according to a designed pattern (Figure 5a). The samples were then printed on solid agar medium in a petri dish and left to grow at 30 °C for 24 hours before evaluation. In the first experiment, the printed samples were discarded by means of pressure (at 450 mbar) for 10 seconds, and the outside of the piezo dispenser was cleaned for five seconds. Although most of the design was correctly printed, one cross-contaminated spot was visible (Figure 5b). The experiment was then repeated; however, the samples were discarded in the wash station by means of the syringe pump. The cleaning of the piezo dispenser was kept at five seconds. Using this procedure, no cross-contamination was observed (Figure 5c).

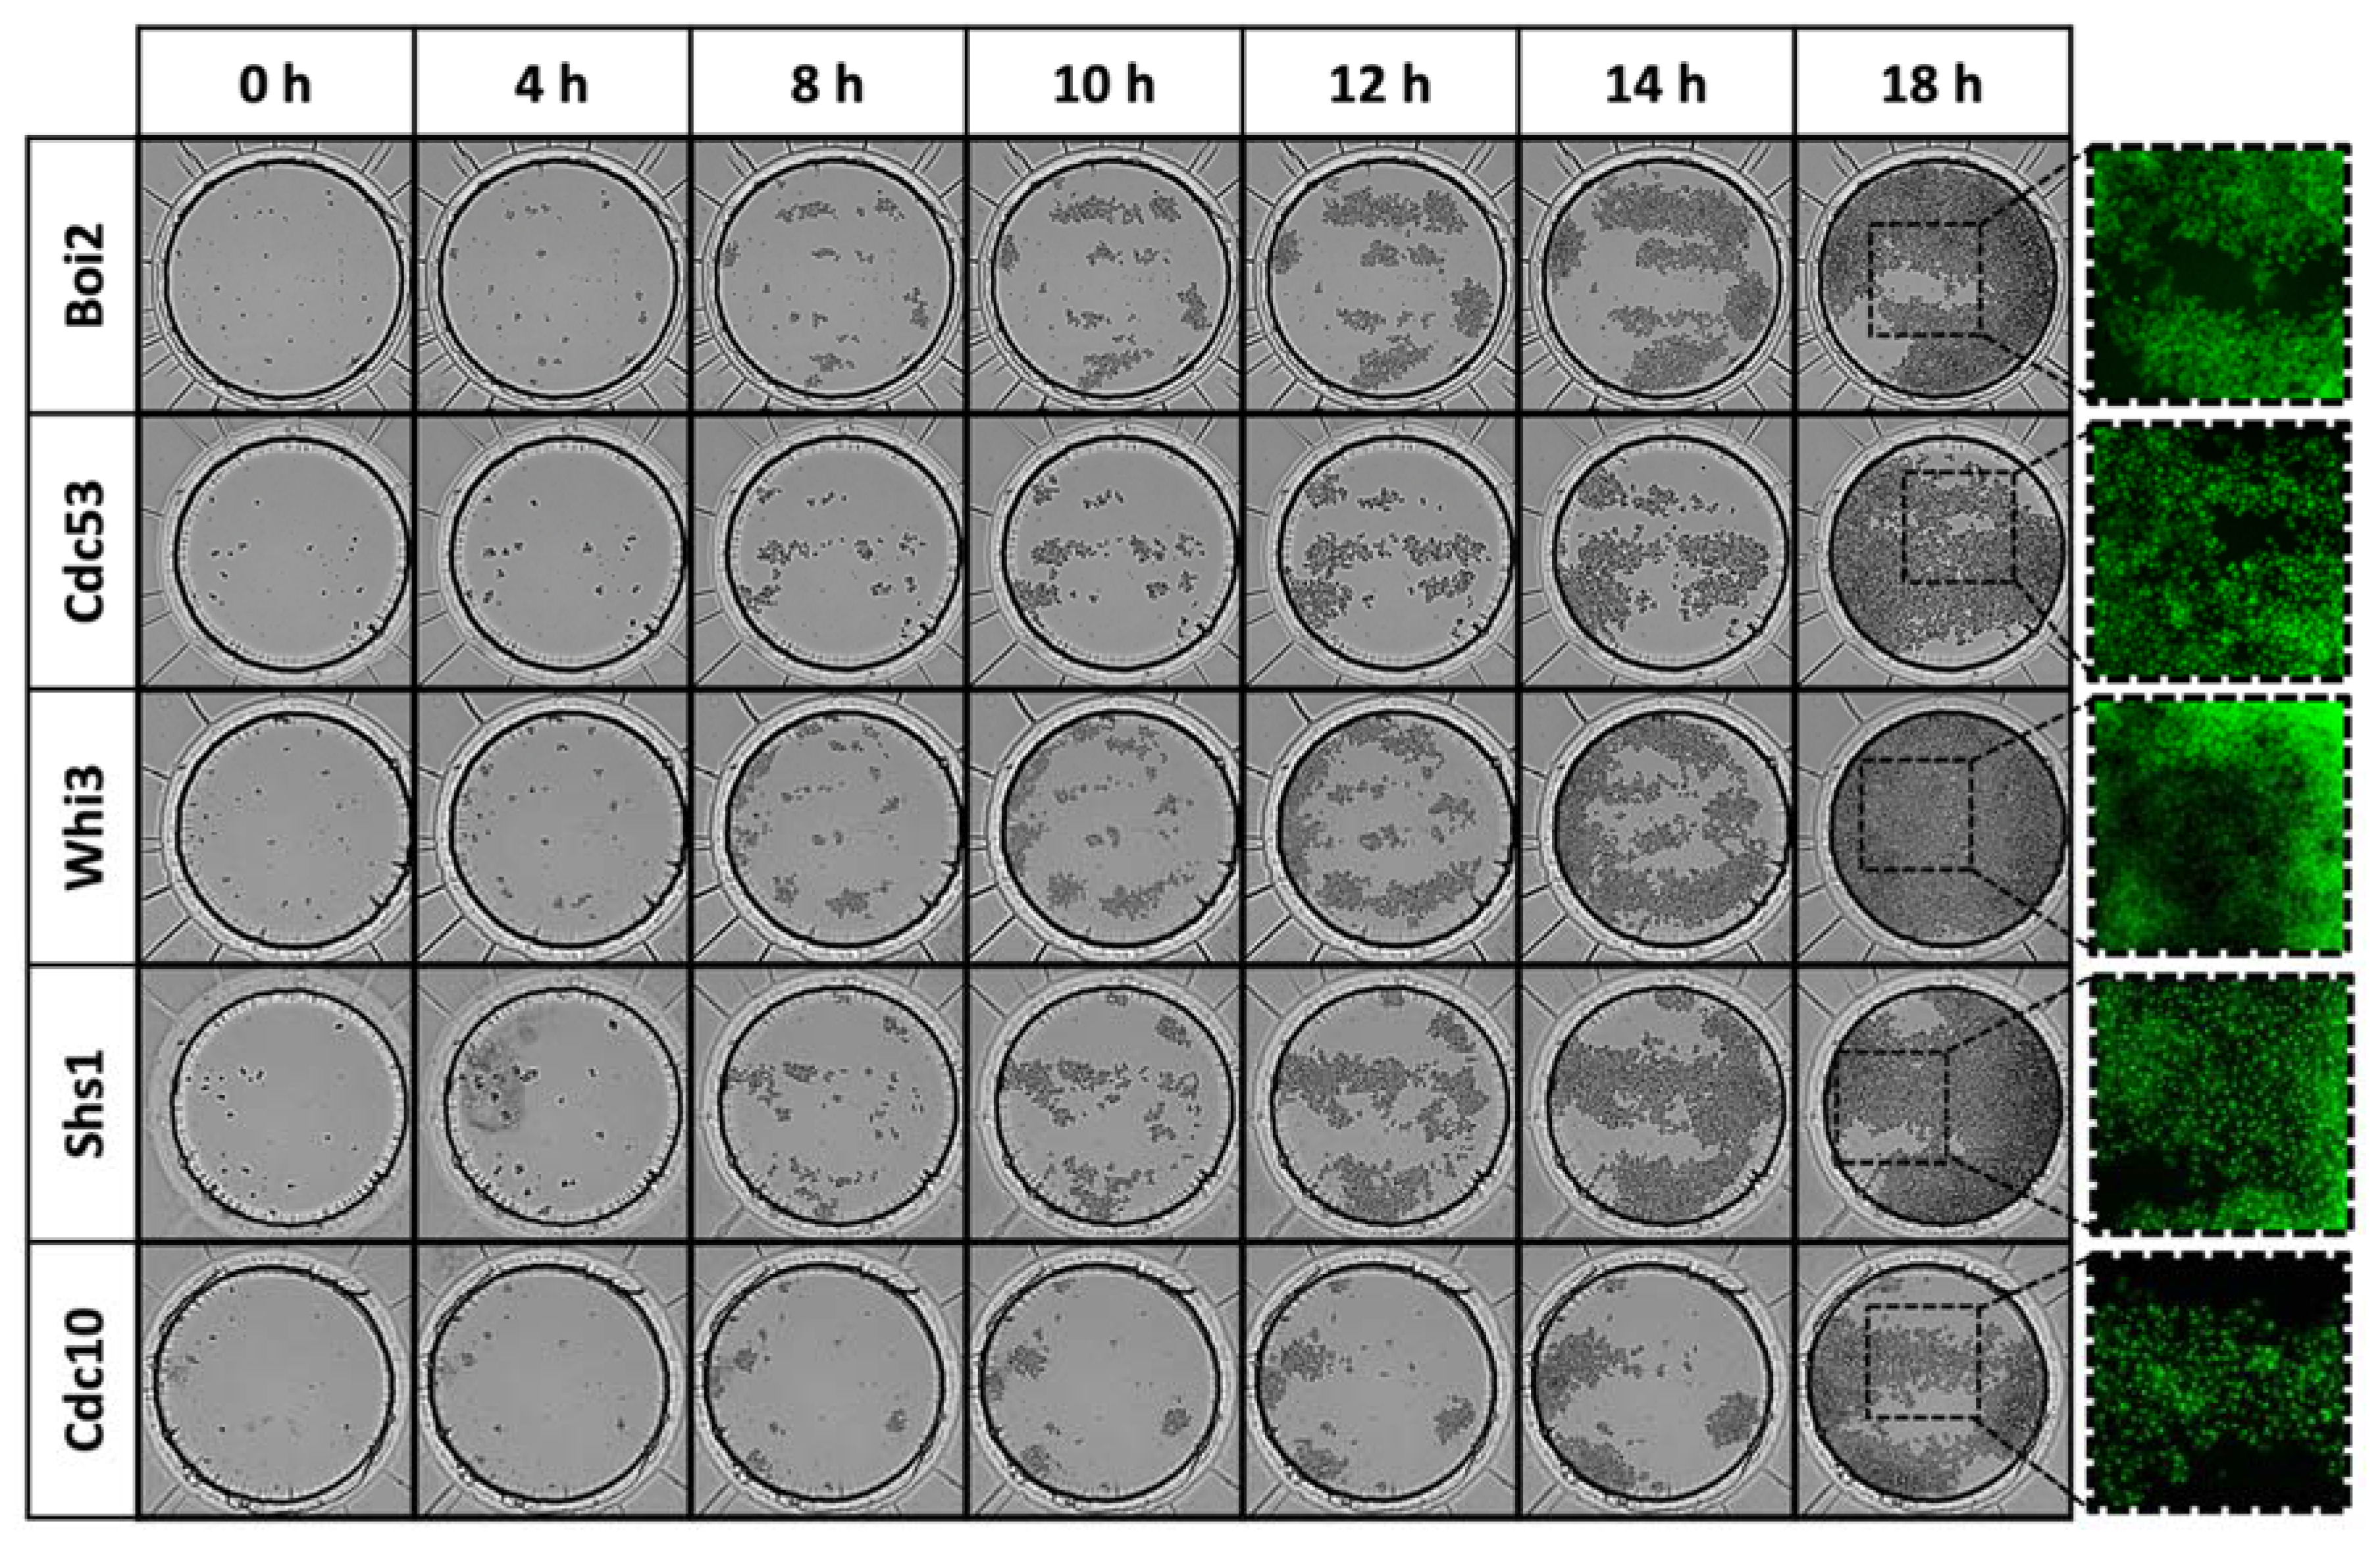
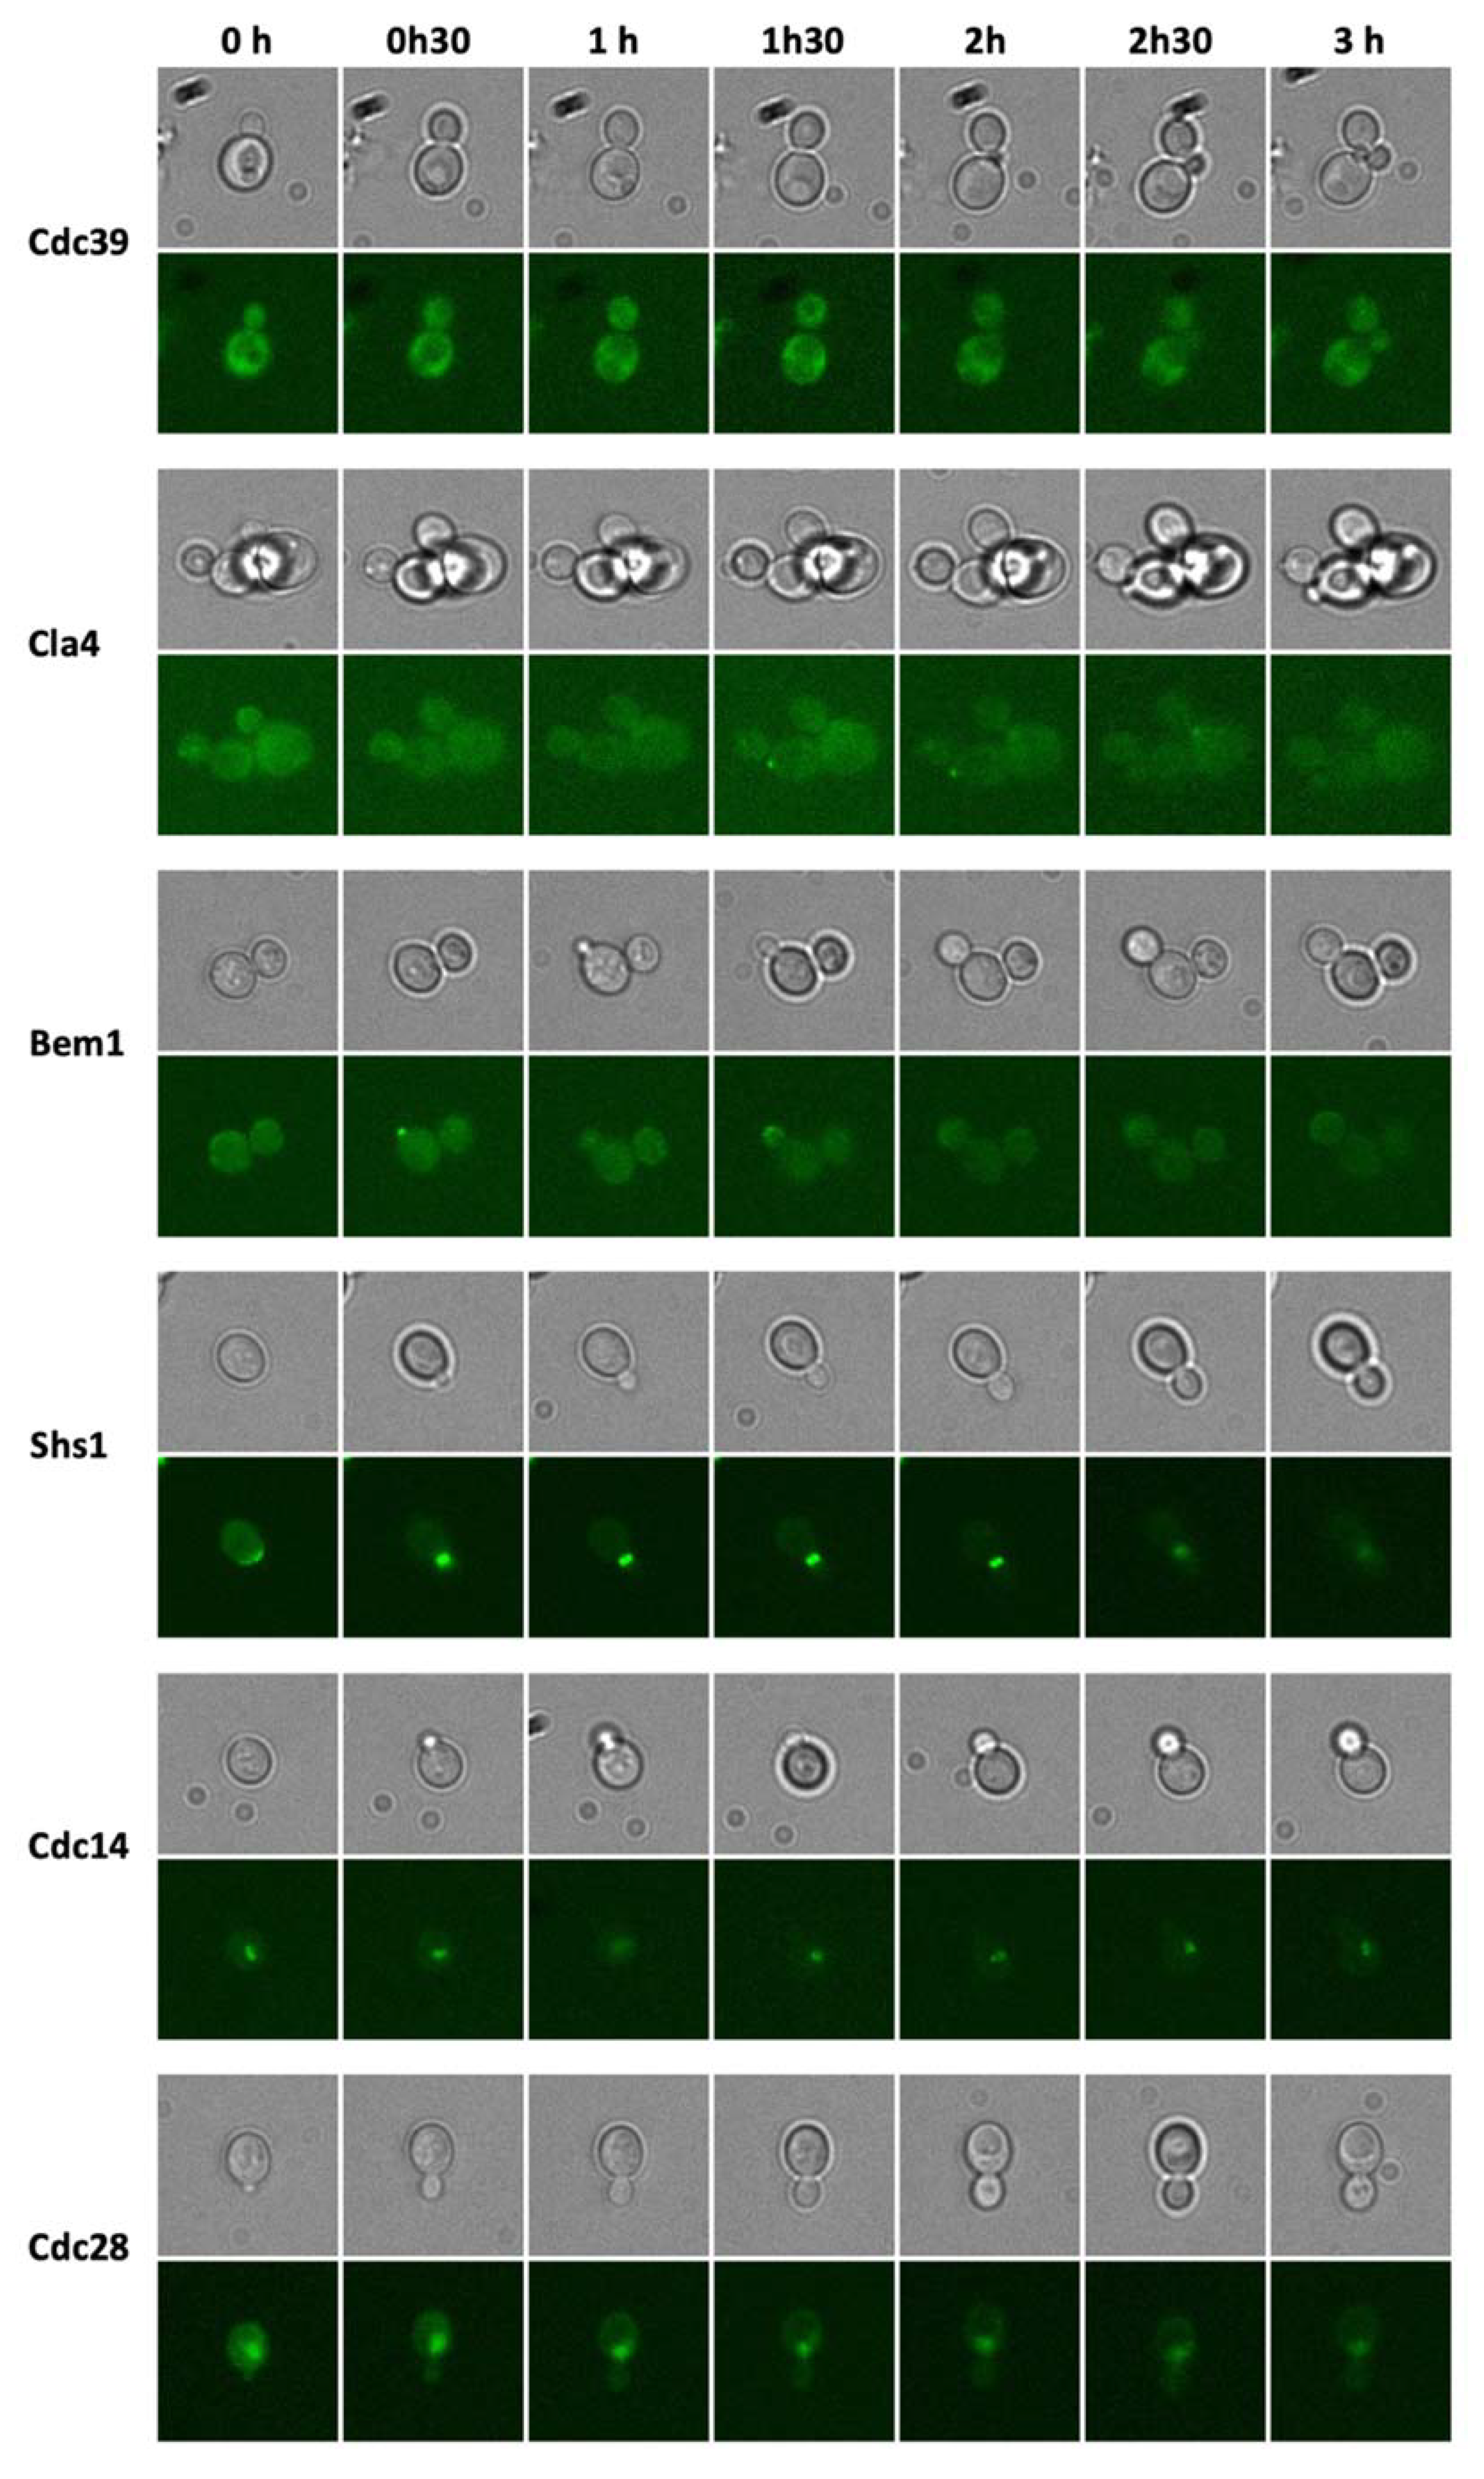
3.3. Growth of Yeast Cells in the Microfluidic Chip

A selection of 34 GFP-tagged S. cerevisiae clones that are related to the cell cycle were printed as triplicates into the well array (Figure 4, S2e), and the chip was closed by sticking the microfluidic channel to the microwell substrate (Figure 1). Time-lapse microscopy was used to follow the growth during 18 h. An overview of all wells is presented in Figure S3 and some selected wells in Figure 6. At the end of the growth experiment, the GFP-tagged proteins were visualized.
To evaluate the suitability of the developed yeast chips to perform dynamic analyses of protein expression and protein localization in single yeast cells, a small set of 6 clones were selected, i.e. Cdc39, Cla4, Bem1, Shs1, Cdc14 and Cdc28. A time-lapse experiment was performed where these clones were observed at higher resolution (600× magnification) during 3 h (Figure 7).

4. Discussion

To create a living GFP-tagged yeast array, we combined mechanical patterning by constructing an array of microwells with cell printing (robotic cell patterning), which allows the controlled placement of the GFP-tagged clones in the selected wells. The cells were trapped in the wells by sticking them to the glass bottom of the microwells using the lectin Con A. Microfluidic chips where a GFP-tagged yeast clone collection was patterned as an array into microchambers have been previously developed [10,37]. Also, a microfluidic perfusion system where a robotic printed yeast array on agar and sandwiched with a track-etched membrane has been described [38]. These designs and fabrication methods are much more complex and difficult to construct. Due to the open design, robotic patterning of living cells in microwells is much more flexible in creating different filling designs. Additionally, it could be used to create high-density arrays without increasing much the complexity of the microfluidic chip design and construction.
A hybrid SU-8 on glass microfluidic chip containing a living cell array was developed. The direct fabrication of SU-8 microwells on the glass coverslip substrate is a simple, low cost and a high precision method that is suitable to construct disposable biochips [39]. SU-8 is biocompatible and has also the advantage that high density well arrays at high aspect ratios could be created [40]. A microwell array of 3 × 34 microwells containing microwells with a diameter of 300 µm and depth of 50 µm were created. The SU-8 microwell layer stuck well to the glass substrate. The bonding of the SU-8 microwell array to the glass could also withstand temperature shifts to low temperature (refrigerator). This allowed to store the chip filled with yeast cells for a few days before the growth experiment was performed.
Piezo printing was selected as the method to dispense a Con A protein solution and the GFP-tagged yeast collection into the microwells. We performed these dispensing steps with a piezoelectric dispenser (also called drop-on-demand ink-jet printing) [41,42]. Piezo printing of proteins and cells has been used previously for various applications including enzyme printing for glucose biosensors [43], protein arrays [44], netrin-1 adhesive micropattern construction [45], bacterial Escherichia coli arrays [46,47], bacterial and yeast cells on cantilever array sensors [48], S. cerevisiae cells on an agar layer [38], and mammalian cells [49].
We demonstrated that printing a small array on a flat glass substrate is possible and this method could be used to create cell arrays on glass substrate in a cheap and easy way. However, the droplet size was not proportional to the droplet volume which is a limitation to increase the throughput. We expected that half the number of droplets would result in half the spot volume, half the spot size and that twice the number of spots could be printed in the array. However, this was not the case. Also, significant variations in the droplet locations occurred, which resulted in arrays that were not perfectly arranged, which can result in merging of the spots in case of a small pitch distance (Figure 2e,f).
Printing of cells into microwells compared to on a flat surface has many advantages. Spatial confinement in the microwell results in higher resolution printing: smaller well sizes than droplet spot sizes and smaller pitch distances can be obtained. Droplet position in the wells is more accurate than droplets on a flat surface (Figure 2). Additionally, the liquid–air interface is reduced for microwells compared to droplets on a surface, resulting in a reduced evaporation rate. All these benefits result in higher throughput and stable printing.
The printer setup allowed to aspirate a yeast solution from an MTP (multiwell plate) well and deposit picoliter droplets containing living cells at the target microwell, and to perform this consecutively for all filled MTP wells. A tip dispenser washing protocol based on syringe pump cell solution ejection was successful to avoid cross contamination between different wells since syringe pump ejection occurred at a much higher flow rate than pressure-based ejection and could remove all yeast cells from the piezo tip. A GFP-tagged clone collection in a 3 × 34 cell array was cultivated during 18 h (Figure 6 and S3). This experiment demonstrated that a clone collection of 34 clones in triplicate could be successfully printed at a cell concentration that allows single cell observation during several generations.
As a proof-of-concept experiment to observe changes in GFP-tagged protein expression and cellular location, we selected GFP-tagged proteins that play a role during the yeast growth cycle. The Cdc39 protein is a subunit of the CCR4-NOT1 core complex that has multiple roles in the regulation of mRNA levels [50,51]. A high fluorescence intensity covering the cytoplasm in the mother and daughter cell can be observed (Figure 7) since it is present at a large number of protein molecules per cell (4300) [52]. Cla4p is a Cdc42p-activated signal transducing kinase that is involved in septin ring assembly, vacuole inheritance, cytokinesis, and sterol uptake regulation [53]. It is distributed in the cytoplasm and the bud. Higher intensity spots can be observed at the site where the bud appears (Figure 7). Bem1p is involved in establishing cell polarity and morphogenesis and functions as a scaffold protein for complexes that include Cdc24p, Ste5p, Ste20p, and Rsr1p [54]. A high intensity spot can be observed at the bud site and the growing bud (Figure 7). Shs1p is a component of the septin ring that is required for cytokinesis [55]. Initially, it is present at the cell periphery and moves to the bud site to create the septin ring (Figure 7). Cdc14p is a phosphatase required for the mitotic exit [56]. It is present in the nucleus and the nucleolus (Figure 7). Cdc28p is a cyclin-dependent kinase (CDK) catalytic subunit and master regulator of mitotic and meiotic cell cycles [57,58]. It alternately associates with G1, S, and G2/M phase cyclins. It is observed initially in the cytoplasm and next in the nucleus (Figure 7). These results demonstrate that the microfluidic chip can be used to perform dynamic experiments with subcellular resolution of fluorescently-tagged proteins.
In the future, the number of microwells in the array could be upscaled allowing to perform dynamic proteomics and localizomics experiments. This cell microarray-based systems-biology platform could be used to detect directly chemical disturbances in a small-molecule compound screen of the proteome in contrast to genetic approaches that are based on chemical-genetic interactions and necessitates a multistep indirect approach [59]. The genome-wide tagging of proteins of S. cerevisiae, including with GFP, has already provided a vast resource of such information [9,11,33,60]. Analysis of this high-resolution, high coverage localisation data set in the context of transcriptional, genetic, and protein-protein interaction (PPI) data revealed the combinatorial logic of transcriptional co-regulation and spatial-temporal regulation of proteins, and provided for example a comprehensive view of trafficking and signalling regulatory interactions within and between organelles in eukaryotic cells. As demonstrated here, dynamic movements from one location to another can also be followed as the cell proceeds through the cell cycle. Dynamic movements of proteins have also been described in yeast cells that respond to environmental stresses such as dithiothreitol (DTT) stress [9], hydrogen peroxide stress [9], osmotic stress by potassium chloride [37], and nitrogen starvation [9] or chemical perturbations by rapamycin [11], hydroxyurea [11], or methyl methane sulfonate [10].

5. Conclusions

We developed a perfusion microfluidic chip containing living yeast cell arrays that allows long term cultivation of the yeast cells and high-resolution time-lapse fluorescence microscopy. The creation of the cell array was based on mechanical patterning in SU-8 microwells and piezoelectric filling of the microwells. The microfluidic chip was closed by sticking a top plate that contained the microfluidic channel and inlet and outlet to the microwell substrate. The developed technology and method were validated by a growth experiment of a clone collection of 34 clones (in triplicate) that are linked to the cell cycle. Additionally, a set of six selected GFP-tagged clones were observed by time-lapse fluorescence microscopy at high resolution to observe single cell protein expression and subcellular location of the GFP-tagged proteins.
Future technological challenges lie in the further upscaling of the technology and procedures to construct genome/proteome-wide cell microarrays and analyzing cells dynamically on a whole proteome level. Dynamic proteomics profiling information based on chemical compound (such as e.g. drug compound) perturbation should allow to determine the target(s) and mechanism of action (MoA) [61]. For example, this technology could lead to the discovery of novel antifungal molecules, which are highly desired due to the limited number of available antifungal drugs and the fast emergence of multiresistant pathogens [62,63].

Supplementary Materials

The following are available online at https://www.mdpi.com/2311-5637/6/1/26/s1, Figure S1: Construction of the SU-8 microwell array on the glass substrate, Figure S2: The robotic piezo dispenser, Figure S3: Growth of yeast cells in the microfluidic chip, Table S1: Selected S. cerevisiae GFP clones that were used in the growth experiment.

Author Contributions

Conceptualization, C.Y. and R.G.W.; methodology, C.Y., S.T., and R.G.W.; formal analysis, C.Y.; investigation, C.Y.; resources, R.G.W.; writing—original draft preparation, C.Y. and R.G.W.; writing—review and editing, C.Y., S.T., and R.G.W.; supervision, R.G.W.; project administration, R.G.W.; funding acquisition, C.Y. and R.G.W. All authors have read and agreed to the published version of the manuscript.

Funding

This research was funded by The Belgian Federal Science Policy Office (Belspo) and the European Space Agency (ESA) PRODEX program grant number FluoCells and Yeast Bioreactor projects. C.Y. was funded by FWO for the funding of the SB PhD grant. The Research Council of the Vrije Universiteit Brussel (Belgium) and the University of Ghent (Belgium) are acknowledged to support the Alliance Research Group VUB-UGent NanoMicrobiology (NAMI), and the International Joint Research Group (IJRG) VUB-EPFL BioNanotechnology & NanoMedicine (NANO).

Acknowledgments

We acknowledge Rouslan Efremov for the use of lithography equipment and Gangadhar Eluru for allowing us to use his design of the microwell mask. The Hercules Foundation (FWO Flanders) is acknowledged for the funding of the Raith Voyager e-beam equipment (AUGE/13/19).

Conflicts of Interest

The authors declare no conflict of interest.

References

  1. Castel, D.; Pitaval, A.; Debily, M.A.; Gidrol, X. Cell microarrays in drug discovery. Drug Discov. Today 2006, 11, 616–622. [Google Scholar] [CrossRef] [PubMed]
  2. Berthuy, O.I.; Muldur, S.K.; Rossi, F.; Colpo, P.; Blum, L.J.; Marquette, C.A. Multiplex cell microarrays for high-throughput screening. Lab Chip 2016, 16, 4248–4262. [Google Scholar] [CrossRef] [PubMed]
  3. Hong, H.; Koom, W.; Koh, W.G. Cell Microarray Technologies for High-Throughput Cell-Based Biosensors. Sensors 2017, 17, 1293. [Google Scholar] [CrossRef] [PubMed] [Green Version]
  4. Willaert, R.; Goossens, K. Microfluidic Bioreactors for Cellular Microarrays. Fermentation 2015, 1, 38–78. [Google Scholar] [CrossRef] [Green Version]
  5. Jonczyk, R.; Kurth, T.; Lavrentieva, A.; Walter, J.-G.; Scheper, T.; Stahl, F. Living Cell Microarrays: An Overview of Concepts. Microarrays 2016, 5, 11. [Google Scholar] [CrossRef] [Green Version]
  6. Willaert, R.; Sahli, H. On-Chip Living-Cell Microarrays for Network Biology. In Bioinformatics—Trends and Methodologies; InTechOpen: London, UK, 2011. [Google Scholar]
  7. Fernandes, T.G.; Diogo, M.M.; Clark, D.S.; Dordick, J.S.; Cabral, J.M.S. High-throughput cellular microarray platforms: Applications in drug discovery, toxicology and stem cell research. Trends Biotechnol. 2009, 27, 342–349. [Google Scholar] [CrossRef] [Green Version]
  8. Chen, D.; Davis, M. Molecular and functional analysis using live cell microarrays. Curr. Opin. Chem. Biol. 2006, 10, 28–34. [Google Scholar] [CrossRef]
  9. Breker, M.; Gymrek, M.; Schuldiner, M. A novel single-cell screening platform reveals proteome plasticity during yeast stress responses. J. Cell Biol. 2013, 200, 839–850. [Google Scholar] [CrossRef] [Green Version]
  10. Dénervaud, N.; Becker, J.; Delgado-Gonzalo, R.; Damay, P.; Rajkumar, A.S.; Unser, M.; Shore, D.; Naef, F.; Maerkl, S.J. A chemostat array enables the spatio-temporal analysis of the yeast proteome. Proc. Natl. Acad. Sci. USA 2013, 110, 15842–15847. [Google Scholar] [CrossRef] [Green Version]
  11. Chong, Y.T.; Koh, J.L.Y.; Friesen, H.; Duffy, K.; Cox, M.J.; Moses, A.; Moffat, J.; Boone, C.; Andrews, B.J. Yeast proteome dynamics from single cell imaging and automated analysis. Cell 2015, 161, 1413–1424. [Google Scholar] [CrossRef] [Green Version]
  12. Yuan, H.; Zhang, R.; Shao, B.; Wang, X.; Ouyang, Q.; Hao, N.; Luo, C. Protein expression patterns of the yeast mating response. Integr. Biol. (UK) 2016, 8, 712–719. [Google Scholar] [CrossRef]
  13. Shao, B.; Yuan, H.; Zhang, R.; Wang, X.; Zhang, S.; Ouyang, Q.; Hao, N.; Luo, C. Reconstructing the regulatory circuit of cell fate determination in yeast mating response. PLoS Comput. Biol. 2017, 13, e1005671. [Google Scholar] [CrossRef] [PubMed] [Green Version]
  14. Yarmush, M.L.; King, K.R. Living-Cell Microarrays. Annu. Rev. Biomed. Eng. 2009, 11, 235–257. [Google Scholar] [CrossRef] [PubMed] [Green Version]
  15. Park, M.C.; Hur, J.Y.; Cho, H.S.; Park, S.H.; Suh, K.Y. High-throughput single-cell quantification using simple microwell-based cell docking and programmable time-course live-cell imaging. Lab Chip 2011, 11, 79–86. [Google Scholar] [CrossRef] [PubMed]
  16. Minc, N.; Boudaoud, A.; Chang, F. Mechanical Forces of Fission Yeast Growth. Curr. Biol. 2009, 19, 1096–1101. [Google Scholar] [CrossRef] [PubMed] [Green Version]
  17. Falconnet, D.; Niemistö, A.; Taylor, R.J.; Ricicova, M.; Galitski, T.; Shmulevich, I.; Hansen, C.L. High-throughput tracking of single yeast cells in a microfluidic imaging matrix. Lab Chip 2011, 11, 466–473. [Google Scholar] [CrossRef]
  18. Groisman, A.; Lobo, C.; Cho, H.; Campbell, J.K.; Dufour, Y.S.; Stevens, A.M.; Levchenko, A. A microfluidic chemostat for experiments with bacterial and yeast cells. Nat. Methods 2005, 2, 685–689. [Google Scholar] [CrossRef]
  19. Ryley, J.; Pereira-Smith, O.M. Microfluidics device for single cell gene expression analysis inSaccharomyces cerevisiae. Yeast 2006, 23, 1065–1073. [Google Scholar] [CrossRef]
  20. Bell, L.; Seshia, A.; Lando, D.; Laue, E.; Palayret, M.; Lee, S.F.; Klenerman, D. A microfluidic device for the hydrodynamic immobilisation of living fission yeast cells for super-resolution imaging. Sens. Actuators B Chem. 2014, 192, 36–41. [Google Scholar] [CrossRef] [Green Version]
  21. Carlo, D.D.; Wu, L.Y.; Lee, L.P. Dynamic single cell culture array. Lab Chip 2006, 6, 1445–1449. [Google Scholar] [CrossRef]
  22. Barbulovic-Nad, I.; Lucente, M.; Sun, Y.; Zhang, M.; Wheeler, A.R.; Bussmann, M. Bio-microarray fabrication techniques—A review. Crit. Rev. Biotechnol. 2006, 26, 237–259. [Google Scholar] [CrossRef] [PubMed] [Green Version]
  23. Guillemot, F.; Souquet, A.; Catros, S.; Guillotin, B.; Lopez, J.; Faucon, M.; Pippenger, B.; Bareille, R.; Rémy, M.; Bellance, S.; et al. High-throughput laser printing of cells and biomaterials for tissue engineering. Acta Biomater. 2010, 6, 2494–2500. [Google Scholar] [CrossRef] [PubMed]
  24. Bean, G.J.; Jaeger, P.A.; Bahr, S.; Ideker, T. Development of ultra-high-density screening tools for microbial “omics”. PLoS ONE 2014, 9, e85177. [Google Scholar] [CrossRef] [PubMed]
  25. Schaack, B.; Reboud, J.; Combe, S.; Fouqué, B.; Berger, F.; Boccard, S.; Odile Filhol-Cochet, F.C. A “DropChip” Cell Array for DNA and siRNA Transfection Combined with Drug Screening. Nanobiotechnology 2005, 1, 183–189. [Google Scholar] [CrossRef]
  26. Ringeisen, B.R.; Othon, C.M.; Barron, J.A.; Young, D.; Spargo, B.J. Jet-based methods to print living cells. Biotechnol. J. 2006, 1, 930–948. [Google Scholar] [CrossRef]
  27. Roth, E.A.; Xu, T.; Das, M.; Gregory, C.; Hickman, J.J.; Boland, T. Inkjet printing for high-throughput cell patterning. Biomaterials 2004, 25, 3707–3715. [Google Scholar] [CrossRef]
  28. Ferris, C.J.; Gilmore, K.G.; Wallace, G.G.; In Het Panhuis, M. Biofabrication: An overview of the approaches used for printing of living cells. Appl. Microbiol. Biotechnol. 2013, 97, 4243–4258. [Google Scholar] [CrossRef]
  29. Demirci, U.; Montesano, G. Cell encapsulating droplet vitrification. Lab Chip 2007, 7, 1428–1433. [Google Scholar] [CrossRef]
  30. Lee, W.; Debasitis, J.C.; Lee, V.K.; Lee, J.H.; Fischer, K.; Edminster, K.; Park, J.K.; Yoo, S.S. Multi-layered culture of human skin fibroblasts and keratinocytes through three-dimensional freeform fabrication. Biomaterials 2009, 30, 1587–1595. [Google Scholar] [CrossRef]
  31. Gonzalez-Macia, L.; Morrin, A.; Smyth, M.R.; Killard, A.J. Advanced printing and deposition methodologies for the fabrication of biosensors and biodevices. Analyst 2010, 135, 845–867. [Google Scholar] [CrossRef] [Green Version]
  32. Li, J.; Rossignol, F.; Macdonald, J. Inkjet printing for biosensor fabrication: Combining chemistry and technology for advanced manufacturing. Lab Chip 2015, 15, 2538–2558. [Google Scholar] [CrossRef] [PubMed]
  33. Huh, W.K.; Falvo, J.V.; Gerke, L.C.; Carroll, A.S.; Howson, R.W.; Weissman, J.S.; O’Shea, E.K. Global analysis of protein localization in budding yeast. Nature 2003, 425, 686–691. [Google Scholar] [CrossRef] [PubMed]
  34. Schindelin, J.; Arganda-Carreras, I.; Frise, E.; Kaynig, V.; Longair, M.; Pietzsch, T.; Preibisch, S.; Rueden, C.; Saalfeld, S.; Schmid, B.; et al. Fiji: An open-source platform for biological-image analysis. Nat. Methods 2012, 9, 676–682. [Google Scholar] [CrossRef] [PubMed] [Green Version]
  35. Preibisch, S.; Saalfeld, S.; Tomancak, P. Globally optimal stitching of tiled 3D microscopic image acquisitions. Bioinformatics 2009, 25, 1463–1465. [Google Scholar] [CrossRef]
  36. Pemberton, L.F. Preparation of yeast cells for live-cell imaging and indirect immunofluorescence. Methods Mol. Biol. 2014, 1205, 79–90. [Google Scholar]
  37. Zhang, R.; Yuan, H.; Wang, S.; Ouyang, Q.; Chen, Y.; Hao, N.; Luo, C. High-throughput single-cell analysis for the proteomic dynamics study of the yeast osmotic stress response. Sci. Rep. 2017, 7, 42200. [Google Scholar] [CrossRef]
  38. Mirzaei, M.; Pla-Roca, M.; Safavieh, R.; Nazarova, E.; Safavieh, M.; Li, H.; Vogel, J.; Juncker, D. Microfluidic perfusion system for culturing and imaging yeast cell microarrays and rapidly exchanging media. Lab Chip 2010, 10, 2449–2457. [Google Scholar] [CrossRef]
  39. Kang, D.H.; Han, W.B.; Choi, N.; Kim, Y.J.; Kim, T.S. Tightly Sealed 3D Lipid Structure Monolithically Generated on Transparent SU-8 Microwell Arrays for Biosensor Applications. ACS Appl. Mater. Interfaces 2018, 10, 40401–40410. [Google Scholar] [CrossRef]
  40. Wu, Z.Z.; Zhao, Y.; Kisaalita, W.S. Interfacing SH-SY5Y human neuroblastoma cells with SU-8 microstructures. Colloids Surf. B Biointerfaces 2006, 52, 14–21. [Google Scholar] [CrossRef]
  41. Calvert, P. Inkjet printing for materials and devices. Chem. Mater. 2001, 13, 3299–3305. [Google Scholar] [CrossRef]
  42. Derby, B. Bioprinting: Inkjet printing proteins and hybrid cell-containing materials and structures. J. Mater. Chem. 2008, 18, 5717–5721. [Google Scholar] [CrossRef]
  43. Newman, J.D.; Turner, A.P.F.; Marrazza, G. Ink-jet printing for the fabrication of amperometric glucose biosensors. Anal. Chim. Acta 1992, 262, 13–17. [Google Scholar] [CrossRef]
  44. Montenegro-Nicolini, M.; Miranda, V.; Morales, J.O. Inkjet Printing of Proteins: An Experimental Approach. AAPS J. 2017, 19, 234–243. [Google Scholar] [CrossRef] [PubMed]
  45. Matsugaki, A.; Yamazaki, D.; Nakano, T. Selective patterning of netrin-1 as a novel guiding cue for anisotropic dendrogenesis in osteocytes. Mater. Sci. Eng. C 2020, 108, 110391. [Google Scholar] [CrossRef]
  46. Xu, T.; Petridou, S.; Lee, E.H.; Roth, E.A.; Vyavahare, N.R.; Hickman, J.J.; Boland, T. Construction of high-density bacterial colony arrays and patterns by the ink-jet method. Biotechnol. Bioeng. 2004, 85, 29–33. [Google Scholar] [CrossRef] [PubMed]
  47. Zheng, Q.; Lu, J.; Chen, H.; Huang, L.; Cai, J.; Xu, Z. Application of inkjet printing technique for biological material delivery and antimicrobial assays. Anal. Biochem. 2011, 410, 171–176. [Google Scholar] [CrossRef] [PubMed]
  48. Lukacs, G.; Maloney, N.; Hegner, M. Ink-jet printing: Perfect tool for cantilever array sensor preparation for microbial growth detection. J. Sensors 2012, 2012. [Google Scholar] [CrossRef] [Green Version]
  49. Zhang, J.; Chen, F.; He, Z.; Ma, Y.; Uchiyama, K.; Lin, J.M. A novel approach for precisely controlled multiple cell patterning in microfluidic chips by inkjet printing and the detection of drug metabolism and diffusion. Analyst 2016, 141, 2940–2947. [Google Scholar] [CrossRef]
  50. Collart, M.A.; Struhl, K. NOT1(CDC39), NOT2(CDC36), NOT3, and NOT4 encode a global-negative regulator of transcription that differentially affects TATA-element utilization. Genes Dev. 1994, 8, 525–537. [Google Scholar] [CrossRef] [Green Version]
  51. Kruk, J.A.; Dutta, A.; Fu, J.; Gilmour, D.S.; Reese, J.C. The multifunctional Ccr4-Not complex directly promotes transcription elongation. Genes Dev. 2011, 25, 581–593. [Google Scholar] [CrossRef] [Green Version]
  52. Ghaemmaghami, S.; Huh, W.K.; Bower, K.; Howson, R.W.; Belle, A.; Dephoure, N.; O’Shea, E.K.; Weissman, J.S. Global analysis of protein expression in yeast. Nature 2003, 425, 737–741. [Google Scholar] [CrossRef] [PubMed]
  53. Benton, B.K.; Tinkelenberg, A.; Gonzalez, I.; Cross, F.R. Cla4p, a Saccharomyces cerevisiae Cdc42p-activated kinase involved in cytokinesis, is activated at mitosis. Mol. Cell. Biol. 1997, 17, 5067–5076. [Google Scholar] [CrossRef] [PubMed] [Green Version]
  54. Madden, K.; Snyder, M. Cell Polarity and Morphogenesis in Budding Yeast. Annu. Rev. Microbiol. 1998, 52, 687–744. [Google Scholar] [CrossRef]
  55. Mino, A.; Tanaka, K.; Kamei, T.; Umikawa, M.; Fujiwara, T.; Takai, Y. Shs1p: A novel member of septin that interacts with Spa2p, involved in polarized growth in Saccharomyces cerevisiae. Biochem. Biophys. Res. Commun. 1998, 251, 732–736. [Google Scholar] [CrossRef] [PubMed]
  56. Visintin, R.; Craig, K.; Hwang, E.S.; Prinz, S.; Tyers, M.; Amon, A. The phosphatase Cdc14 triggers mitotic exit by reversal of Cdk-dependent phosphorylation. Mol. Cell 1998, 2, 709–718. [Google Scholar] [CrossRef]
  57. Mendenhall, M.D.; Hodge, A.E. Regulation of Cdc28 cyclin-dependent protein kinase activity during the cell cycle of the yeast Saccharomyces cerevisiae. Microbiol. Mol. Biol. Rev. 1998, 62, 1191–1243. [Google Scholar] [CrossRef] [PubMed] [Green Version]
  58. Chymkowitch, P.; Eldholm, V.; Lorenz, S.; Zimmermann, C.; Lindvall, J.M.; Bjørås, M.; Meza-Zepeda, L.A.; Enserink, J.M. Cdc28 kinase activity regulates the basal transcription machinery at a subset of genes. Proc. Natl. Acad. Sci. USA 2012, 109, 10450–10455. [Google Scholar] [CrossRef] [Green Version]
  59. Weig, M.; Brown, A.J.P. Genomics and the development of new diagnostics and anti-Candida drugs. Trends Microbiol. 2007, 15, 310–317. [Google Scholar] [CrossRef]
  60. Howson, R.; Huh, W.K.; Ghaemmaghami, S.; Falvo, J.V.; Bower, K.; Belle, A.; Dephoure, N.; Wykoff, D.D.; Weissman, J.S.; O’Shea, E.K. Construction, verification and experimental use of two epitope-tagged collections of budding yeast strains. Comp. Funct. Genom. 2005, 6, 2–16. [Google Scholar] [CrossRef] [Green Version]
  61. Cohen, A.A.; Geva-Zatorsky, N.; Eden, E.; Frenkel-Morgenstern, M.; Issaeva, I.; Sigal, A.; Milo, R.; Cohen-Saidon, C.; Liron, Y.; Kam, Z.; et al. Dynamic proteomics of individual cancer cells in response to a drug. Science 2008, 322, 1511–1516. [Google Scholar] [CrossRef] [Green Version]
  62. Michael, C.A.; Dominey-Howes, D.; Labbate, M. The Antimicrobial Resistance Crisis: Causes, Consequences, and Management. Front. Public Health 2014, 2, 145. [Google Scholar] [CrossRef] [PubMed]
  63. Willaert, R. Micro- and Nanoscale Approaches in Antifungal Drug Discovery. Fermentation 2018, 4, 43. [Google Scholar] [CrossRef] [Green Version]
Figure 1. Construction of the microfluidic chip containing the cell microarray. (a) The bottom substrate: the SU-8 microwell array on the glass coverslip. (b) The top plate containing the channel, inlet and outlet (Ibidi, Gräfelfing, Germany). (c) The integrated microfluidic chip obtained by sticking the top plate to the bottom plate using double-sided sticky tape. (d) The microwells constructed by SU-8 UV-photolithography.
Fermentation 06 00026 g001
Figure 2. Optimization of the printing on a glass substrate. Water droplets were piezo dispensed (pulse duration of 15 µs and voltage of 75 V) as a 3 × 3 array on a glass coverslip: (a) 100 droplets at a frequency of 50 Hz with a pitch of 1000 µm; (b) 100 droplets at a frequency of 50 Hz with a pitch of 750 µm; (c) 100 droplets at a frequency of 50 Hz with a pitch of 500 µm; (d) 50 droplets at a frequency of 25 Hz with a pitch of 400 µm; (e) 25 droplets at a frequency of 25 Hz with a pitch of 300 µm; (f) 25 droplets at a frequency of 25 Hz with a pitch of 250 µm; (g) 10 droplets at a frequency of 5 Hz with a pitch of 250 µm; (h) five droplets at a frequency of 4 Hz with a pitch of 200 µm.
Fermentation 06 00026 g002
Figure 3. Optimization of piezo printing into microwells. (a) Commercial microtiter plate (Microfluidic ChipShop, Jena, Germany) containing three microwell arrays with square microwells of varying width; array A: width of 400 µm and pitch of 1125 µm, array B: width of 200 µm and pitch of 563 µm, array C: width of 100 µm and pitch of 281 µm. Water droplets were piezo dispensed (pulse duration of 15 µs, amplitude voltage of 75 V and frequency of 50 Hz) as (b) a 2 × 2 array in array A wells at 200 droplets/well, (c) a 4 × 4 array in array B wells at 25 droplets/well, (d) a 8 × 8 array in array C wells at five droplets/well.
Fermentation 06 00026 g003
Figure 4. Con A and yeast cells dispensing into the microwells of the microfluidic ship (pulse duration of 15 µs, voltage of 75 V and frequency of 50 Hz): (a) 60 droplets of Con A were printed, (b) 40 droplets were printed from the yeast solution (OD600 of 0.5).
Fermentation 06 00026 g004
Figure 5. Evaluation of the washing protocol to avoid cross-contamination. (a) Printing pattern to evaluate the washing protocol of the piezo dispenser. Transparent wells contain a yeast solution in PBS, and the colored wells contain a blue dye (no cells). (b) Washing protocol based on pressure resulted in 1 cross-contamination colony. (c) Washing protocol based on the syringe pump resulted in spotting without cross-contamination.
Fermentation 06 00026 g005
Figure 6. Yeast growth in some selected wells (see Figure S3 for the full overview).
Fermentation 06 00026 g006
Figure 7. Time-lapse fluorescence microscopy of selected GFP-tagged clones related to the cell cycle.
Fermentation 06 00026 g007

