Article

The Use of CRISPR-Cas9 Genome Editing to Determine the Importance of Glycerol Uptake in Wine Yeast During Icewine Fermentation

1
Centre for Biotechnology, Brock University, St. Catharines, ON L2S 3A1, Canada
2
Department of Biological Sciences, Brock University, St. Catharines, ON L2S 3A1, Canada
3
Cool Climate Oenology and Viticulture Institute, Brock University, St. Catharines, ON L2S 3A1, Canada
*
Author to whom correspondence should be addressed.
Fermentation 2019, 5(4), 93; https://doi.org/10.3390/fermentation5040093
Submission received: 11 October 2019 / Revised: 25 October 2019 / Accepted: 28 October 2019 / Published: 30 October 2019
(This article belongs to the Special Issue Yeast Biotechnology 3.0)

Abstract

:
The high concentration of sugars in Icewine juice causes formidable stress for the fermenting Saccharomyces cerevisiae, causing cells to lose water and shrink in size. Yeast can combat this stress by increasing the internal concentration of glycerol by activating the high osmolarity glycerol response to synthesize glycerol and by actively transporting glycerol into the cell from the environment. The H+/glycerol symporter, Stl1p, has been previously characterized as being glucose repressed and inactivated, despite osmotic stress induction. To further investigate the role of Stl1p in Icewine fermentations, we developed a rapid single plasmid CRISPR-Cas9-based genome editing method to construct a strain of the common Icewine yeast, S. cerevisiae K1-V1116, that lacks STL1. In an Icewine fermentation, the ∆STL1 strain had reduced fermentation performance, and elevated glycerol and acetic acid production compared to the parent. These results demonstrate that glycerol uptake by Stl1p has a significant role during osmotically challenging Icewine fermentations in K1-V1116 despite potential glucose downregulation.

Graphical Abstract

1. Introduction

Icewine is a signature sweet dessert wine that is fermented from the juice of naturally frozen grapes. Since much of the water in the grape is frozen at harvest, the pressed Icewine juice is highly concentrated in solutes such as sugars, organic acids, and nitrogenous compounds. For Icewine juice produced in the Niagara Peninsula of Ontario, Canada, the average sugar concentration for Vidal Icewine juice was reported at 39.3 Brix for 298 Icewine juice samples (approximately 450 g/L sugar) [1]. The high sugar concentration presents a significant osmotic stress for the fermenting Saccharomyces cerevisiae. High osmotic stress, commonly referred to as hyperosmotic stress, causes prolonged fermentation times, less than ideal alcohol yields, reduced biomass growth, and elevated levels of undesired metabolites [2,3]. The undesired metabolites, namely acetate, acetaldehyde, and ethyl acetate, indirectly arise because of the increased synthesis of glycerol, the primary compound responsible for the adaptation to hyperosmotic stress [4]. Synthesis of glycerol is a two-step process that involves the reduction and dephosphorylation of the glycolytic intermediate, dihydroxyacetone phosphate (DHAP). Glycerol synthesis is not redox neutral, as one equivalent of NADH (nicotinamide adenine dinucleotide (NAD+) + hydrogen (H)) is required per synthesized glycerol, resulting in the production of NAD+ [5,6]. Therefore, a second reaction is required to reduce the generated NAD+ back to NADH. The NADH generating step of glycolysis, the oxidation of glyceraldehyde 3-phosphate by glyceraldehyde 3-phosphate dehydrogenase, is balanced by coupling this step to alcoholic fermentation, where acetaldehyde is reduced to ethanol by alcohol dehydrogenase, regenerating NAD+ and making this a redox neutral process. Excess oxidation of NADH through glycerol synthesis can lead to a significant shift in the NAD+/NADH ratio [7]. Due to the importance of NADH for the reduction of acetaldehyde to ethanol, reduced levels of NADH relative to NAD+ causes insufficient acetaldehyde reduction, thus leading to elevated levels of acetaldehyde, and subsequently acetate, due to acetaldehyde oxidation by aldehyde dehydrogenases [7,8,9].
In addition to glycerol synthesis, yeast can also actively uptake glycerol from the extracellular environment [10]. One such transporter, Stl1p, is a plasma membrane H+/glycerol symporter. The proton-glycerol symport mechanism of Stl1p allows for extracellular glycerol to be imported against a concentration gradient, at the cost of H+ influx into the cell [11]. As the name STL (sugar transporter like) suggests, the protein is one of 34 sugar permeases in yeast and is part of the major facilitator superfamily (MFS) [12]. In laboratory yeast strains of S. cerevisiae, STL1 is reported as upregulated by salt-induced osmotic stress and repressed and inactivated by glucose, but glucose repression was overcome at high temperatures [11,13]. Previous gene expression analysis on the short-term hyperosmotic stress response in wine yeast to grape must inoculation revealed that STL1 was highly expressed between the first 10 and 30 minutes, before rapid downregulation to near undetectable levels [14]. Another gene expression analysis study found that STL1 expression upregulation was very low in S. cerevisiae wine yeast throughout table wine fermentations and in glucose-containing stress conditions [15]. Conversely, we have previously reported that STL1 is the most highly upregulated gene in S. cerevisiae K1-V1116 during osmotically challenging Icewine fermentations, with a 25-fold increase relative to that measured in table wine fermentation being seen on the fifth day of fermentation [16].
While gene expression analysis is a useful tool for identifying potential gene targets associated with a given phenotype, further investigation is often required to confirm protein function and phenotypic impact. Genetic modification is one such tool that can be used for gene function elucidation. Given the hyperosmotic conditions of Icewine, and the differences between laboratory yeast strains and wine yeast strains, constructing engineered wine yeast strains would be optimal for studying Icewine hyperosmotic stress condition responses [17,18,19]. While S. cerevisiae is amendable with existing genome editing techniques, primarily through the chromosomal integration of selectable markers in haploid auxotrophic strains, applying these techniques to industrially relevant diploid and polyploid strains, like wine yeasts, can be challenging and time-consuming [20,21]. Luckily, with the advent of CRISPR-Cas9 genome editing methods, yeast strain engineering has become rapid, efficient, and multiplexed [22,23]. At the time of this work, there has only been one other published study on the use of CRISPR-Cas9 for genome editing in wine yeasts. The work of Vigentini et al. (2017) used a double plasmid CRISPR-Cas9 method to eliminate CAN1, an arginine permease, in the popular wine yeast strains, EC-1118 and AWR1796, thus lowering urea production [24].
In this work, we developed a rapid and effective CRISPR-Cas9 genome editing method for the wine yeast S. cerevisiae strain, K1-V1116, which is commonly used for Icewine production. Using a single linearized CRISPR-Cas9 plasmid, that is repaired in vivo with a linear DNA fragment containing the target sequence of the sgRNA, we were able to construct a K1-V1116 strain featuring the complete removal of the STL1 open reading frame. Subsequent Icewine fermentations were conducted with K1-V1116 and K1-V1116 ∆STL1 strain. The reduced fermentation performance, along with increased glycerol and acetic acid production per gram of sugar consumed, of the ∆STL1 strain, provides further evidence that Stl1p contributes to the osmotolerance of K1-V1116 during Icewine fermentations, despite the high concentration of glucose.

2. Materials and Methods

2.1. Yeast Strains and Media

The commercial wine yeast used in this work was S. cerevisiae K1-V1116 (Lallemand, Montreal, QC, Canada). K1-V1116 strains were propagated using YPD (0.5% (w/v) Yeast Extract, 1% (w/v) Peptone, and 2% (w/v) Dextrose), unless otherwise stated. For solid media, 1% (w/v) agar was added. For selection media geneticin (G418) (Teknova, Hollister, CA, USA) was supplemented on YPD plates at 200 µg mL−1.

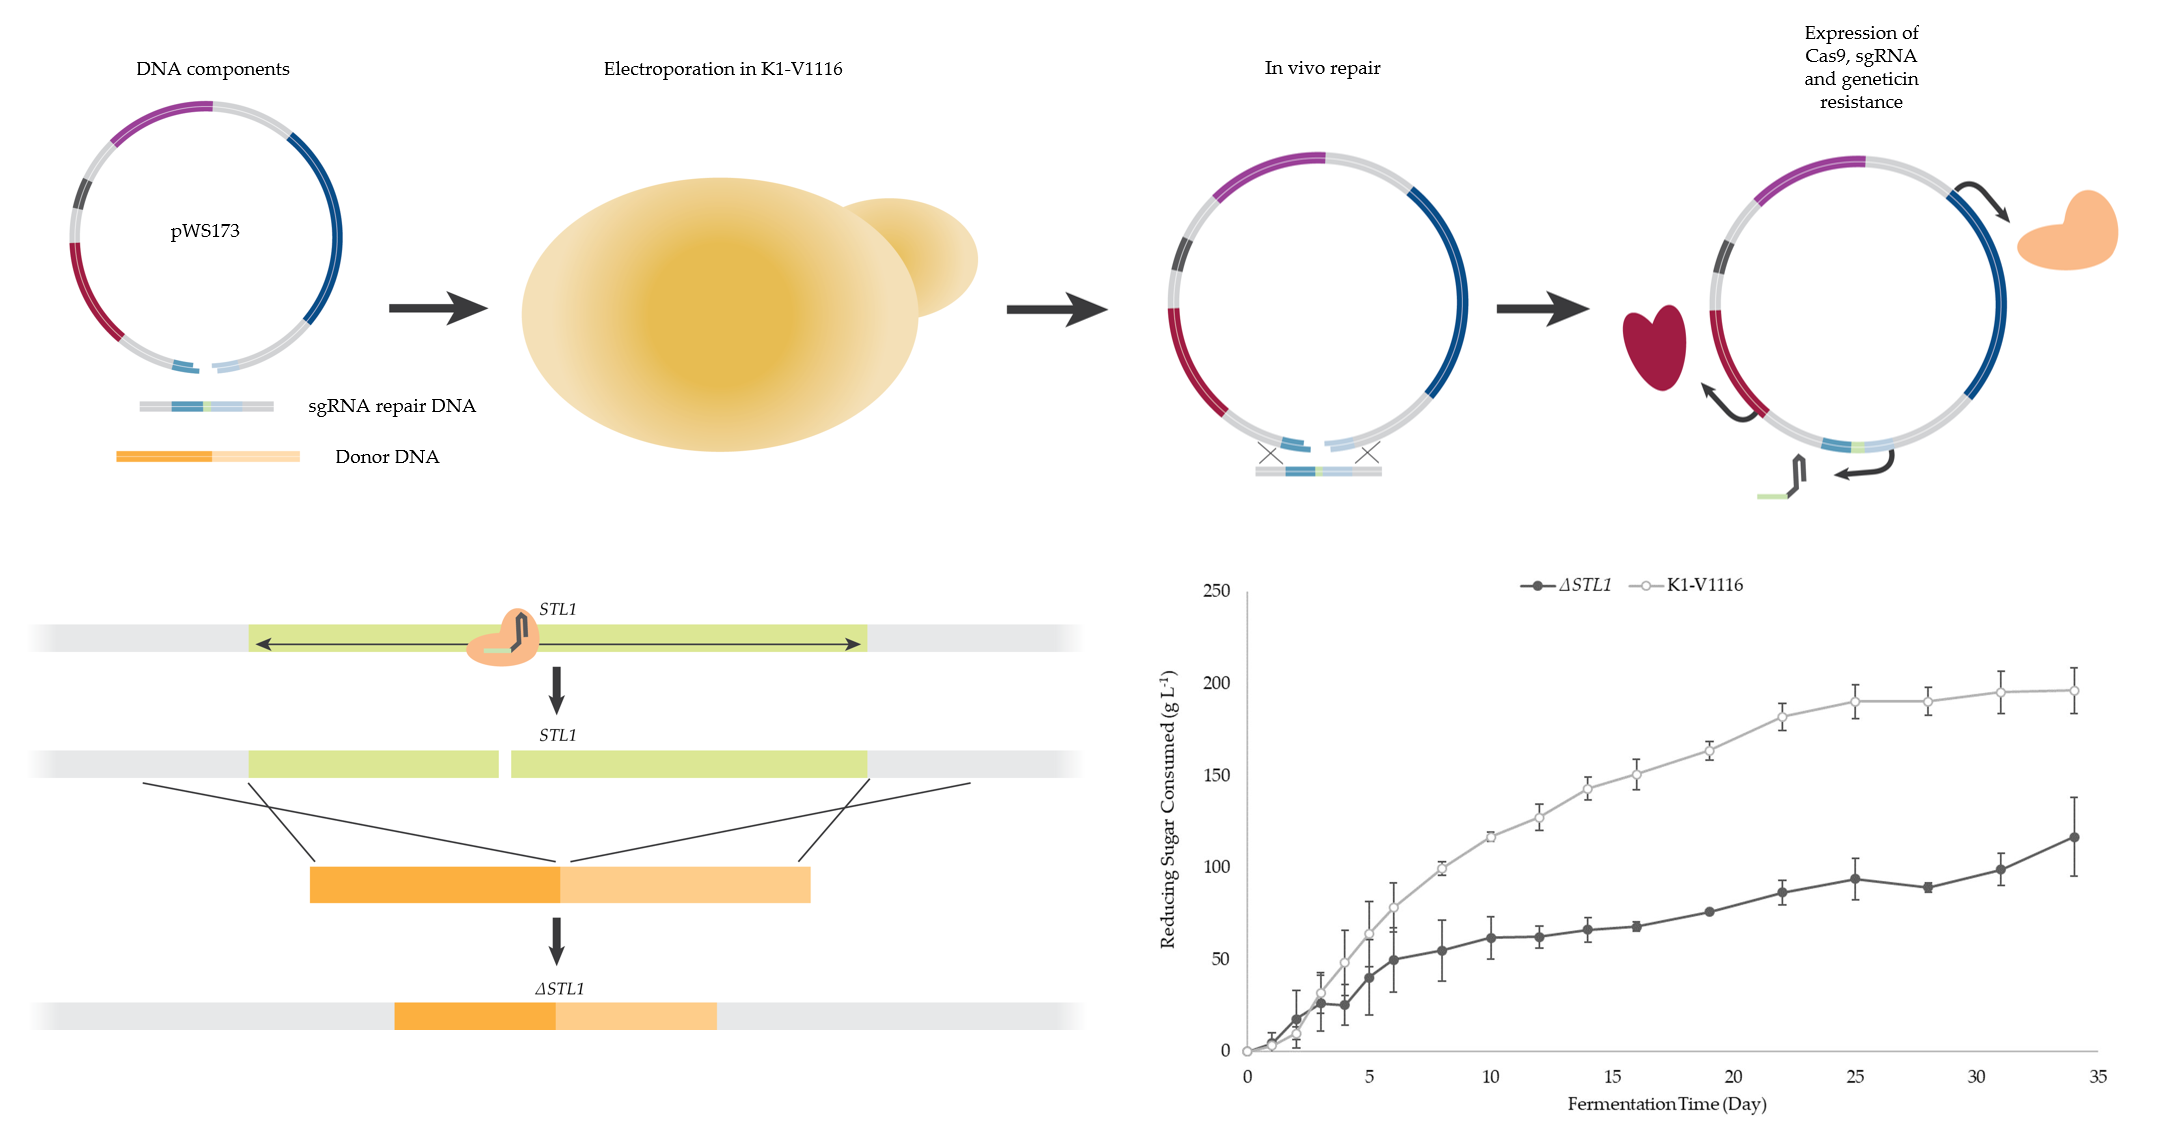
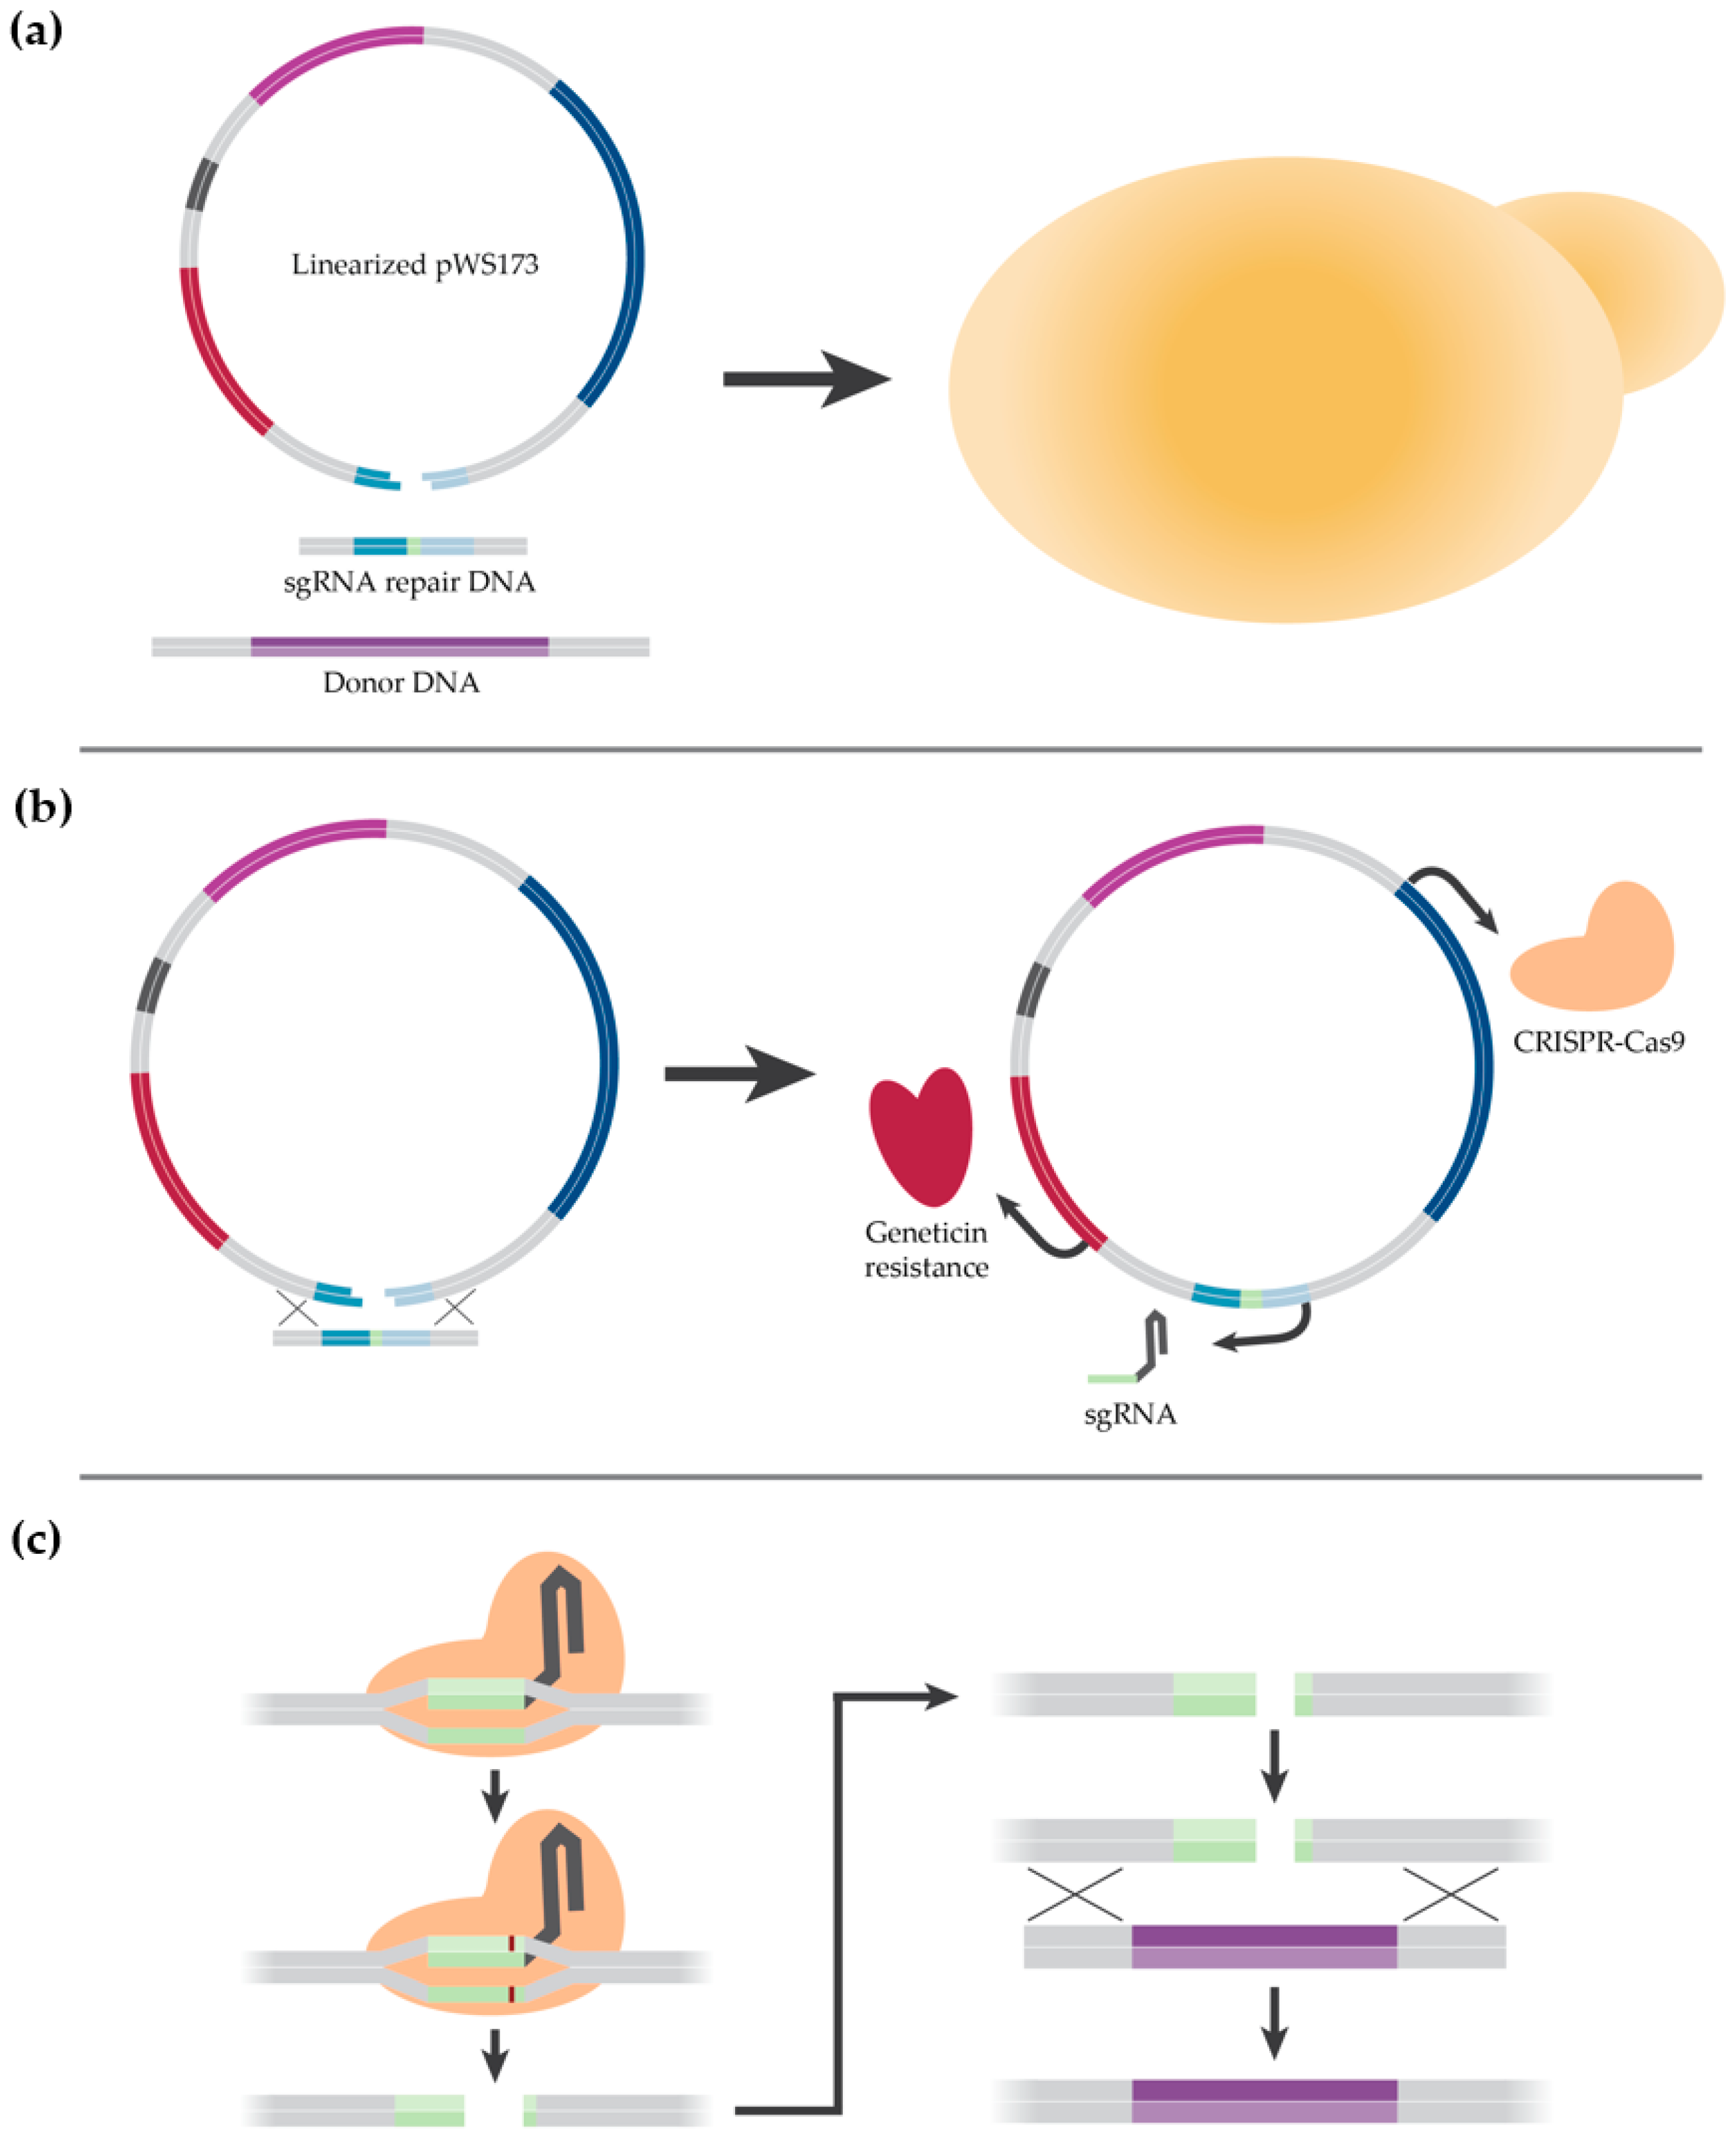
2.2. Description of CRISPR-Cas9 Method

The CRISPR-Cas9 method used in this work was built upon the work by the Tom Ellis lab [25]. The plasmid used, pWS173, contains cassettes for the yeast expression of both Cas9 and sgRNA (Figure 1). The yeast-optimized Cas9 contains a nuclear localization sequence and is driven by the PGK1 promoter. The optimized sgRNA cassette contains a yeast tRNA and 5’ HDV ribozyme and is flanked by 500 bp junk DNA homology arms. In pWS173, the sgRNA cassette contains a BsmBI-flanked GFP dropout for the 20 bp protospacer sequence required for targeted endonuclease activity. The method relies on the repair of a BsmBI linearized pWS173 with a 1.1 kb linear DNA fragment, which has the sgRNA cassette, with a 20 bp protospacer sequence, inserted within. The sgRNA repair DNA is generated using pWS173 as a template, with two PCR amplicons containing primer overhangs that encode for the protospacer sequence and the terminal sequence of the adjacent fragment. The two protospacer encoding amplicons are then assembled using overlap extension PCR, as described in Section 2.3. When the linearized plasmid, sgRNA repair DNA, and donor DNA are transformed into yeast, the homology arms on the sgRNA repair DNA and pWS173 are recognized and the plasmid is circularized (Figure 2a). The circularization of the plasmid restores its functionality, offering G418 resistance and expression of CRISPR-Cas9 and the active sgRNA species (Figure 2b).

2.3. Cloning

The plasmid used in this work, pWS173, was a gift from Tom Ellis (Addgene plasmid # 90960). Plasmids were propagated in NEB Stable Competent Escherichia coli (New England Biolabs), under the selection of LB (1% (w/v) Tryptone, 0.5% (w/v) Yeast Extract, 1% (w/v) Sodium Chloride) supplemented with 50 µg mL−1 kanamycin (Tocris Biosciences, Bristol, UK). The plasmid was isolated using QIAprep Spin Miniprep (Qiagen, Hilden, Germany), linearized using BsmBI (New England Biolands, Ipswich, MA, USA) and used without gel extraction. The sequences from EC-1118 [26] were used in place of K1-V1116 for all construct and primer design purposes, since the sequence of EC-1118 was available on the Ensembl genome browser. Benchling (San Francisco, CA, USA) was used for plasmid and construct design. The target sequence for CRISPR-Cas9 sgRNA, used in K1-V1116, was designed using the Benchling CRISPR tool, with the default parameters for the NGG PAM single guide RNA for Cas9. The R64-1-1 S. cerevisiae reference genome was used for off-target analysis. The target sequence used can be found in Table A1. Donor DNA and sgRNA repair DNA was synthesized using 2-part overlap extension PCR, using Q5 polymerase (New England Biolands, Ipswich, MA, USA) and the primers in Table A2. An initial annealing temperature of 55 °C was used for most PCR reactions, with the temperature adjusted empirically to resolve low yield reactions. An extension time of 15 second per kb and 35 cycles was used for all PCRs. For overlap extension PCR, 0.5 µL of the PCR mix each fragment was used as templates in a 50 µL reaction. Genomic DNA was isolated and purified from K1-V1116 using the Fungi/Yeast Genomic DNA Isolation Kit (Norgen Biotek, Thorold, ON, Canada). PCR amplified DNA was purified using QIAquick Gel Extraction Kit (Qiagen, Hilden, Germany). DNA was quantified using a NanoDrop Lite Spectrophotometer (ThermoFisher, Waltham, MA, USA). PCR amplicons were visualized using 1% agarose-TAE (40 mM Tris, 20 mM acetate, and 1 mM EDTA), containing 0.003% (v/v) RedSafe nucleic acid staining solution (iNtRON Biotechnology, Seongnam, Korea).

2.4. Strain Construction

The S. cerevisiae strain, K1-V1116, was transformed using a modified electroporation protocol, which was largely based off the protocol described by DiCarlo et al. (2013) [27]. A colony of K1-V1116 was inoculated into 5.5 mL of YPD. The culture was then incubated overnight at 30 °C in a roller drum. The following day, the culture was centrifuged at 8000 G for 1 min in a microcentrifuge. The media was removed, and the pellets were resuspended in 250 µL of room-temperature water and consolidated into a single tube. The cells were washed twice more, using 1 mL of water, and then resuspended in 1.5 mL of 500 mM lithium acetate with 5 mM of dithiothreitol (DTT) before being incubated for 30 min at 30 °C in a roller drum. Following conditioning, the cells were collected by centrifugation and washed twice with 1.5 mL of ice-cold electroporation buffer (1 M sorbitol and 1 mM calcium chloride). The final cell pellet was then resuspended in 950 µL of ice-cold electroporation buffer and kept on ice. For each transformation, 100 µL of cells were mixed with linearized pWS173 plasmid, sgRNA repair DNA, and donor DNA. The mixture was then transferred to an ice cold 0.2 cm gap electroporation cuvette and electroporated at 2.5 kV, 25 µF, and 200 Ω. The electroporated cells were recovered in 900 µL of room-temperature recovery media (0.5 M sorbitol and 0.5x YPD) and incubated for 4 h at 30 °C in a roller drum. After recovery, 50 µL of culture was plated onto YPD, supplemented with 200 µg mL−1 G418 (geneticin) and incubated at 30 °C for 24 to 48 h. The remaining recovered culture was saved at 4 °C and plated again if required. Integration events were confirmed with colony PCR using Q5 polymerase (New England Biolabs, Ipswich, MA, USA). To obtain colony PCR DNA, a single colony was mixed into 25 µL of 20 mM sodium hydroxide and boiled at 90 °C for 10 min. PCR products were visualized using agarose gel electrophoresis, as described in Section 2.2.

2.5. Icewine Juice

Vidal Icewine juice was previously acquired from Huebel Grape Estates in Niagara-on-the-Lake, Ontario, Canada and stored at −35 °C until use. The Icewine juice was thawed at 7 °C for 24 h, before being racked off and filtered through a series of coarse, medium, and fine pore size pad filters using the Bueno Vino Mini Jet filter (Vineco, St. Catharines, ON, Canada). The juice was then filter sterilized using 0.45 µm membrane cartridge (Millipore, Etobicoke, ON, Canada). The final sterile filtered Icewine juice (40.2 Brix) was used for Icewine fermentations. The sterile filtered Icewine juice contained 447 g L−1 sugar, pH 3.79, titratable acidity of 7.0 g L−1 tartaric acid, glycerol at 8.67 g L−1, acetic acid at 0.06 g L−1 and yeast assimilable nitrogen (YAN) at 441 mg N L−1.

2.6. Permissive Condition Growth Kinetics Characterization

Permissive condition growth kinetics characterization was conducted aerobically in YPD liquid media at 30 °C in an orbital shaker. In a sterile bottle with a stir bar, 250 mL of YPD was added, along with 450 mg of yeast cells from an agar plate, for each strain. This culture was stirred for 5 min on a stir plate and then was sampled into 75 mL aliquots in 250 mL Erlenmeyer flasks with sponge stoppers. The flasks were then placed in an orbital incubator set to 120 RPM and 30° C, and were sampled every two hours. Optical density at 600 nm (OD600) values were obtained using a Genesys 10S UV-Vis Spectrometer (Thermo Scientific, Waltham, MA, USA) set to 600 nm in absorbance mode, with methacrylate cuvettes. Dilutions were made with sterile YPD as needed, to stay under a reading of 1.0. All readings were done in triplicate.

2.7. Icewine Fermentations and Samplings

The K1-V1116 strains used for fermentations were prepared as starter cultures. The starter culture consisted of filter sterilized Icewine juice diluted to 10 Brix, with an additional 2 g L−1 of diammonium phosphate (DAP). From YPD plates, four freshly cultured yeast colonies were collected and used to inoculate 100 mL of starter culture media. The culture was incubated until the cell concentration reached 2 × 10⁸ cells mL−1, or approximately 17 h, using a shaker table incubator set to 30 °C.
The starter culture was used to inoculate 1 L of Icewine juice to a final cell density of approximately 1 × 10⁷ cells mL−1. The fermentations were incubated at 17 °C for 34 days. Samples were taken every day between days 0 and 6, every other day between days 8 and 16, and every three days between days 19 and 34. Before sampling, the fermentations were stirred for 5 min to ensure homogeneity, after which 2 mL of the culture was taken. After centrifugation, the supernatant of the sample was transferred to a clean tube and stored at −35 °C for later metabolite analysis. The remaining cell pellet was used for total and viable cell counts using methylene blue on a hemocytometer. Larger 50 mL samples were taken from the initial juice and final wine and stored at −35 °C for later analysis. Colony PCR was conducted on the strains at the beginning and end of fermentation to verify the genotype. The fermentations were conducted in triplicate for each strain.

2.8. Metabolite Analysis

Soluble solids were determined by ABBE bench top refractometer (model 10450; American Optical, Buffalo, NY, USA). Acidity was determined by pH measurement using a sympHony pH meter (model B10P; VWR, Mississauga, ON, Canada), and titratable acidity by titration against 0.1 mol L−1 NaOH, to an endpoint of pH 8.2 [28]. Glucose, fructose, glycerol, acetic acid, amino nitrogen, and ammonia nitrogen were measured using Megazyme assay kits (K-FRUGL, K-ACET, K-GCROL, K-PANOPA, K-AMIAR; Megazyme International Ireland, Ltd., Bray, Co. Wicklow, Ireland). Ethanol was determined by gas chromatography (Model 6890; Agilent Technologies Inc., Palo Alto, CA, USA) equipped with a flame ionization detector (FID), split/split-less injector, and Chemstation software (version E.02.00.493). Separations were carried out with a DB®-WAX (30 m, 0.25 mm, 0.25 μm) GC column (122-7032 model; Agilent Technologies, Santa Clara, CA, USA) with helium as the carrier gas, at a flow rate of 1.5 mL min−1. Metabolite production during fermentation was calculated by the difference in the respective metabolite concentration measured between the time zero point (immediately after inoculation) and at each sampling time point throughout fermentations. Normalized metabolite production was determined by dividing the final metabolite production by the final sugar consumed.

2.9. Statistical Analysis

XLSTAT-Pro by Addinsoft (New York, NY, USA) was used for statistical analysis. Analysis of variance (ANOVA) with mean separation by Tukey’s Honest Significant Difference (p < 0.05) and Student’s t-Test (p < 0.05, p < 0.01, p < 0.001) were used to evaluate differences between variables.

3. Results

3.1. Development of a CRISPR-Cas9 Genome Editing Protocol for K1-V1116

3.1.1. K1-V1116 Drug Sensitivity Testing

To assess the selection potential of Geneticin (G418) for the isolation of successful transformants, the wild type resistance of K1-V1116 needed to be determined. Given the proven effectiveness of G418 in previous studies [23,27], a rapid approach was used to determine wild type sensitivity: 200 µL of stationary phase K1-V1116 cultured in YPD was plated onto a series of YPD plates with G418 (140, 280, 560, 710, and 850 µg mL−1) and incubated at 32 °C. After three days, only one colony appeared on the lowest concentration plate. As such, YPD with 200 µg mL−1 G418 was selected as the future selection media.

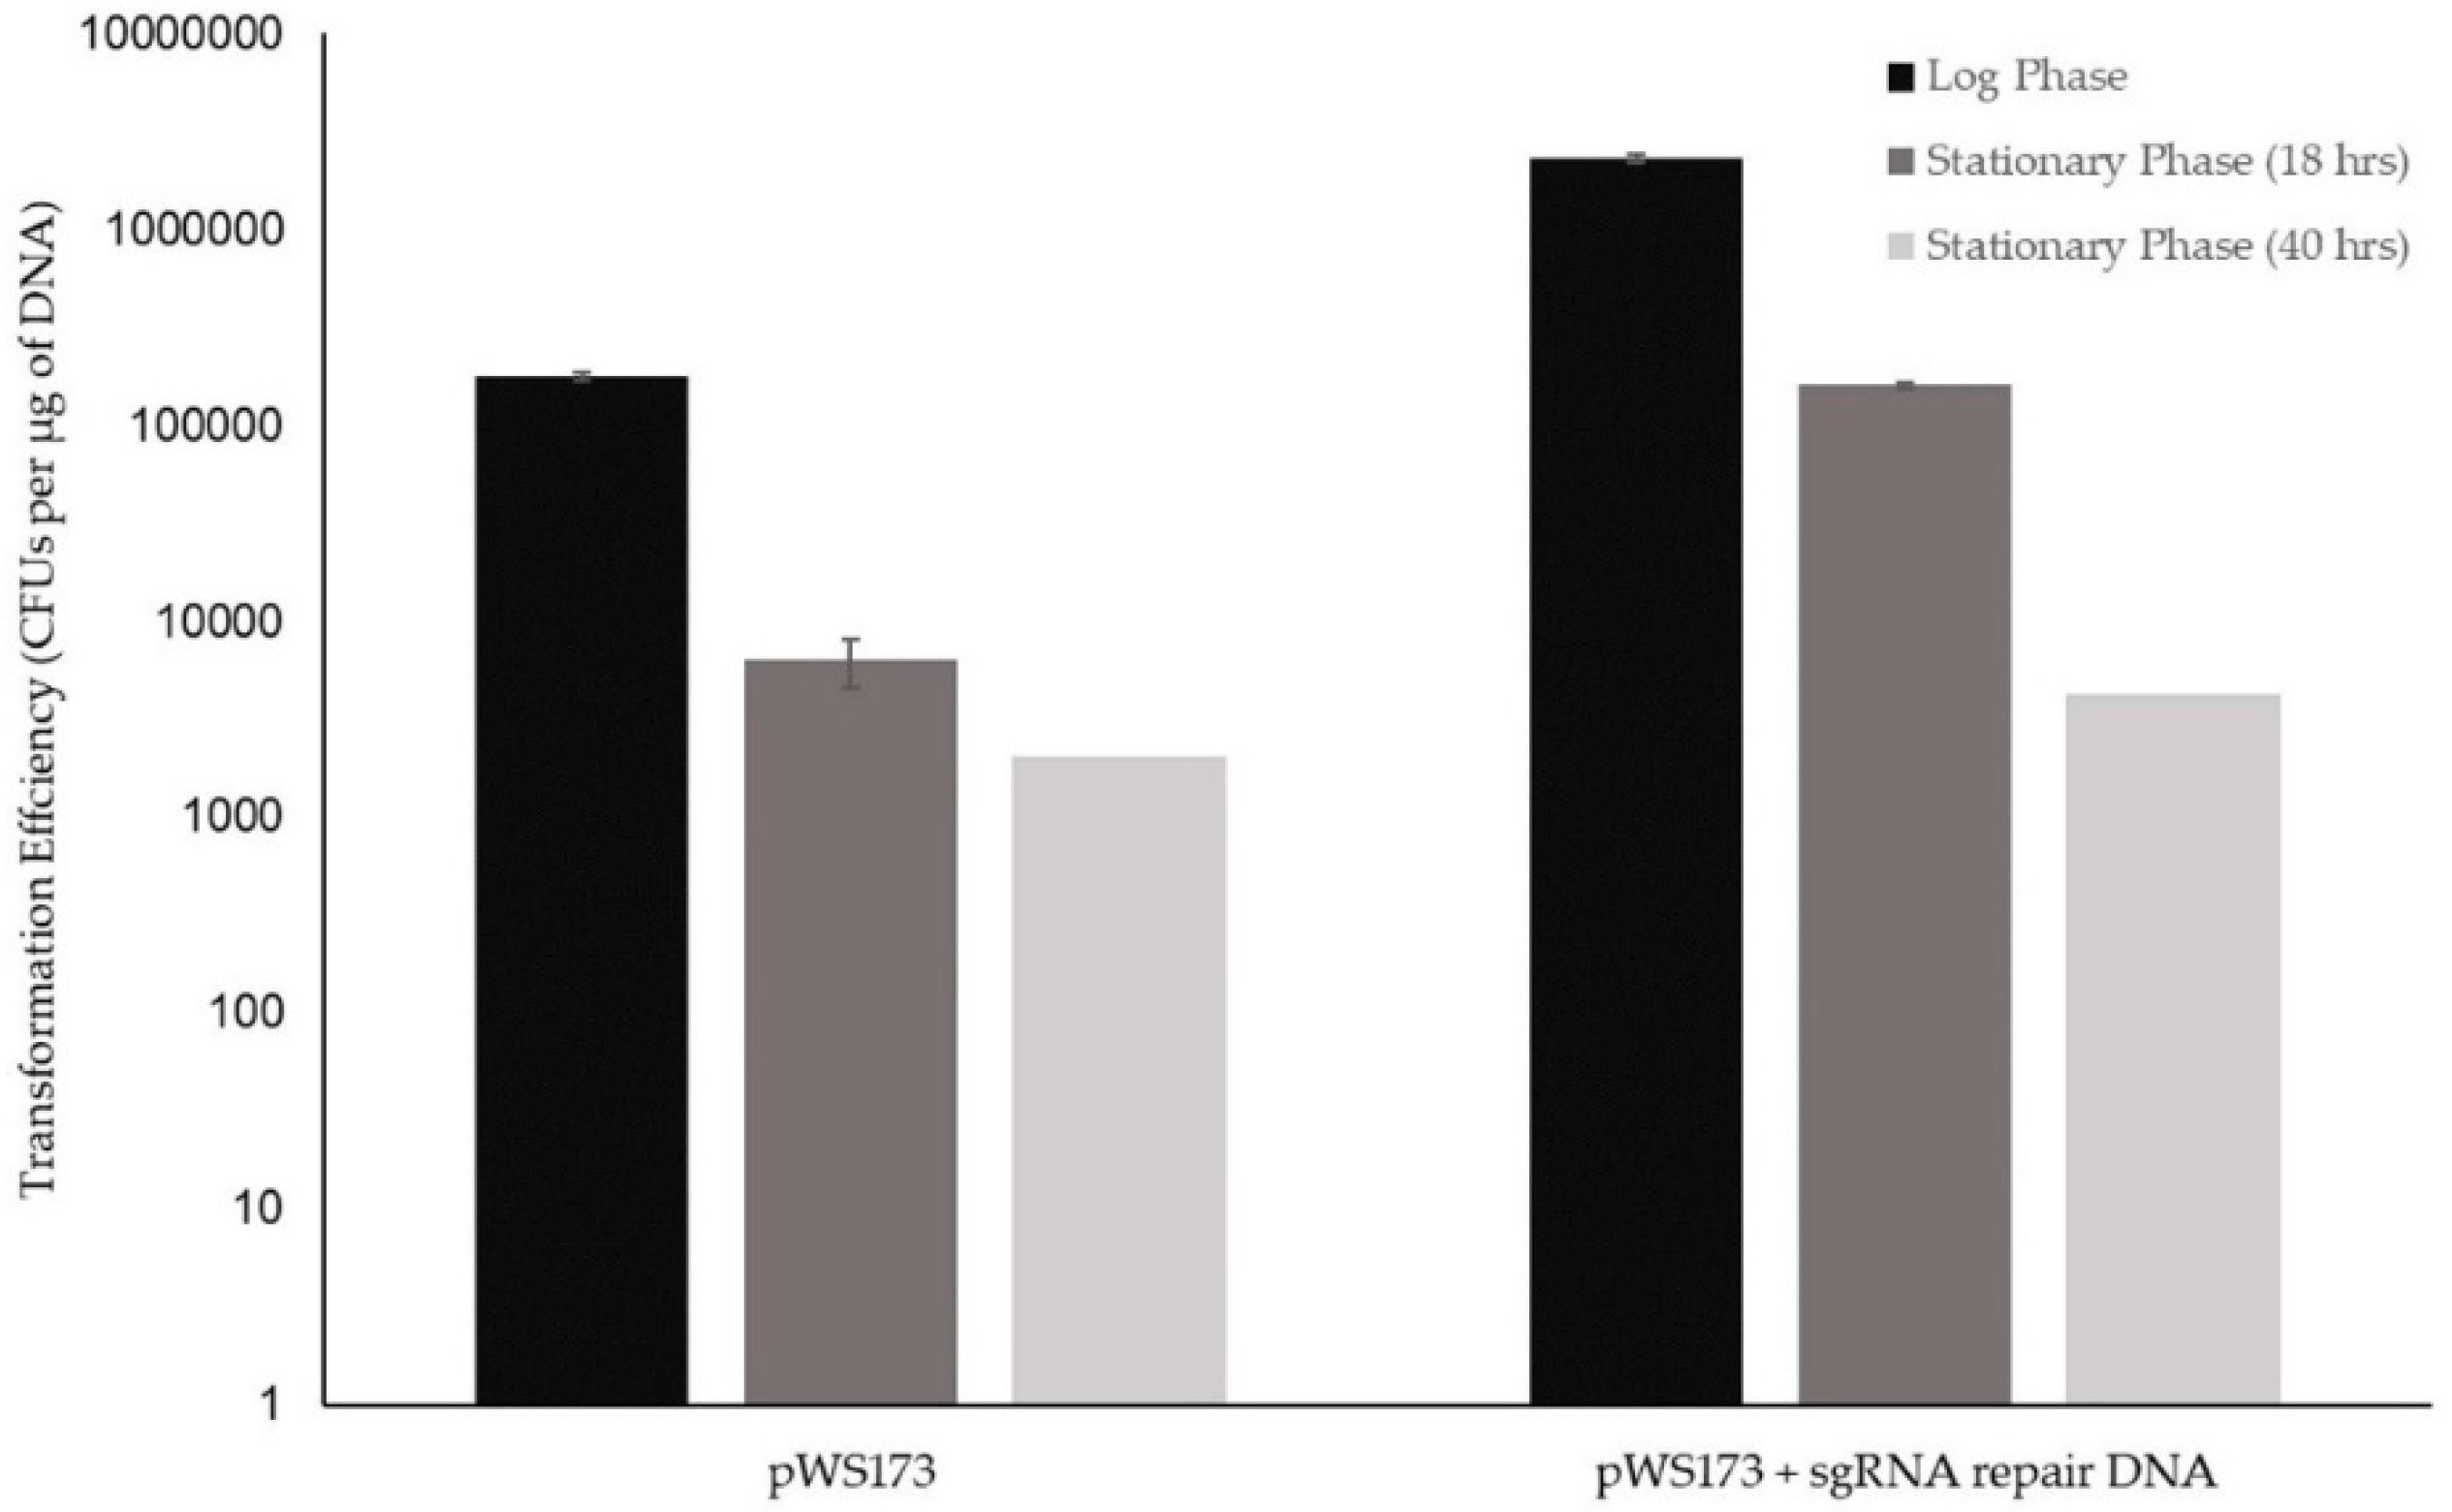
3.1.2. Initial K1-V1116 Transformations

The following step was to assess the G418 positive selection functionality of the intact and linearized pWS173, as well as validate the electroporation protocol developed. As the goal of this work was to develop a rapid and facile genome editing method, testing the use of stationary phase cultures as the source of cells for electroporation was desired. The use of stationary phase cultures would eliminate the need to monitor the OD600, allow for more schedule flexibility and reduce the hands-on time by over 5 h on the day of transformation. While convenient, the previously reported cost of using stationary phase yeast is reduced transformation efficiency, thus we needed to determine if using stationary phase culture would be a viable strategy for future strain construction [29,30]. Three YPD cultures of K1-V1116 were incubated at 32 °C in a roller drum until log phase (OD600 of 1.8), 18 h of growth, and 40 h of growth, until prepared and transformed with either 300 ng of non-linearized pWS173 or 300 ng of linearized pWS173 plus 1 µg of sgRNA repair DNA, which would produce a truncated, non-functional sgRNA (Figure 3).
There was a difference in transformation efficiency between the log phase culture, 18-hour culture, and 40-hour culture. For the repaired pWS173 plasmid, the transformation efficiency of the log phase culture was 14x greater than the 18-hour culture, and 541x greater than the 40-culture. Despite this difference, the 18-hour culture still achieved a transformation efficiency of 1.6 × 10⁵ ± 5.1 × 10³ CFUs per µg of DNA. The same trend of transformation efficiency between cell culture phases was shown using the intact pWS173. The transformation efficiency measured at each growth phase of the repaired pWS173 appears greater than that observed with the intact pWS173, although we cannot say if this difference is significant due to the experimental design. The transformation efficiency seen in the 18-hour culture was deemed acceptable for future strain construction given the isogenic goal of this work.

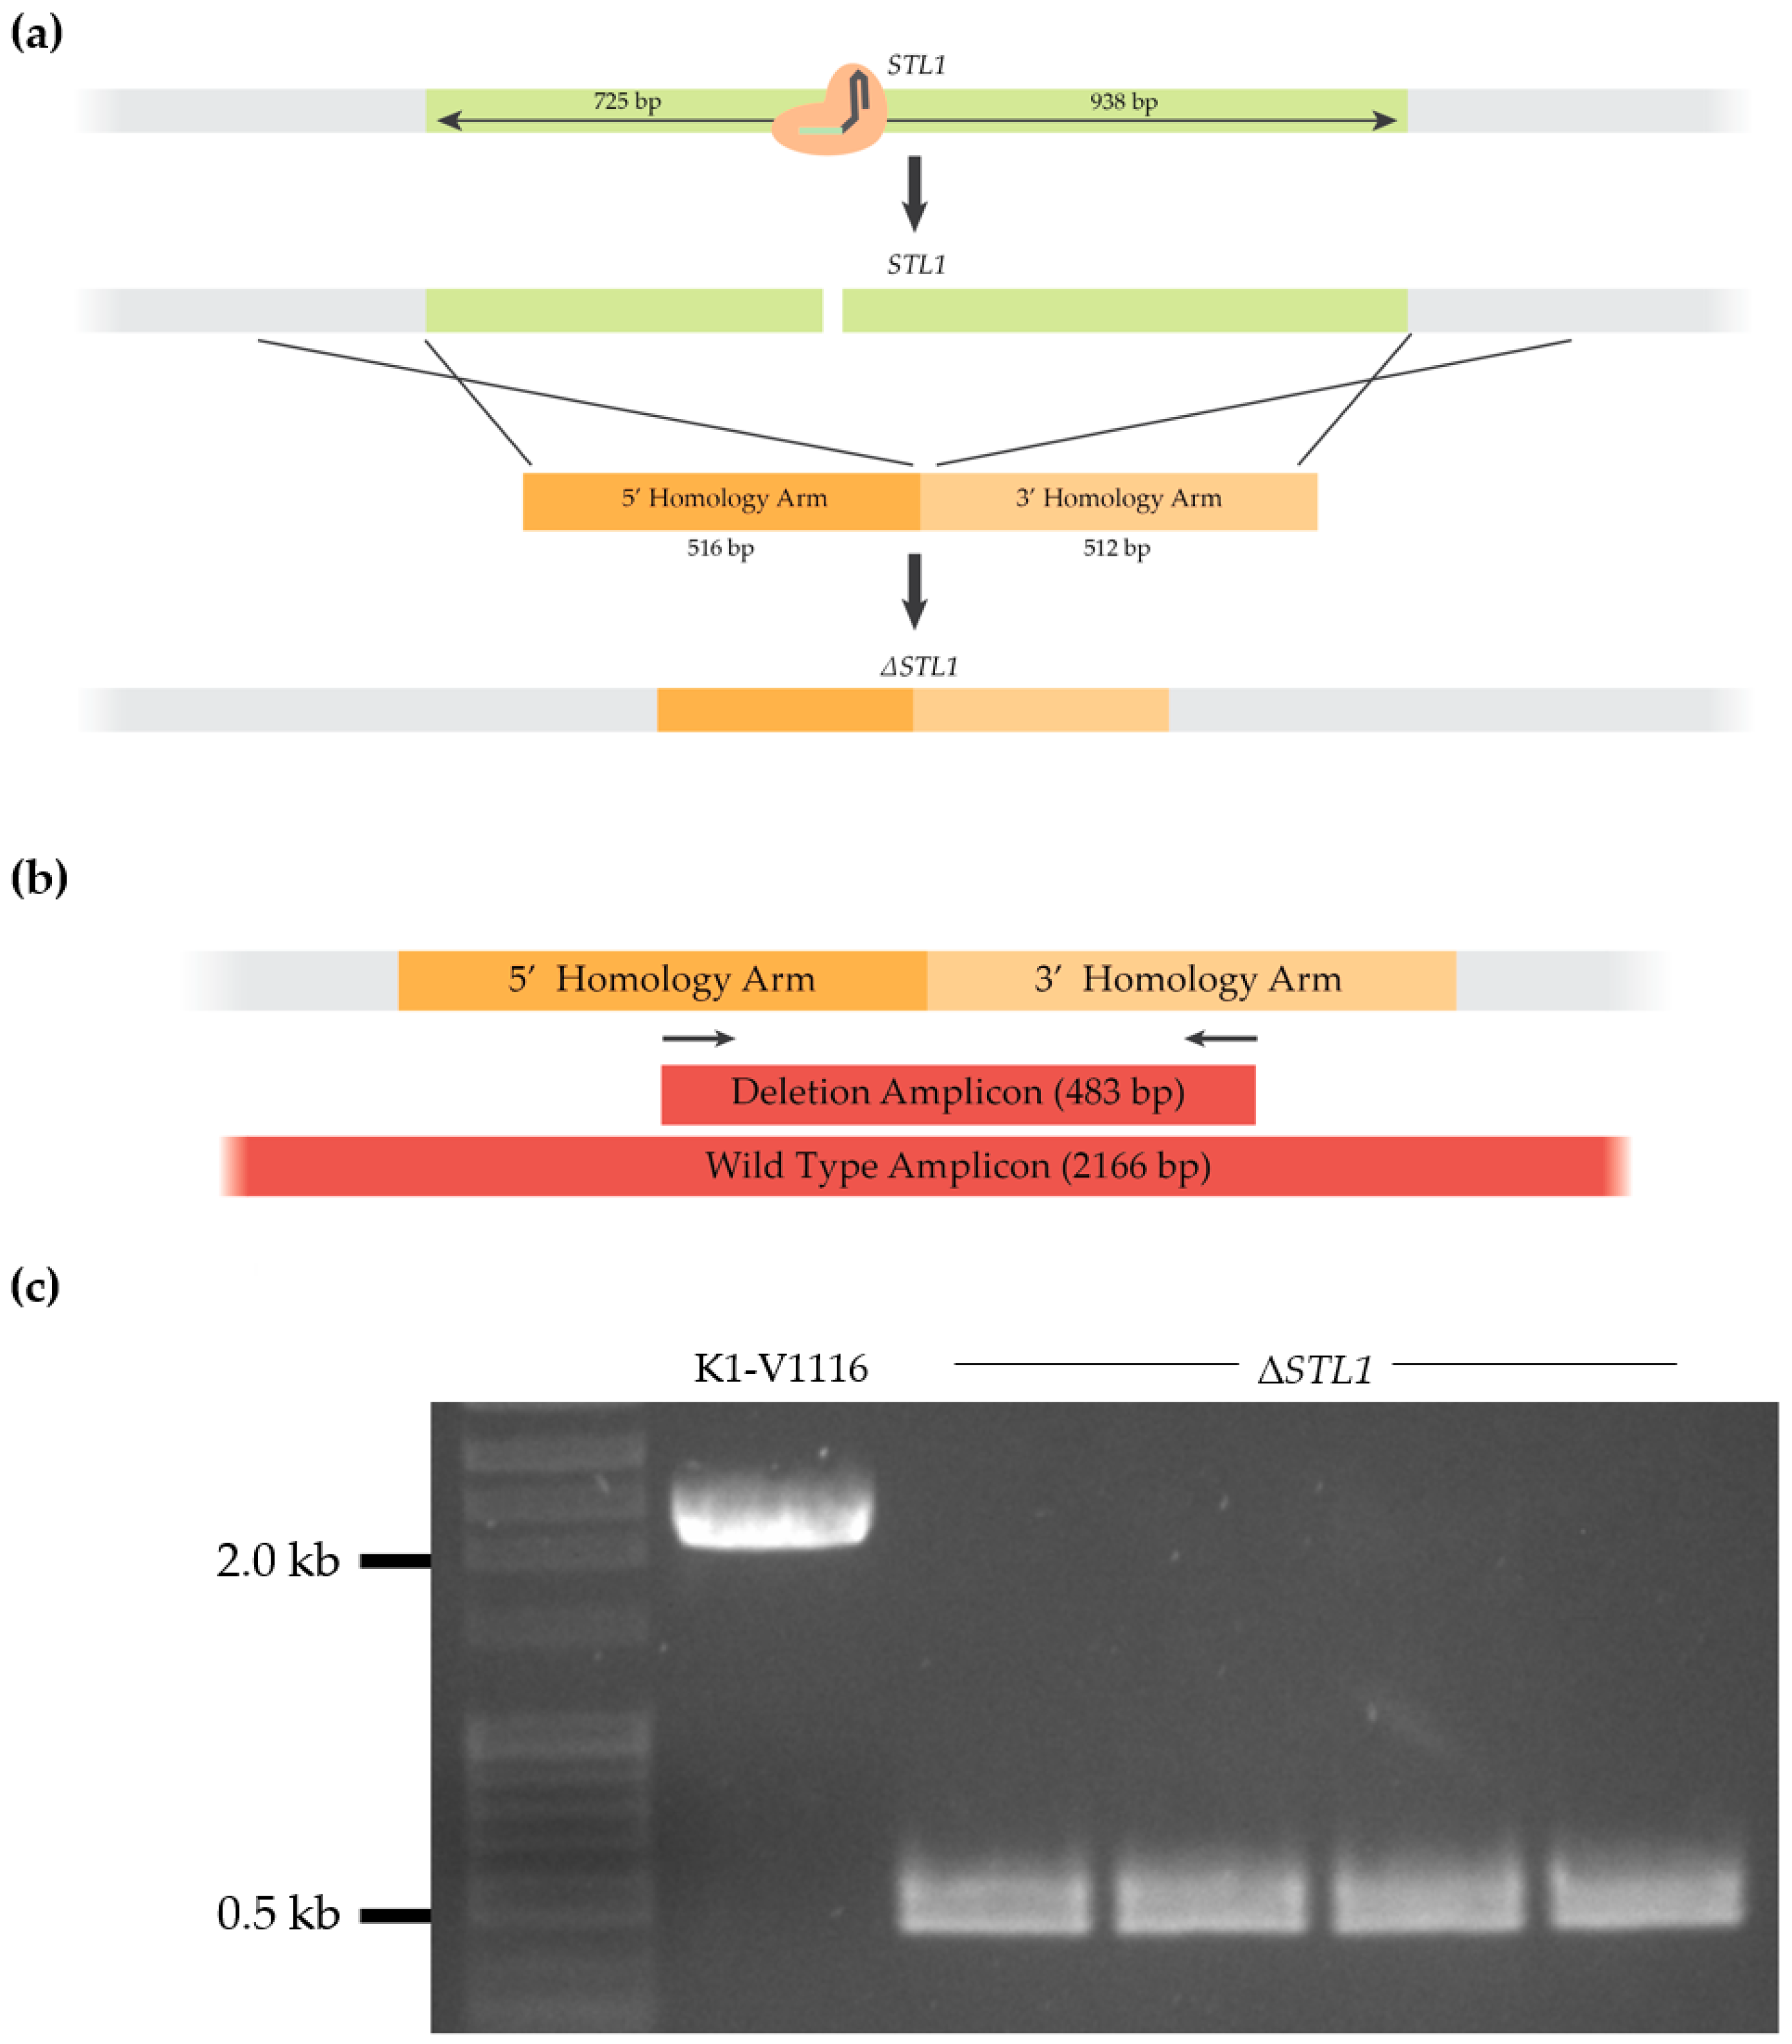
3.1.3. Construction of a K1-V1116 ∆STL1 Strain

Upon validation of the electroporation protocol and the G418 positive selection of the pWS173, K1-V1116 ∆STL1 was constructed. For this, the sgRNA repair DNA that contained a target sequence within the STL1 open reading frame was synthesized (Figure 4a). The donor DNA for homology-directed repair contained 500 bp homology arms, and would result in the deletion of the entire STL1 open reading frame (Figure 4b). K1-V1116 was transformed with 525 ng of linearized pWS173, 1 µg of sgRNA repair DNA, containing a target in STL1, and 1.3 µg of donor DNA. The transformation efficiency was 932 ± 62 CFUs per µg of DNA. Of four selected transformants, all four had the genotype which corresponded with the intended integration event (Figure 4c).
Further testing of an additional 15 transformants revealed that one isolate was a ∆STL1 heterozygote with an additional two transformants maintaining a wild type genotype, thus resulting in an overall homozygous editing efficiency of 84%. Eight transformants were streaked to single colonies on YPD with G418, followed by two more rounds on YPD, in order to eliminate pWS173. The final K1-V1116 ∆STL1 strain used for further testing was negative for pWS173.

3.2. ∆STL1 Growth Characterization in Permissive Conditions and Icewine Fermentations

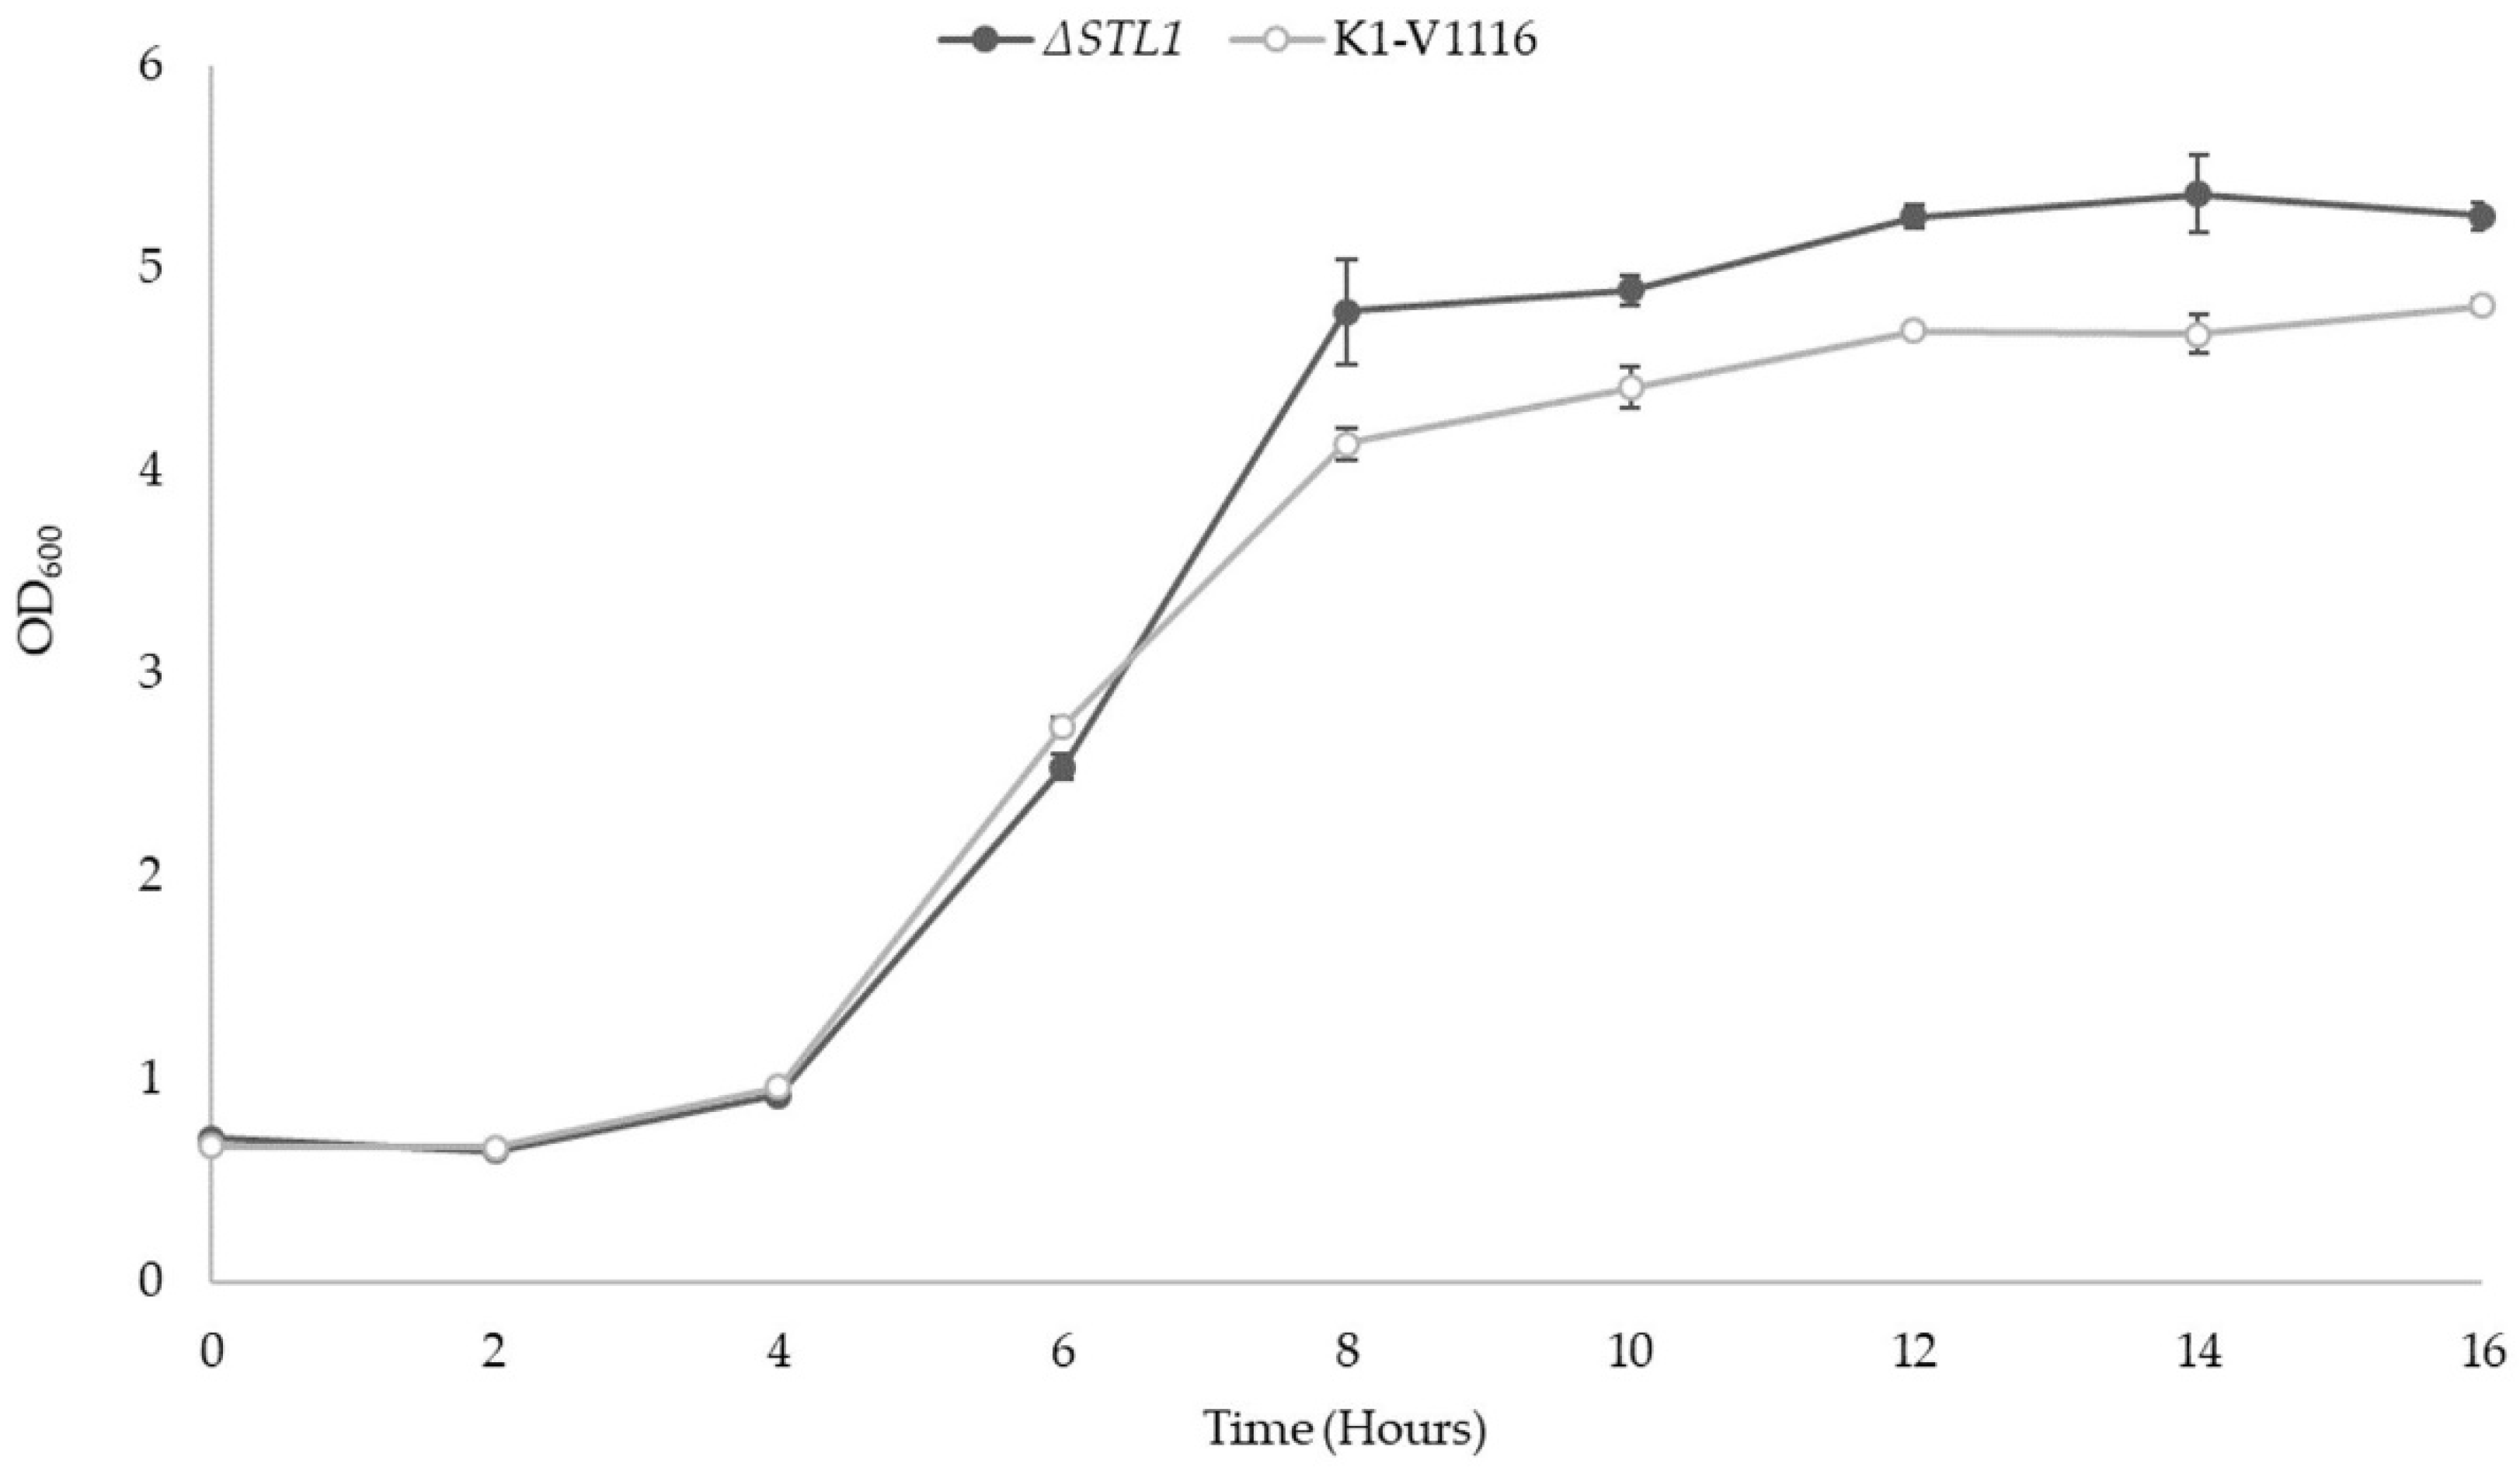
3.2.1. ∆STL1 Growth Kinetics in Permissive Conditions

To ensure that the modification to the ∆STL1 strain did not cause any unintended permissive growth defects, its growth kinetics were characterized in permissive conditions. As STL1 is reported as having remarkably low expression during conditions containing glucose, especially in absence of significant osmotic stress, this strain was expected to have a similar growth kinetic profile to the parent strain in YPD [11]. The YPD OD600 growth curve of K1-V1116 and K1-V1116 ∆STL1 did reveal similar growth kinetics between the two strains (Figure 5). Interestingly, K1-V1116 ∆STL1 consistently reached a slightly higher stationary phase OD600 value compared to K1-V1116.

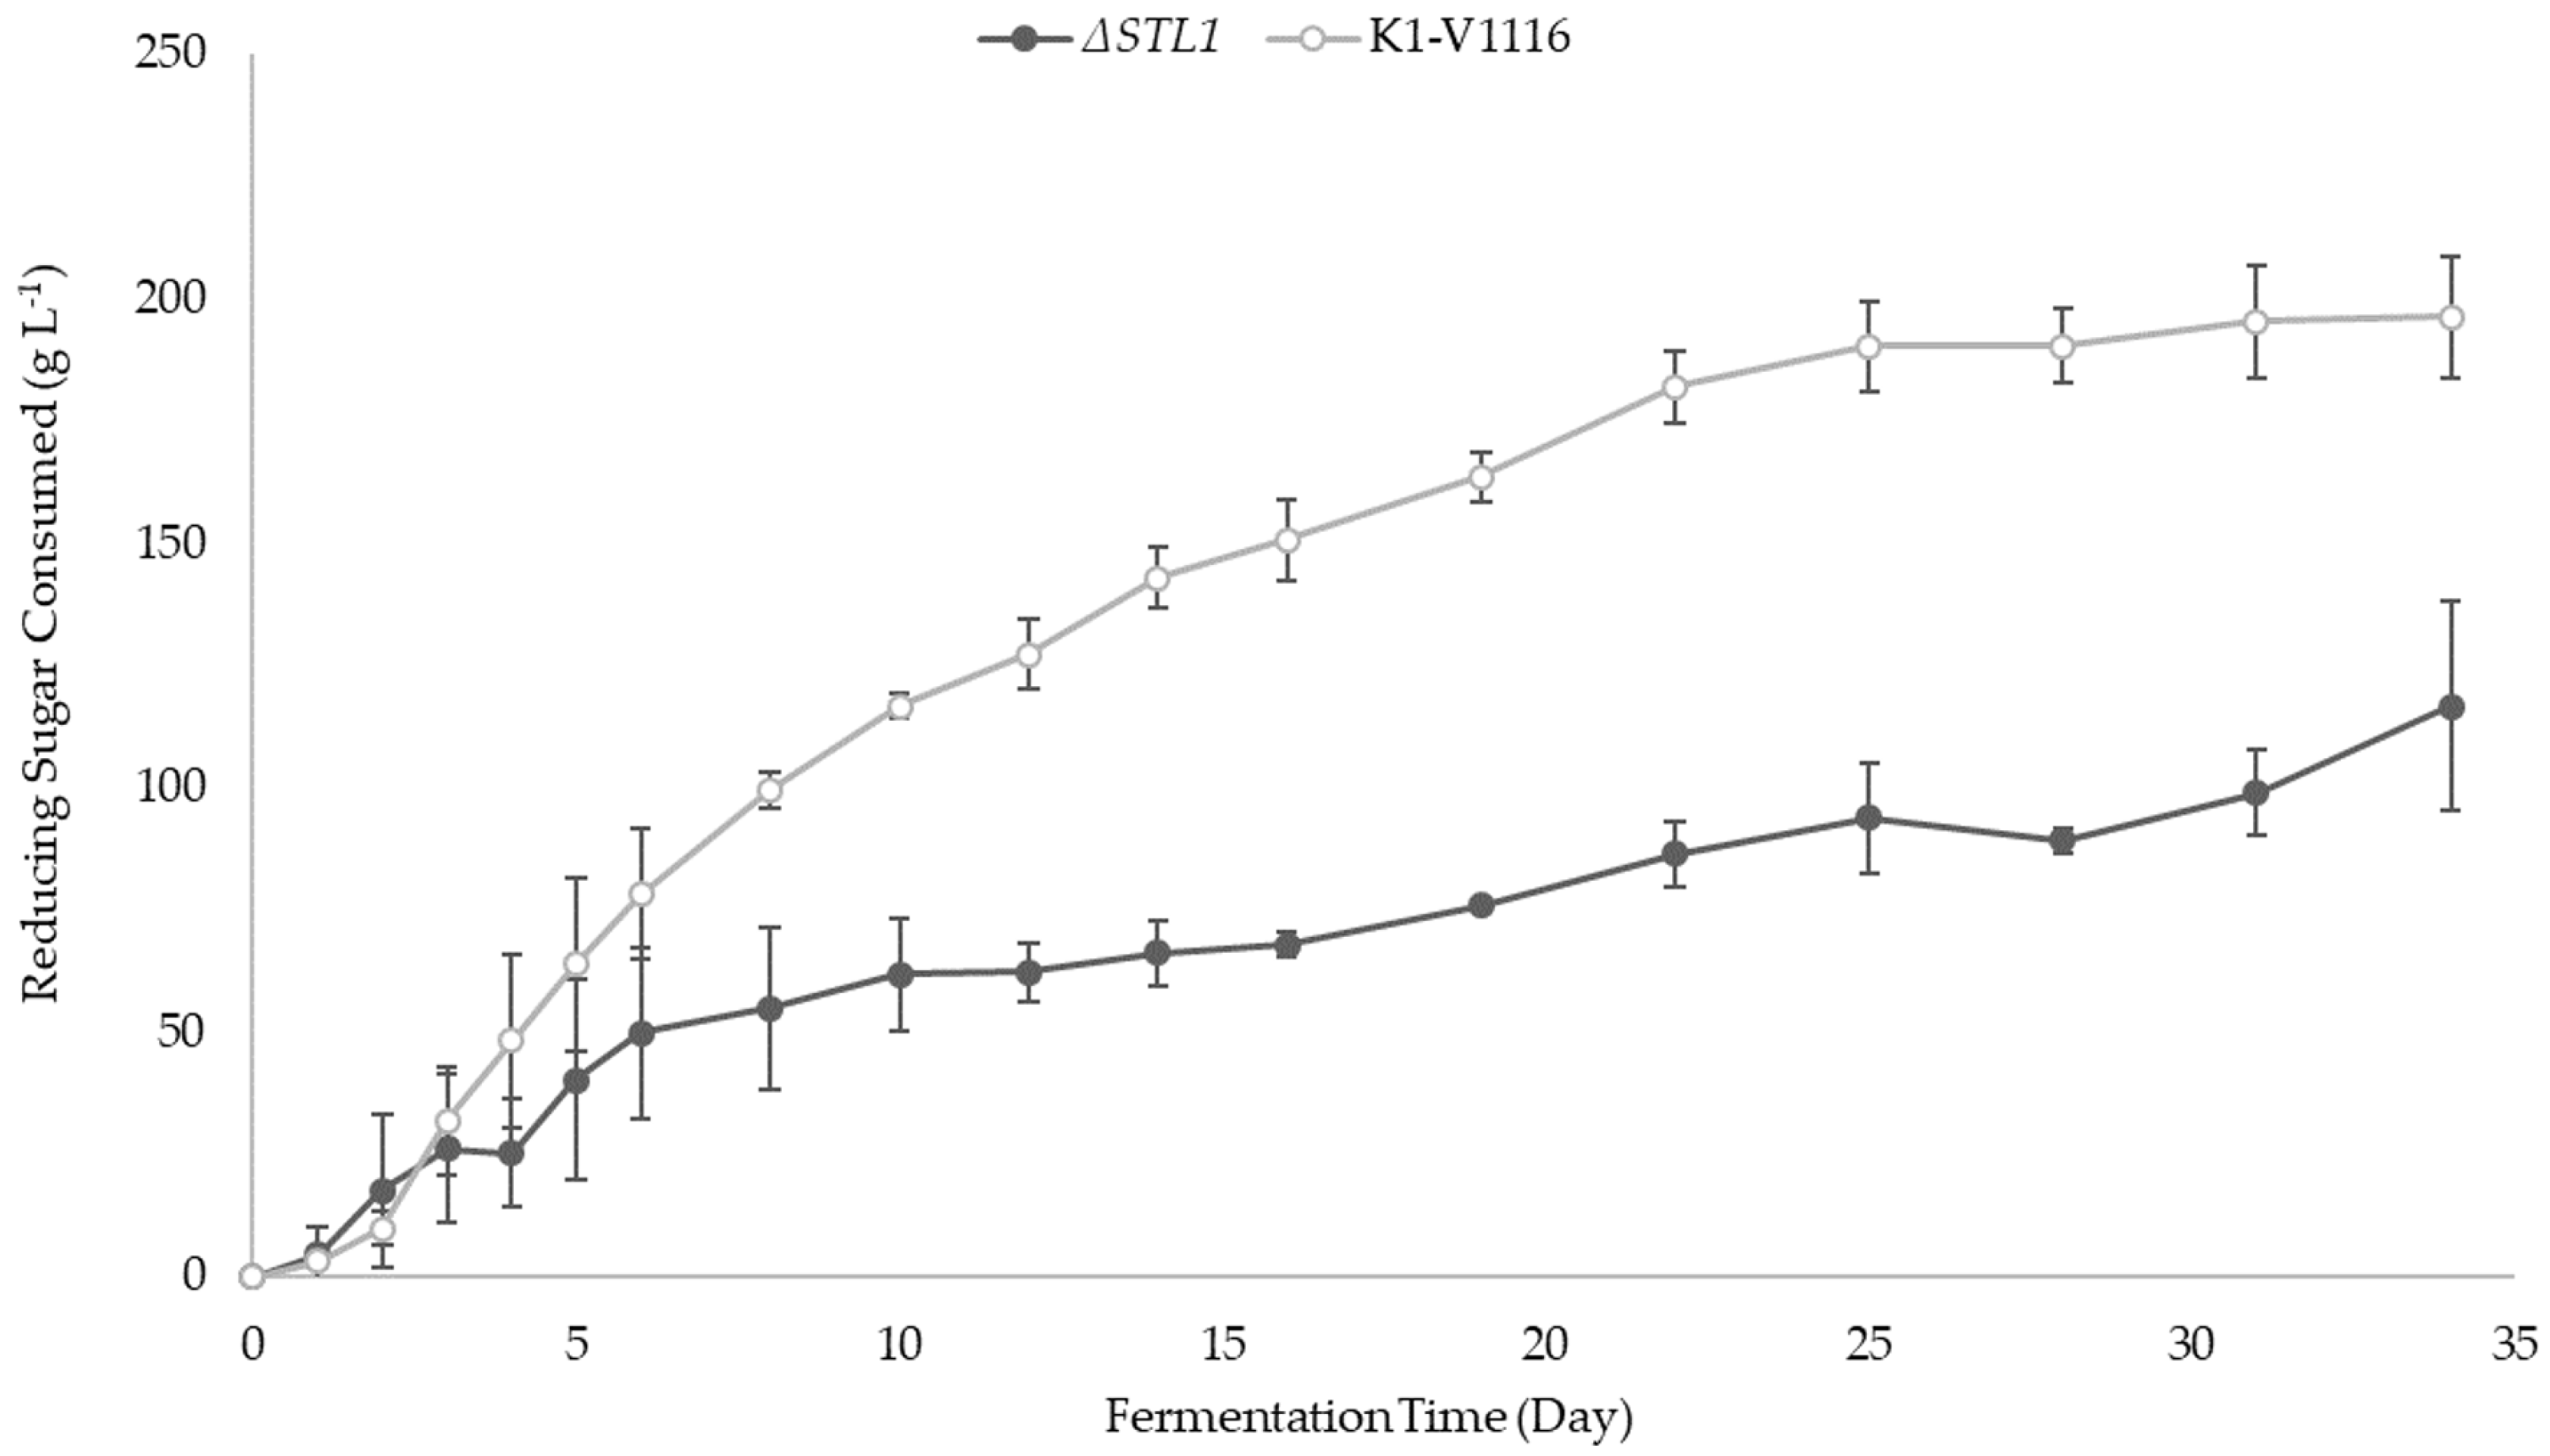
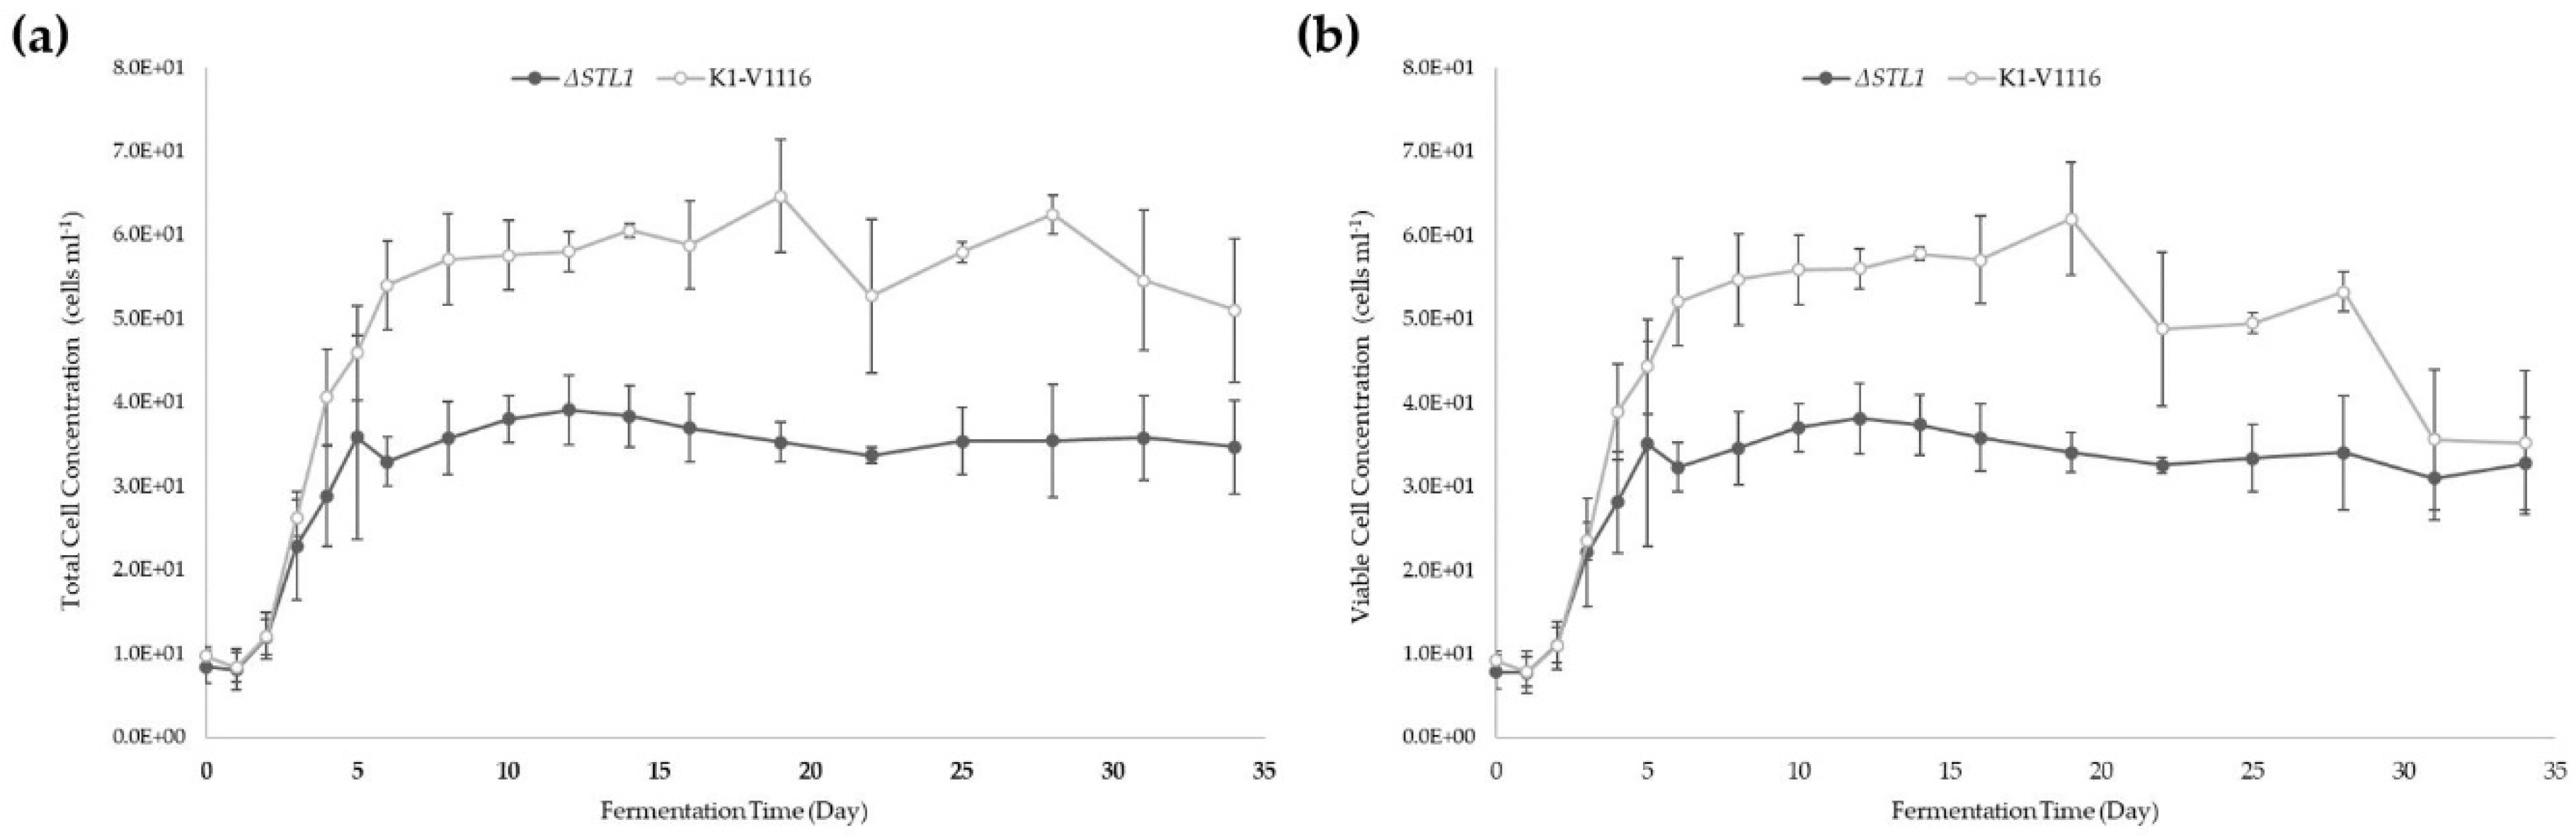
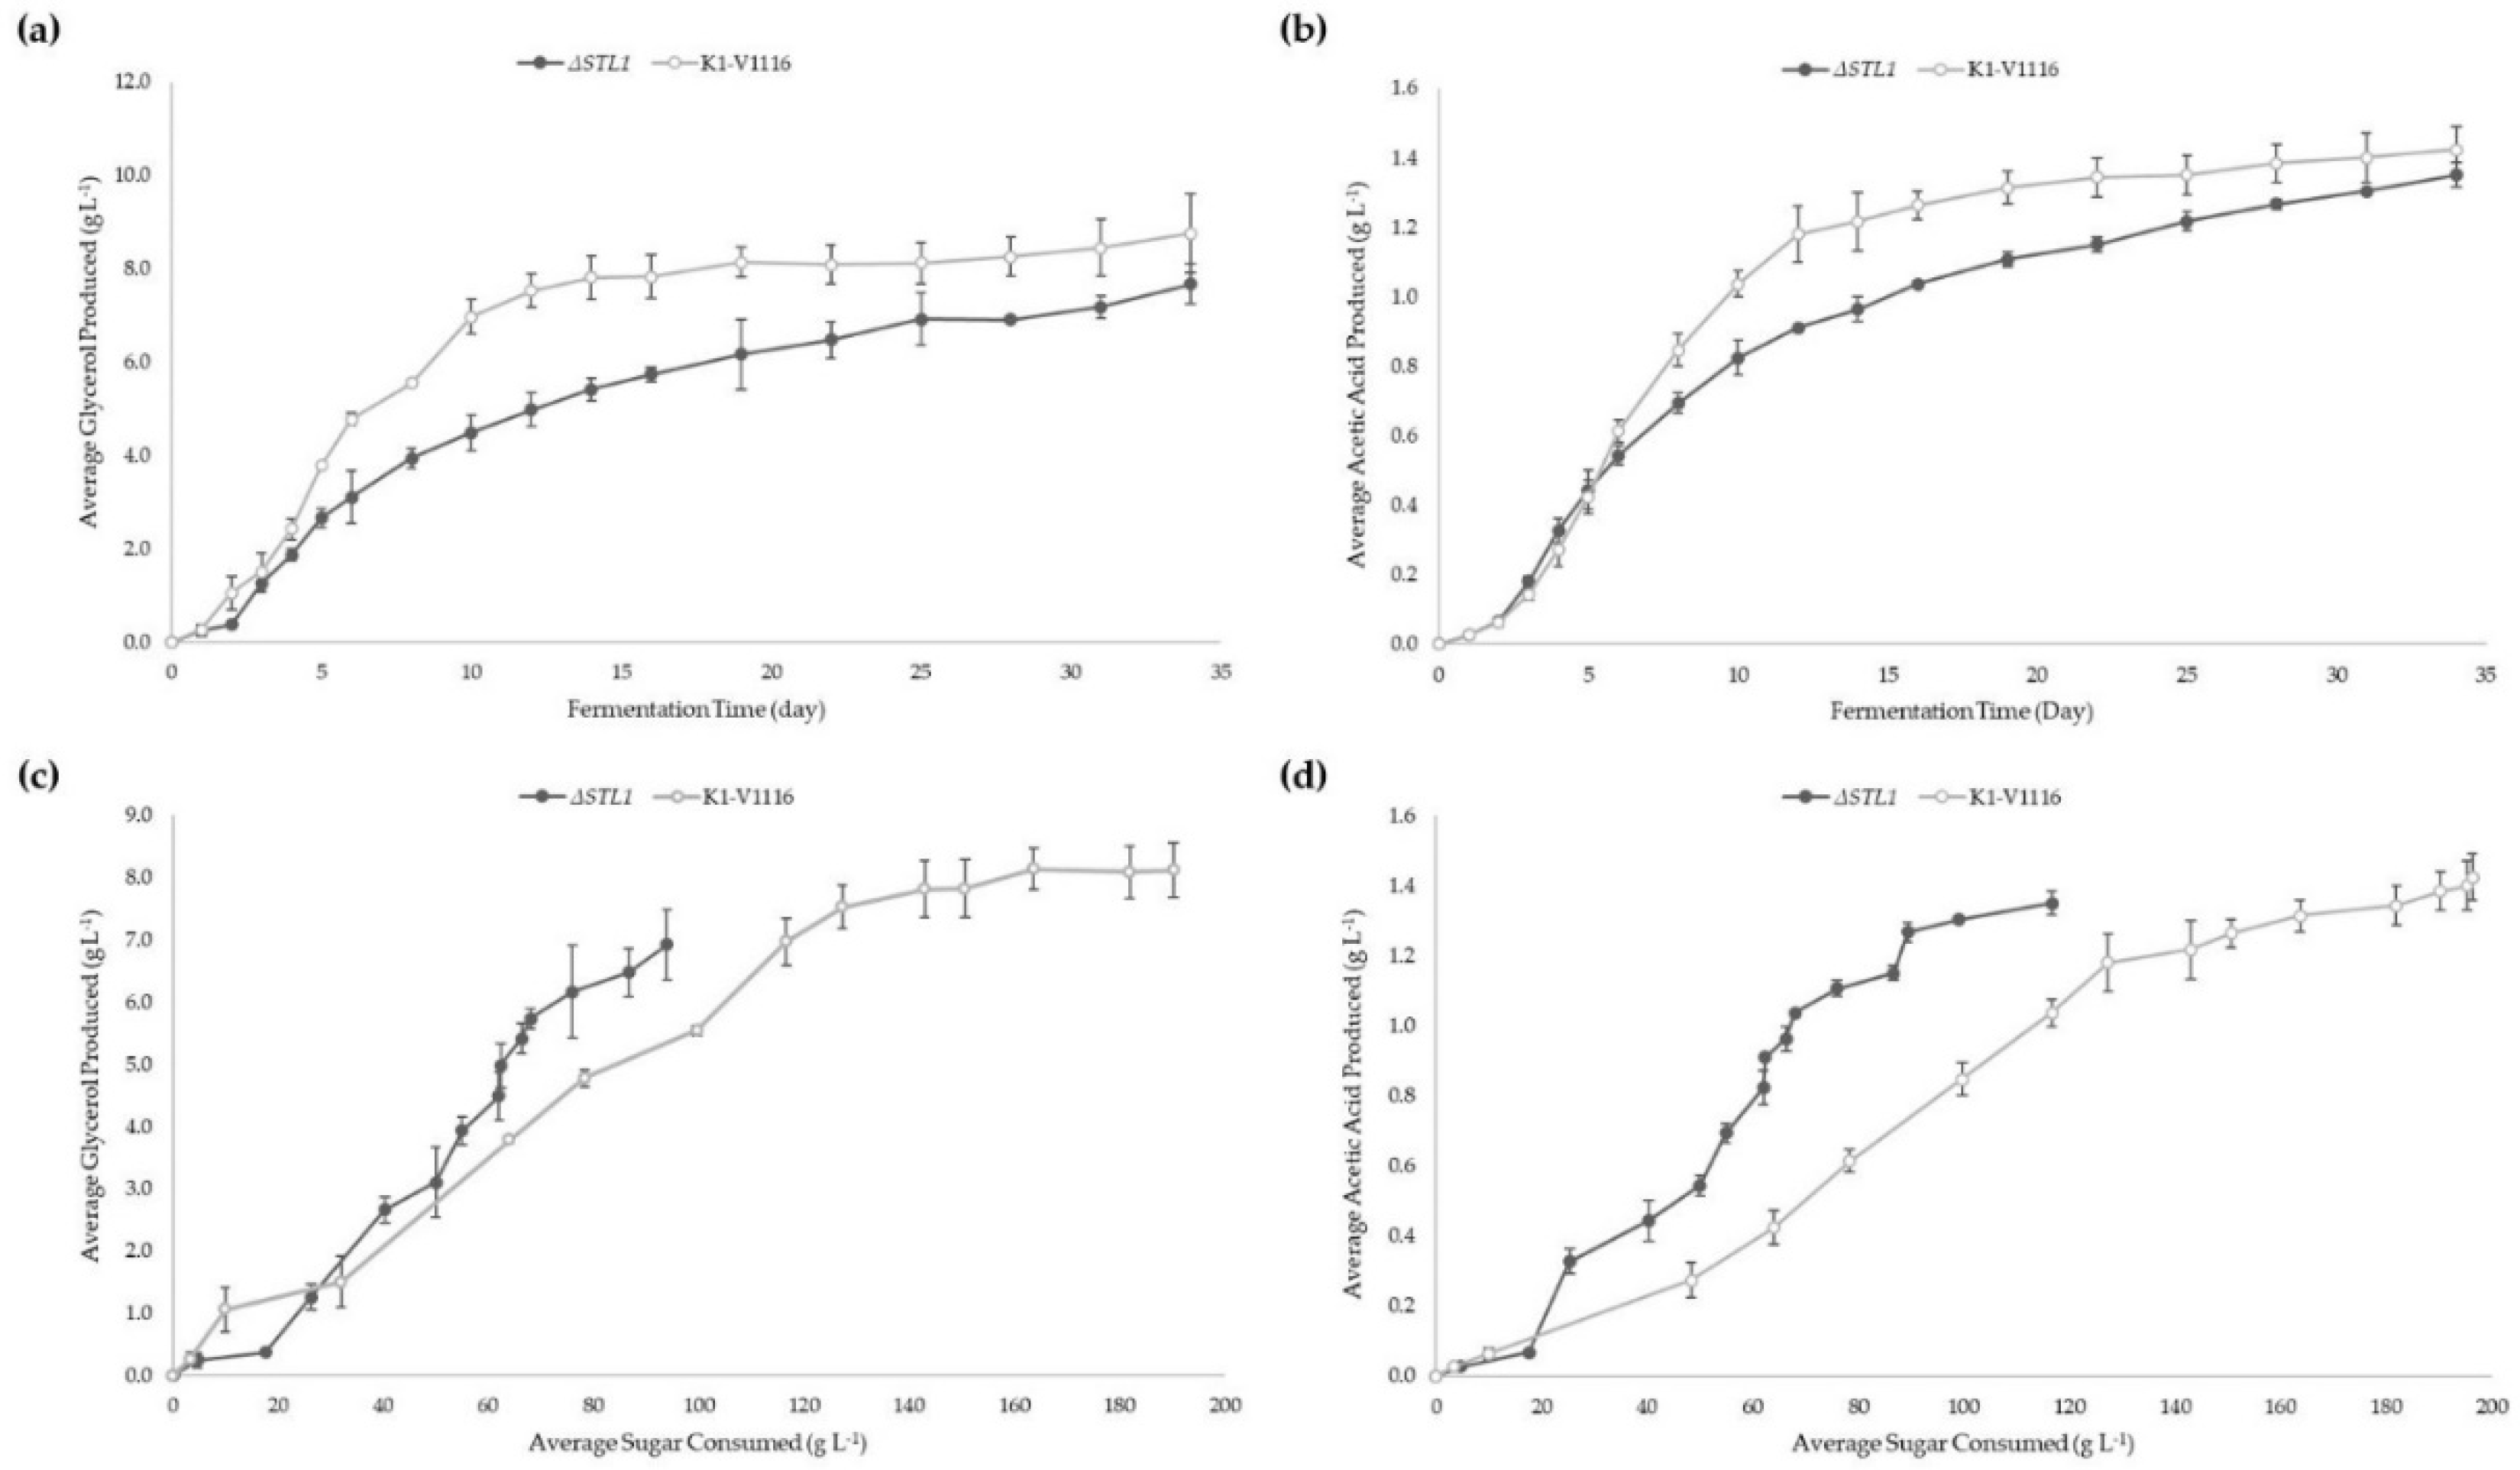
3.2.2. ∆STL1 Icewine Fermentation

The fermentation performance of the K1-V1116 ∆STL1 compared to K1-V1116 was compared in Icewine juice. Within the first 10 days of the fermentation, K1-V1116 ∆STL1 began to lag in sugar consumption compared to K1-V1116 (Figure 6). The sluggish performance continued for the remainder of the fermentation, with sugar consumption continuing even as K1-V1116 reached a plateau at around day 25.
The total cell concentrations of strains on day 7 revealed that K1-V1116 ∆STL1 had only reached around 3.5 × 10⁷ cells mL−1, versus the 5.5 × 10⁷ cells mL−1 of K1-V1116 (Figure 7a). The reduction in viable cells seen in K1-V1116 later in the fermentation was not as prominent with K1-V1116 ∆STL1 (Figure 7b).
The average total amount of glycerol and acetic acid produced throughout fermentation by K1-V1116 ∆STL1 is lower than K1-V1116 but K1-V1116 ∆STL1 produces more glycerol and acetic acid per gram of sugar consumed (Figure 8). The differences in glycerol production appear in the first few days of fermentation, while the differences in acetic acid production appear after day 5.
The final wine parameters (Table 1) demonstrate the significant differences between K1-V1116 and K1-V1116 ∆STL1. As a result of the difference in reducing sugar consumption, K1-V1116 Icewine had 80% more alcohol than that of K1-V1116 ∆STL1. The differences in total glycerol and acetic acid were not statistically significant, despite the differences in the final alcohol and reducing sugar levels.
The final differences in normalized glycerol and acetic acid production were significant, despite the insignificant differences in the total glycerol and acetic acid levels (Table 2). K1-V1116 ∆STL1 produced nearly 49% more glycerol and 71% more acetic acid per gram of sugar consumed.

4. Discussion

The CRISPR-Cas9 genome editing method developed was effective in modifying the commercial wine yeast strain, K1-V1116, with various protocol optimization strategies. The use of a single plasmid which contains all required elements, except for the protospacer sequence, in conjunction with overlap extension PCR generated sgRNA repair DNA, allows for rapid testing of other loci. While the use of primers and in vitro DNA assembly can lead to mutations, the resulting 1.1 kb sgRNA repair DNA can be rapidly sequenced with Sanger sequencing. Alternatively, commonly used sgRNA repair DNA fragments could be cloned into an E. coli vector for sequence verification and maintenance. The use of overlap extension PCR to generate the ∆STL1 donor DNA was fitting for an edit which is not sensitive to single-nucleotide polymorphisms and indels, but such a cloning method is not appropriate for a sequence sensitive edit, like a gene overexpression cassette. Future work that ventures into sensitive edit types will need to rely on other high-fidelity and verifiable cloning methods.
The initial antibiotic resistance testing of K1-V1116 demonstrated that the strain is no more resistant than previously used strains. We believe the rapid test was sufficient, as notable background growth was not encountered for the remaining transformations. The initial transformation trials, with various K1-V1116 cultures as the source for electrocompetent cells, reinforced the previous findings that use of stationary phase cells was many orders of magnitude less efficient than log phase cells [29,30]. For the isogenic goal of this work, the use of stationary phase yeast for electroporation resulted in acceptable transformation efficiencies and greatly reduced the work required for transformation. Whether future work utilizes stationary phase cells will depend on the goal of the project. Conveniently, the use of the repaired pWS173 and sgRNA repair DNA appears to be more effective than a larger circularized plasmid. This observation indicates that the homologous recombination in K1-V1116 is active and potentially comparable to that of many laboratory S. cerevisiae strains [31]. The editing efficiency seen with the ∆STL1 edit, 84%, was high enough for practical uses, and is within the ranges seen across many CRISPR-Cas9 methods [22].
The Icewine fermentation trials conducted with K1-V1116 ∆STL1 demonstrated the serious consequences that removing the Stl1p transporter has on fermentation performance. The sluggish fermentation, as indicated by the drastically reduced sugar consumption and total cell count, indicates that cell growth was inhibited by the deletion. The higher level of normalized glycerol production suggests that, since glycerol uptake is disrupted, the cell has an increased reliance on endogenous glycerol synthesis to satisfy demand under the hyperosmotic conditions. With the increased glycerol production per sugar consumed, the normalized acetic acid levels increased as well. Given the current understanding of glycerol synthesis and the NAD+/NADH ratio during Icewine fermentations, the increased glycerol demand correlates with higher acetic acid levels [4,8,16]. The exact cause of the reduced fermentation performance still needs to be determined. The increased demand on glycerol synthesis may further increase the NAD+/NADH ratio and disrupt the metabolic flux of the many reactions which rely on NAD+/NADH [32,33]. The inability to meet the glycerol demand could result in cell shrinkage, thus leading to the crowding of macromolecules and the slowing of cellular processes [34]. The accumulation of the toxic fermentation intermediate, acetaldehyde, may also contribute to the sluggish fermentation [35]. The exact cause of this phenomenon appears to not be acutely toxic to the cells, as the viable cell concentration of K1-V1116 ∆STL1 was relatively stable throughout stationary phase. The maintained viability, despite the reduced performance, is not abnormal for other known causes of sluggish fermentations [36].
These results, in conjunction with previous findings that STL1 was the most highly upregulated gene during Icewine fermentations, strongly suggest that Stl1p has a role in maintaining internal glycerol levels during the hyperosmotic stress conditions of an Icewine fermentation [4,16]. The previous studies on STL1 expression reveal that expression is low when glucose is present, even in the relatively stressful environments of table wine fermentations [11,13,14,15]. Our findings are similar to recent gene expression analysis research in sugarcane bioethanol strains, which showed that STL1 glucose repression was overcome in 30 and 35 °Brix conditions [37]. Future work should investigate whether overcoming glucose repression and inactivation at high sugar concentrations is a shared attribute between strains, or if certain strains have evolved the ability to overcome it. Considering many other yeast species rely on glycerol uptake to satisfy osmotic stress glycerol demand, it appears natural for S. cerevisiae strains like K1-V1116 to rely more on glycerol uptake during hyperosmotic stress conditions [38,39]. Furthermore, the role of initial glycerol levels in Icewine juice needs to be determined, as reduced starting glycerol levels may negatively impact the effectiveness of Stl1p-mediated osmotolerance.

5. Conclusions

Our work demonstrates that CRISPR-Cas9 genome editing is an effective tool for studying the role of glycerol uptake by Stl1p in the commercial wine yeast, K1-V1116. The CRISPR-Cas9 genome editing method developed allows for rapid strain engineering method by employing time- and cost-saving strategies typically only used with laboratory yeast strains. We found that K1-V1116 is not challenging to engineer despite the lack of genome sequence information and oenological nature. The use of the engineered K1-V1116-lacking STL1 in Icewine fermentations generated significant data, which support the idea that Stl1p contributes to osmotolerance during the harsh hyperosmotic conditions.

Author Contributions

J.M. and D.L.I. conceived and designed the experiments; J.M. performed the genome editing experiments; R.A. performed the yeast growth curves in YPD, filter sterilized the juice and determined the chemical analysis of the sterile-filtered Icewine juice; L.M. conducted the Icewine fermentations and measured the yeast metabolites and final wine composition; J.M. and D.L.I. contributed to the writing of the manuscript and J.M., D.L.I. and R.A. contributed to the review and editing of the manuscript.

Funding

This project was funded by grants from the Natural Sciences and Engineering Research Council of Canada (NSERC 238872-2012 and NSERC DDG-2018-00007).

Acknowledgments

We would like to thank the Tom Ellis lab for sharing pWS173 and for assembling an in-depth guide on using their CRISPR/Cas9 method. We appreciate the additional technical support provided by Sudarsana Poojari.

Conflicts of Interest

The authors declare no conflict of interest.

Appendix A

Table A1. CRISPR-Cas9 Target sequence used for STL1 deletion.
Protospacer SequenceProtospacer Adjacent Motif
GGTAGGAACACTAGACGACGCGG
Table A2. Primers used in this work.
Primer NameSequence
pWS173 sgRNA FWATCAACAACAGAGGACATATGCCCTACCTCCATG
pWS173 sgRNA RVATCCTGCACTCATCTACTACCCGCATCCC
STL1 sgRNA FWGCTATTTCTAGCTCTAAAACCGTCGTCTAGTGTTCCTACCAAAGTCCCATTCGCCACCCG
STL1 sgRNA RVCGGGTGGCGAATGGGACTTTGGTAGGAACACTAGACGACGGTTTTAGAGCTAGAAATAGC
No target sgRNA FWGCCTTATTTTAACTTGCTATTTCTAGCTCTAAAACAAAGTCCCATTCGCCACCCG
No target sgRNA RVGCTGGGCAACACCTTCGGGTGGCGAATGGGACTTTGTTTTAGAGCTAGAAATAGC
STL1 5’ homology arm FW CGCGGGGTATTCGGCGCTACG
STL1 5’ homology arm RVGTGTATGAATCAACCCTCAAAATTTGCTTTATCGTGGTCTAAAACTTTCTATGTTCTAC
STL1 3’ homology arm FWTAAATAAAAAATAGAAAAGTAGAACATAGAAAGTTTTAGACCACGATAAAGCAAATTTTG
STL1 3’ homology arm RVGCAGTGTTCGAAAGTTGGTGGCTTTTTGTATGTTGC
STL1 genotyping FWCAGAATTGCAGTTCAGGAGTAGTCACAC
STL1 genotyping RVCGCTCCAATGTAATAACACGTCCACGTTATC
pWS173 KanR genotyping FWGGATGGCAAGATCCTGGTATCGG
pWS173 KanR genotyping RVACTGAATCGGGAGGATCTGCTG

References

  1. Inglis, D.L.; Pickering, G.P. Vintning on thin ice—The making of Canada’s iconic dessert wine. In The World of Niagara Wine; Ripmeester, M., Mackintosh, P., Fullerton, C., Eds.; Wilfrid Laurier University Press: Waterloo, ON, Canada, 2013; pp. 229–248. [Google Scholar]
  2. Kontkanen, D.; Inglis, D.L.; Pickering, G.J.; Reynolds, A. Effect of Yeast Inoculation Rate, Acclimatization, and Nutrient Addition on Icewine Fermentation. Am. J. Enol. Vitic. 2004, 55, 363–370. [Google Scholar]
  3. Pigeau, G.M.; Inglis, D.L. Upregulation of ALD3 and GPD1 in Saccharomyces cerevisiae during Icewine fermentation. J. Appl. Microbiol. 2005, 99, 112–125. [Google Scholar] [CrossRef] [PubMed]
  4. Yang, F.; Heit, C.; Inglis, D.L. Cytosolic Redox Status of Wine Yeast (Saccharomyces cerevisiae) under Hyperosmotic Stress during Icewine Fermentation. Fermentation 2017, 3, 61. [Google Scholar] [CrossRef]
  5. Björkqvist, S.; Ansell, R.; Adler, L.; Lidén, G. Physiological response to anaerobicity of glycerol-3-phosphate dehydrogenase mutants of Saccharomyces cerevisiae. Appl. Environ. Microbiol. 1997, 63, 128–132. [Google Scholar]
  6. Bakker, B.M.; Overkamp, K.M.; van Maris, A.J.A.; Kötter, P.; Luttik, M.A.H.; van Dijken, J.P.; Pronk, J.T. Stoichiometry and compartmentation of NADH metabolism in Saccharomyces cerevisiae. FEMS Microbiol. Rev. 2001, 25, 15–37. [Google Scholar] [CrossRef]
  7. Cronwright, G.R.; Rohwer, J.M.; Prior, B.A. Metabolic Control Analysis of Glycerol Synthesis in Saccharomyces cerevisiae. Appl. Environ. Microbiol. 2002, 68, 4448–4456. [Google Scholar] [CrossRef]
  8. Blomberg, A.; Adler, L. Roles of glycerol and glycerol-3-phosphate dehydrogenase (NAD +) in acquired osmotolerance of Saccharomyces cerevisiae. J. Bacteriol. 1989, 171, 1087–1092. [Google Scholar] [CrossRef]
  9. Aranda, A.; del Olmo, M.L. Response to acetaldehyde stress in the yeast Saccharomyces cerevisiae involves a strain-dependent regulation of several ALD genes and is mediated by the general stress response pathway. Yeast 2003, 20, 747–759. [Google Scholar] [CrossRef]
  10. Hohmann, S. An integrated view on a eukaryotic osmoregulation system. Curr. Genet. 2015, 61, 373–382. [Google Scholar] [CrossRef]
  11. Ferreira, C.; van Voorst, F.; Martins, A.; Neves, L.; Oliveira, R.; Kielland-Brandt, M.C.; Lucas, C.; Brandt, A. A Member of the Sugar Transporter Family, Stl1p Is the Glycerol/H+ Symporter in Saccharomyces cerevisiae. Mol. Biol. Cell 2005, 16, 2068–2076. [Google Scholar] [CrossRef]
  12. Nelissen, B.; De Wachter, R.; Goffeau, A. Classification of all putative permeases and other membrane plurispanners of the major facilitator superfamily encoded by the complete genome of Saccharomyces cerevisiae. FEMS Microbiol. Rev. 1997, 21, 113–134. [Google Scholar] [CrossRef] [PubMed]
  13. Ferreira, C.; Lucas, C. Glucose repression over Saccharomyces cerevisiae glycerol/H+ symporter gene STL1 is overcome by high temperature. FEBS Lett. 2007, 581, 1923–1927. [Google Scholar] [CrossRef] [PubMed]
  14. Noti, O.; Vaudano, E.; Pessione, E.; Garcia-Moruno, E. Short-term response of different Saccharomyces cerevisiae strains to hyperosmotic stress caused by inoculation in grape must: RT-qPCR study and metabolite analysis. Food Microbiol. 2015, 52, 49–58. [Google Scholar] [CrossRef] [PubMed]
  15. Pérez-Torrado, R.; Oliveira, B.M.; Zemančíková, J.; Sychrová, H.; Querol, A. Alternative Glycerol Balance Strategies among Saccharomyces Species in Response to Winemaking Stress. Front. Microbiol. 2016, 7. [Google Scholar] [CrossRef]
  16. Heit, C.; Martin, S.J.; Yang, F.; Inglis, D.L. Osmoadaptation of wine yeast (Saccharomyces cerevisiae) during Icewine fermentation leads to high levels of acetic acid. J. Appl. Microbiol. 2018, 124, 1506–1520. [Google Scholar] [CrossRef] [PubMed]
  17. Hauser, N.C.; Fellenberg, K.; Gil, R.; Bastuck, S.; Hoheisel, J.D.; Pérez-Ortín, J.E. Whole Genome Analysis of a Wine Yeast Strain. Comp. Funct. Genomics 2001, 2, 69–79. [Google Scholar] [CrossRef] [PubMed] [Green Version]
  18. Jiménez-Martí, E.; Gomar-Alba, M.; Palacios, A.; Ortiz-Julien, A.; del Olmo, M. Towards an understanding of the adaptation of wine yeasts to must: Relevance of the osmotic stress response. Appl. Microbiol. Biotechnol. 2011, 89, 1551–1561. [Google Scholar] [CrossRef]
  19. Jiménez-Martí, E.; Zuzuarregui, A.; Gomar-Alba, M.; Gutiérrez, D.; Gil, C.; del Olmo, M. Molecular response of Saccharomyces cerevisiae wine and laboratory strains to high sugar stress conditions. Int. J. Food Microbiol. 2011, 145, 211–220. [Google Scholar] [CrossRef]
  20. Pronk, J.T. Auxotrophic Yeast Strains in Fundamental and Applied Research. Appl. Environ. Microbiol. 2002, 68, 2095–2100. [Google Scholar] [CrossRef] [Green Version]
  21. Le Borgne, S. Genetic Engineering of Industrial Strains of Saccharomyces cerevisiae. In Recombinant Gene Expression; Lorence, A., Ed.; Springer: Berlin/Heidelberg, Germany, 2012; pp. 451–465. [Google Scholar] [CrossRef]
  22. Stovicek, V.; Holkenbrink, C.; Borodina, I. CRISPR/Cas system for yeast genome engineering: Advances and applications. FEMS Yeast Res. 2017, 17. [Google Scholar] [CrossRef]
  23. Zhang, Y.; Wang, J.; Wang, Z.; Zhang, Y.; Shi, S.; Nielsen, J.; Liu, Z. A gRNA-tRNA array for CRISPR-Cas9 based rapid multiplexed genome editing in Saccharomyces cerevisiae. Nat. Commun. 2019, 10, 1–10. [Google Scholar] [CrossRef] [PubMed]
  24. Vigentini, I.; Gebbia, M.; Belotti, A.; Foschino, R.; Roth, F.P. CRISPR/Cas9 System as a Valuable Genome Editing Tool for Wine Yeasts with Application to Decrease Urea Production. Front. Microbiol. 2017, 8. [Google Scholar] [CrossRef] [PubMed]
  25. Shaw, W. Quick and Easy CRISPR Engineering in Saccharomyces cerevisiae. 2018. Available online: https://www.benchling.com/2018/11/06/quick-and-easy-crispr-engineering-in-saccharomyces-cerevisiae/ (accessed on 10 November 2018).
  26. Novo, M.; Bigey, F.; Beyne, E.; Galeote, V.; Gavory, F.; Mallet, S.; Cambon, B.; Legras, J.-L.; Wincker, P.; Casaregola, S.; et al. Eukaryote-to-eukaryote gene transfer events revealed by the genome sequence of the wine yeast Saccharomyces cerevisiae EC1118. Proc. Natl. Acad. Sci. USA 2009, 106, 16333–16338. [Google Scholar] [CrossRef]
  27. DiCarlo, J.E.; Norville, J.E.; Mali, P.; Rios, X.; Aach, J.; Church, G.M. Genome engineering in Saccharomyces cerevisiae using CRISPR-Cas systems. Nucleic Acids Res. 2013, 41, 4336–4343. [Google Scholar] [CrossRef]
  28. Zoecklein, B.W.; Fugelsang, K.C.; Gump, B.H. Laboratory Procedures. In Wine Analysis and Production, 1st ed.; Chapman and Hall, International Thomson Publishing: New York, NY, USA, 1995; pp. 374–378. [Google Scholar]
  29. Grey, M.; Brendel, M. A ten-minute protocol for transforming Saccharomyces cerevisiae by electroporation. Curr. Genet. 1992, 22, 335–336. [Google Scholar] [CrossRef]
  30. Tripp, J.D.; Lilley, J.L.; Wood, W.N.; Lewis, L.K. Enhancement of plasmid DNA transformation efficiencies in early stationary phase yeast cell cultures. Yeast 2013, 30, 191–200. [Google Scholar] [CrossRef]
  31. Kuijpers, N.G.; Solis-Escalante, D.; Bosman, L.; van den Broek, M.; Pronk, J.T.; Daran, J.-M.; Daran-Lapujade, P. A versatile, efficient strategy for assembly of multi-fragment expression vectors in Saccharomyces cerevisiae using 60 bp synthetic recombination sequences. Microb. Cell Factories 2013, 12, 47. [Google Scholar] [CrossRef]
  32. Förster, J.; Famili, I.; Fu, P.; Palsson, B.Ø.; Nielsen, J. Genome-Scale Reconstruction of the Saccharomyces cerevisiae Metabolic Network. Genome Res. 2003, 13, 244–253. [Google Scholar] [CrossRef]
  33. Nielsen, J. It Is All about Metabolic Fluxes. J. Bacteriol. 2003, 185, 7031–7035. [Google Scholar] [CrossRef]
  34. Miermont, A.; Waharte, F.; Hu, S.; McClean, M.N.; Bottani, S.; Léon, S.; Hersen, P. Severe osmotic compression triggers a slowdown of intracellular signaling, which can be explained by molecular crowding. Proc. Natl. Acad. Sci. USA 2013, 110, 5725–5730. [Google Scholar] [CrossRef] [Green Version]
  35. Jones, R.P. Biological principles for the effects of ethanol. Enzym. Microb. Technol. 1989, 11, 130–153. [Google Scholar] [CrossRef]
  36. Bisson, L.F. Stuck and Sluggish Fermentations. Am. J. Enol. Vitic. 1999, 50, 107–119. [Google Scholar]
  37. Monteiro, B.; Ferraz, P.; Barroca, M.; da Cruz, S.H.; Collins, T.; Lucas, C. Conditions promoting effective very high gravity sugarcane juice fermentation. Biotechnol. Biofuels 2018, 11, 251. [Google Scholar] [CrossRef] [PubMed]
  38. Lages, F.; Silva-Graça, M.; Lucas, C. Active glycerol uptake is a mechanism underlying halotolerance in yeasts: A study of 42 species. Microbiology 1999, 145, 2577–2585. [Google Scholar] [CrossRef]
  39. Dušková, M.; Ferreira, C.; Lucas, C.; Sychrová, H. Two glycerol uptake systems contribute to the high osmotolerance of Zygosaccharomyces rouxii. Mol. Microbiol. 2015, 97, 541–559. [Google Scholar] [CrossRef]
Figure 1. Representation of pWS173 plasmid (Benchling).
Fermentation 05 00093 g001
Figure 2. Schematic of DNA components which are transformed in yeast (a) and in vivo repair of pWS173, and subsequent expression of CRISPR-Cas9, sgRNA, and G418 resistance cassettes (b). The CRISPR-Cas9 ribonucleoprotein recognizes the genomic target sequence and cleaves the site, resulting in a double-stranded DNA break in the genomic DNA. Subsequent homology directed repair with the exogenous donor DNA results in successful genome editing (c).
Fermentation 05 00093 g002
Figure 3. Log transformation efficiency of log phase culture, 18-hour culture, and 40-hour culture, with 300 ng of pWS173 or 300 ng of linearized pWS173, with 1 µg of non-functional sgRNA repair DNA. Single transformations were plated in triplicate on YPD with 200 µg mL−1 G418. Transformation efficiency represents the average ± standard deviation.
Fermentation 05 00093 g003
Figure 4. Schematic of STL1 and mechanism of CRISPR-Cas9 genome edit. CRISPR-Cas9 cleaves at the depicted location, resulting in homology directed repair with the ∆STL1 donor DNA (a). PCR genotype scheme used to validate the integration (b). Gel image of STL1 genotype of K1-V1116 in lane 2 and K1-V1116 ∆STL1 transformants in lanes 3 to 6 (c).
Fermentation 05 00093 g004
Figure 5. Growth kinetics of K1-V1116 ∆STL1 (●) and K1-V1116 (○) cultured aerobically in YPD liquid media at 30 °C. Cultures were setup and measured in triplicate. Samples were taken every 2 h, with each point representing a corrected OD600 average ± standard deviation.
Fermentation 05 00093 g005
Figure 6. Reducing sugar consumed during fermentation. Fermentations of K1-V1116 ∆STL1 (●) and K1-V1116 (○) were performed in triplicate, with samples from each trial being analyzed in duplicate. Sugar values represent the average ± standard deviation.
Fermentation 05 00093 g006
Figure 7. Fermentation total cell concentration (a) and viable cell concentration (b) of K1-V1116 ∆STL1 (●) and K1-V1116 (○). Fermentations were performed in triplicate, with counts being determined in duplicate. Cell concentrations represent the average ± standard deviation.
Fermentation 05 00093 g007
Figure 8. Average glycerol produced (a) and average acetic acid produced (b) over the time course of the fermentation. Average glycerol produced (c) and average acetic acid produced (d) versus sugar consumed over the course of the fermentation. Includes K1-V1116 ∆STL1 (●) and K1-V1116 (○). Values are the averages of triplicate fermentations, with each sample tested in duplicate for metabolite analysis.
Fermentation 05 00093 g008
Table 1. Icewine juice and final wine chemical composition. Data represent the mean value ± standard deviation from triplicate fermentations, with each sample tested in duplicate. Lowercase letters within the same parameter indicate differences between treatments as tested by ANOVA, with mean separation by Tukey’s Honest Significant Difference (HSD0.05).
ParameterIcewine JuiceWine from K1-V1116Wine from K1-V1116 ΔSTL1
Reducing Sugars (g L−1)447 ± 19 a251 ± 11 c333 ± 19 b
pH3.79 ± 0.04 b3.90 ± 0.02 a3.84 ± 0.08 a,b
Titratable Acidity (g L−1)7.0 ± 0.1 b8.6 ± 0.2 a8.6 ± 0.3 a
Yeast Assimilable Nitrogen (mg N L −1)441 ± 2 a345 ± 13 c396 ± 14 b
Glycerol (g L−1)8.67 ± 0.32 b17.42 ± 1.12 a16.36 ± 0.32 a
Acetic Acid (g L−1)0.06 ± 0.01 b1.48 ± 0.07 a1.39 ± 0.05 a
Ethanol (% v/v)1.3 ± 0.0 c12.3 ± 0.6 a6.7 ± 0.6 b
Table 2. Consumption of juice components and production of yeast metabolites.
ParameterK1-V1116K1-V1116 ΔSTL1
Reducing Sugar consumed (g L−1)196 ± 13 **117 ± 21 **
Yeast Assimilable Nitrogen consumed (mg N L−1)92 ± 17 *44 ± 12 *
Glycerol produced (g L−1)8.76 ± 0.847.68 ± 0.44
Acetic Acid produced (g L−1)1.42 ± 0.071.35 ± 0.07
Normalized Glycerol production
(mg glycerol per g sugar consumed)
45 ± 3 *67 ± 12 *
Normalized Acetic Acid production
(mg acetic acid per g sugar consumed)
7 ± 0 **12 ± 2 **
Production refers to the difference between the initial Icewine juice and the final wine of each strain. Data represent the mean value ± standard deviation of duplicate measurements per sample (three winemaking replicates per treatment). Asterisks (* p < 0.05, ** p < 0.01) indicate significant differences between yeast strains (Student’s t-Test).

