Article

Novel Technologies for Butyric Acid Fermentation: Use of Cellulosic Biomass, Rapid Bioreactor, and Efficient Product Recovery

1
United States Department of Agriculture (USDA), Agricultural Research Service (ARS), National Center for Agricultural Utilization Research (NCAUR), Bioenergy Research Unit, 1815 N. University Street, Peoria, IL 61604, USA
2
United States Department of Agriculture (USDA), Agricultural Research Service (ARS), Eastern Regional Research Center, 600 East Mermaid Lane, Wyndmoor, PA 19038, USA
*
Author to whom correspondence should be addressed.
Fermentation 2024, 10(3), 142; https://doi.org/10.3390/fermentation10030142
Submission received: 30 January 2024 / Revised: 21 February 2024 / Accepted: 27 February 2024 / Published: 1 March 2024

Abstract

:
Butyric acid, a four-carbon fatty acid, is an important industrial chemical and feedstock. To produce this chemical, a control fermentation was run with a 126.5 g.L−1 glucose concentration in the feed medium. In this medium, the strain produced 44.8 g.L−1 total acid with a productivity of 0.23 g.L−1h−1 and a yield of 0.41 g.g−1. The strain (Clostridium tyrobutyricum ATCC 25755) was also able to utilize glucose and xylose simultaneously with similar fermentation performance. The culture was also used to produce butyric acid from wheat straw hydrolysate (WSH) employing a hot water pretreatment. In a batch system, the strain resulted in a productivity and yield of 0.27 g.L−1h−1 and 0.44 g.g−1, respectively, which was an improvement over the use of glucose or xylose alone or mixtures of both. To improve reactor productivity, a membrane cell recycle bioreactor was used which resulted in a productivity of 1.89 g.L−1h−1. This productivity was 822% of that achieved in the glucose or xylose batch fermentation. Furthermore, a butyric acid recovery method was developed using XAD-4 adsorbent resin. In this system, up to 206.1 g.L−1 of butyric acid was used in the feed and, as a result of the quick adsorption, the residual butyric acid concentration was 29.5 g.L−1. In this experiment, the rate of acid removal of 1059.4 g.L−1h−1 was achieved.

1. Introduction

Butyric acid is an important chemical and feedstock and is used in the food, feed, chemical, cosmetic, and pharmaceutical industries [1,2,3,4]. It is a four-carbon fatty acid and can be converted into butanol biofuel as part of a two-step or two-reactor process [5]. In the first step or first reactor, the substrate (carbon source) is converted into butyric acid and in the second, step/reactor butyric acid is utilized to produce butanol. Butyric acid can be produced by two routes, namely chemical (oxidation of butyraldehyde obtained from the oxosynthesis of propylene) and through fermentation [5]. The second route, i.e., the bioconversion of renewable resources into butyric acid, is environmentally friendly. During butyric acid production by fermentation, two gases (CO2 and H2) are produced that can be utilized to produce other chemicals by the microbial route. The use of these two gases to produce other chemicals or energy may be economically beneficial as they are nearly zero-cost substrates.
As a result of global warming, the world’s scientific community has focused research efforts on the production of fuels and chemicals such as butyric acid and biofuels from green renewable resources. Such resources include residues of green biomass that are left behind on the farms after harvesting grains. Examples include soybean hulls, leaves and stems, corn stover, barley straw, sweet sorghum bagasse, and wheat straw. In addition, there are other fermentation substrates/resources including food waste (FW) [6], domestic organic wastes (DOWs) [7], municipal solid wastes (MSWs) [8,9], fruit drops and fruit residues [10], wheat starch wastewater (WSW) [11], dried distiller’s grains and solubles (DDGS)s [12], etc. that are low-cost or zero-cost feedstocks. As an example, an enormous amount of food waste (49 × 109 kg.year−1) [13] is generated in the United States that can be fermented into chemicals and fuels such as butyric acid, ethanol, or butanol. An average American family creates 2877 kg of garbage annually, some of which is organic waste that is usable for bioconversion. Claassen et al. [7] reported that, on average, domestic organic waste contains about 39.3 g of hydrolyzed sugars per 100 g of DOW. This substrate is suitable to produce chemicals such as butyric acid or butanol. Another factor that needs to be considered is sustainability, and these feedstocks are sustainable.
Some years ago (2016; billion-ton report), it was projected that 1 billion (1.0 × 10⁹) tons of agricultural biomass are expected to be produced annually in the United States alone. This biomass and the enormous number of substrates mentioned in the above paragraph are expected to make the production of chemicals independent of fossil fuels and petroleum-based chemicals. Other than substrates, novel process technologies also reduce the price of chemical production. These technologies include simultaneous saccharification (where applicable), fermentation, and product recovery. Fermentation of the above substrates can be performed in batch [14,15,16], fed-batch, free/suspended cell continuous, immobilized cell [17,18], and cell recycle membrane reactors [19,20,21,22,23]. Of these reactor systems, cell recycle membrane technologies are the best and result in high productivity [19,20,21,22,23]. Other than the use of high productivity reactors, energy-efficient product recovery systems play a major role in the economics of the production of the chemicals by fermentation. Such systems include liquid–liquid extraction [1,24], reverse electro-enhanced dialysis [25], nanofiltration membrane systems [26], adsorption onto zeolite [27], high-pressure CO2 extraction [28], and salting-out extraction [29].
The objective of this study was to produce butyric acid from cellulosic sugars/biomass that are sustainable in nature and one such biomass is wheat straw, which is produced in abundance in the United States and the world. The cellulosic sugars that were tested included glucose, xylose, arabinose, galactose, and mannose. It is essential that, in commercial fermentations, all the major sugars (glucose and xylose) are used simultaneously. An additional objective was to improve reactor productivity using membrane cell-recycling technology. Next, the product was recovered using novel adsorption technology onto XAD-4 from model solutions. The ultimate goal of adsorption is to apply this technology to butyric acid recovery from fermentation broth. In this study, Clostridium tyrobutyricum ATCC 25755 was used, because it can utilize both hexose and pentose sugars.

2. Materials and Methods

2.1. Stock Medium and Solutions

Reinforced Clostridial Medium (RCM; DifcoTM, Becton Dickinson and Company, Sparks, MD, USA) was prepared by dissolving 19 g of RCM in 500 mL of distilled water in a 1.0 L screw-capped PyrexTM glass bottle. Then, the bottle was autoclaved at 121 °C for 15 min followed by cooling to room temperature (25 °C). The medium was stored at 4 °C until it was used for experiments. Glucose (Fisher Scientific/Chemical, Fair Lawn, NJ, USA) and xylose (Sigma Chemicals, St. Louis, MO, USA) (200 g each) were separately dissolved into 500 mL of distilled water and filter-sterilized by them passing through a 0.2 µm sterile filter (Whatman International Ltd., Maidstone, England) and storing the solutions at 4 °C until used. The RCM and sugar solutions were used to prepare inoculum.

2.2. Microorganism, Culture Propagation, and Spore Formation

Clostridium tyrobutyricum strain ATCC 25755 was obtained from Agricultural Research Service Culture Collection (NRRL; Peoria, IL, USA). Dried culture pellet (from the glass vial) was revived in 5 mL (contained in a plastic test tube 17 × 100 mm 2-Pos Cap; Evergreen Labware Products, Rancho Dominguez, CA, USA) of 38 g.L−1 RCM (DifcoTM, Becton Dickinson). Prior to suspending the pellet into the RCM, anaerobic conditions were created by sparging the medium with oxygen-free nitrogen gas at 30 mL.min−1 for 7–10 min. The suspended pellet was incubated at 35–37 °C for 24–48 h in an anaerobic jar until cell growth was visible [15]. The activated culture was streaked on an MRS (deMan, Rogosa, Sharpe) plate by using a sterile disposable inoculation loop and the plate was incubated overnight at 35–37 °C under anaerobic conditions. Streaking and culture transfers were performed in an anaerobic workstation (Coy Laboratory Products Inc., Grass Lake, MI, USA). A single colony was used from the MRS plate to inoculate 5 mL of 38 g.L−1 RCM contained in a test tube (Evergreen Labware Products, Rancho Dominguez) and the culture was grown at 35–37 °C under strict anaerobic conditions. Prior to inoculation, anaerobic conditions were created in the medium. To produce spores in the medium, the culture was grown in approximately 26.25 mL of RCM, to which 8.75 mL of glucose (from 400 g.L−1) solution was added. The production of spores took approximately 5–6 days. The fermentation broth that contained spores was stored at 4 °C for further experimental work.

2.3. Inoculum Preparation

For inoculum preparation, 5–7 mL of RCM solution (DifcoTM, Becton Dickinson) and 250 µL of glucose (form 400 g.L−1 stock solution; Fisher Scientific) solution were mixed in a plastic tube (Evergreen Labware Products) and an anaerobic condition was created. The glucose (Fisher Scientific/Chemical) concentration in this medium was 14–20 g.L−1. Three hundred µL of spore suspension contained in a 1.50 mL sterile microcentrifuge plastic tube (Bio Plastic Inc., San Rafael, CA, USA) was heat-shocked on a heating block (Cole-Parmer, Chilling Heating Block, Vernon Hills, IL, USA) at 75 °C for 2 min followed by transferring 100 µL of suspension to the above-mentioned RCM–glucose solution. The inoculated tube was incubated at 35–37 °C for approximately 24 h when cell growth was observed. From this tube, 3 mL of cell suspension was transferred into another tube (Fisherbrand, Fisher Scientific) containing 27.75 mL RCM and 2.25 mL sterile glucose solution. The total volume of this tube was 50 mL. In this culture, an anaerobic condition was created by sparging oxygen-free nitrogen gas at a flow rate of approximately 60 mL.min−1 for 10–15 min. Cell growth was allowed at 35–37 °C for 16–18 h. This inoculum was termed as stage I. To develop the stage II inoculum, 3 g of glucose (in 50 mL distilled water) and 3.8 g of RCM (in 50 mL distilled water) were separately dissolved and transferred into two separate 150 mL screw-capped glass bottles. The bottles containing these two solutions were autoclaved at 121 °C for 15 min followed by cooling to approximately 50 °C. Then, the glucose solution was transferred to the RCM bottle. The medium contained in the glucose–RCM bottle was sparged with oxygen-free nitrogen gas at a flow rate of 100 mL.min−1 for 15 min. Following this, the bottle was transferred into an anaerobic jar (BBL GasPakTM, Sparks, MD, USA) with its (bottle) lid kept loose for 48 h. The bottle was inoculated with 10 mL of inoculum developed at stage I and incubated in an anaerobic jar (BBL GasPakTM) for 16–18 h at 35–37 °C. Upon cell growth, this was termed as inoculum II and was used to inoculate the 2.5 L fermenter containing 1 L of fermentation medium.

2.4. Bioreactor Preparation and Fermentation

For batch fermentation in a 2.5 L reactor (BioFlo 2000 Fermenter, New Brunswick, Edison, NJ, USA), 38 g RCM and 100–120 g glucose or xylose were dissolved separately in 500 mL distilled water and autoclaved at 121 °C for 20 min. The final composition of the medium was approximately 100–120 g.L−1 glucose and 38 g.L−1 RCM. The empty bioreactor was also sterilized by autoclaving at 121 °C for 20 min. When the solutions cooled to approximately 50 °C, the RCM and sugar solutions were aseptically transferred to the reactor. At this time, the solution sparging was initiated with oxygen-free nitrogen gas at a flow rate of 1 L.min−1 for 2.5–3.0 h. When the medium and fermenter cooled to 35 °C, the reactor was inoculated with 100 mL of inoculum II (preparation described in Section 2.3) and temperature, pH, and agitation were controlled at 35–37 °C, 6.5, and 75 rpm, respectively. Whenever there was excessive foam, either during nitrogen sparging or fermentation, it was controlled by adding 100× diluted autoclaved antifoam (Antifoam 204, Sigma Chemicals, St. Louis, MO, USA). Samples were taken at regular intervals and stored at −18 °C for sugar and acid measurements.

2.5. Cell Recycle Membrane Reactor

A Hollow Fiber Cartridge (Type 500,000 molecular weight cut off; Model No. UFP-500-E-4MA; Surface Area 420 cm2) was obtained from Cytiva (Westborough, MA, USA). The membrane contained 50 fibers with a 1 mm inside diameter and 30 cm length with a total filtration area of 0.085 m2. A schematic diagram of the membrane reactor is shown in Figure 1. The membrane module was sterilized by circulating 80–90 °C hot water for two hours followed by cooling by circulating oxygen-free nitrogen gas through the fibers.
The fermentation study was conducted in a 2.5 L BioFlo 2000 Fermenter (New Brunswick, NJ, USA). Approximately 76 g RCM solids/powder were dissolved in 900 mL distilled water and autoclaved at 121 °C for 20 min. Also, 180–215 g of glucose was dissolved in 900 mL distilled water and sterilized by autoclaving at 121 °C for 20 min. The bioreactor was autoclaved separately. The RCM and glucose solutions were cooled to 50 °C and then aseptically transferred to the reactor. An anaerobic condition in the reactor was created by sparging oxygen-free nitrogen gas at a flow rate of 1.8 L.min−1 for 2 h. For fermentation, the initial liquid volume was 1.8 L and the reactor was inoculated with 100 mL of inoculum. Cell growth was initiated at a temperature of 35–37 °C, and pH of 6.5 for 24 h. At this time (24 h), the cell concentration in the reactor was 1.70 g.L−1. To increase the cell concentration in the fermenter, broth circulation through the hollow fiber membrane was initiated at a flow rate of approximately 900–1000 mL.min−1 using norprene 18 size tubing and a MasterfluxTM peristaltic pump (Cole Parmer, Vernon Hills, IL, USA) resulting in the volume in the reactor being reduced from approximately 1900 mL to 800 mL. The membrane permeate was discarded and cells were recycled in the reactor. As a result of cell recycling, the cell concentration in the reactor increased to approximately 3.50 g.L−1. At this time, the feed flow rate was initiated at a flow rate of 18 mL.min−1. The composition of the feed was 38 g.L−1 RCM and 120 g.L−1 glucose. The two solutions were prepared and autoclaved separately and aseptically mixed when the temperatures decreased to 50 °C after autoclaving. In the feed medium, an anaerobic condition was maintained by sweeping oxygen-free nitrogen gas across the medium surface.

2.6. Wheat Straw Pretreatment and Hydrolysis

Approximately 9 g wheat straw [obtained from a local farmer (irrigated location); Manito, IL, USA] was added to 91 g distilled water and mixed well. The cultivars of wheat were FS 634 and FS 645 (FS—FarmService). Prior to making a suspension in distilled water, the straw was milled to fine particles and sieved through a 1.27 mm screen. This suspension was transferred into a 200 mL capacity stainless-steel reactor (Labomat BFA-12, Mathis USA Inc., Concord, NC, USA), which was transferred to the oven for heat treatment. The oven temperature was increased at a rate of 2.6 °C.min−1. When the temperature reached 190 °C, cooling was started at a rate of 6 °C.min−1 to a final temperature of 35 °C. This temperature protocol was chosen because it does not generate fermentation inhibitors such as furfural and hydroxymethyl furfural. After pretreatment, the contents of the reactor were transferred to a 250 mL screw-capped PyrexTM glass bottle and the pH was adjusted to 5.0 with 5 M NaOH solution followed by adding 12 mL.L−1 each of hydrolytic enzymes: [Celluclast 1.5 L (enzyme activity 751 ± 35 U.mL−1; Sigma Chemicals St. Louis, MO, USA), β-glucosidase (activity 380 ± 19 U.mL−1; Novozyme 188; Sigma Chemicals), and xylanase (activity 9837 ± 190 U.mL−1; Viscostar; Dyadic Corporation Jupiter, FL, USA)]. For the release of sugars, the suspension was placed on a shaker at 150 rpm, 45 °C for 72 h. During this time, the suspended solids were hydrolyzed, and the suspension turned into liquid. The hydrolyzed suspension was filtered through a cheesecloth to remove the remaining suspended solids. This was followed by filtering the liquid through a coarse filter (Whatman International Ltd., Maidstone, England). Furthermore, the liquid was filtered through a series of filters ranging from 11 to 4 µm (Whatman). Finally, it was sterilized by filtering through a 0.2 µm filter (Whatman).

2.7. Wheat Straw Hydrolysate Fermentation

Wheat straw hydrolysate (WSH) fermentation was performed using the DAS-GIP mini bioreactors (Type SR0200DLS, 2X Rushton impeller (60–250 mL wv), overhead drive; Eppendorf North America, Enfield, CT, USA) with a working volume of 170 mL (reactor volume 300 mL). Concentrated WSH was fermented and attempts were not made to use diluted WSH as it was not considered necessary. The system was programmed to maintain a pH of 6.5, temperature at 35 °C, and agitation at 75 rpm. The pH was measured and maintained using a Hamilton EasyFerm Plus PHI K8 120 pH probe (Reno, NV, USA). Anaerobic conditions were maintained by oxygen-free nitrogen gas. Nitrogen gas was sparged into the liquid medium at a flow rate of ~150 mL.min−1 contained in the reactors for the first 24 h, then fed into the headspace for the remainder of the fermentation. The nitrogen gas was filtered using a Pall Corporation Bacterial Air Vent filter size 1 µm (Port Washington, NY, USA). The medium was prepared by dissolving 6.5 g RCM (38 g.L−1) in 170 mL of WS hydrolysate and was sterilized via filter sterilization through a Thermo Scientific Nalgene Rapid-Flow Sterile Disposable Filter Unit, 500 mL (Waltham, MA, USA).

2.8. Recovery of Butyric Acid Using XAD-4 Adsorbent Resin

The adsorbent resin (XAD-4) was obtained from Sigma Chemicals. Upon arrival, it was stored at 4 °C until used for the removal of butyric acid. Five g of XAD-4 was washed 3 times with 10 mL of 50% (v/v) methanol followed by washing twice with 10 mL of ultrapure 18 MΩ water. Washing consisted of stirring the resin and liquid on a stir plate for 10 min. After each wash, the liquid was removed using a filter and Buchner funnel. Solutions of butyric acid ranging from 5 to 206 g.L−1 were prepared in ultrapure 18 MΩ water and 5 mL of butyric acid solution of known concentration was added to the washed XAD-4 and stirred on a stir plate for 10 min at 25 °C (room temperature). The mixture was then separated with a filter paper/Buchner funnel and the recovered liquid was run on HPLC for butyric acid quantization. In these experiments, the recovery of butyric acid from XAD-4 was not performed.

2.9. Analyses

Samples were analyzed for sugar utilization using a Thermo Ultimate HPLC with a BioRad 87P column, along with a BioRad Micro-Guard De-Ashing cartridge and BioRad Micro-Guard Carbo-P cartridge. An isocratic instrument method was used with a flow of 0.6 mL.min−1 and a temperature of 75 °C. For acid production, samples were analyzed using a Shimadzu HPLC, Bio-Rad 87H column, along with a Bio-Rad Carbo-H cartridge. An isocratic method was used with a flow rate of 0.5 mL.min−1 and 65 °C. For cell concentration measurement, optical density was measured at λ 540 nm using a spectrophotometer (Thermoscientific, GENESYS 150, UV-Visible). To measure biomass concentration, or cell concentration, a standard graph was plotted between various optical densities and their corresponding dry weight biomass concentrations. To generate this graph, dry weight was obtained by drying a sample (100 °C) until a constant weight was obtained. Prior to measuring optical density (OD), the samples were diluted 10-fold using 9 g.L−1 NaCl solution. From the above graph, a correlation was developed between optical density vs. cell dry weight concentration. The correlation was as follows: y = 0.214 x3 − 0.159 x2 + 0.2588 x – 0.0009, where y is g cell dry weight concentration in gcdw.L−1 and x is optical density. One unit OD equals to 0.32 gcdw.L−1. After measuring biomass concentration (of the diluted sample), it was multiplied by 10 (dilution factor) to obtain biomass concentration in the fermentation broth. In the figures, the cell concentration is reported as g cell dry weight per L (gcdw.L−1). A similar type of polynomial relationship was found for C. saccharobutylicum P262, C. beijierinckii BA101 and C. beijerinckii P260. These microbial cultures are rod-shaped and have flagella which may affect the OD measurement as it heavily depends upon cell size, cell structure, and the spectrophotometer. It should be noted that the results on biomass measurement by optical density are accurate and within error margins of ±8%. In the batch reactor, productivity was calculated as the total acid production in g.L−1 divided by fermentation time. Fermentation time was the time between inoculation and when the fermentation ceased. In the continuous membrane cell recycle reactor, productivity (g.L−1.h−1) was calculated as total acid produced in g.L−1 multiplied by the dilution rate (h−1). The dilution rate was defined as the feed flow rate in mL.h−1 divided by liquid volume in the reactor. Liquid volume was the total volume in the reactor and circulating tube. The rate of removal of butyric acid was calculated as butyric acid concentration in aqueous solution before adding to the XAD-4 minus residual butyric acid concentration after adsorption divided by recovery time in h. In this experiment, the recovery time was 10 min.
The results presented here are an average of two replications with error margins in the range of ±8%. SAS 9.4, Analysis of Variance (ANOVA) was used to compare the various treatments (fermentations) (p ≤ 0.05). The two replications of acid production from xylose, mixed sugars, and wheat straw hydrolysate fermentation parameters (acids’ productivity and yield) were compared to the glucose control for significance (p ≤ 0.05) using a t-test. Cell recycle productivity was also compared with glucose control using t-test.

3. Results and Discussion

3.1. Control Glucose Fermentation

A batch glucose control fermentation was run with 126.5 g.L−1 glucose in the fermentation medium. The fermentation was performed until the microbial strain ceased to produce butyric acid (192 h). During the course of the fermentation, the culture produced 36.7 g.L−1 butyric acid and 8.1 g.L−1 acetic acid with a total acid production of 44.8 g.L−1. The fermentation resulted in a total acid productivity of 0.23 g.L−1h−1. At the end of the fermentation, 15.9 g.L−1 of glucose remained unused. The fermentation profile of this run is presented in Figure 2. The culture could not utilize all the sugar. The reason for the cessation of fermentation was considered to be an increased toxicity within the growth media due to acid production. The culture used 110.6 g.L−1 of glucose, thus resulting in an acid yield of 0.41 g.g−1. In this experiment, a maximum biomass concentration of 2.51 gcdw.L−1 was obtained at 94 h.
In one study, Luo et al. [4] produced butyric acid from glucose using C. tyrobutyricum and reported a butyric acid concentration and productivity of 27.0 g.L−1 and 0.13 g.L−1h−1, respectively, in 9 days of fermentation. In their fermentation, an initial feed glucose concentration of 75 g.L−1 was used and the residual glucose was 8.35 g.L−1 at the end of fermentation. The butyric acid yield was reported to be 0.39 g.g−1. In another study, Huang et al. [30] produced butyric acid from glucose using immobilized C. tyrobutyricum and reported a total acid production of 21.90 g.L−1. This titer is less than half of that obtained in our study. In their system, a butyric acid yield of 0.42 g.g−1 and a productivity of 0.62 g.L−1h−1 (calculated) were obtained. While their yield is comparable to ours, their productivity was higher. The fermentation time was for 30 h as compared to 192 h in our studies and this was the reason for their high productivity. It appears that their fermentation nutrient medium was richer than that used in these studies, which may have resulted in a faster fermentation and/or higher productivity. Another possible reason for the slower fermentation or low productivity in our study may have been glucose inhibition, as in this study the glucose concentration was 126.5 g.L−1 compared to 58 g.L−1 in Huang’s fermentation [30]. High glucose concentration is inhibitory to the culture.
Since one of the objectives of this study was to use cellulosic biomass, it was considered essential to use cellulosic sugars prior to biomass fermentation. Hence, fermentations were run employing xylose, arabinose, galactose, and mannose. The results suggest that C. tyrobutyricum was able to use all these sugars. The fermentations with arabinose, galactose, and mannose were run in small (10 mL) tubes in which the pH could not be controlled. It should be noted that the combined concentrations of arabinose, galactose, and mannose, in the wheat straw hydrolysate, are <2 g.L−1. In our wheat straw hydrolysate, 1.0 g.L−1 arabinose, 0.2 g.L−1 galactose, and 0.0 g.L−1 mannose were present, for a total of 1.2 g.L−1.

3.2. Xylose Fermentation

Next, a batch fermentation was performed with xylose as the sole carbon source for the production of butyric acid. In this study, the initial xylose concentration was 117.1 g.L−1 and the residual xylose concentration was 14.3 g.L−1. The maximum butyric and acetic acid concentrations were 35.7 and 8.6 g.L−1, respectively, thus totaling 44.3 g.L−1 of acids (Figure 3). The fermentation lasted for 192 h and it resulted in a productivity of 0.23 g.L−1h−1. The productivity obtained in this run and the glucose fermentation were similar. The culture utilized 102.8 g.L−1 xylose with a butyric acid yield of 0.37 g.g−1. The maximum biomass concentration was 2.05 gcdw.L−1, which was 18% lower than that obtained in the glucose fermentation. In a 75 g.L−1 xylose fermentation, Luo et al. [4] reported a butyric acid production of 16.30 g.L−1 with a butyric acid productivity of 0.08 g.L−1h−1 and a yield of 0.32 g.g−1. Compared to glucose, their yield in xylose fermentation decreased from 0.39 to 0.32 g.g−1. In our glucose-based fermentation, the butyric acid yield was 0.41 g.g−1 and, in the xylose-based fermentation, it was 0.37 g.g−1. We also observed a similar phenomenon of decreased butyric acid yield in xylose fermentation as compared to glucose.

3.3. Mixed Sugar Fermentation

Furthermore, a batch fermentation with mixed sugars was performed to determine whether the glucose and xylose were utilized simultaneously. In the reaction mixture, the initial glucose and xylose concentrations were 59.0 and 52.7 g.L−1, respectively. The total sugar concentration was 111.7 g.L−1. Figure 4A shows the acid production profile and Figure 4B shows the sugar utilization profile. Although both sugars were used simultaneously, the rate of glucose utilization was faster than the rate of xylose utilization. At the end of the fermentation, 3.7 g.L−1 glucose and 11.8 g.L−1 xylose remained unused (Figure 4B). The maximum biomass concentration was 2.24 gcdw.L−1 (Figure 4B). In this fermentation, 33.5 g.L−1 of butyric acid and 10.3 g.L−1 of acetic acid were produced, thus totaling 43.8 g.L−1 total acid production (Figure 4A). In this experiment, the culture used 96.2 g.L−1 total sugar that resulted in a yield of 0.46 g.g−1. This experiment also resulted in a productivity of 0.23 g.L−1h−1. Oh et al. produced butyric acid from a mixture of 80 g.L−1 glucose and 30 g.L−1 xylose [31]. In their study, the rate of glucose utilization was much higher than the rate of xylose utilization. It is pointed out that the culture was able to use glucose completely, while some xylose remained unused.

3.4. Cell Recycle Membrane Reactor

In the above batch fermentations, acid productivities of 0.23 g.L−1h−1 were obtained. These productivities are low and need to be improved. A possible reason for these low productivities is the low biomass concentration, which can be improved by the use of cell recycle membranes. Hence, for this purpose, an ultrafiltration membrane was used. A schematic diagram of the membrane reactor is shown in Figure 1. The concentrations of acids obtained at various dilution rates are shown in Figure 5A. The reactor was operated at dilution rates ranging from 0.022 to 0.09 h−1. As the dilution rate increased, productivity improved. At a dilution rate of 0.022 h−1, a productivity of 0.46 g.L−1h−1 was obtained, which is 200% of that achieved in the batch fermentations reported above. At a dilution rate of 0.09 h−1, a productivity of 1.89 g.L−1h−1 was obtained, which is 822% of that achieved in the batch reactor (Figure 5B). Statistical analysis suggested that productivity in the cell recycle bioreactor is significantly higher than the control glucose (Pr > |t| = 0.0002). The biomass concentration and biomass yield obtained in the membrane reactors are shown in Figure 5C. At a dilution rate of 0.022 h−1, a biomass concentration of 3.67 gcdw.L−1 was present in the reactor, whereas at a dilution rate of 0.09 h−1, the biomass concentration was 6.49 gcdw.L−1. At a dilution rate of 0.09 h−1, a specific productivity of 0.29 h−1 was obtained. This type of reactor has the potential to handle biomass concentrations on the order of 70–140 gcdw.L−1 [19,20,21,22,23]. Based on the projected biomass concentrations, and specific productivity of 0.29 h−1 achieved in the present system, a productivity of 20–40 g.L−1h−1 could be achieved. The projected biomass concentration is 11 to 21-fold greater and is reasonable to achieve. However, with such a high biomass concentration, foaming can be a problem. Although antifoam agents are available, adding high antifoam concentrations can inhibit fermentation. In a separate study, Du et al. [32] reported the production of butyric acid in a partial biomass recycle bioreactor. In their system, a maximum productivity of 1.13 g.L−1h−1 was achieved, as opposed to 1.89 g.L−1h−1 in this study. This productivity is 67% higher than that reported by Du et al. [32].

3.5. Butyric Acid Production from Wheat Straw Hydrolysate (WSH)

This study was performed with the final aim to produce butyric acid from lignocellulosic biomass. In this system, two fermentations were performed: (a) pH-uncontrolled fermentation, and (b) pH-controlled fermentation of liquid hot water pretreated, enzymatically saccharified wheat straw. In the pH-uncontrolled fermentation, maximum acetic acid and butyric acid concentrations of 3.3 and 7.3 g.L−1 were achieved, respectively. The residual concentration of sugars was 17.9 g.L−1. In this fermentation, the initial pH was adjusted to 6.5 and, due to the production of acids (acetic and butyric), the final pH decreased to 4.8. A pH of 4.8 is low for the efficient cultivation of bacteria and, for this reason, the fermentation was fast as it lasted only 48 h, resulting in a productivity of 0.22 g.L−1h−1.
In the pH-controlled WSH fermentations, butyric acid was produced faster than in the glucose, xylose, or mixed-sugar fermentations. In a period of 81 h, the strain produced 22.15 g.L−1 of total acids, of which 15.0 g.L−1 was butyric acid and 7.15 g.L−1 was acetic acid [Figure 6A]. This resulted in a productivity of 0.27 g.L−1h−1 which was higher than the glucose fermentation productivity. Statistical analysis also suggested that WSH productivity is significantly higher than glucose control (Pr > F = 0.0238, <0.05). The initial sugar concentrations in the hydrolysate were 37.50 g.L−1 glucose, 12.95 g.L−1 xylose, 1.0 g.L−1 arabinose, 0.2 g.L−1 galactose, and 0.0 g.L−1 mannose. In this system, the focus was placed on the use of glucose and xylose. Both of these sugars were used simultaneously and xylose was utilized completely by 48 h while glucose was used by 81 h. The sugar profile of these two major sugars, in this fermentation, is shown in Figure 6B. In this fermentation, an acid yield of 0.43 g.g−1 was obtained.
The fermentation performance of control glucose, xylose, and mixed sugars is compared with WSH fermentation. The fermentation parameters in WSH fermentation are superior than pure sugars or mixed sugar fermentations. In the WSH fermentation, a productivity of 0.27 g.L−1h−1 was observed, which is higher than pure sugars or mixed-sugar fermentations. Also, total acid yield in the WSH fermentation (0.43 g.g−1) was higher than the control glucose (0.40 g.g−1) and xylose (0.37 g.g−1) fermentations.
Several authors have used cellulosic biomass either as a sole carbohydrate source or as a mixture of cellulosic biomass and sugars [31,33,34] to produce butyric acid. However, the most relevant study to our investigation is that of Xiao et al.’s, who used a corn husk hydrolysate [35] for this fermentation. In that study, they used diluted sulfuric acid to pretreat the biomass, while we used water at 190 °C to pretreat wheat straw. Xiao et al.’s study resulted in the production of 21.80 g.L−1 butyric acid with a yield of 0.39 g.g−1 [35]. From the biomass pretreatment point of view, our studies are environmentally friendlier and economical because no potentially harmful or costly chemicals were used for pretreatment.

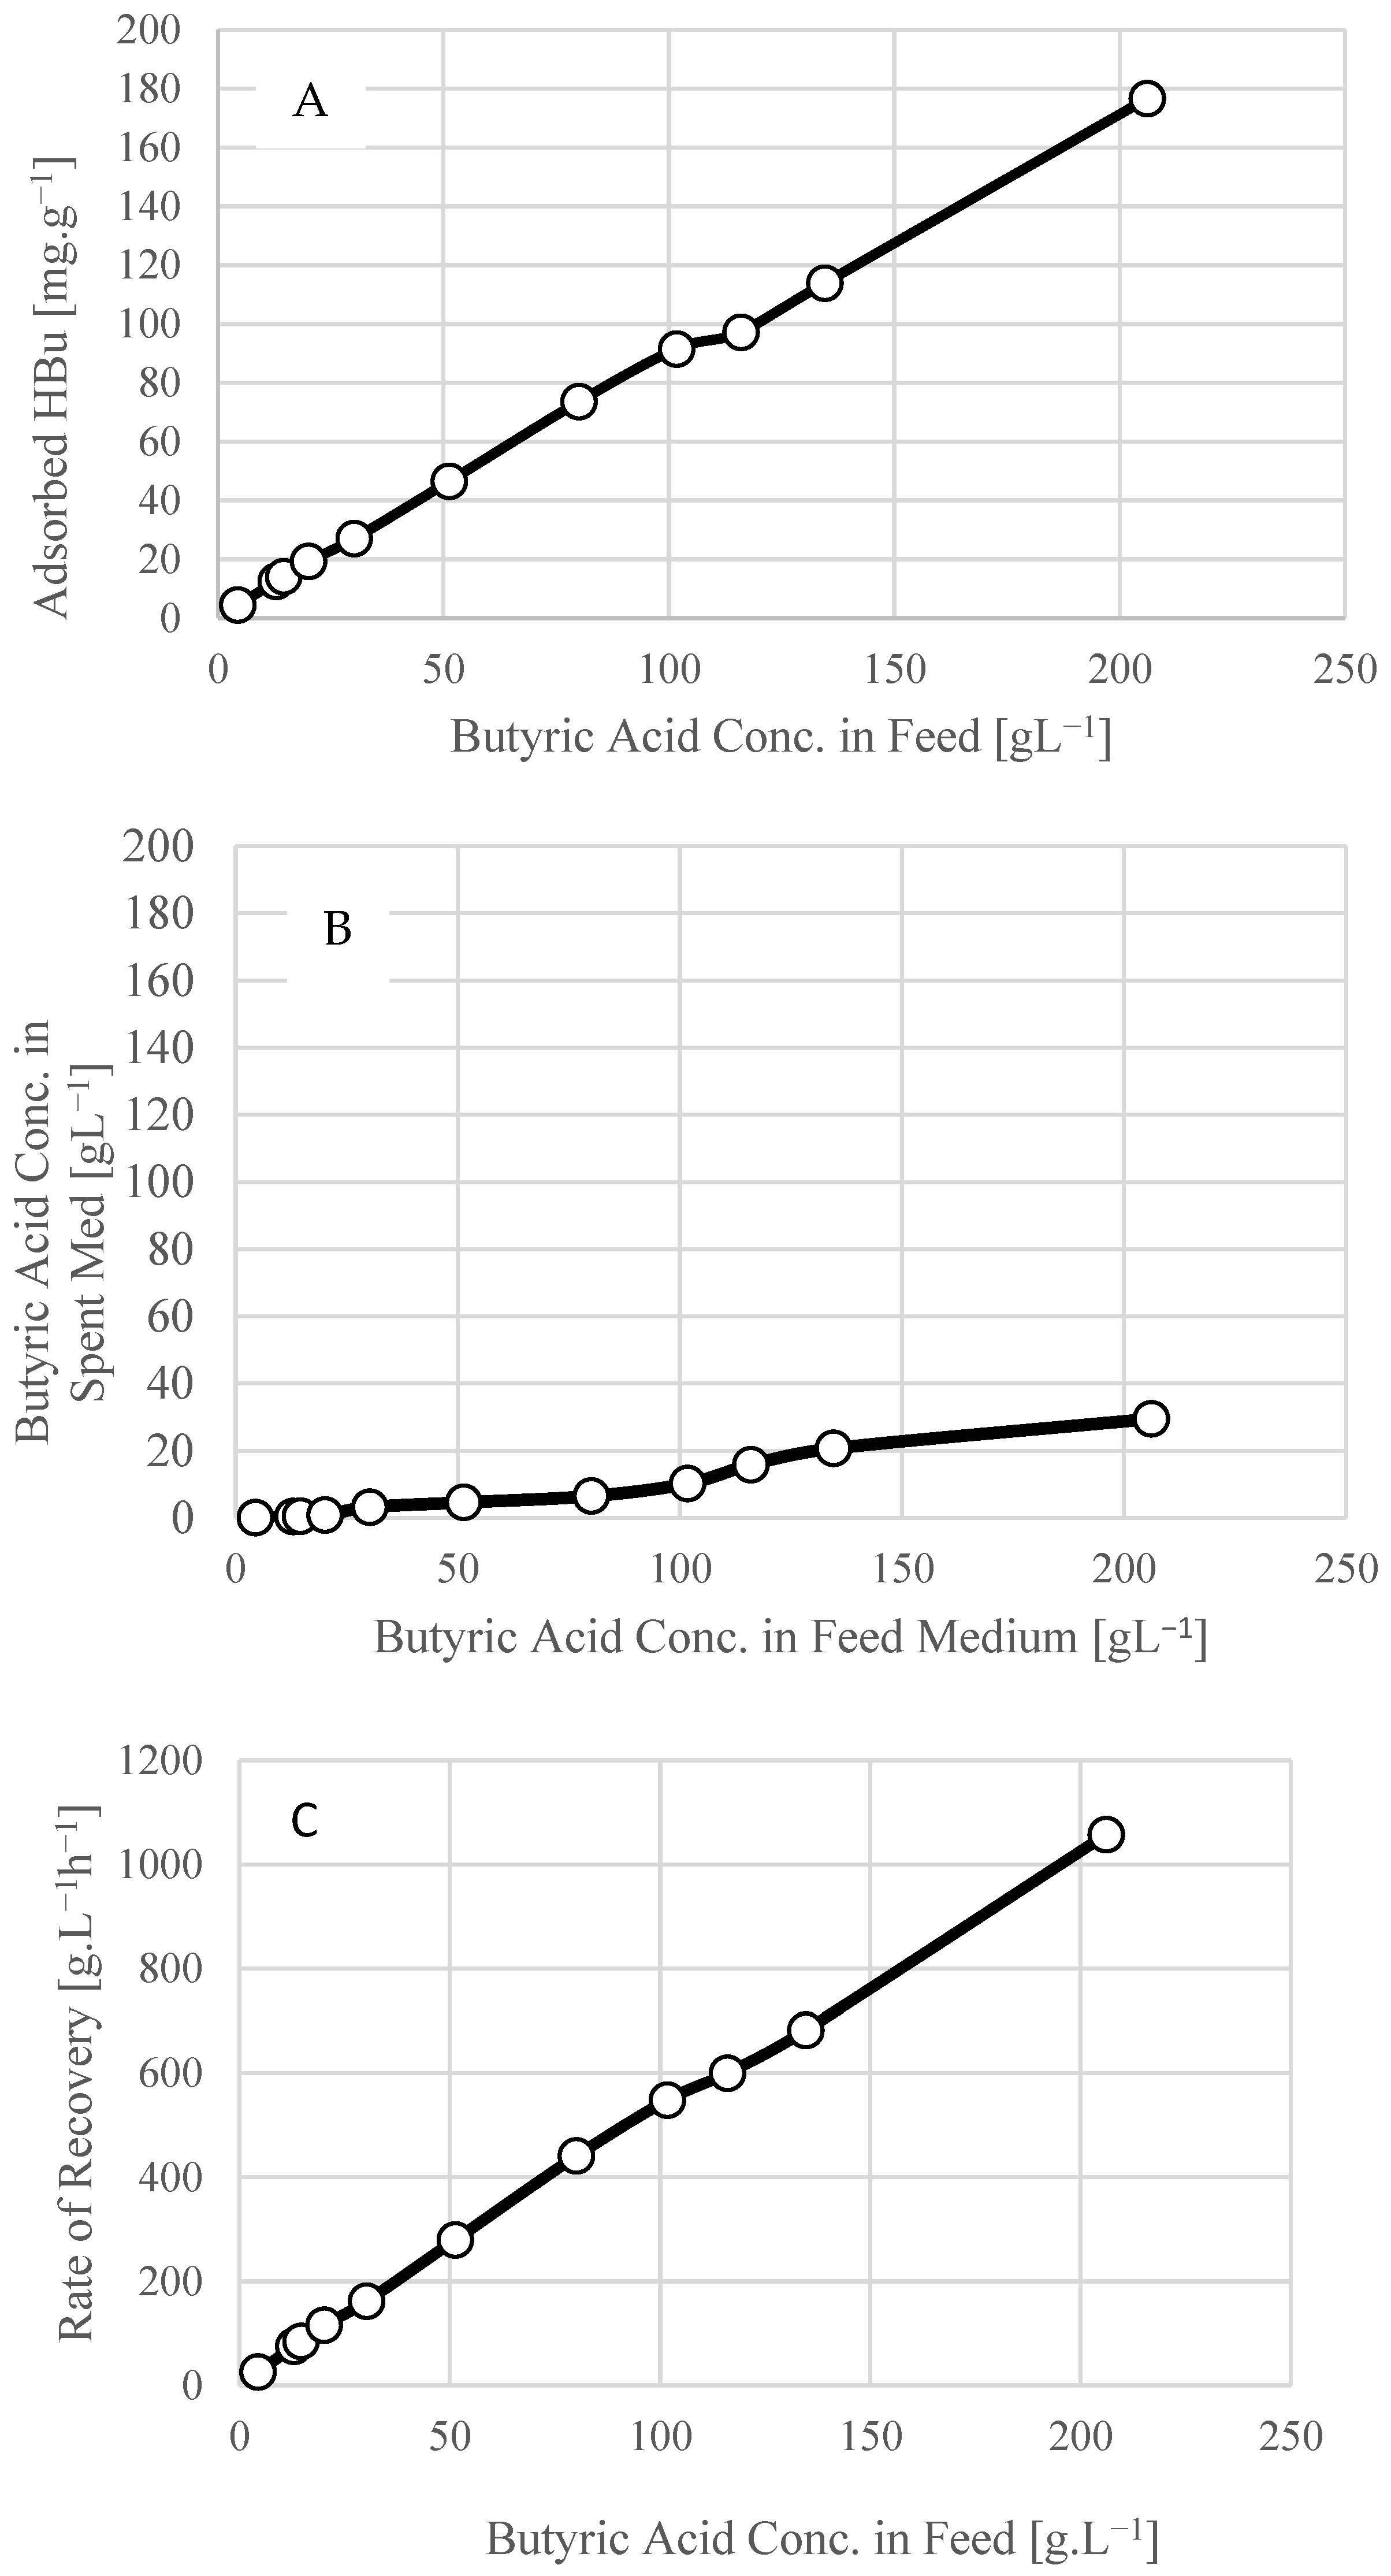
3.6. Recovery of Butyric Acid

For the present study, butyric acid was adsorbed on XAD-4. Various concentrations of butyric acid ranging from 4.4 to 206.1 g.L−1 were added to the adsorbent. At a butyric acid concentration of 206.1 g.L−1 in the feed medium, the butyric acid concentration in the spent medium (after adsorption) was 29.5 g.L−1, suggesting that the adsorbent bound 176.6 mg.g−1 of the available butyric acid. The adsorption capacity of butyric acid on XAD-4 is shown in Figure 7A. The concentrations of butyric acid in the feed and spent media are shown in Figure 7B and the rate of its removal is presented in Figure 7C. It should be noted that adsorption was fast and took place within 10 min and 85.7% (w/w) of the butyric acid was adsorbed. Adsorption in such a short period of time resulted in a high rate of removal (1059.4 g.L−1h−1). Such a high rate of removal would require low capital costs and hence low process recovery costs.
For economic purposes, the recovery of butyric acid by distillation is not feasible as its boiling point (163.5 °C) is higher than water (100 °C). Hence, it should be recovered using energy-efficient product recovery techniques. The techniques that have been applied include extractive fermentations [1,24,25], nanofiltration [26], adsorption onto zeolite [27], CO2 extraction under high pressure [28], and salting out extraction [29]. The basic requirements of a recovery process should be: (i) a fast rate of recovery, (ii) the recovery medium should be reusable or recyclable; (iii) it should not pose any health hazards; (iv) it should be durable or the adsorbent life should be long; and (v) it should not be toxic to the microorganism. This adsorbent resin, XAD-4, possesses all the above characteristics and hence it was chosen for this purpose.
In this study, RCM was used as a nutrient source, which may be costly. Since nutrient sources such as corn steep liquor (CSL) and soy molasses (SM) are commercially available, they may ultimately be more economical and should be used where possible. In our previous study, we confirmed that CSL can be effectively used as a nutrient source in this fermentation [3]. The reader is informed that the objectives of this study have been achieved.

4. Conclusions

In this study, glucose at a concentration of 126.5 g.L−1 was used as a control feedstock for butyric acid production using C. tyrobutyricum. During batch fermentation, the strain produced 44.8 g.L−1 of total acids with a productivity of 0.23 g.L−1h−1 and a yield of 0.41 g.g−1. By using xylose as a sole carbon source, the strain produced 44.3 g.L−1 of total acids with a yield of 0.37 g.g−1 and a productivity of 0.23 g.L−1h−1. The strain was capable of using xylose alone at a fast rate. In mixed substrate fermentations where glucose and xylose were fed to the culture, it used both substrates simultaneously, though at different utilization rates. In cell or biomass recycle membrane fermentation, a maximum productivity of 1.89 g.L−1h−1 was achieved, which was 822% of that found in the control glucose or xylose fermentations. The membrane reactor was run in continuous mode at dilution rates ranging from 0.022 to 0.09 h−1. It was projected that the membrane cell or biomass recycle bioreactor was capable of producing acids at productivities ranging from 20 to 40 g.L−1h−1. The butyric acid was also produced from wheat straw hydrolysate in a batch system. Milled wheat straw was pretreated using hot water alone at 190 °C and no chemicals were needed for pretreatment. The results of WSH fermentation were superior to glucose or xylose fermentation and produced acids at a rate of 0.27 g.L−1h−1 and a yield of 0.44 g.g−1. We were also successful in adsorbing butyric acid from model solutions using adsorbent resin XAD-4. The capacity of adsorption was greater than 176.6 mg.g−1 resin. The adsorption process was fast and 86% of the butyric acid [(206.1 − 29.5)/206.1] was adsorbed in 10 min. The resin was able to adsorb 176.6 g.L−1 of butyric acid with a rate of removal of 1059.4 g.L−1h−1.

Author Contributions

N.Q.—conception, running experiments and preparing the manuscript; R.D.A.—reviewing manuscript; N.N.N.—contributed to the design and execution of the experiments with wheat straw hydrolysate; R.H.—Supervision. All authors participated in preparing and reviewing the manuscript. All authors have read and agreed to the published version of the manuscript.

Funding

Financial support was provided by the United States Department of Agriculture, Agricultural Research Service (CRIS Number 5010-41000-189-00D).

Institutional Review Board Statement

Not applicable. This study did not involve humans or animals.

Informed Consent Statement

Not applicable. This study did not involve humans.

Data Availability Statement

All data generated in this study are presented in this paper.

Acknowledgments

NQ would like to thank Mukti Singh for performing statistical analysis. NQ would also like to thank Maria Brauer and Sarah Frazer for providing exceptional technical assistance.

Conflicts of Interest

The authors do not have any conflicts of interest. Mention of trade names or commercial products in this article is solely for the purpose of providing scientific information and does not imply recommendation or endorsement by the United States Department of Agriculture. USDA is an equal opportunity provider and employer.

References

  1. Wu, Z.; Yang, S.-T. Extractive fermentation for butyric acid production from glucose by Clostridium tyrobutyricum. Biotechnol. Bioeng. 2003, 82, 93–102. [Google Scholar] [CrossRef]
  2. Pouillart, P.R. Role of butyric acid and its derivatives in the treatment of colorectal cancer and hemoglobinopathies. Life Sci. 1998, 63, 1739–1760. [Google Scholar] [CrossRef] [PubMed]
  3. Qureshi, N.; Liu, S.; Saha, B.C. Butyric acid production by fermentation: Employing potential of the novel Clostridium tyrobutyricum strain NRRL 67062. Fermentation 2022, 8, 491. [Google Scholar] [CrossRef]
  4. Luo, G.; Zhang, L.; Chen, T.; Yuan, W.; Geng, Y. Butyric acid fermentation in xylose and glucose by Clostridium tyrobutyricum. Bioresources 2017, 12, 2930–2940. [Google Scholar] [CrossRef]
  5. Ramey, D.E. Continuous Two Stage, Dual Path Anaerobic Fermentation of Butanol and Other Organic Solvents Using Two Different Strains of Bacteria. U.S. Patent 5,753,474, 19 May 1998. [Google Scholar]
  6. Huang, H.; Qureshi, N.; Chen, M.-H.; Liu, W.; Singh, V. Ethanol production from food waste at high solids content with vacuum recovery technology. J. Agric. Food Chem. 2015, 63, 2760–2766. [Google Scholar] [CrossRef] [PubMed]
  7. Claassen, P.A.M.; Budde, M.A.W.; Lopez-Contreras, A.M. Acetone, butanol and ethanol production from domestic organic waste by solventogenic clostridia. J. Mol. Microbiol. Biotechnol. 2000, 2, 39–44. [Google Scholar]
  8. Farmanbordar, S.; Amiri, H.; Karimi, K. Simultaneous organosolv pretreatment and detoxification of municipal solid waste for efficient biobutanol production. Bioresour. Technol. 2018, 270, 236–244. [Google Scholar] [CrossRef]
  9. Farmanbordar, S.; Karimi, K.; Amiri, H. Municipal solid waste as a suitable substrate for butanol production as an advanced biofuel. Energy Convers. Manag. 2018, 157, 396–408. [Google Scholar] [CrossRef]
  10. Raganati, F.; Procentese, A.; Olivieri, G.; Russo, M.E.; Marzocchella, A. Butanol production by fermentation of fruit residues. Chem. Eng. Trans. 2016, 49, 229–234. [Google Scholar]
  11. Luo, W.; Zhao, Z.; Pan, H.; Zhao, L.; Xu, C.; Yu, X. Feasibility of butanol production from wheat starch wastewater by Clostridium acetobutylicum. Energy 2018, 154, 240–248. [Google Scholar] [CrossRef]
  12. Ezeji, T.C.; Blaschek, H.P. Fermentation of dried distillers’ grains and solubles (DDGS) hydrolysates to solvents and value-added products by solventogenic clostridia. Bioresour. Technol. 2008, 99, 5232–5242. [Google Scholar] [CrossRef] [PubMed]
  13. Microsoft Bing Search. How Much Food Waste Is Produced in the United States? Searched on 17 November 2023.
  14. Liu, S.; Duncan, S.; Qureshi, N.; Rich, J. Fermentative production of butyric acid from paper mill sludge hydrolysates using Clostridium tyrobutyricum NRRL B-67062/RPT 4213. Biocatal. Agric. Biotechnol. 2018, 14, 48–51. [Google Scholar] [CrossRef]
  15. Liu, S.; Bischoff, K.M.; Leathers, T.D.; Rich, J.O.; Hughes, S.R. Butyric acid from anaerobic fermentation of lignocellulosic biomass hydrolysates by Clostridium tyrobutyricum strain RPT-4213. Bioresour. Technol. 2013, 143, 322–329. [Google Scholar] [CrossRef] [PubMed]
  16. Guan, W.; Shi, S.; Tu, M.; Lee, Y.Y. Acetone-butanol-ethanol production from Kraft paper mill sludge by simultaneous saccharification and fermentation. Bioresour. Technol. 2016, 200, 713–721. [Google Scholar] [CrossRef] [PubMed]
  17. Alam, S.; Stevens, D.; Bajpai, R. Production of butyric acid by batch fermentation of cheese whey with Clostridium beijerinckii. J. Ind. Microbiol. 1988, 2, 359–364. [Google Scholar] [CrossRef]
  18. Lienhardt, J.; Schripsema, J.; Qureshi, N.; Blaschek, H.P. Acetone butanol ethanol (ABE) production in an immobilized cell biofilm reactor: Increase in sugar utilization. Appl. Biochem. Biotechnol. 2002, 98, 591–598. [Google Scholar] [CrossRef] [PubMed]
  19. Ohleyer, E.; Blanch, H.W.; Wilke, C.R. Continuous production of lactic acid in cell recycle reactor. Appl. Biochem. Biotechnol. 1985, 11, 317–332. [Google Scholar] [CrossRef]
  20. Mehaia, M.A.; Cheryan, M. Lactic acid from whey permeate in a membrane recycle bioreactor. Enzym. Microb. Technol. 1986, 8, 289–292. [Google Scholar] [CrossRef]
  21. Cheryan, M.; Mehaia, M.A. A high-performance membrane bioreactor for continuous fermentation of lactose to ethanol. Biotechnol. Lett. 1983, 5, 519–524. [Google Scholar] [CrossRef]
  22. Afschar, A.S.; Biebl, H.; Schaller, K.; Schugerl, K. Production of acetone and butanol by Clostridium acetobutylicum in a continuous culture with cell recycle. Appl. Microbiol. Biotechnol. 1985, 22, 394–398. [Google Scholar] [CrossRef]
  23. Pierrot, P.; Fick, M.; Engasser, J.M. Continuous acetone-butanol fermentation with high productivity by cell ultrafiltration and recycling. Biotechnol. Lett. 1986, 8, 253–256. [Google Scholar] [CrossRef]
  24. Oh, H.W.; Lee, S.C.; Woo, H.C.; Kim, Y.H. Energy-efficient recovery of fermented butyric acid using octyl acetate extraction. Biotechnol. Biofuels Bioprod. 2022, 15, 46. [Google Scholar] [CrossRef] [PubMed]
  25. Baroi, G.N.; Skiadas, I.V.; Westermann, P.; Gavala, H.N. Effect of in situ acids removal on mixed glucose and xylose fermentation by Clostridium tyrobutyricum. AMB Expr. 2015, 5, 67. [Google Scholar] [CrossRef]
  26. Zaman, N.K.; Law, J.Y.; Chai, P.V.; Rohani, R.; Mohammad, A.W. Recovery of organic acids from fermentation broth using nanofiltration technologies: A review. J. Phys. Sci. 2017, 28, 85–109. [Google Scholar] [CrossRef]
  27. Faisal, A.; Zarebska, A.; Saremi, P.; Korelskiy, D.; Ohlin, L.; Rova, U.; Hedlund, J.; Grahn, M. MFI zeolite as adsorbent for selective recovery of hydrocarbons from ABE fermentation broths. Adsorption 2014, 20, 465–470. [Google Scholar] [CrossRef]
  28. Chun, J.; Choi, O.; Sang, B.-I. Enhanced extraction of butyric acid under high-pressure CO2 conditions to integrate chemical catalysis for value-added chemicals and biofuels. Biotechnol. Biofuels 2018, 11, 19. [Google Scholar] [CrossRef]
  29. Fu, H.; Wang, X.; Sun, Y.; Yan, L.; Shen, J.; Wang, J.; Yang, S.-T.; Xiu, Z. Effects of salting-out and salting-out extraction on the separation of butyric acid. Sep. Purif. Technol. 2017, 180, 44–50. [Google Scholar] [CrossRef]
  30. Huang, J.; Dai, H.; Yan, R.; Wang, P. Butyric acid production from recycled waste paper by immobilized Clostridium tyrobutyricum in a fibrous-bed bioreactor. J. Chem. Technol. Biotechnol. 2016, 91, 1048–1054. [Google Scholar] [CrossRef]
  31. Oh, H.J.; Kim, K.-Y.; Lee, K.M.; Lee, S.-M.; Gong, G.; Oh, M.-K.; Um, Y. Butyric acid production with high selectivity coupled with acetic acid consumption in sugar-glycerol mixture fermentation by Clostridium tyrobutyricum ATCC 25755. J. Ind. Eng. Chem. 2019, 75, 44–51. [Google Scholar] [CrossRef]
  32. Du, J.; McGraw, A.; Lorenz, N.; Beitle, R.R.; Clausen, E.C.; Hestekin, J.A. Continuous fermentation of Clostridium tyrobutyricum with partial cell recycle as a long-term strategy for butyric acid production. Energies 2012, 5, 2835–2848. [Google Scholar] [CrossRef]
  33. Wang, L.; Ou, M.S.; Nieves, I.; Erickson, J.E.; Vermerris, W.; Ingram, L.O.; Shanmugam, K.T. Fermentation of sweet sorghum derived sugars to butyric acid at high titer and productivity by a moderate thermophile Clostridium thermobutyricum at 50 °C. Bioresour. Technol. 2015, 198, 533–539. [Google Scholar] [CrossRef] [PubMed]
  34. Sjöblom, M.; Matsakas, L.; Christakopolous, P.; Rova, U. Production of butyric acid by Clostridium tyrobutyricum (ATCC25755) using sweet sorghum stalks and beet molasses. Ind. Crops Prod. 2015, 74, 535–544. [Google Scholar] [CrossRef]
  35. Xiao, Z.; Cheng, C.; Bao, T.; Liu, L.; Wang, B.; Yao, W.; Tao, W.; Pei, X.; Yang, S.-T.; Wang, M. Production of butyric acid from acid hydrolysate of corn husk in fermentation by Clostridium tyrobutyricum: Kinetics and process economic analysis. Biotechnol. Biofuels 2018, 11, 164. [Google Scholar] [CrossRef] [PubMed]
Figure 1. A schematic diagram of production of butyric acid in a continuous cell recycle membrane bioreactor using Clostridium tyrobutyricum.
Fermentation 10 00142 g001
Figure 2. Production of butyric acid from glucose in a batch fermentation using C. tyrobutyricum. HAc—acetic acid, HBu—butyric acid, HAB—total acetic plus butyric acids, Glu—glucose, Biomass conc.—biomass concentration.
Fermentation 10 00142 g002
Figure 3. Production of butyric acid from xylose in a batch fermentation using C. tyrobutyricum. Xyl—xylose. All other nomenclatures as in Figure 2.
Fermentation 10 00142 g003
Figure 4. Production of butyric acid in a batch reactor using mixed sugars (glu + xyl) and C. tyrobutyricum. (A) Fermentation time vs. acids; (B) Fermentation time vs. sugars and biomass concentration. Nomenclature as in Figure 2 and Figure 3.
Fermentation 10 00142 g004
Figure 5. Production of butyric acid in a continuous membrane cell recycle reactor employing glucose and C. tyrobutyricum. (A) Dilution rate vs. acids; (B) Dilution rate vs. productivity and specific productivity; (C) Dilution rate vs. Biomass concentration and Biomass yield. Total Sug—total sugar; prod—productivity; Sp-prod—specific productivity; Biomass conc.—Biomass concentration. Other nomenclature as in Figure 4.
Fermentation 10 00142 g005aFermentation 10 00142 g005b
Figure 6. Production of butyric acid from wheat straw hydrolysate employing C. tyrobutyricum. (A) Fermentation time vs. acid production; (B) Fermentation time vs. sugars and biomass. Nomenclature as in Figure 2 and Figure 3.
Fermentation 10 00142 g006
Figure 7. Adsorption of butyric acid on XAD-4 resin. (A) Butyric acid concentration in feed medium vs. adsorbed butyric acid (HBu); (B) Butyric acid conc. (concentration) in feed medium vs. butyric acid concentration in spent (residual) medium; and (C) Butyric acid conc (concentration) in feed medium vs. Rate of recovery of butyric acid.
Fermentation 10 00142 g007
Disclaimer/Publisher’s Note: The statements, opinions and data contained in all publications are solely those of the individual author(s) and contributor(s) and not of MDPI and/or the editor(s). MDPI and/or the editor(s) disclaim responsibility for any injury to people or property resulting from any ideas, methods, instructions or products referred to in the content.

