Article

Effect of Different Salt Additions on the Flavor Profile of Fermented Ciba Pepper

1
Cuisine Science Key Laboratory of Sichuan Province, Sichuan Tourism University, Chengdu 610100, China
2
College of Food and Biological Engineering, Chengdu University, Chengdu 610106, China
3
College of Food Science and Technology, Southwest Minzu University, Chengdu 610041, China
*
Authors to whom correspondence should be addressed.
Fermentation 2024, 10(2), 111; https://doi.org/10.3390/fermentation10020111
Submission received: 12 January 2024 / Revised: 7 February 2024 / Accepted: 16 February 2024 / Published: 18 February 2024
(This article belongs to the Special Issue Flavor and Aroma in the Fermented Food)

Abstract

:
Salt is a key ingredient that can both enhance the taste and extend the shelf life of fermented vegetables. However, it is important to note that excessive salt levels can have adverse effects on consumer health. This study aimed to investigate the impact of various salt additions (2%, 4%, 6%, 8%, and 10% wt/wt) on the flavor profile of fermented ciba pepper, a traditional Chinese fermented chili sauce, using gas chromatography–ion mobility spectrometry (GC-IMS) in combination with an electronic nose (E-nose). Fermented ciba pepper samples were prepared with different salt additions: 2% (LJA), 4% (LJB), 6% (LJC), 8% (LJD), and 10% (LJE) (wt/wt). The physicochemical and sensory properties of the fermented ciba pepper samples were evaluated. Sensory evaluation indicated that LJC and LJD received higher scores compared to the other groups. The total acid and amino acid nitrogen contents displayed contrasting trends with the salt additions (p < 0.05). The E-nose analysis successfully differentiated the flavor profiles of the ciba pepper samples fermented with varying salt additions. Additionally, the GC-IMS analysis identified a total of 72 volatile compounds, including 14 alcohols, 21 esters, nine aldehydes, four acids, eight ketones, three terpenes, and eight other substances. Notably, the ciba pepper samples with lower salt additions exhibited higher levels of alcohols, aldehydes, and esters. In conclusion, the addition of salt during the fermentation process significantly influenced the formation of flavor compounds in ciba pepper. This study provides valuable insights into ciba pepper fermentation with different salt additions and offers prospects for the development of low-salt fermented ciba pepper products.

1. Introduction

Ciba pepper, a traditional fermented food, holds significant cultural importance and has become a staple in the daily diets of regions like Guizhou, Chongqing, and Sichuan. Typically, ciba pepper is prepared by fermenting fully cooked dried peppers, along with salt, ginger, and garlic. The fermentation process takes place at room temperature and lasts for approximately 28–40 days. The salinity of ciba peppers is usually around 10%. Previous studies indicated that the microbial composition of chili sauce undergoes changes during fermentation, contributing to the development of a milder and more balanced flavor profile [1]. In addition to its distinctive taste, fermented chili sauce is known to contain a range of bioactive substances, including carotenoids, flavonoids, polyphenols, and vitamin C (VC), also known as ascorbic acid [2]. These compounds confer various functional properties upon the sauce, such as antioxidant and anti-obesity effects [3]. They may also aid in reducing cholesterol formation and preventing fatty liver disease, benefiting consumers’ overall health [4,5]. Salt, a crucial factor in the fermentation process of most vegetables, serves not only to extend their shelf life but also to enhance their taste. Numerous studies highlighted the pivotal role of salt in preserving the quality of fermented vegetables by creating an osmotic pressure that inhibits the growth of spoilage bacteria and creates a favorable environment for the proliferation of lactic acid bacteria (LAB), a vital aspect of vegetable fermentation [6]. However, the excessive consumption of dietary sodium has raised concerns in recent years due to its negative impact on human health. High salt intake has been linked to cardiovascular and cerebrovascular diseases, as well as diabetes [7,8]. Moreover, the high salt content in ciba pepper poses challenges to its industrial development. The elevated salinity slows down microbial growth, resulting in prolonged fermentation time and hindering ciba pepper large-scale production. Hence, achieving a balance between a low salt concentration and a high fermentation quality is a key consideration for large-scale ciba pepper production. In recent years, there has been a growing trend towards using low-salt alternatives in the food industry. Jiang et al. [9] discovered that bean paste exhibits higher levels of organic acids and unsaturated fatty acids under low salt conditions (6%), which also leads to a shorter fermentation time. Similarly, Chun et al. [10] found that lower salt (9%) doenjang samples exhibited a more diverse range and higher levels of volatile compounds compared to samples with higher salt (18%) content. However, limited research has been conducted on low-salt fermented ciba peppers, and it remains uncertain whether reducing the salt content negatively affects the quality of the final product. Therefore, further investigation is warranted to comprehensively understand the influence of salt on the flavor profiles of ciba pepper during fermentation and to achieve a successful low-salinity fermentation.
Flavor is an essential attribute of fermented vegetables as it plays a significant role in driving consumer preference and acceptance [11]. The E-nose is a rapid detection technology that utilizes chemical sensors and pattern recognition systems to identify differences in volatile substances in food [12]. This objective device aims to mimic human olfactory perception without relying on subjective judgments. It provides advantages such as rapid response, user-friendly operation, and reliability. On the other hand, GC-IMS is an analytical technique that combines the separation capacity of gas chromatography (GC) with the sensitivity and speed of ion mobility spectrometry (IMS) by utilizing the differential migration rate of gas-phase ions in an electric field [13]. It offers high accuracy in analyzing chemical substances and has found widespread application in the analysis of fermented foods, including wine [14], Suancai [15], and soybean [16]. For a comprehensive understanding of the sensory characteristics of a type of food, coupling GC-IMS with an electronic nose is ideal. Chen et al. [17] demonstrated that by using GC-IMS combined with the E-nose, the flavor profile differences of three coffee samples (bean, powder, and brew) from three different brands could be quickly and accurately detected. However, there is currently limited research on the combined application of GC-IMS and the E-nose technology to investigate flavor changes during ciba pepper fermentation.
To address these research gaps, we conducted a study where we prepared five types of ciba pepper samples fermented with varying salt concentrations. In this study, we employed the E-nose and GC-IMS techniques to differentiate between ciba pepper samples with different salt concentrations. Additionally, a metabolomics approach based on GC-IMS was used to determine the flavor characteristics of these samples. By establishing the volatile fingerprints of five types of ciba pepper, our study contributes to a better understanding of low-salinity chili sauce production in China and provides a foundation for its industrial-scale production.

2. Materials and Methods

2.1. Production of Fermented Ciba Pepper

The dry peppers used in this study were procured from Zui Chuanwei Food Co., Ltd. (Zui Chuanwei Food Co., Ltd., Chengdu, China). Three varieties of peppers were utilized, i.e., American red, Bell pepper, and Devil pepper, mixed in the ratio of 3:2:1 (wt/wt). Prior to chopping, the mixed peppers were cooked with distilled water. Subsequently, 6% ginger, 6% garlic, and 4% sugar were added to the mixture, which was then crushed for approximately 10 s using a crusher. Following this, the mixture was combined with edible salt in concentrations of 2%, 4%, 6%, 8%, and 10% (wt/wt). For clarity in representing the results, the ciba pepper samples fermented with salt concentrations of 2%, 4%, 6%, 8%, and 10% (wt/wt) were labeled as LJA, LJB, LJC, LJD, and LJE, respectively. The resulting mixtures were transferred into sterile pickle jars, covered, and sealed with water, before being left to ferment for 35 days at room temperature in the absence of sun light.

2.2. Physicochemical Analysis

The pH of the ciba pepper samples was measured by a pH-S470-k meter (Mettler-Toledo, Greifensee, Switzerland) following calibration with standard buffer solutions. The total acid content was determined by titrating the samples to pH 8.3 using 0.05 M NaOH and expressed as a percentage (w/v) of lactic acid. The concentration of amino acid nitrogen was determined by titrating the samples with 0.05 M sodium hydroxide (NaOH) to pH 8.3, followed by the addition of 10.0 mL of formaldehyde solution and further titration with 0.05 M NaOH to pH 9.2. The experiment was conducted in triplicate. The determination of amino acid nitrogen content was performed according to the method described by Jiang et al. [18].

2.3. Microbiological Analysis

Twenty-five grams of fermented ciba pepper as diluted with 225 mL of a 0.9% saline solution and homogenized for 5 min. Following appropriate gradient dilution, the total colony count was determined on a plate count agar (PCA) plate (Shanghai Bo Microbial Technology Co., Ltd., Shanghai, China) incubated at 37 °C for 48 h. The count of lactic acid bacteria was determined on de Man, Rogosa, and Sharpe (MRS) agar plates (Shanghai Bo Microbial Technology Co., Ltd., Shanghai, China) incubated at 36 °C for 72 h. The experiment was conducted in triplicate.

2.4. Sensory Evaluation

The sensory evaluation was based on a previously described method, with slight modifications [19]. Ten volunteers, including five women and five men, who had received sensory training in food evaluation, were involved in the sensory evaluation of ciba pepper samples with five different salt concentrations. The evaluation took place in separate sensory evaluation booths, where the participants assessed the color, aroma, taste, and texture of the samples using a nine-point hedonic scale. The samples were graded as excellent, good, moderate, or poor, corresponding to score ranges of 1–9 points for each evaluation criterion. The overall sensory evaluation criteria are presented in Table 1. The samples were presented to the team members in a random order, and the participants evaluated the aroma by sniffing each sample at 30 s intervals. For the taste analysis, the team members took one mouthful of each sample, with a 60 s interval between the samples. They drank milk during this time and rinsed their mouths with water afterward.

2.5. GC-IMS Analysis

The ciba pepper samples were analyzed using the Flavorspec® GC-IMS flavor analyzer (Gesellschaft für Analytische Sensorsysteme mbH, Dortmund, Germany). A 0.4 g portion of each pepper sample was accurately weighed and placed in a 20 mL glass headspace vial. The vial was equipped with an MXT-1 column (15 m × 0.53 mm). Subsequently, the vial was incubated at 50 °C for 15 min to allow for the release of volatile compounds. Following the incubation, an automated syringe injection of 500 μL of the headspace sample was performed. Nitrogen gas (99.99% purity) was used as the carrier gas, and the IMS detector was maintained at a temperature of 45 °C. The programmed flow rate was as follows: 2 mL/min for 2 min, linearly increased to 10 mL/min over 3 min, further increased to 15 mL/min for 10 min, raised to 50 mL/min for 5 min, and finally increased to 100 mL/min for 10 min. The total runtime of the GC analysis was 30 min. Upon separation in the capillary column, the headspace content was introduced into the ionization chamber for ionization, then passed through the shutter grid into the drift zone, and finally into the IMS detector. The drift tube had a length of 98 mm and was maintained at a temperature of 45 °C. The drift gas (nitrogen, purity ≥ 99.999%) flow rate was set at 150 mL/min. The experiment was conducted in triplicate to ensure reproducibility. The concentrations of the detected compounds were based on the peak volume of the selected signal peak.

2.6. E-Nose Analysis

A Fox 4000 Sensory Array Fingerprint Analyzer (Alpha M.O.S., Toulouse, France) was employed to analyze the odor profile of the ciba pepper samples. The E-nose system consisted of a sampling apparatus, a detector unit equipped with an array of 18 different metal oxide sensors, and pattern recognition software for data recording and analysis. For each analysis, precisely 1 g of a ciba pepper sample was placed into a sample vial and allowed to equilibrate at 70 °C in an air bath for 5 min prior to the start of the experiment. Clean and dry air was used as the carrier gas with a flow rate of 150 mL/min. The injection speed was set at 500 μL/s, and the injection period lasted for 1 s. Odor data were recorded every second for a total duration of 120 s. Each sample was subjected to eight parallel experiments to ensure consistency and reliability of the results.

2.7. Data Analysis

The statistical analysis was performed using the R computational language. Prior to conducting univariate analyses, the data distribution was normalized using the Box and Cox transformation. To identify significant differences between groups (p < 0.05), t-tests were applied. Following the recommendations of previous studies [20], robust principal component analysis (rPCA) models were constructed to provide a comprehensive overview of the data. These models utilized the average values of the E-nose sensors and peak signal intensities from the flavor profiles. For each rPCA model, a score plot and a Pearson correlation plot of the loadings were generated to reveal the underlying structure of the data and examine the relationships between variables and model components.

3. Results

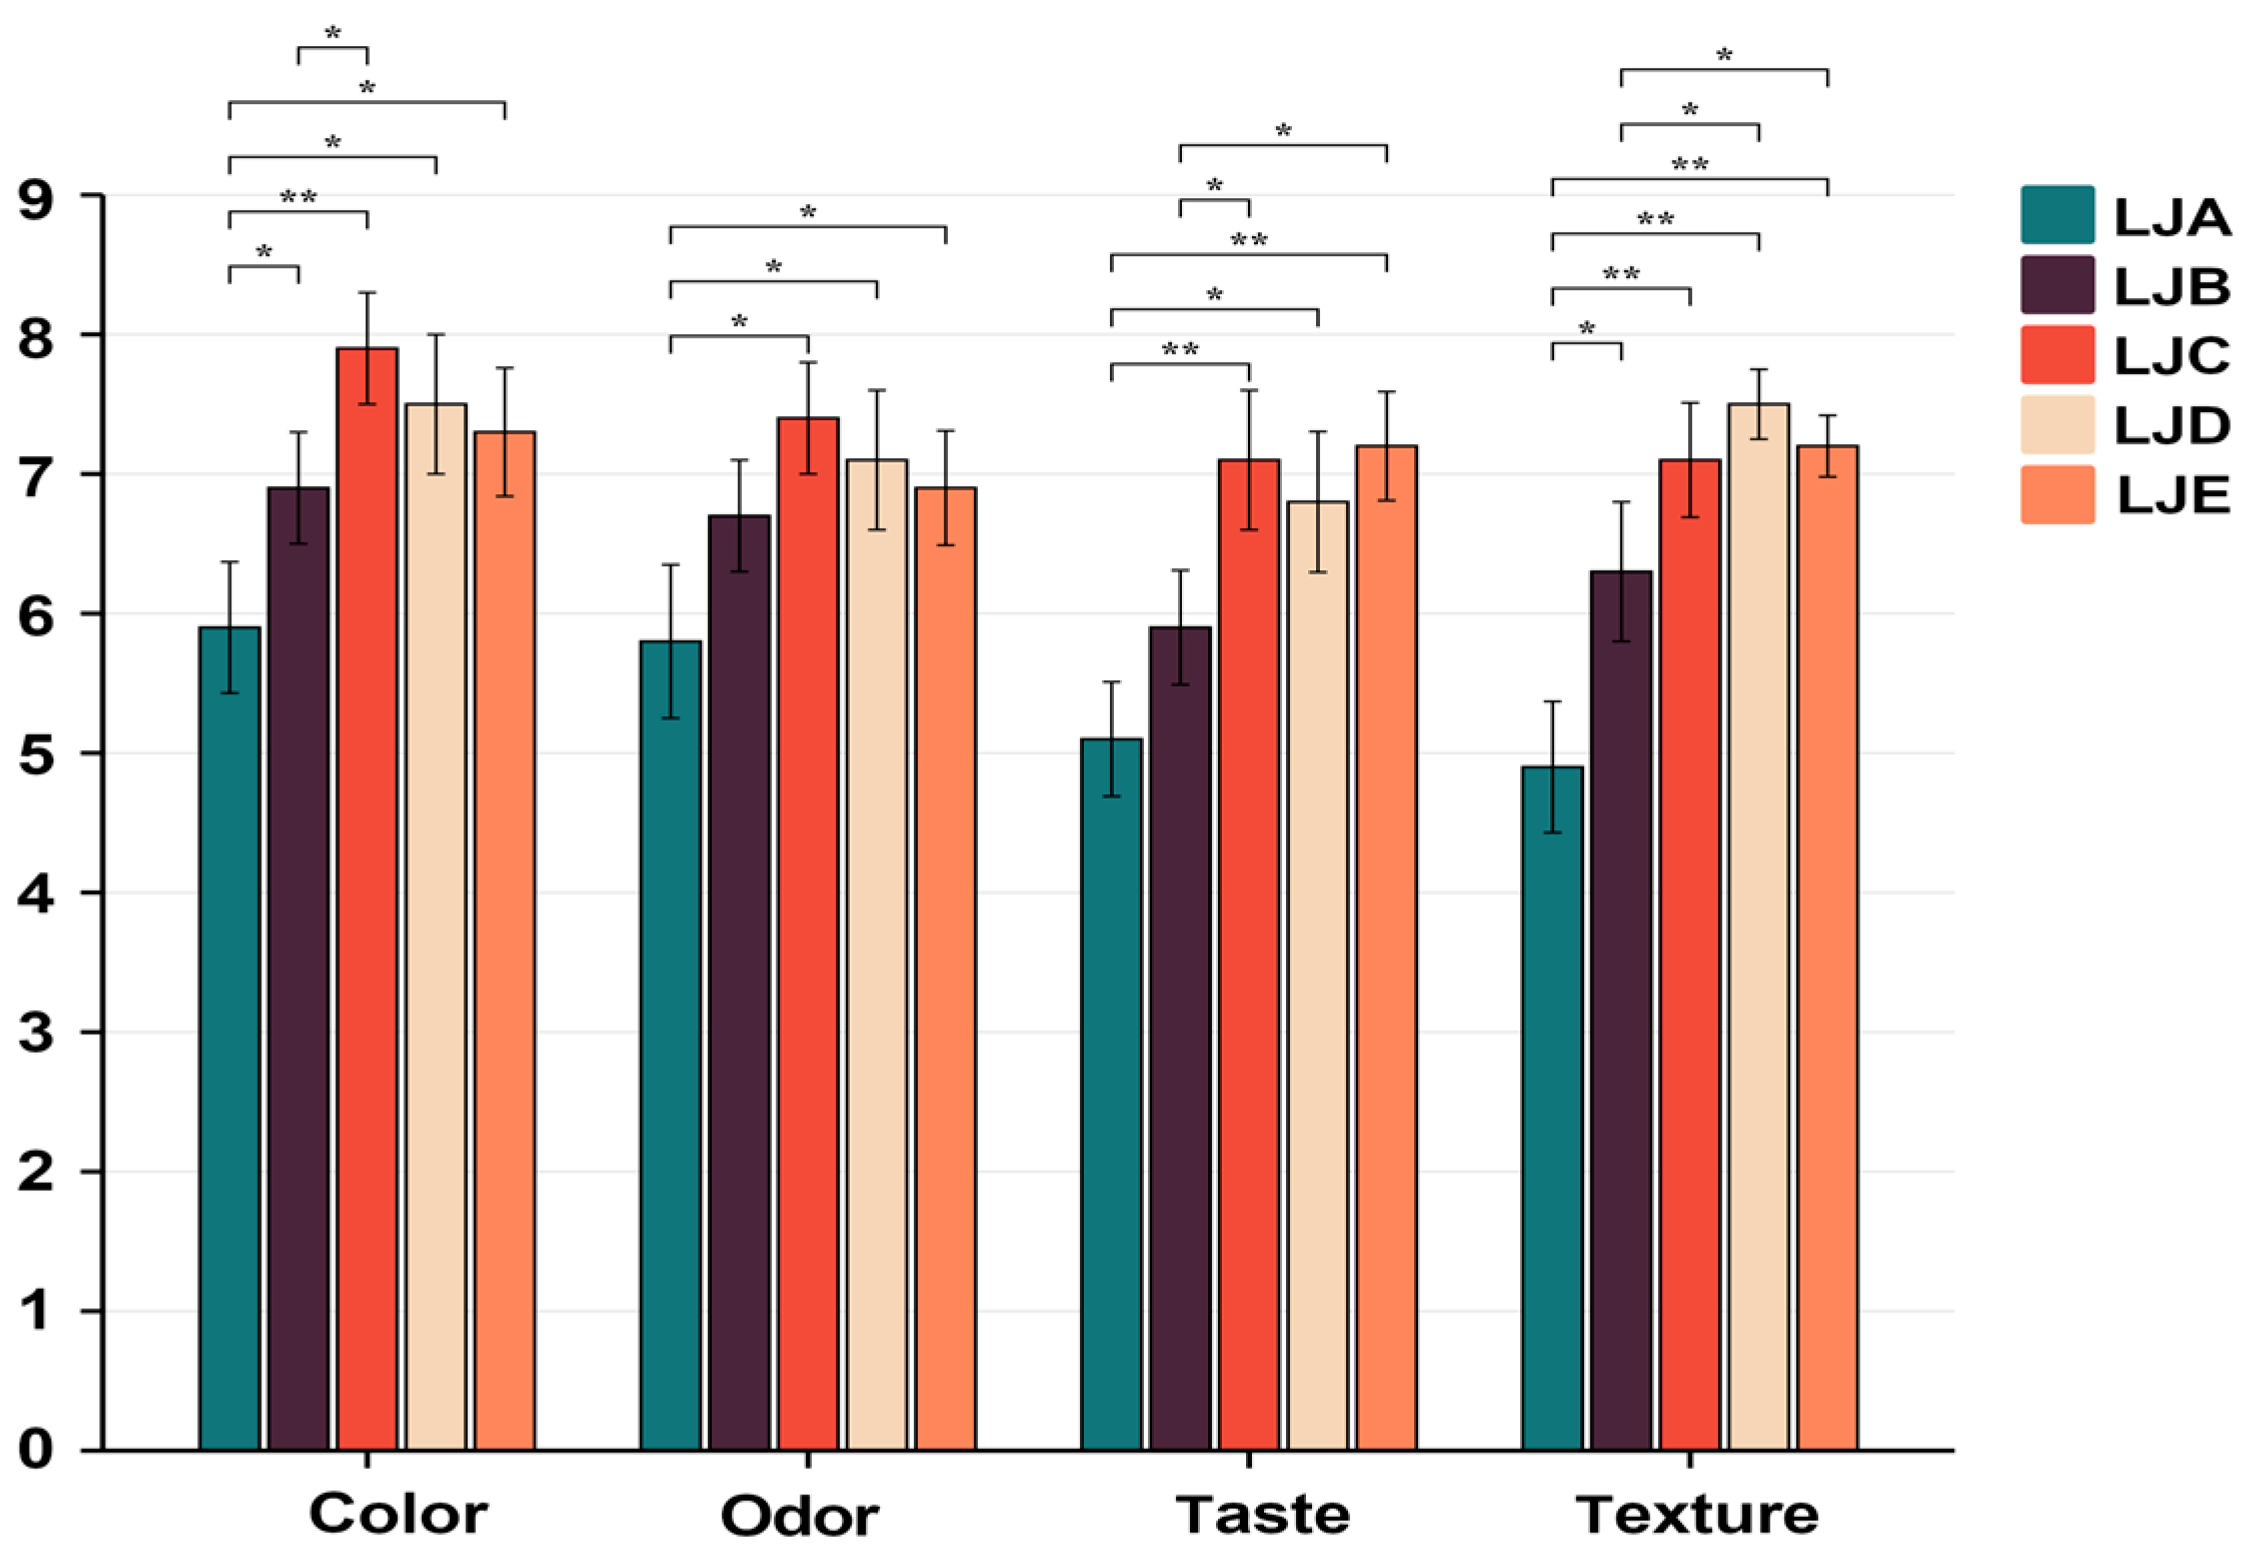
3.1. Sensory Analysis

The influence of salt concentration on the sensory characteristics of the ciba pepper samples is presented in Figure 1. Significant differences (p < 0.05) were observed in color, odor, texture, and taste across all salt concentrations. Among these samples, LJA received the lowest sensory scores in four categories. The odor and taste scores for ciba pepper LJC were the highest, while the texture scores for LJD and LJE were the highest. These findings indicate that the varying salt concentrations had a discernible impact on the overall sensory properties of ciba pepper, and the ciba pepper samples with the medium-high salt concentrations had a high sensory score.

3.2. Analysis of Physicochemical Properties

The physicochemical parameters of five different ciba pepper samples with varying salt concentrations were measured after fermentation, including pH, total acid concentration, and amino acid nitrogen concentration. The results are presented in Table 2, indicating significant differences (p < 0.05) in pH, total acid concentration, and amino acid nitrogen concentration among the ciba pepper samples with different salt concentrations. Specifically, the pH of the LJA sample was 3.77, and that of LJE sample was significantly higher (p < 0.05), corresponding to 3.89. Generally, the total acid content exhibited an inverse relationship with the pH value. The highest total acid content was observed in the LJA sample, and with an increase in salt concentration, the total acid content decreased significantly (p < 0.05). The amino acid content in the ciba pepper samples exhibited a significant decrease with increasing salt concentration. For instance, the amino acid nitrogen content in the LJA sample was 0.091 g/100 g and significantly decreased to 0.04 g/100 g in the LJE sample, as shown in Table 2. Moreover, the total number of colonies and lactic acid bacteria in the high-salt ciba pepper samples (LJD, LJE) was significantly lower than in the low-salt ciba pepper samples (LJA, LJB) (p < 0.05), indicating that salt significantly inhibited the microbial growth.

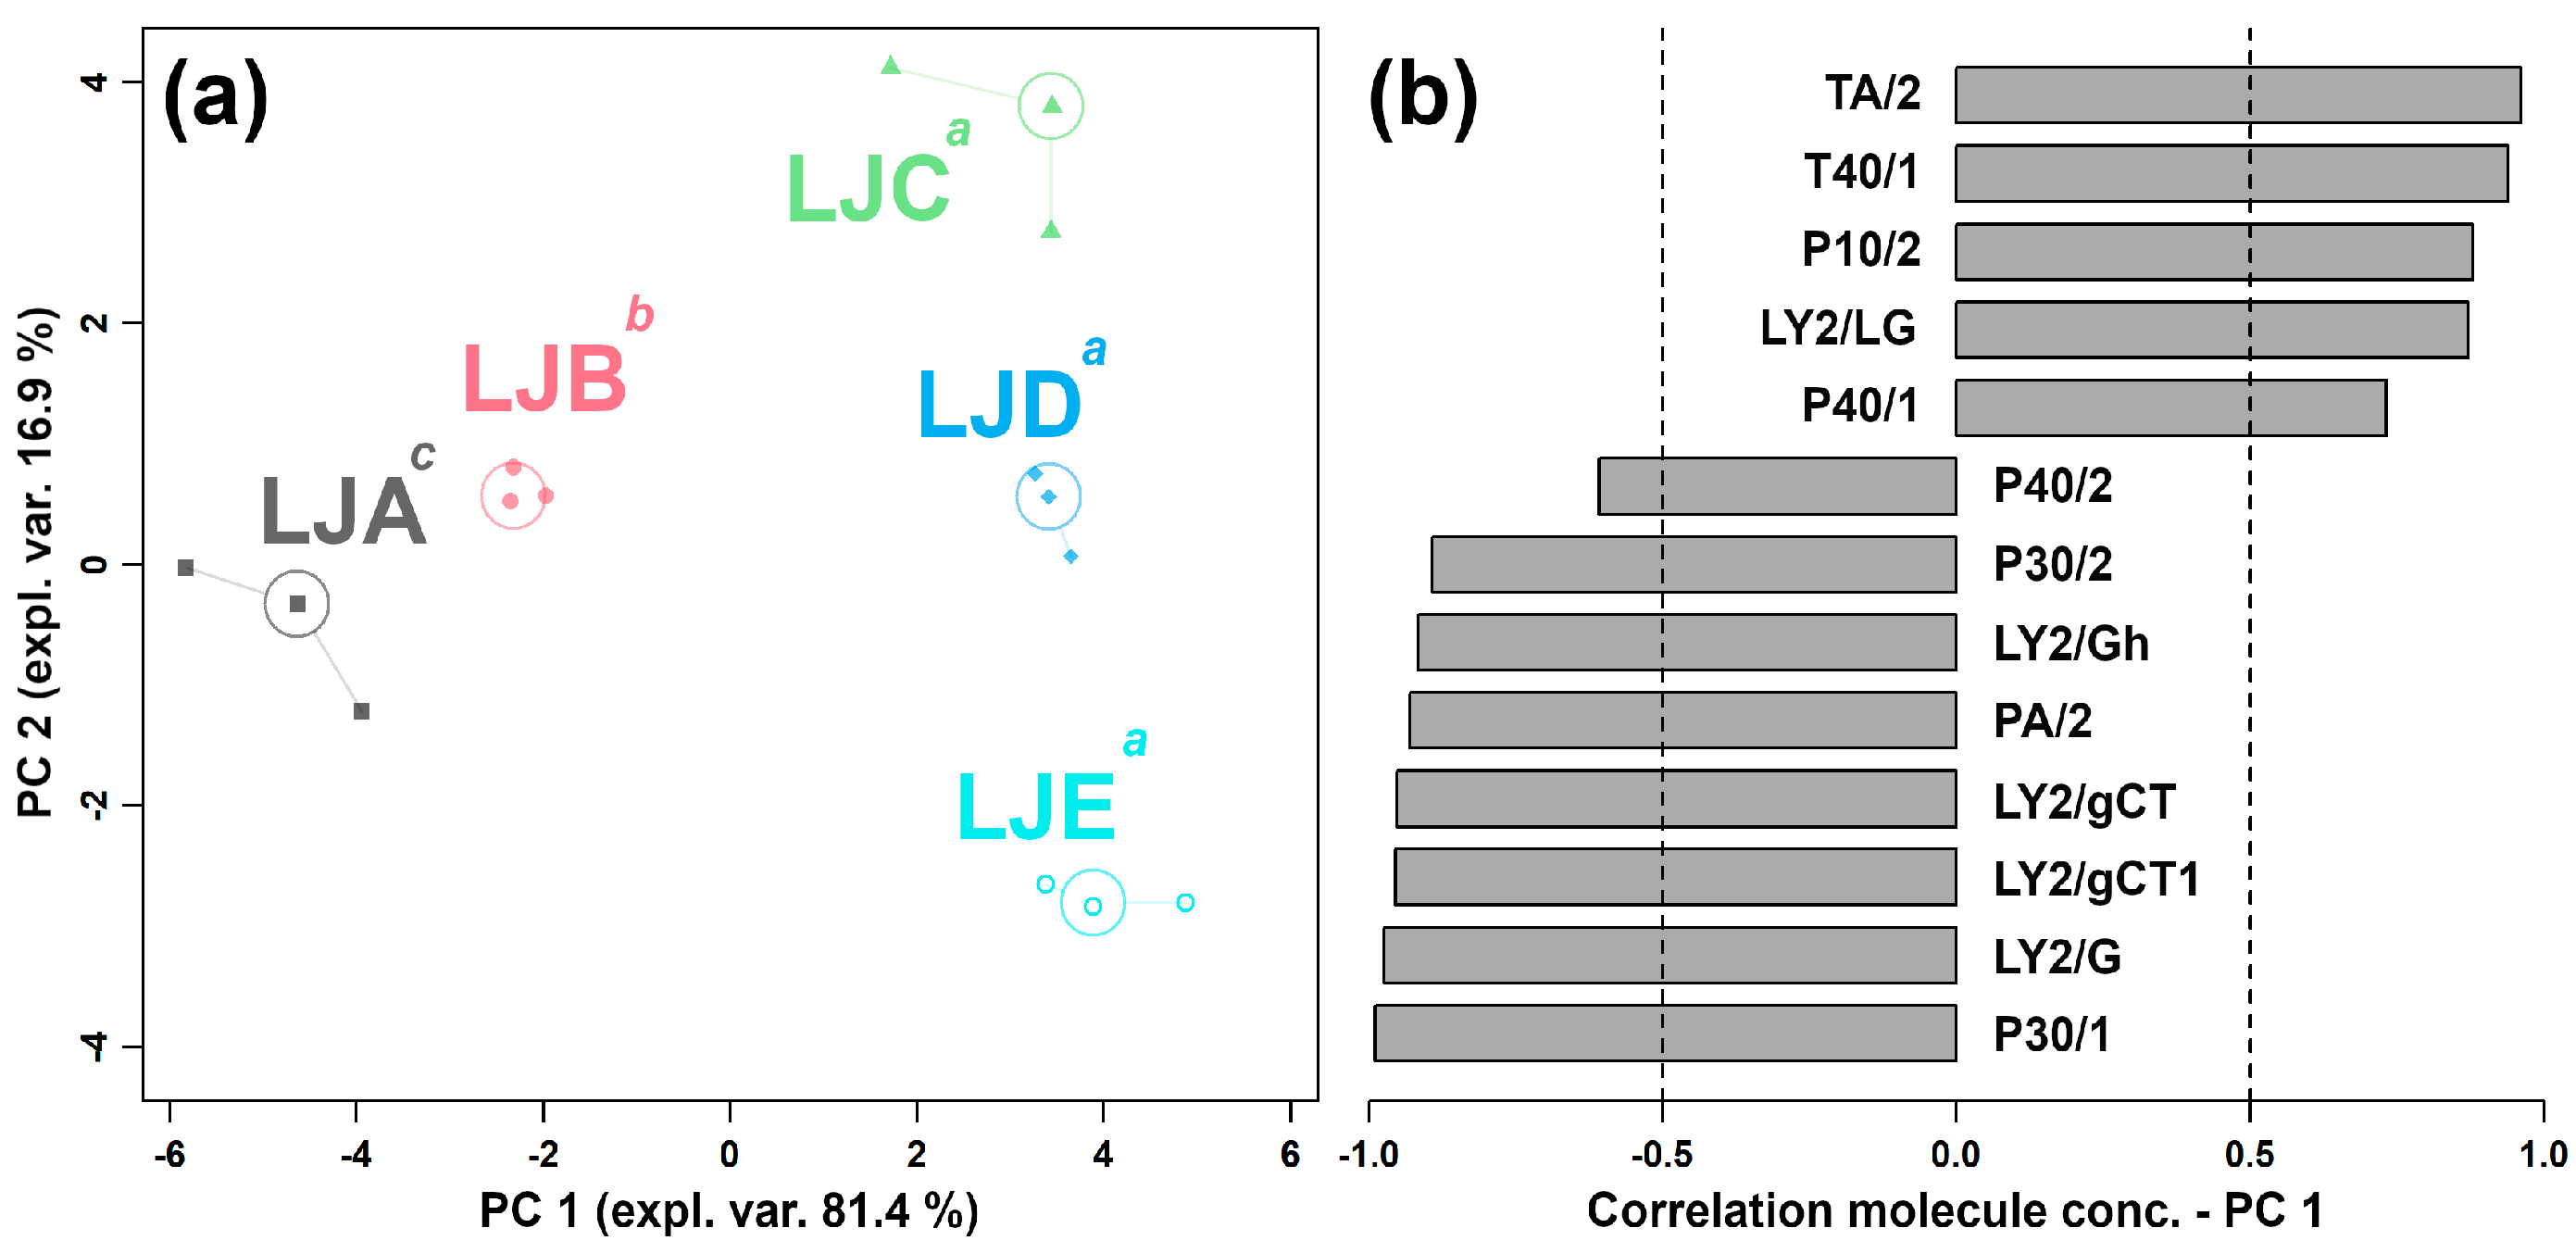
3.3. E-Nose Analysis of Ciba Pepper

The overall flavor of the ciba pepper samples with five different salt concentrations was analyzed using an E-nose. A robust principal component analysis (rPCA) model was constructed based on the response values of selected E-nose sensors, as depicted in Figure 1. As shown in Figure 2a, PC 1 accounted for a substantial portion of the sample variability, amounting to 81.4% of the total. This component effectively summarized the differences among the groups. The analysis revealed distinct characteristics of the LJA and LJB samples, exhibiting higher response values for the sensors P40/2, P30/2, LY2/Gh, PA/2, LY2/gCTl, and LY2/gCT, as well as lower response values for the sensors TA/2, T40/1, P10/2, LY2/LG, and P40/1, in comparison to the LJC, LJD, and LJE samples. This suggests that increasing the salt concentration promoted the production of volatile flavor compounds, such as aromatic compounds, ethanol, and propanol, during the fermentation of ciba pepper.

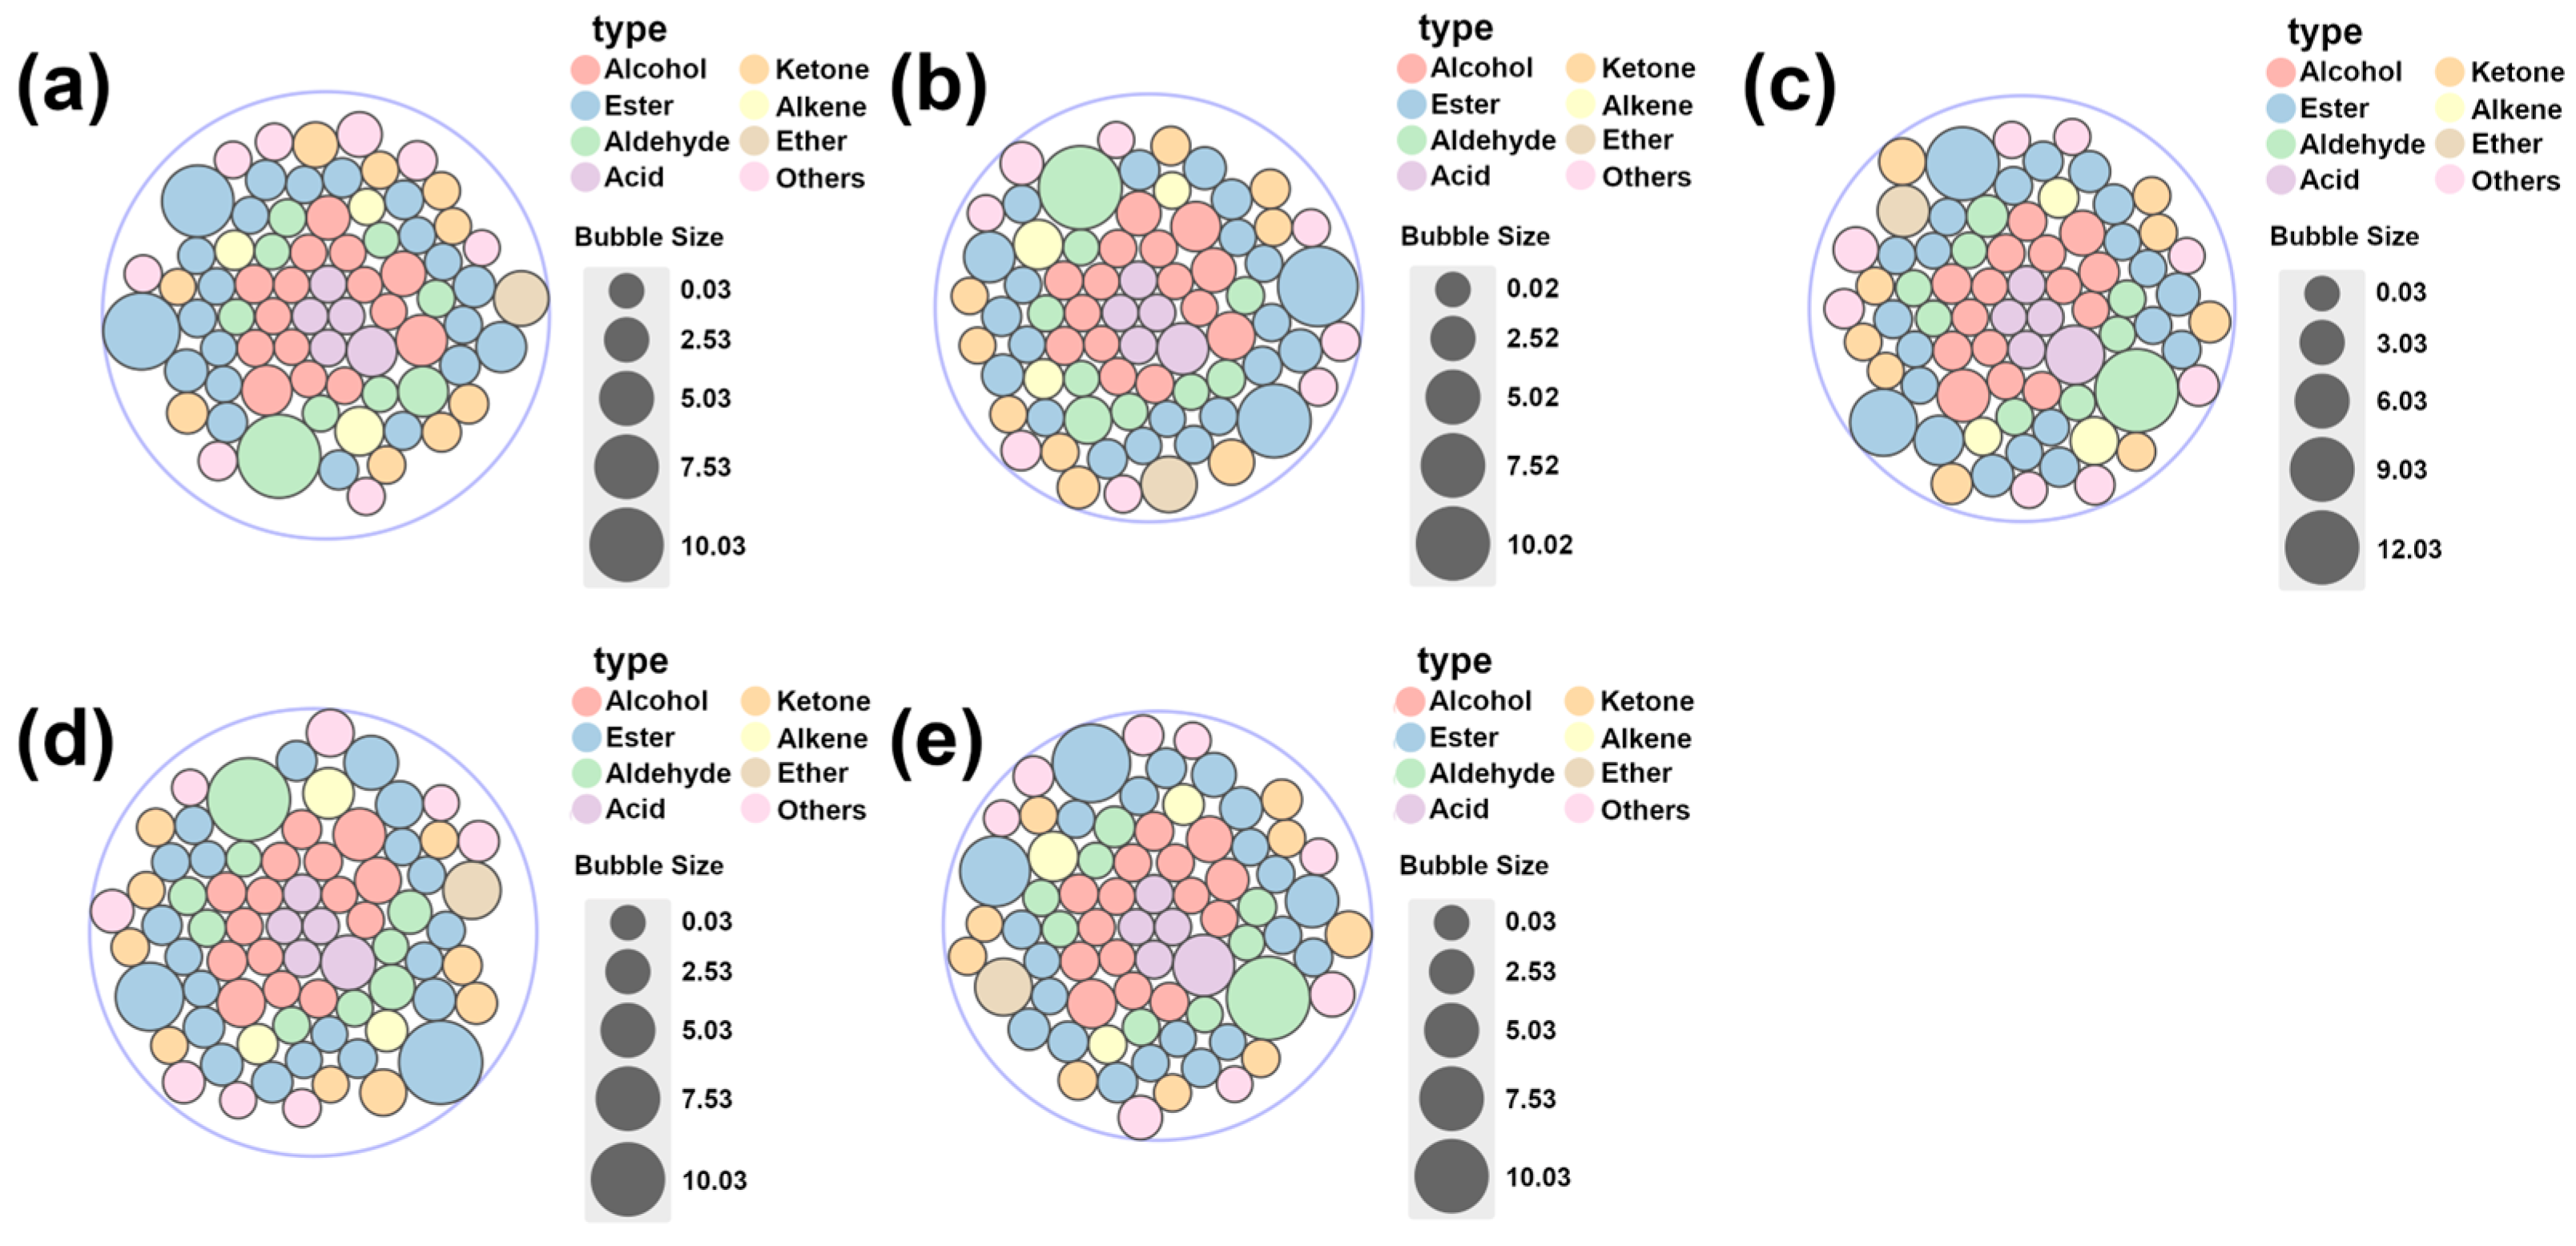
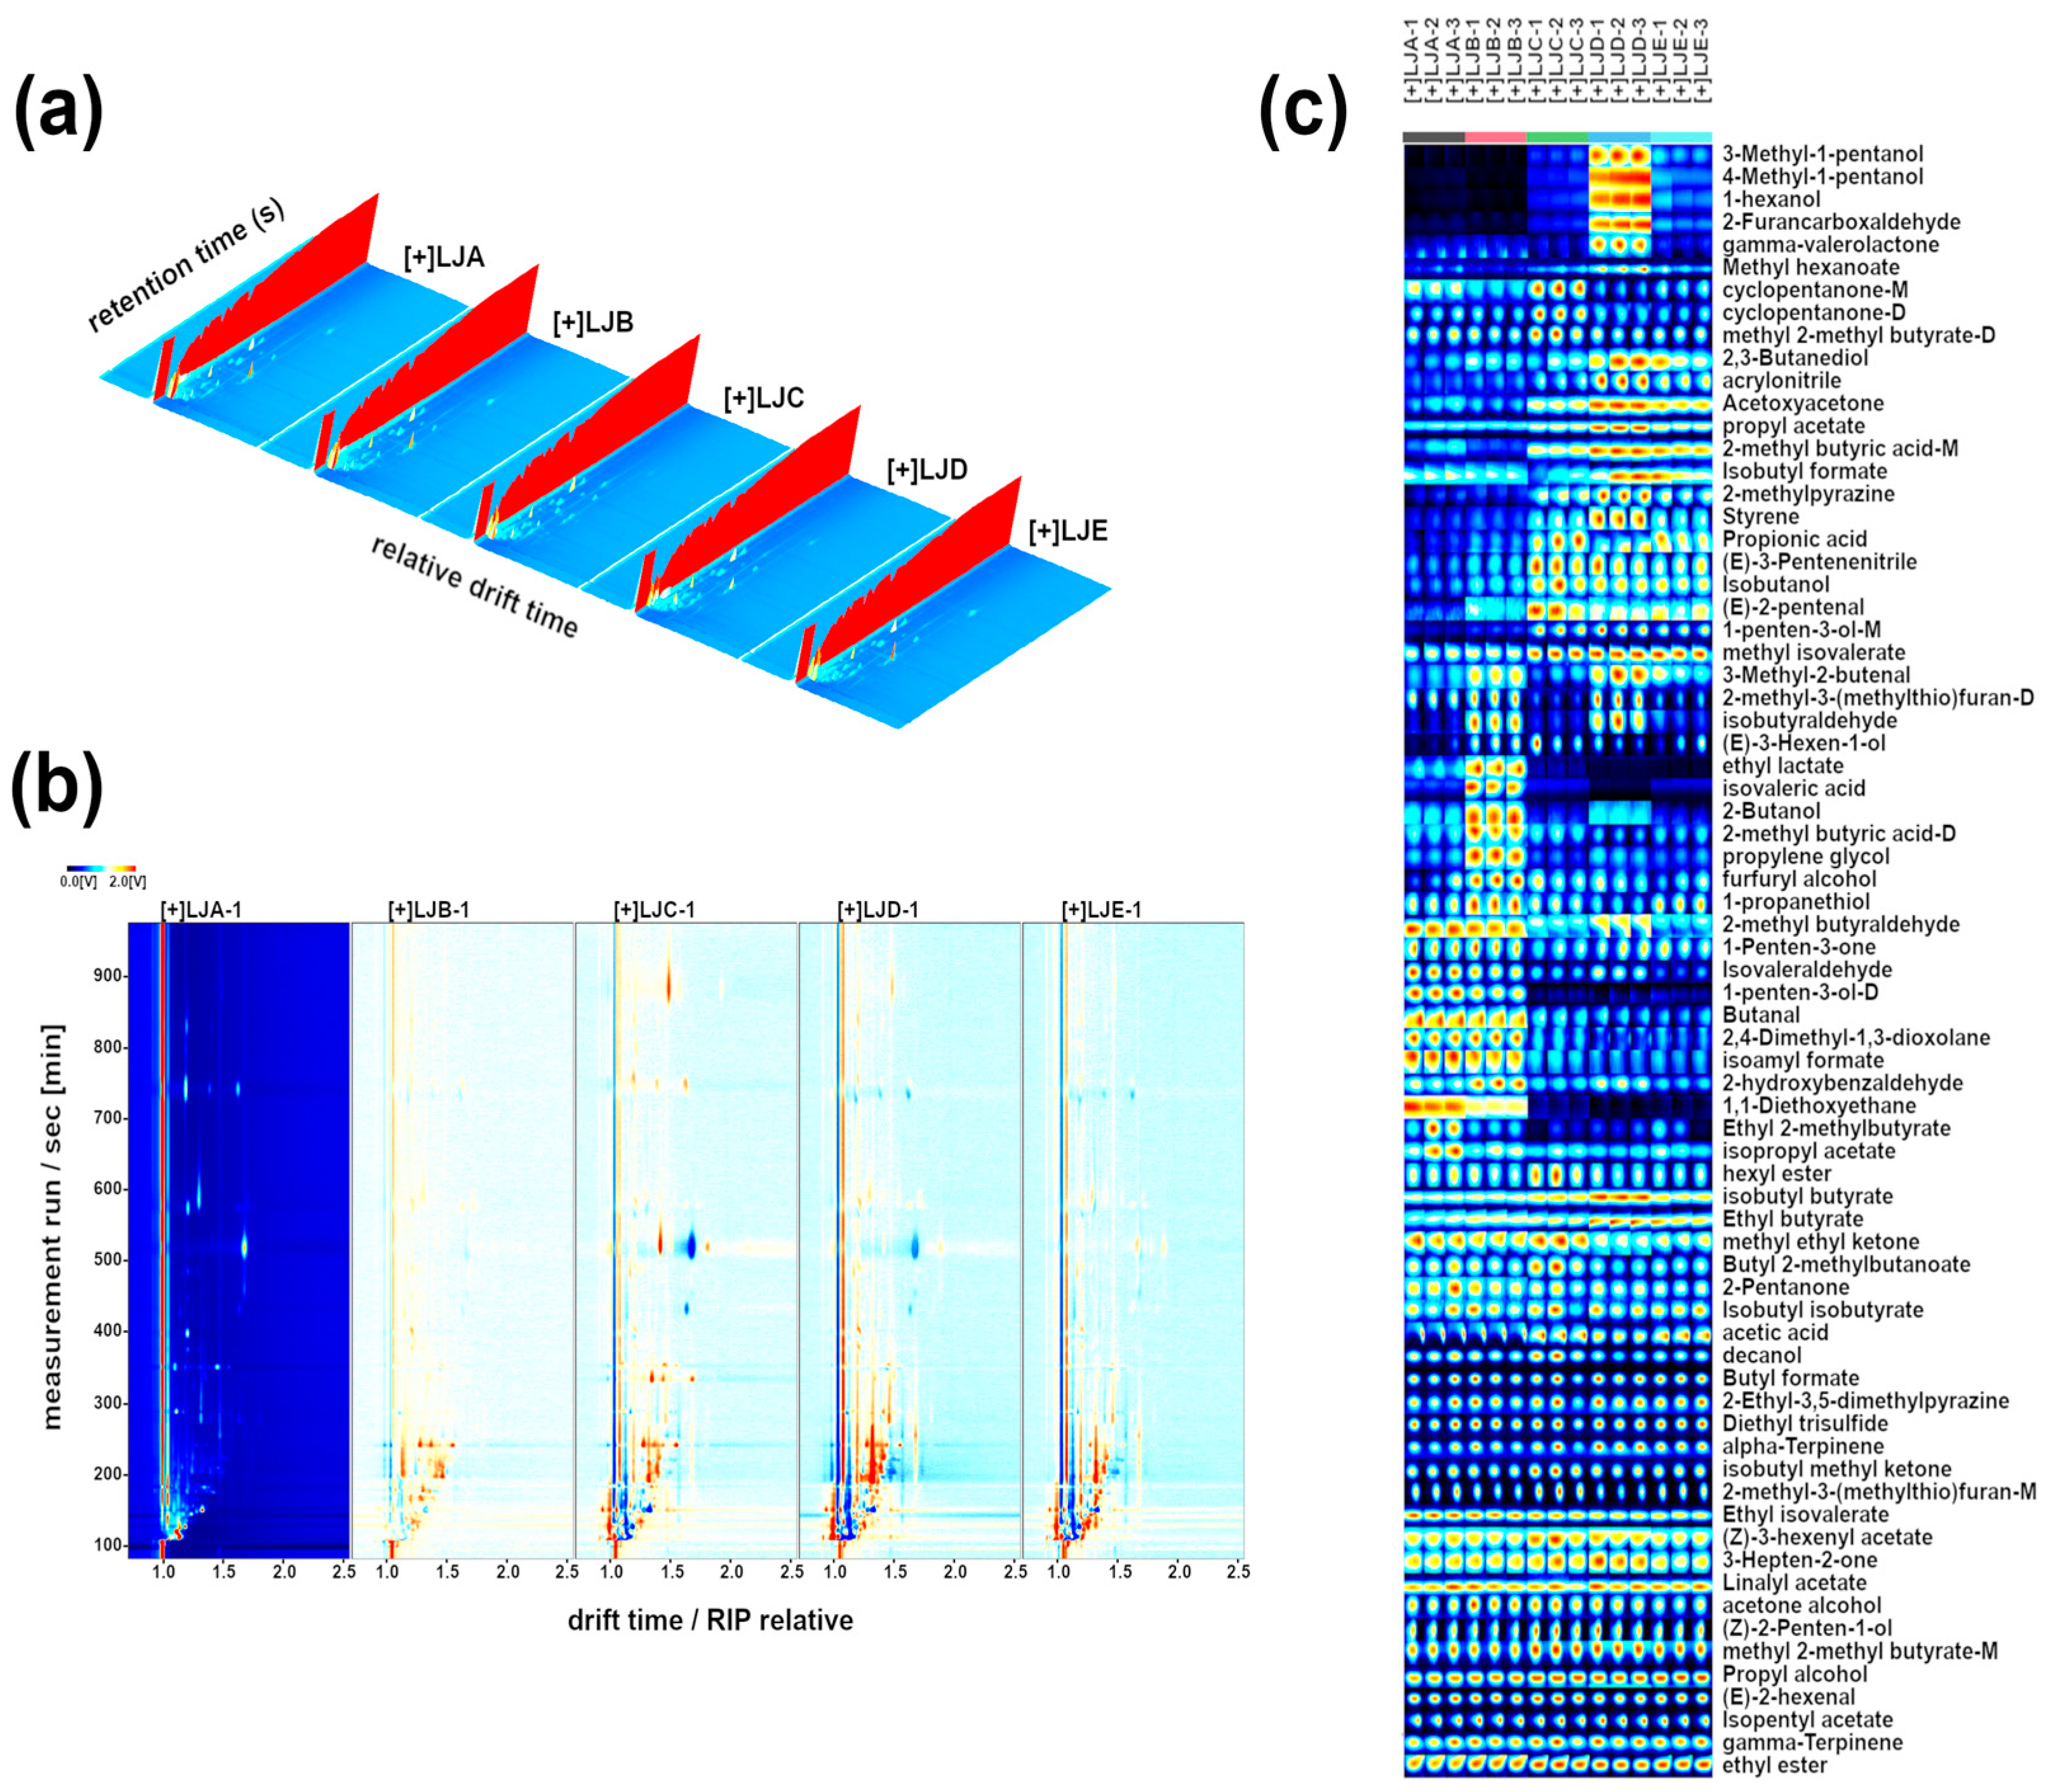
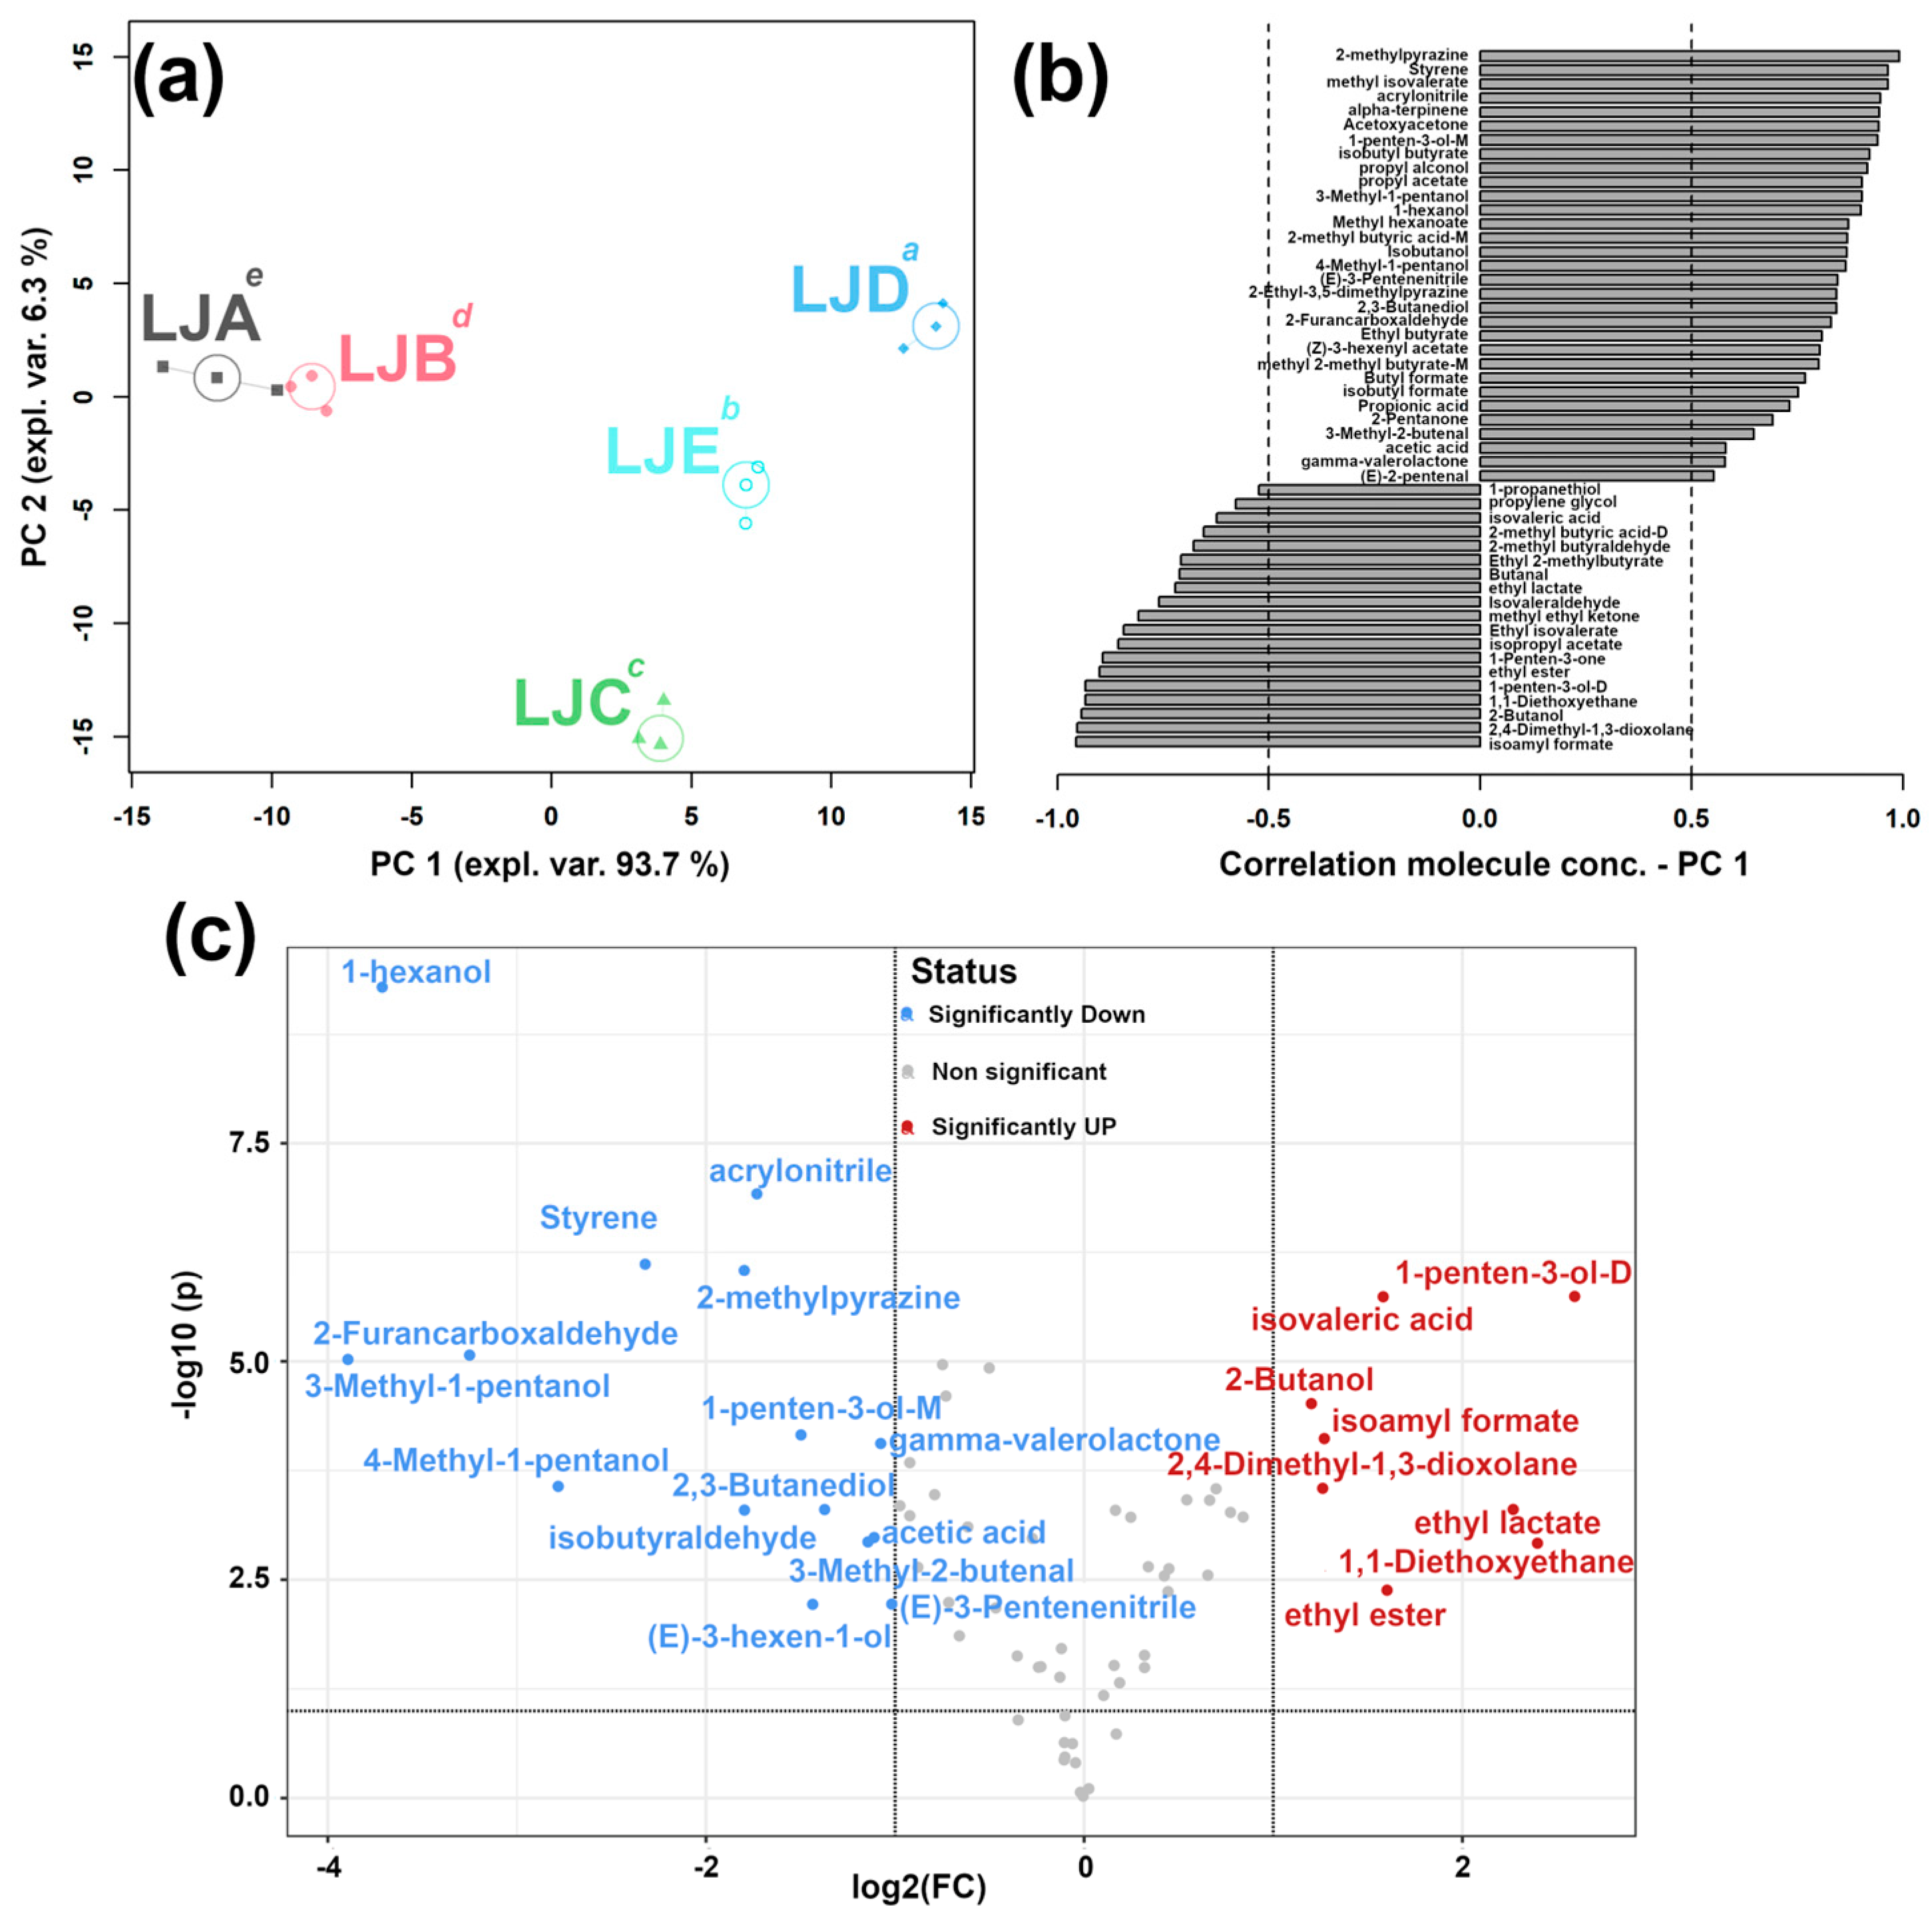
3.4. Qualitative Analysis of Volatile Substances by GC-IMS

Table S1 presents the results of the qualitative analysis. It was observed that certain flavor compounds existed as proton-bound monomers and dimers. The GC-IMS library initially detected 72 volatile compounds (Figure 3). However, after excluding signals potentially caused by dimers or trimers, a total of 68 flavor substances were identified in the ciba pepper samples. These included 14 alcohols, 21 esters, nine aldehydes, four acids, eight ketones, three terpenes, and eight other substances. The qualitative analysis of volatile flavor substances in the five samples of ciba pepper is depicted in Figure 4. Among the 72 compounds, (E)-2-hexenal was found to be the most abundant volatile compound in all samples, followed by isoamyl acetate, ethyl acetate, and diethyl trisulfide. These volatiles contribute to the floral and fruity aroma characteristics of ciba pepper and significantly impact its overall aroma profile. Esters were the predominant volatile flavor substances in the five ciba pepper samples with different salt concentrations, followed by aldehydes. The ester content in LJA and LJB was slightly higher than that in the other samples. Conversely, the alcohol content gradually decreased with increasing salt concentration. Overall, the content of various volatiles differed significantly among the five samples of ciba pepper.
The volatile flavor compounds of the ciba pepper samples with five different salt concentrations after fermentation were analyzed using gas chromatography–ion mobility spectrometry (GC-IMS), and the results are presented in Figure 4. Figure 4a illustrates the distinct differences in volatile compounds among the five samples of ciba pepper with different salt concentration. The three-dimensional (3D) representation shows the ion drift time, gas phase retention time, and peak intensity. Each peak signal corresponds to a specific volatile compound. The images visually demonstrate the variations associated with different salt concentrations. The two-dimensional (2D) topographic map uses the X- and Y-axes to represent the ion migration time for compound identification and the retention time for their gas chromatography-based separation. The red vertical line on the left side indicates the reactive ion peak (RIP), and each point on either side of the RIP represents a volatile flavor substance from the samples. The prominent red vertical line on the right side of the RIP represents the ethanol peak, which appears as an elongated strip due to the high ethanol concentration. To facilitate the identification of differences among the ciba pepper samples, differential plots (Figure 4b) were generated by deducting the topographic plot of the reference sample (LJA) from the topographic plots of the other ciba pepper samples. In the cases where the volatile components are consistent, the subtracted background appears white. The red color indicates higher substance concentrations compared to the reference, while the blue color indicates lower substance concentrations than in the reference.
The GC-IMS spectra detected all volatile flavor substances, which were used to generate fingerprints using the gallery plot plug-in, as depicted in Figure 4c. In the fingerprint, each cell represents the signal peaks of a specific sample, while each column represents the same volatile compound in different samples. Each row corresponds to a volatile compound at different retention times, and the color of the cells indicates the content of the volatile compound, with a brighter color indicating a higher content. Esters were found to be the predominant compounds in LJA and LJB. In the fingerprint (Figure 4c), no significant differences were observed for acetic acid 2-propyl ester, isobutyl formate, ethyl butanoate, and isobutyl butyrate among the ciba pepper samples with different salt concentrations. However, higher levels of 3-methylbutanal, 1-propanethiol, 3-hydroxybutan-2-one, 2-methylbutanal, and acetal were detected in LJA and LJB. Conversely, pent-1-en-3-ol-M, 1-(acetyloxy)-2-propanone, propanoic acid, 1-propanol, 2-methyl-, methylpyrazine, (E)-3-pentenenitrile, and methyl 3-methylbutanoate showed higher levels in LJC, LJD, and LJE.
To capture the overall trend of the characterized molecules, an rPCA model was applied based on their concentrations, as depicted in Figure 5a,b. The scoreplot (Figure 5a) demonstrated that PC1 accounted for a substantial portion of the variance in the entire sample set, specifically, 93.7%, effectively summarizing the differences among the ciba pepper samples with the five salt concentrations. Furthermore, the distance between LJA and LJB appeared similar to those between LJC, LJD, and LJE, aligning with the findings from the E-nose analysis. In Figure 5b, fifty compounds exhibited statistically significant differences among the five samples, indicating their potential as distinct biomarkers for discriminating ciba pepper fermented in the presence of different salt concentrations. Notably, LJA and LJB exhibited higher levels of 1-propanethiol, propylene glycol, isovaleric acid, 2-methyl butyric acid-D, 2-methyl butyraldehyde, ethyl 2-methylbutyrate, and other compounds. Conversely, the LJC, LJD, and LJE samples showed higher concentrations of 2-methypyrazine, styrene, methyl isovalerate, acrylonitrile, alpha-terpinene, and acetoxyacetone, among others. However, it is important to highlight that some of the examined substances did not show the same trend as their respective groups. To integrate the results of the t-test and fold-change analysis at a molecular level, a volcano plot was constructed, as depicted in Figure 5c, which revealed significant differences among the ciba pepper samples with varying salt concentrations [21]. The substances exhibiting significant differences with a fold change higher than 2 are shown in Figure 4c. A total of 23 primary differential volatile substances were identified, including 1-penten-3-ol-D, isovaleric acid, and 2-butanol.

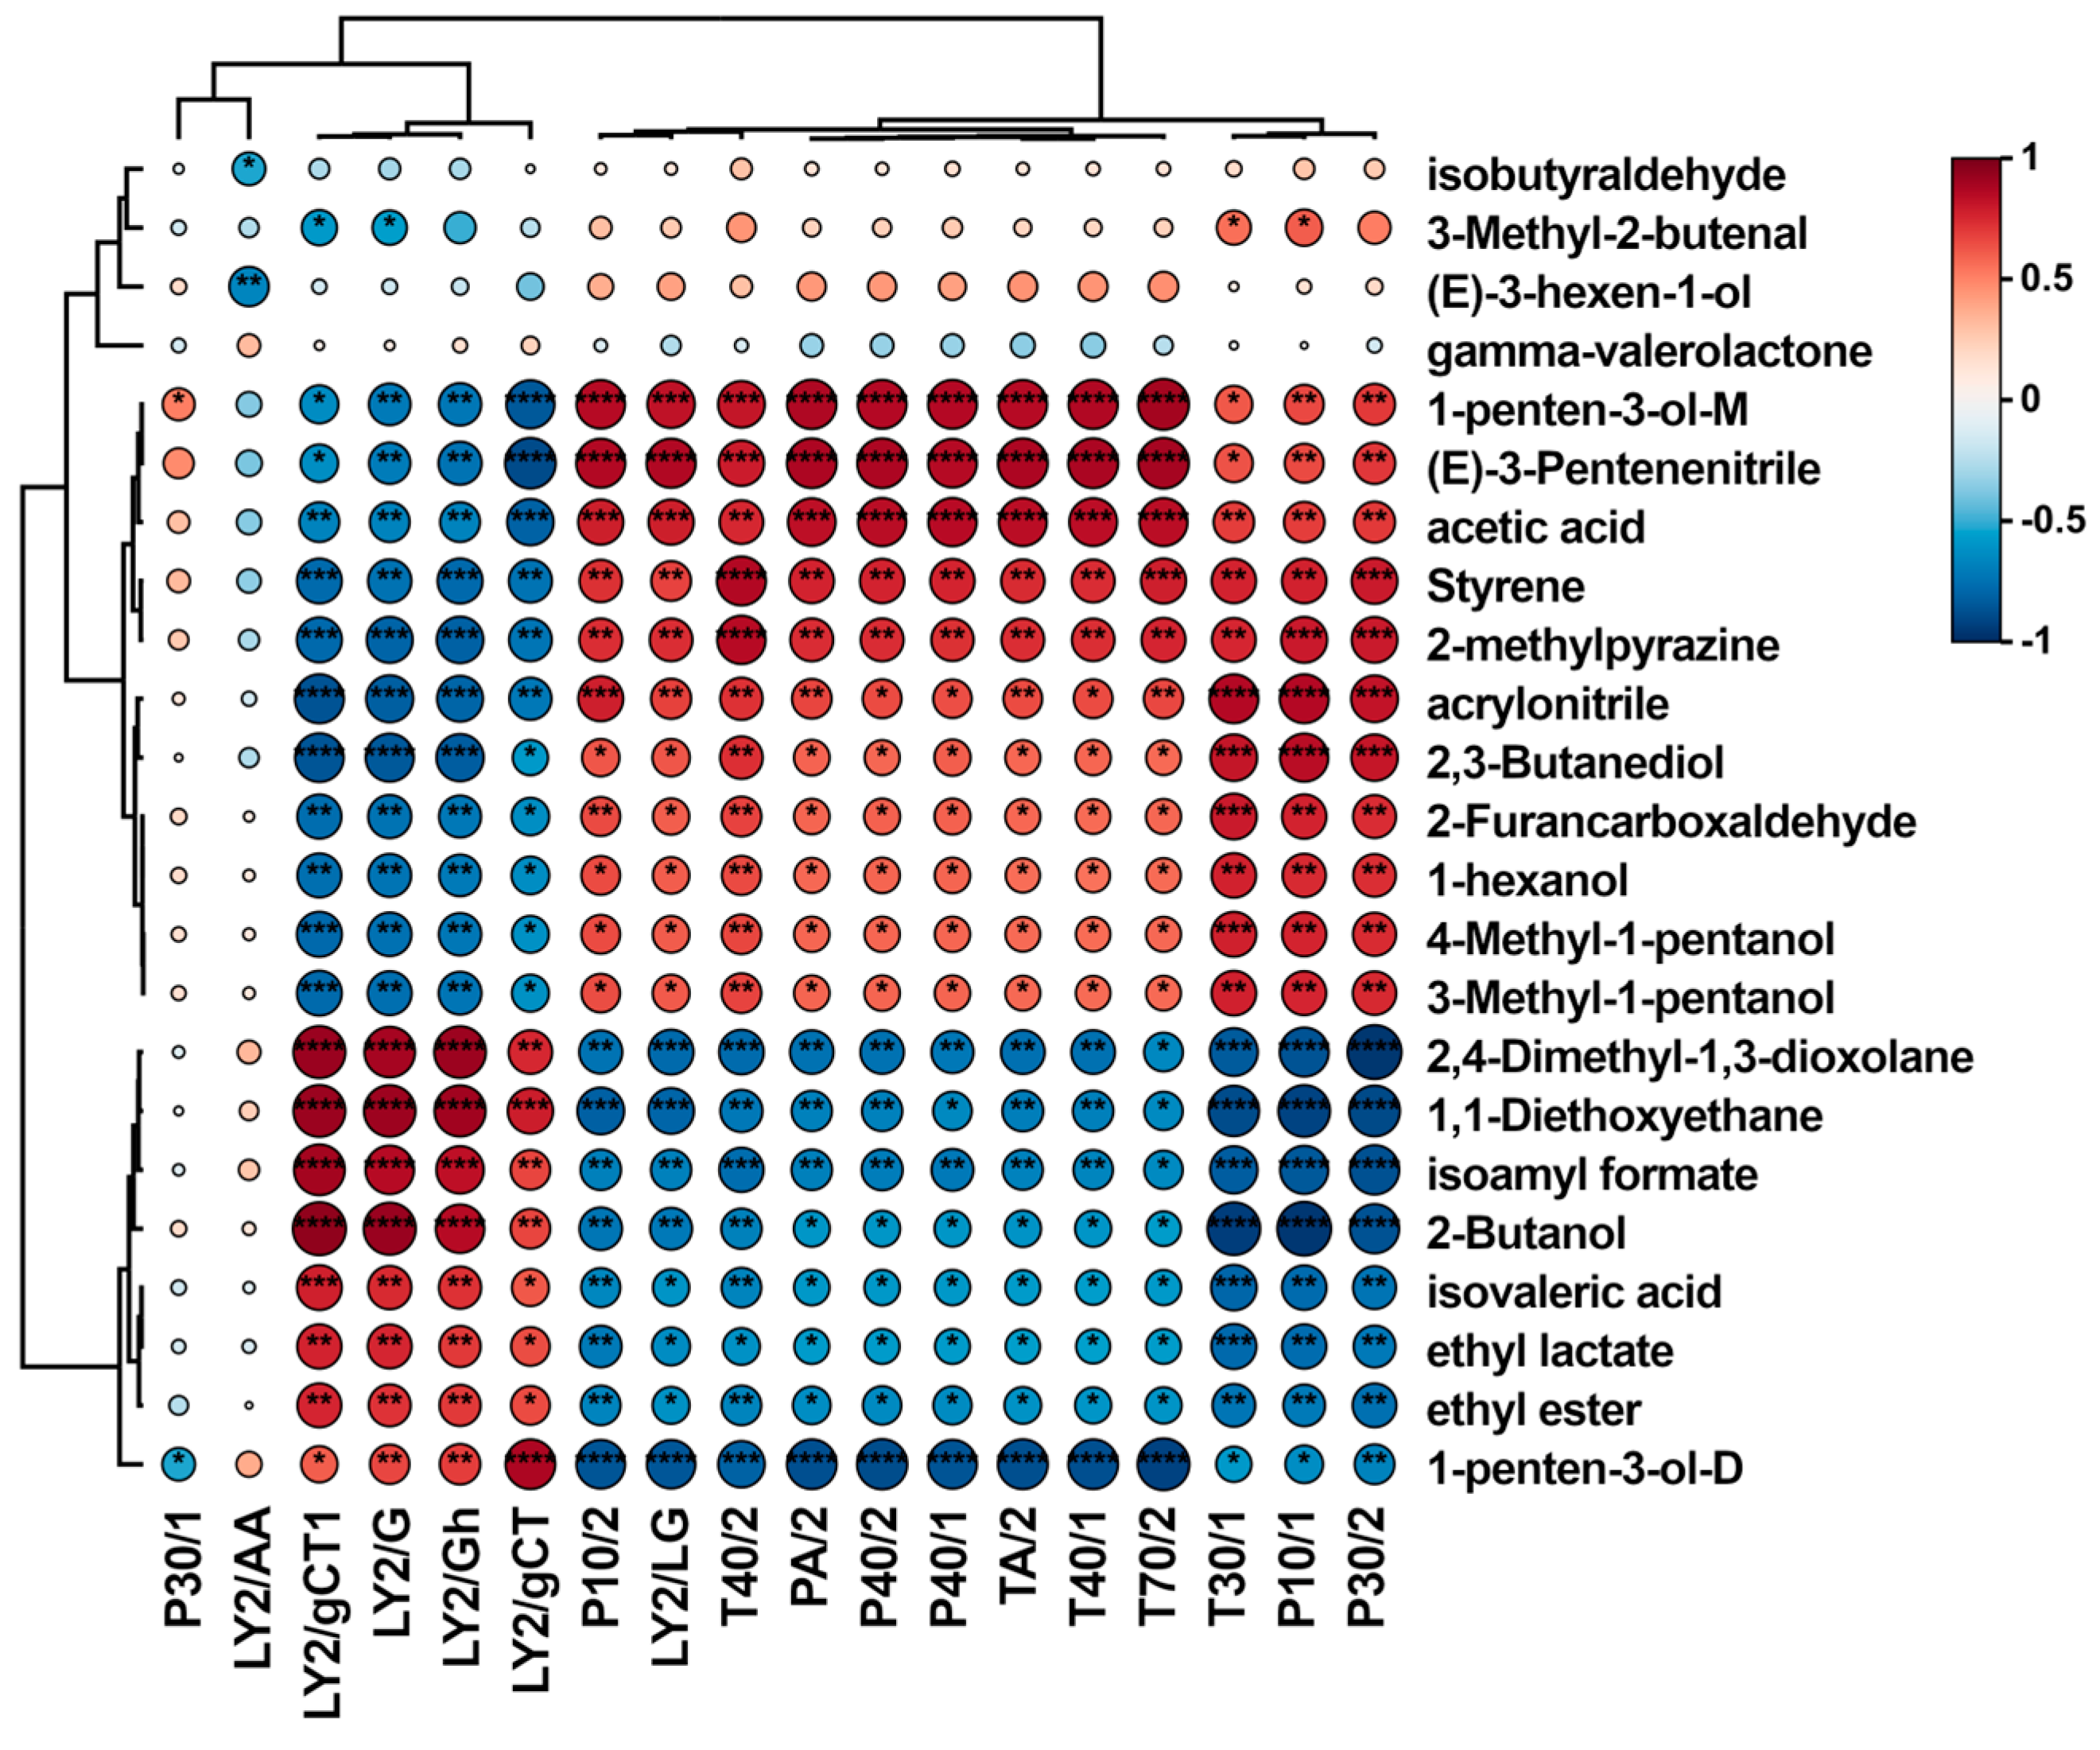
3.5. Correlation between GC-IMS and E-Nose Results

The E-nose and GC-IMS techniques offered distinct perspectives in distinguishing the ciba pepper samples with varying salt concentrations. The E-nose provided comprehensive information about the volatile compounds in each sample, while GC-IMS offered a specific volatile profile for each ciba pepper sample. To improve the overall performance of both techniques, the potential correlations between E-nose sensor responses and volatile compound levels detected by GC-IMS were analyzed. Figure 6 illustrates the correlations observed. For example, the levels of 1-penten-3-ol-D, ethyl ester, ethyl lactate, isovaleric acid, 2-butanol, isoamyl formate, 1,1-diethoxyethane, and 2,4-dimethyl-1,3-dioxolane were found to be positively correlated with LY2/gCT, LY2/Gh, LY2/G, and LY2/gCT1, while showing significant negative correlations with P30/2, P10/1, T30/1, T70/2, P40/1, T40/1, TA/2, P40/2, PA/2, T40/2, LY2/LG, and P10/2. Similarly, the levels of 1-hexanol, acrylonitrile, styrene, acetic acid, 2-methylpyrazine, 2-furancarboxaldehyde, 3-methyl-1-pentanol, 1-penten-3-ol-M, 4-methyl-1-pentanol, 2,3-butanediol, and (E)-3-pentenenitrile were positively correlated with P30/2, P10/1, T30/1, T70/2, P40/1, T40/1, TA/2, P40/2, PA/2, T40/2, LY2/LG, and P10/2, while exhibiting significant negative correlations with LY2/gCT, LY2/Gh, LY2/G, and LY2/gCT1. These results indicated that the distinctive flavors of the fermented ciba pepper samples with different salt concentrations could be distinguished by analyzing the E-nose sensor responses, and the corresponding volatile compounds could be quantified using GC-IMS. However, it is important to note that these correlations only suggest relationships between traits and do not establish causation or explain how one trait influences changes in another.

4. Discussion

Ciba pepper, a popular fermented vegetable food item originating from Southwest China, has gained increasing popularity across wide regions of China due to its unique flavor and high nutritional value. However, the traditional ciba pepper fermentation involves a high salt concentration, resulting in a lengthy fermentation process and potential health risks such as hypertension and cardiovascular and cerebrovascular diseases [8]. Therefore, it is crucial to explore the feasibility of producing low-salt fermented ciba pepper. Despite its significance, there is a dearth of studies investigating low-salt fermented ciba pepper, making it essential to examine the impact of salt concentration on the quality of ciba pepper. In this context, the present study aimed to comprehensively characterize the flavor profiles of ciba pepper samples fermented in the presence of different salt concentrations using a combination of the GC-IMS and E-nose techniques—a powerful yet underutilized approach in this research domain.
The sensory characteristics of ciba pepper fermented with five different salt concentrations were analyzed. Figure 1 shows the color, odor, and taste scores, indicating that the LJC and LJD samples exhibited higher scores. This could be attributed to the inhibitory effect of a high salt concentration on the growth and reproduction of microorganisms, resulting in decreased acidity and milder taste and odor. Moreover, the texture scores of the LJD and LJE samples were higher, possibly due to changes in water migration and osmotic pressure during high-salt fermentation [22,23], leading to alterations in the structure of the pepper tissue. The physicochemical properties of ciba pepper fermented with the five salt concentrations were also analyzed, as presented in Table 1. pH and total acid content are crucial factors in pepper fermentation [24]. With increasing salt concentration, the pH value of ciba pepper gradually increased, while the total acid content gradually decreased. This observation can be attributed to the high salt concentration inhibiting the growth of acid-producing microorganisms [25], such as lactic acid bacteria [26], and impacting enzyme activity [27], resulting in an elevated pH and reduced total acid content. Amino acid nitrogen is often considered a key indicator of the umami taste in fermented foods [28]. Amino acids are typically produced through the activity of proteolytic enzymes secreted by microorganisms such as Aspergillus, Bacillus, or Saccharomyces [16,29]. The higher content of amino acid nitrogen in the high-salt ciba pepper samples may be attributed to increased osmotic pressure, which inhibits protein-secreting peptide enzymes and amino acid decarboxylase, influenced by the salt concentration [30]. These findings align with previous studies [26].
A total of 72 volatile substances were identified using GC-IMS in the ciba pepper samples fermented with five different salt concentrations. The volatile compound composition exhibited significant changes as the salt concentration increased. Among them, twenty-three compounds demonstrated significant differences among the five ciba pepper samples, including 1-penten-3-ol-D, ethyl ester, ethyl lactate, isovaleric acid, 2-butanol, and others. It is worth noting that LJB, LJC, and LJD exhibited a higher abundance and concentration of volatile flavor components. This may be attributed to the more vigorous growth and metabolic activities of microorganisms in a low-salt fermentation environment, resulting in increased production of organic acids and excessive acidity. Consequently, the growth of microorganisms, including lactic acid bacteria, is inhibited [30,31]. Furthermore, a high salt concentration can induce intracellular oxidative stress and cause structural and physiological damage to cells [32], thereby inhibiting the growth and metabolism of microorganisms and leading to a decrease in the concentration of volatile flavor substances.
Esters are a prominent group of sensory-active compounds known for imparting fruity and floral aromas while reducing the intensity of unpleasant odors in finished products [33]. Previous studies demonstrated that the concentration of esters tends to increase during the maturation of fermented foods [34]. Our study identified esters as the most abundant compounds in all five ciba pepper samples. This aligns with previous reports that esters are the dominant compounds in fermented pepper [17]. Specifically, the ester content was slightly higher in LJA and LJB compared to the other samples, suggesting that low salt concentrations contribute to the formation of esters. Among esters, ethyl ester is a lipophilic molecule with a low odor threshold. It was identified as one of the key esters responsible for the pleasant fruit flavor in fresh red pepper fermentation [35]. Ethyl acetate, another ester compound, was recognized as one of the most important volatile compounds in the aroma profile of Millet Huangjiu at different fermentation stages [36]. Ethyl esters are primarily produced through enzymatic transformations during yeast fermentation and the ethylation of acetyl coenzyme A, which is formed during fatty acid synthesis or degradation [36]. In our study, the ethyl ester content was significantly higher (p < 0.05) in the low-salt ciba pepper samples. This may be attributed to the inhibitory effect of high salt concentrations on the activity of alcohol acetyltransferase, leading to a reduction in the binding of ethanol to acetyl-CoA [37] and subsequently decreasing the ethyl ester content. Gamma-valerolactone, derived from the dehydration of hydroxycarboxylic acid or the degradation of carotene during ciba pepper fermentation, contributes to its pleasant aroma and exhibited significantly higher concentration in the LJD sample. The levels of ethyl lactate, known for its pungent odor, were found to be positively correlated with lipid oxidation in Zhenba Bacon [38]. Additionally, Pereira et al. [39] identified ethyl lactate as a characteristic flavor compound in Arinto white wines.
Alcohols serve as precursors of aromatic esters, which contribute to the ester profile in fermented pepper. Alcohols play a crucial role in imparting floral and fruity aromas to food products and are primarily produced through sugar metabolism induced by microorganisms such as yeast and Aspergillus oryzae, redox reactions of unsaturated aldehydes or ketones, and the metabolism of amino acids [40,41]. For instance, 2-butanol is generated through lipid oxidation, where saturated fatty acids undergo decarboxylation of β-keto acids via β-oxidation, leading to the formation of odd-carbon methyl ketones. Reductases then convert methyl ketones into their corresponding secondary alcohols [12]. 1-Pentene-3-ol is recognized as one of the characteristic oxidation products of polyunsaturated fatty acids and contributes to the floral and fruity aroma of ciba pepper [42]. Furthermore, 2,3-butanediol is a by-product of carbohydrate metabolism during ciba pepper fermentation. Enzymatic reactions convert carbohydrates into acetoin, which is subsequently transformed into by-products such as 2,3-butanediol and lactic acid through the reversible action of acetoin reductase [43]. The content of 2,3-butanediol was significantly higher in the LJD and LJE samples compared to the other samples. This can be attributed to the more vigorous growth and metabolism of lactic acid bacteria during the fermentation of low-salt ciba pepper, resulting in increased consumption of sucrose and glucose to produce lactic acid. The accumulation of lactic acid leads to a decrease in the content of 2,3-butanediol [44]. In summary, the alcohol content decreased with increasing salt concentration, consistent with previous findings [45].
Acids play a crucial role in the fermentation process of pepper and serve as important precursors of aroma compounds. They are primarily derived from lactic acid fermentation and carbohydrate metabolism. Isovaleric acid, for instance, was identified in Hibiscus tea and imparts a cranberry-like flavor, which contributes to the tea’s deep red color [46]. Additionally, acetic acid exhibits high volatility and a low perception threshold, resulting in a pungent sour taste and a “cider–vinegar” aroma when present at concentrations above 100 mg/L. The accumulation of acetic acid is primarily influenced by the sugar metabolism of the starter culture and by substrate availability [47]. However, contrary to previous research findings [8], LJE exhibited the highest content of acetic acid. This may be attributed to the condensation of acetic acid with higher alcohols to form acetate esters during fermentation [48]. This phenomenon could explain why the high-salt ciba pepper samples had a higher acetic acid content and a lower acetate content.
Aldehydes contribute significantly to the aroma of pepper during fermentation, as they possess a strong aroma and a low flavor threshold, which enhances their overall flavor [45]. These compounds often exhibit nutty and caramel-like smells. They are primarily formed through the oxidative cleavage of unsaturated fatty acids and the Strecker degradation of amino acids [49]. Moreover, microbial aminotransferases can convert free amino acids (FAAs) into α-ketoacids, which are further transformed into their corresponding aldehydes by various decarboxylases during fermentation [50]. 2-Furancarboxaldehyde is commonly associated with sweet, bready, and caramel-like odors [51] and is recognized as a characteristic flavor compound in the later stages of strong-flavored Baijiu distillation [52]. The content of 2-furancarboxaldehyde in the high-salt ciba pepper samples was significantly higher than in the other samples, possibly due to the higher salt content accelerating lipid oxidation [53].
Alkenes and their derivatives are diverse in their aroma characteristics and serve as important sources of food flavors. The content of alkenes in the LJD and LJE samples was slightly higher compared to that in the other samples, consistent with previous studies [27]. Styrene, for instance, was identified as an indicator of yeast fermentation activity cessation during the fermentation process of common olive varieties [54]. In the case of pepper fermentation, the production of styrene is likely a result of yeast metabolism in the later stages. Differences in styrene content can be attributed to variations in yeast metabolic activity. Pyrazines, nitrogen-containing heterocyclic compounds, are formed through the Maillard reaction or the condensation of α-amino ketone molecules produced via Strecker degradation [55]. They are known to contribute to the characteristic aroma of oriental food, imparting a cooked and roasted flavor [29]. The content of 2-methylpyrazine was significantly higher (p < 0.05) in the high-salt ciba pepper samples, possibly due to metabolic differences in Bacillus species [26].
In this study, the mechanism underlying the flavor change in ciba pepper samples with different salt concentrations was investigated, and the differential substances produced after 35 days of fermentation of ciba pepper in the presence of different salt concentrations were determined. Notably, the combination of E-nose and GC-IMS could improve the overall performance of the individual techniques and provide a comprehensive characterization of the fermented ciba pepper samples. Moreover, a few of the E-nose sensors (such as P30/2, P40/1, LY2/LG, T40/2, and P40/2), which exhibited significantly higher response values for the above-mentioned compounds, could be considered potential candidates for developing targeted analysis methods by means of an E-nose for practical sample analysis. However, the effect of microbial community structure and community changes on the fermentation flavor of ciba pepper is an interesting topic. In the future, the dynamic changes in microbial diversity and volatile flavor substances during the fermentation of ciba pepper and their correlations will be described to better understand the quality changes during the fermentation of ciba pepper.

5. Conclusions

This study aimed to investigate the mechanism of flavor change in ciba pepper with varying salt concentrations and determine the differential substances produced after 35 days of fermentation. The findings indicated that compared to the traditional high-salt ciba pepper (10%), fermented ciba pepper with a salt concentration ranging from 6% to 8% exhibited higher sensory scores and contained a more abundant array of flavor compounds. Secondly, low-salt fermented ciba pepper (2–6%) displayed higher levels of alcohol, aldehyde and ester substances, such as (E)-2-hexenal and ethyl ester, which have a fruity aroma. Notably, the combined use of E-nose and GC-IMS improved the individual performance of these techniques, enabling a comprehensive characterization of the fermented ciba pepper samples. However, the impact of microbial community structure and its changes on the fermentation flavor of ciba pepper remains an intriguing subject. Future research should focus on describing the dynamic changes in microbial diversity and volatile flavor substances during ciba pepper fermentation and exploring their correlations to gain a better understanding of the quality changes occurring throughout the fermentation process.

Supplementary Materials

The following supporting information can be downloaded at: https://www.mdpi.com/article/10.3390/fermentation10020111/s1, Table S1. The peak volume of the flavor profile characterized by GC-IMS in ciba pepper samples with varying salt concentrations (mean ± sd).

Author Contributions

Conceptualization, J.D. and Y.X.; methodology, Y.X. and B.W.; software, T.W. and Y.X.; validation, H.W. and Y.X.; Investigation, L.Y. and Y.X.; resources, Y.Y.; data curation, C.Z. and Y.X.; writing—original draft preparation, Y.X.; writing—review and editing, C.Z. and J.G.; visualization, Y.Y. and L.Y.; project administration, Y.Y.; supervision, H.W. and J.D.; funding acquisition, J.D. and Y.Y. All authors have read and agreed to the published version of the manuscript.

Funding

This work was supported by the Sichuan Science and Technology Department (2023ZHCG0078), the Sichuan Provincial Department of Education Research Center Project (18TD0043), and the Key Laboratory of Colleges and Universities in Sichuan Province (PRKX201910).

Institutional Review Board Statement

Not applicable.

Informed Consent Statement

Informed consent was obtained from all subjects involved in the study.

Data Availability Statement

The data presented in this study are available on request from the corresponding author.

Conflicts of Interest

The authors declare no conflicts of interest.

References

  1. Cai, W.; Tang, F.; Wang, Y.; Zhang, Z.; Xue, Y.; Zhao, X.; Guo, Z.; Shan, C. Bacterial diversity and flavor profile of Zha-Chili, a traditional fermented food in China. Food Res. Int. 2021, 141, 110112. [Google Scholar] [CrossRef] [PubMed]
  2. Zhuang, Y.; Chen, L.; Sun, L.; Cao, J. Bioactive characteristics and antioxidant activities of nine peppers. J. Funct. Foods 2012, 4, 331–338. [Google Scholar] [CrossRef]
  3. Sricharoen, P.; Lamaiphan, N.; Patthawaro, P.; Limchoowong, N.; Techawongstien, S.; Chanthai, S. Phytochemicals in Capsicum oleoresin from different varieties of hot chilli peppers with their antidiabetic and antioxidant activities due to some phenolic compounds. Ultrason. Sonochem. 2017, 38, 629–639. [Google Scholar] [CrossRef] [PubMed]
  4. Kim, M.J.; Kwak, H.S.; Kim, S.S. Effects of salinity on bacterial communities, Maillard reactions, isoflavone composition, antioxidation and antiproliferation in Korean fermented soybean paste (doenjang). Food Chem. 2018, 245, 402–409. [Google Scholar] [CrossRef] [PubMed]
  5. Bae, H.; Jayaprakasha, G.K.; Jifon, J.; Patil, B.S. Extraction efficiency and validation of an HPLC method for flavonoid analysis in peppers. Food Chem. 2012, 130, 751–758. [Google Scholar] [CrossRef]
  6. Lee, K.W.; Shim, J.M.; Kim, D.W.; Yao, Z.; Kim, J.A.; Kim, H.-J.; Kim, J.H. Effects of different types of salts on the growth of lactic acid bacteria and yeasts during kimchi fermentation. Food Sci. Biotechnol. 2017, 27, 489–498. [Google Scholar] [CrossRef]
  7. He, F.J.; MacGregor, G.A. Effect of modest salt reduction on blood pressure: A meta-analysis of randomized trials. Implications for public health. J. Hum. Hypertens. 2002, 16, 761–770. [Google Scholar] [CrossRef]
  8. Lee, M.-A.; Choi, Y.-J.; Lee, H.; Hwang, S.; Lee, H.J.; Park, S.J.; Chung, Y.B.; Yun, Y.-R.; Park, S.-H.; Min, S.; et al. Influence of Salinity on the Microbial Community Composition and Metabolite Profile in Kimchi. Fermentation 2021, 7, 308. [Google Scholar] [CrossRef]
  9. Jiang, L.; Lu, Y.; Ma, Y.; Liu, Z.; He, Q. Comprehensive investigation on volatile and non-volatile metabolites in low-salt doubanjiang with different fermentation methods. Food Chem. 2023, 413, 135588. [Google Scholar] [CrossRef] [PubMed]
  10. Chun, B.H.; Kim, K.H.; Jeong, S.E.; Jeon, C.O. The effect of salt concentrations on the fermentation of doenjang, a traditional Korean fermented soybean paste. Food Microbiol. 2020, 86, 103329. [Google Scholar] [CrossRef] [PubMed]
  11. Koltun, S.J.; MacIntosh, A.J.; Goodrich-Schneider, R.M.; Klee, H.J.; Hutton, S.F.; Junoy, L.J.; Sarnoski, P.J. Effects of thermal processing on flavor and consumer perception using tomato juice produced from Florida grown fresh market cultivars. J. Food Process. Preserv. 2022, 46, e16164. [Google Scholar] [CrossRef]
  12. Hu, Y.; Zhang, L.; Wen, R.; Chen, Q.; Kong, B. Role of lactic acid bacteria in flavor development in traditional Chinese fermented foods: A review. Crit. Rev. Food Sci. Nutr. 2022, 62, 2741–2755. [Google Scholar] [CrossRef] [PubMed]
  13. Wang, S.; Chen, H.; Sun, B. Recent progress in food flavor analysis using gas chromatography-ion mobility spectrometry (GC-IMS). Food Chem. 2020, 315, 126158. [Google Scholar] [CrossRef]
  14. Cao, W.; Shu, N.; Wen, J.; Yang, Y.; Jin, Y.; Lu, W. Characterization of the Key Aroma Volatile Compounds in Nine Different Grape Varieties Wine by Headspace Gas Chromatography-Ion Mobility Spectrometry (HS-GC-IMS), Odor Activity Values (OAV) and Sensory Analysis. Foods 2022, 11, 2767. [Google Scholar] [CrossRef]
  15. Han, Y.; Wang, C.; Zhang, X.; Li, X.; Gao, Y. Characteristic volatiles analysis of Dongbei Suancai across different fermentation stages based on HS-GC-IMS with PCA. J. Food Sci. 2022, 87, 612–622. [Google Scholar] [CrossRef]
  16. Yang, Y.; Niu, C.; Shan, W.; Zheng, F.; Liu, C.; Wang, J.; Li, Q. Physicochemical, flavor and microbial dynamic changes during low-salt doubanjiang (broad bean paste) fermentation. Food Chem. 2021, 351, 128454. [Google Scholar] [CrossRef]
  17. Ye, Z.; Shang, Z.; Zhang, S.; Li, M.; Zhang, X.; Ren, H.; Hu, X.; Yi, J. Dynamic analysis of flavor properties and microbial communities in Chinese pickled chili pepper (Capsicum frutescens L.): A typical industrial-scale natural fermentation process. Food Res. Int. 2022, 153, 110952. [Google Scholar] [CrossRef] [PubMed]
  18. Jiang, X.; Xu, Y.; Ye, J.; Yang, Z.; Huang, S.; Liu, Y.; Zhou, S. Isolation, identification and application on soy sauce fermentation flavor bacteria of CS1.03. J. Food Sci. Technol. 2019, 56, 2016–2026. [Google Scholar] [CrossRef]
  19. Hu, W.; Yang, X.; Ji, Y.; Guan, Y. Effect of starter cultures mixed with different autochthonous lactic acid bacteria on microbial, metabolome and sensory properties of Chinese northeast sauerkraut. Food Res. Int. 2021, 148, 110605. [Google Scholar] [CrossRef] [PubMed]
  20. Zhu, C.; Yang, Z.; Lu, X.; Yi, Y.; Tian, Q.; Deng, J.; Jiang, D.; Tang, J.; Laghi, L. Effects of Saccharomyces cerevisiae strains on the metabolomic profiles of Guangan honey pear cider. LWT 2023, 182, 114816. [Google Scholar] [CrossRef]
  21. Zhao, X.; Feng, J.; Laghi, L.; Deng, J.; Dao, X.; Tang, J.; Ji, L.; Zhu, C.; Picone, G. Characterization of Flavor Profile of “Nanx Wudl” Sour Meat Fermented from Goose and Pork Using Gas Chromatography–Ion Mobility Spectrometry (GC–IMS) Combined with Electronic Nose and Tongue. Foods 2023, 12, 2194. [Google Scholar] [CrossRef]
  22. Bekhit, A.E.-D.A.; Duncan, A.; Bah, C.S.F.; Ahmed, I.A.M.; Al-Juhaimi, F.Y.; Amin, H.F. Impact of fermentation conditions on the physicochemical properties, fatty acid and cholesterol contents in salted-fermented hoki roe. Food Chem. 2018, 264, 73–80. [Google Scholar] [CrossRef]
  23. Seo, S.-H.; Park, S.-E.; Kim, E.-J.; Lee, K.-I.; Na, C.-S.; Son, H.-S. A GC-MS based metabolomics approach to determine the effect of salinity on Kimchi. Food Res. Int. 2018, 105, 492–498. [Google Scholar] [CrossRef]
  24. Aryee, A.N.A.; Owusu-Kwarteng, J.; Senwo, Z.; Alvarez, M.N. Characterizing fermented habanero pepper (Capsicum chinense L). Food Chem. Adv. 2022, 1, 100137. [Google Scholar] [CrossRef]
  25. Li, D.; Duan, F.; Tian, Q.; Zhong, D.; Wang, X.; Jia, L. Physiochemical, microbiological and flavor characteristics of traditional Chinese fermented food Kaili Red Sour Soup. LWT 2021, 142, 110933. [Google Scholar] [CrossRef]
  26. Jia, Y.; Niu, C.-T.; Zheng, F.-Y.; Liu, C.-F.; Wang, J.-J.; Lu, Z.-M.; Xu, Z.-H.; Li, Q. Development of a defined autochthonous starter through dissecting the seasonal microbiome of broad bean paste. Food Chem. 2021, 357, 129625. [Google Scholar] [CrossRef]
  27. Chen, H.; Nie, X.; Peng, T.; Xiang, L.; Liu, D.; Luo, H.; Zhao, Z. Effects of Low-Temperature and Low-Salt Fermentation on the Physicochemical Properties and Volatile Flavor Substances of Chinese Kohlrabi Using Gas Chromatography–Ion Mobility Spectrometry. Fermentation 2023, 9, 146. [Google Scholar] [CrossRef]
  28. Xie, Y.; Chou, L.; Cutler, A.; Weimer, B. DNA Macroarray profiling of Lactococcus lactis subsp. lactis IL1403 gene expression during environmental stresses. Appl. Environ. Microbiol. 2004, 70, 6738–6747. [Google Scholar] [CrossRef] [PubMed]
  29. Li, X.; Cheng, X.; Yang, J.; Wang, X.; Lü, X. Unraveling the difference in physicochemical properties, sensory, and volatile profiles of dry chili sauce and traditional fresh dry chili sauce fermented by Lactobacillus plantarum PC8 using electronic nose and HS-SPME-GC-MS. Food Biosci. 2022, 50, 102057. [Google Scholar] [CrossRef]
  30. Wu, R.; Yu, M.; Liu, X.; Meng, L.; Wang, Q.; Xue, Y.; Wu, J.; Yue, X. Changes in flavour and microbial diversity during natural fermentation of suan-cai, a traditional food made in Northeast China. Int. J. Food Microbiol. 2015, 211, 23–31. [Google Scholar] [CrossRef]
  31. Chen, Y.; Chen, H.; Cui, D.; Fang, X.; Gao, J.; Liu, Y. Fast and Non-Destructive Profiling of Commercial Coffee Aroma under Three Conditions (Beans, Powder, and Brews) Using GC-IMS. Molecules 2022, 27, 6262. [Google Scholar] [CrossRef] [PubMed]
  32. Matsuo, R.; Mizobuchi, S.; Nakashima, M.; Miki, K.; Ayusawa, D.; Fujii, M. Central roles of iron in the regulation of oxidative stress in the yeast Saccharomyces cerevisiae. Curr. Genet. 2017, 63, 895–907. [Google Scholar] [CrossRef] [PubMed]
  33. Chen, Z.; Geng, Y.; Wang, M.; Lv, D.; Huang, S.; Guan, Y.; Hu, Y. Relationship between microbial community and flavor profile during the fermentation of chopped red chili (Capsicum annuum L.). Food Biosci. 2022, 50, 102071. [Google Scholar] [CrossRef]
  34. Huang, X.; Yu, S.; Han, B.; Chen, J. Bacterial community succession and metabolite changes during sufu fermentation. LWT 2018, 97, 537–545. [Google Scholar] [CrossRef]
  35. Xu, X.; Wu, B.; Zhao, W.; Pang, X.; Lao, F.; Liao, X.; Wu, J. Correlation between autochthonous microbial communities and key odorants during the fermentation of red pepper (Capsicum annuum L.). Food Microbiol. 2020, 91, 103510. [Google Scholar] [CrossRef] [PubMed]
  36. Ye, Y.; Wang, L.; Zhan, P.; Tian, H.; Liu, J. Characterization of the aroma compounds of Millet Huangjiu at different fermentation stages. Food Chem. 2022, 366, 130691. [Google Scholar] [CrossRef] [PubMed]
  37. Dong, J.; Wang, P.; Fu, X.; Dong, S.; Li, X.; Xiao, D. Increase ethyl acetate production in Saccharomyces cerevisiae by genetic engineering of ethyl acetate metabolic pathway. J. Ind. Microbiol. Biotechnol. 2019, 46, 801–808. [Google Scholar] [CrossRef] [PubMed]
  38. Xi, L.; Zhang, J.; Wu, R.; Wang, T.; Ding, W. Characterization of the Volatile Compounds of Zhenba Bacon at Different Process Stages Using GC–MS and GC–IMS. Foods 2021, 10, 2869. [Google Scholar] [CrossRef]
  39. Pereira, C.; Mendes, D.; Dias, T.; Garcia, R.; Da Silva, M.G.; Cabrita, M.J. Revealing the yeast modulation potential on amino acid composition and volatile profile of Arinto white wines by a combined chromatographic-based approach. J. Chromatogr. A 2021, 1641, 461991. [Google Scholar] [CrossRef]
  40. Hernandezorte, P.; Cersosimo, M.; Loscos, N.; Cacho, J.; Garciamoruno, E.; Ferreira, V. The development of varietal aroma from non-floral grapes by yeasts of different genera. Food Chem. 2008, 107, 1064–1077. [Google Scholar] [CrossRef]
  41. Yu, H.; Xie, T.; Xie, J.; Ai, L.; Tian, H. Characterization of key aroma compounds in Chinese rice wine using gas chromatography-mass spectrometry and gas chromatography-olfactometry. Food Chem. 2019, 293, 8–14. [Google Scholar] [CrossRef]
  42. Wu, T.; Wang, M.; Wang, P.; Tian, H.; Zhan, P. Advances in the Formation and Control Methods of Undesirable Flavors in Fish. Foods 2022, 11, 2504. [Google Scholar] [CrossRef]
  43. Nie, X.; Chen, H.; Xiang, L.; Zhang, Y.; Liu, D.; Zhao, Z. GC-TOF-MS-Based Non-Targeted Metabolomic Analysis of Differential Metabolites in Chinese Ultra-Long-Term Industrially Fermented Kohlrabi and Their Associated Metabolic Pathways. Metabolites 2022, 12, 991. [Google Scholar] [CrossRef]
  44. Xiong, T.; Li, J.; Liang, F.; Wang, Y.; Guan, Q.; Xie, M. Effects of salt concentration on Chinese sauerkraut fermentation. LWT-Food Sci. Technol. 2016, 69, 169–174. [Google Scholar] [CrossRef]
  45. Chen, Y.; Xu, H.; Ding, S.; Zhou, H.; Qin, D.; Deng, F.; Wang, R. Changes in volatile compounds of fermented minced pepper during natural and inoculated fermentation process based on headspace–gas chromatography–ion mobility spectrometry. Food Sci. Nutr. 2020, 8, 3362–3379. [Google Scholar] [CrossRef]
  46. Preciado-Saldaña, A.M.; Abraham Domínguez-Avila, J.; Fernando Ayala-Zavala, J.; Villegas-Ochoa, M.A.; Sáyago-Ayerdi, S.G.; Wall-Medrano, A.; González-Córdova, A.F.; González-Aguilar, G.A. Formulation and characterization of an optimized functional beverage from hibiscus (Hibiscus sabdariffa L.) and green tea (Camellia sinensis L.). Food Sci. Technol. Int. 2019, 25, 547–561. [Google Scholar] [CrossRef] [PubMed]
  47. Peyer, L.C.; Zannini, E.; Arendt, E.K. Lactic acid bacteria as sensory biomodulators for fermented cereal-based beverages. Trends Food Sci. Technol. 2016, 54, 17–25. [Google Scholar] [CrossRef]
  48. Yi, C.; Li, Y.; Zhu, H.; Liu, Y.; Quan, K. Effect of Lactobacillus plantarum fermentation on the volatile flavors of mung beans. LWT 2021, 146, 111434. [Google Scholar] [CrossRef]
  49. Lee, S.; Ahn, B. Comparison of volatile components in fermented soybean pastes using simultaneous distillation and extraction (SDE) with sensory characterisation. Food Chem. 2009, 114, 600–609. [Google Scholar] [CrossRef]
  50. Ye, Z.; Shang, Z.; Li, M.; Zhang, X.; Ren, H.; Hu, X.; Yi, J. Effect of ripening and variety on the physiochemical quality and flavor of fermented Chinese chili pepper (Paojiao). Food Chem. 2022, 368, 130797. [Google Scholar] [CrossRef]
  51. Xu, J.; Zhang, Y.; Yan, F.; Tang, Y.; Yu, B.; Chen, B.; Lu, L.; Yuan, L.; Wu, Z.; Chen, H. Monitoring Changes in the Volatile Compounds of Tea Made from Summer Tea Leaves by GC-IMS and HS-SPME-GC-MS. Foods 2022, 12, 146. [Google Scholar] [CrossRef] [PubMed]
  52. He, F.; Yang, S.; Zhang, G.; Xu, L.; Li, H.; Sun, J.; Huang, M.; Zheng, F.; Sun, B. Exploration of key aroma active compounds in strong flavor Baijiu during the distillation by modern instrument detection technology combined with multivariate statistical analysis methods. J. Food Compos. Anal. 2022, 110, 104577. [Google Scholar] [CrossRef]
  53. Jin, G.; He, L.; Zhang, J.; Yu, X.; Wang, J.; Huang, F. Effects of temperature and NaCl percentage on lipid oxidation in pork muscle and exploration of the controlling method using response surface methodology (RSM). Food Chem. 2012, 131, 817–825. [Google Scholar] [CrossRef]
  54. Tufariello, M.; Durante, M.; Ramires, F.A.; Grieco, F.; Tommasi, L.; Perbellini, E.; Falco, V.; Tasioula-Margari, M.; Logrieco, A.F.; Mita, G.; et al. New process for production of fermented black table olives using selected autochthonous microbial resources. Front. Microbiol. 2015, 6, 1007. [Google Scholar] [CrossRef]
  55. Shen, C.; Cai, Y.; Wu, X.; Gai, S.; Wang, B.; Liu, D. Characterization of selected commercially available grilled lamb shashliks based on flavor profiles using GC-MS, GC × GC-TOF-MS, GC-IMS, E-nose and E-tongue combined with chemometrics. Food Chem. 2023, 423, 136257. [Google Scholar] [CrossRef]
Figure 1. Sensory profiles of ciba pepper samples with different salt concentrations (“*” indicates significant differences; “*” for p < 0.05, and “**” for p < 0.01).
Fermentation 10 00111 g001
Figure 2. An rPCA model for the response values of the sensors with significant differences among the five ciba pepper samples with varying salt concentrations. (a) The score plot of the data structure, different superscript letters in the sample label indicate significant differences (p < 0.05); (b) the loading plot of the relationships between the response of each sensor and its impact on PC 1 (p < 0.05).
Fermentation 10 00111 g002
Figure 3. Circle packing plots of the volatile profiles detected by GC-IMS (ae).
Fermentation 10 00111 g003
Figure 4. GC-IMS plots of volatile flavor substances in the five ciba pepper samples. (a) Image of a 3D topographic representation of the volatile compounds; (b) 2D topographic images in differential comparison mode; (c) gallery plot of the identified volatile flavor substances.
Fermentation 10 00111 g004
Figure 5. An rPCA model for volatile substances with significant differences in their amounts among the five ciba pepper samples with varying salt concentrations. (a) The score plot of the data structure, different superscript letters in the sample label indicate significant differences (p < 0.05); (b) the loading plot of significant relationships between the concentration of each volatile substance and its impact on PC1 (p < 0.05); (c) the volcano plot of the volatile compound concentrations.
Fermentation 10 00111 g005
Figure 6. The Spearman’s correlation heatmap between significantly altered volatile compound levels and electronic nose sensors’ response. Red indicates a positive correlation, and blue indicates a negative correlation. The significance levels are denoted by asterisks (“*” for p < 0.05, “**” for p < 0.01, “***” for p < 0.001 and “****” for p < 0.0001).
Fermentation 10 00111 g006
Table 1. Comprehensive sensory evaluation standards.
Excellent (9–7)Good (7–5)Moderate (5–3)Poor (3–1)
ColorRed and brightRed and slightly darkRed but darkDull
OdorHas a mellow chili odorFragrant and slight aromaFragrance-freeHas a pungent odor
TasteRich and pleasant tasteSlightly sour or salty, good tasteToo sour or too saltyStrange and unacceptable
TextureUniform texture and stickyUniform texture Average viscosity and slightly dry Dry and not uniform
Table 2. Physicochemical properties of ciba pepper.
IndicatorLJALJBLJCLJDLJE
pH3.77 ± 0.01 a3.77 ± 0.01 a3.74 ± 0.01 b3.78 ± 0.01 c3.89 ± 0.01 d
Total acid (%)25.40 ± 0.56 a24.31 ± 0.44 b23.22 ± 0.14 b21.46 ± 0.06 c20.51 ± 0.07 c
Amino acid nitrogen (%)0.091 ± 0.001 a0.072 ± 0.005 b0.061 ± 0.001 c0.045 ± 0.003 d0.040 ± 0.002 d
Total colony number
(log10 CFU/g)
9.13 ± 0.33 a8.94 ± 0.13 a8.82 ± 0.21 a7.64 ± 0.15 b6.23 ± 0.24 c
Lactic acid bacteria count
(log10 CFU/g)
8.42 ± 0.24 a6.97 ± 0.19 b5.88 ± 0.58 b4.55 ± 0.43 c4.06 ± 0.29 c
Note: Different superscript letters in the same row indicate significant differences (p < 0.05).
Disclaimer/Publisher’s Note: The statements, opinions and data contained in all publications are solely those of the individual author(s) and contributor(s) and not of MDPI and/or the editor(s). MDPI and/or the editor(s) disclaim responsibility for any injury to people or property resulting from any ideas, methods, instructions or products referred to in the content.

