Article

Lactic Acid Fermentation as a Valorising Agent for Brewer’s Spent Yeast—Improving the Sensory Quality and Nutritional Potential

1
School of Food and Nutritional Science, University College Cork, T12 K8AF Cork, Ireland
2
Department of Environmental Biology, “Sapienza” University of Rome, 00185 Rome, Italy
3
APC Microbiome Institute, University College Cork, T12 YT20 Cork, Ireland
*
Author to whom correspondence should be addressed.
Fermentation 2024, 10(1), 54; https://doi.org/10.3390/fermentation10010054
Submission received: 14 December 2023 / Revised: 3 January 2024 / Accepted: 11 January 2024 / Published: 13 January 2024

Abstract

:
Brewer’s spent yeast (BSY) is one of the brewing industry’s most plentiful side-streams. Abundant, low-cost and high in nutrients, it has great potential for application in food technology and human nutrition. With the ever-increasing interest in sustainability, waste reduction and circular food systems, the use of BSY as a novel food ingredient may be the route to add exponential value while reducing the environmental impact. However, negative flavour characteristics and high amounts of alcohol severely limit the current applications of BSY. This study explores the use of processing involving lactic acid bacteria (LAB) fermentation technology as a means of improving BSY quality characteristics and examines the effects of this process on the chemical, nutritional and sensory characteristics of BSY. The results reveal that BSY is a suitable substrate for LAB fermentation, successfully supporting the growth of Lactobacillus amylovorus FST 2.11. Compared to the unfermented BSY (CBSY), fermentation significantly reduced the perceptible bitterness of the BSY as detected by a sensory panel, from 6.0 ± 2.8 units to 0.9 ± 0.7 units, respectively. Fermented BSY (PBSY) had enhanced sour and fruity flavours, and a variety of other volatile compounds and metabolites were determined. Protein profiles showed significant protein degradation, and free amino acid levels were greatly increased following fermentation, from 2.8 ± 0.2 g/100 g to 10.5 ± 0.4 g/100 g, respectively. Protein quality was high, with the CBSY and PBSY providing well over the required level (>100%) of essential amino acids per gram protein, with the exception of sulphur amino acids (98%). Major physical differences were observed using scanning electron microscopy. This study concludes that LAB fermentation positively affects the sensory and nutritional characteristics of BSY and can aid in the incorporation of brewer’s spent yeast into foods for human consumption.

1. Introduction

Yeast is a single-celled organism in use since ancient times for brewing and baking. During the brewing process, yeast (particularly Saccharomyces spp.) converts sugars extracted from grains into alcohol and CO2. Yeast may be repitched and reused several times, with the exact number varying between different breweries, but generally between 3 and 20 times [1]. After this point, the yeast is no longer active and is removed from the process as a waste product. This spent yeast biomass is the second most plentiful byproduct of the brewing industry, with approximately 15–18 tons of surplus yeast produced per 10,000 hL of beer [2,3]. Brewer’s spent yeast (BSY) could be used as an inexpensive source of protein, dietary fibre, vitamins and minerals [4]. With an increasing global interest in sustainability, the upcycling of waste materials is gaining momentum. However, due to its extremely bitter taste, there are very few outlets for BSY. The current primary use of BSY is in formulations for animal and fish feed, usually in dried form as a protein supplement, where it has been shown to induce positive effects, including increased milk yield, improved pathogen resistance and improved general health at up to a 30% inclusion [5,6,7,8]. Efforts have been made to debitter spent yeast, but most commonly require alkali treatments [9,10,11], which can negatively impact the nutritional quality of the yeast. Physical separation by means of rotary microfiltration has also been explored [10], but was found to be not as effective as the alkaline washing methods.
Fermentation is a widely used and ancient technology, mainly as a means of food preservation and to improve the organoleptic properties of foods. The way in which fermentation has been used in food processing has evolved and advanced greatly over the last millennia, from in the past, when little was understood of the microorganisms involved, to the modern day, where fermentation forms the basis of many industrial food-production processes, such as alcoholic beverage production, cheeses, yoghurts, as well as meat and vegetable products [12]. The production of acids and other metabolites, as well as proteolysis and lipolysis by endogenous microbial enzymes, have the potential to greatly alter the flavour of fermented food products [13], and can improve the nutrition and digestibility [14].
Lactobacillus amylovorus FST2.11 is a hop-resistant, alcohol-tolerant and homofermentative strain isolated from a cereal environment [15,16]. A study by Lowe et al. examined the characteristics of Lactobacillus amylovorus in the acidification of mash during the brewing process, showing strong protease and amylase activity, particularly at a pH of 5.4, increasing the concentration of free amino acids, and therefore free amino nitrogen, in the mash [17]. L. amylovorus has also demonstrated its ability as a producer of antifungal compounds, allowing for its use as an alternative to preservatives in breads [15]. This effect has also been shown in a cheddar cheese model, where many fungal strains were inhibited, including Aspergillus niger, Fusarium culmorum, Penicillium expansum, Penicillium roqueforti and Aspergillus fumigatus [18].
To date, the use of BSY as a substrate for lactic acid bacterial fermentation is largely unexplored. The aim of this study was to modify BSY using a process involving fermentation and to characterise the changes in the BSY, regarding the organoleptic properties and the nutritional profile, due to this process. A transformation which favours both aspects, the organoleptic properties and nutritional profile, would open the door for the use of BSY as an ingredient in foods for human consumption.

2. Materials and Methods

2.1. Raw Material and Bacterial Strain

Liquid spent yeast was provided by Anheuser-Busch InBev SA/NV (Leuven, Belgium) and frozen at −20 °C until required. The yeast provided was a fifth-generation lager strain. Yeast was cropped after ~120–160 h of fermentation. The yeast cell viability of the liquid spent yeast material was determined by diluting 1 mL aliquots in 9 mL of ¼ strength Ringers’ solution and spread-plating 100 µL aliquots onto yeast potato dextrose (YPD) agar supplemented with 30 µg/mL of chloramphenicol. Lactobacillus amylovorus FST2.11, patented as strain DSM 19280, was originally isolated from a cereal environment [15] and is part of the University College Cork culture collection. A wide range of lactic acid bacteria strains were screened for their ability to use BSY as a substrate before L. amylovorus FST2.11 was selected due to its superior performance. Frozen stock cultures were maintained at −80 °C in 40% glycerol. The strain was routinely cultivated on deMan–Rogosa–Sharpe (MRS) agar supplemented with 0.05 g/L of bromocresol green and incubated anaerobically at 30 °C for 48 h. All chemicals were sourced from Sigma–Aldrich (St. Louis, MO, USA) unless otherwise stated.

2.2. BSY Fermentation

Prior to fermentation, the solids content of the BSY was standardised by centrifuging at 12,000× g for 30 min, after which the supernatant was discarded and sterile water was added to reach a solids content of 40%. The yeast cell viability of the standardised BSY mixture was determined by diluting 1 mL aliquots of BSY in 9 mL of ¼ strength Ringer’s solution and spread-plating 100 µL aliquots onto YPD agar plates supplemented with 30 µg/mL of chloramphenicol. Then, 700 millilitre aliquots of the standardised BSY were placed into 1 L bioreactor vessels (DASGIP Bioblock, Eppendorf, Stevenage, UK), to which 4% sucrose (w/w) was added. Autolysis was performed at 50 °C for 20 h, followed by sterilisation at 90 °C for 30 min to kill any viable yeast cells prior to the fermentation. Raw material BSY was determined to have an ethanol content of 9.10% (v/v), which was lowered to 3.60% (v/v) following standardisation. Although some LAB have been shown to have the ability to grow in the presence of high levels of ethanol [19], Peyer et al. (2017) demonstrated that the growth of L. amylovorus FST 2.11 was affected at a concentration of ≥8% (v/v) of ethanol [16]. Therefore, it was necessary to apply the described standardisation process, resulting in a decreased and more tolerable ethanol content of 3.60% (v/v). Working cultures of L. amylovorus FST2.11 were prepared by inoculating single colonies into 10 mL of MRS broth and incubating at 30 °C for 24 h, followed by subculturing (1%) into fresh MRS broth for 18 h. Cells were harvested by centrifugation at 5000× g for 5 min, washed and resuspended in an equal volume of ¼ strength Ringer’s solution. After sterilisation, the BSY was cooled to 30 °C and inoculated with 1% washed L. amylovorus FST2.11 cultures [20,21]. Bioreactor fermentations were performed using a DASGIP Bioblock (Eppendorf, UK) for temperature and agitation control. The BSY fermentations were carried out for 72 h at 30 °C with a stirring rate of 200 rpm. At the end of the fermentation period, the BSY was pasteurised at 72 °C for 15 min. The BSY which did not undergo any standardisation or fermentation was pasteurised at 72 °C for 15 min and included as a control. Successful pasteurisation was confirmed by serial diluting 1 mL aliquots of CBSY and PBSY in 9 mL of ¼ strength Ringers’ solution and spread-plating 100 µL aliquots onto MRS agar supplemented with 0.05 g/L of bromocresol green and 50 µg/mL cycloheximide (PBSY), and/or onto yeast potato dextrose (YPD) agar supplemented with 30 µg of chloramphenicol (CBSY and PBSY). Both fermented and nonfermented BSY were frozen at −80 °C and subsequently freeze-dried to produce a dried ingredient. The dried fermented BSY is referred as processed BSY (PBSY), and the unfermented BSY is the control (CBSY).

2.3. Characterisation of the Fermentation Profiles

To monitor the fermentation kinetics of FST 2.11, samples were taken every 24 h, and the pH, total titratable acidity (TTA), the alcohol content and the microbial cell count were analysed.

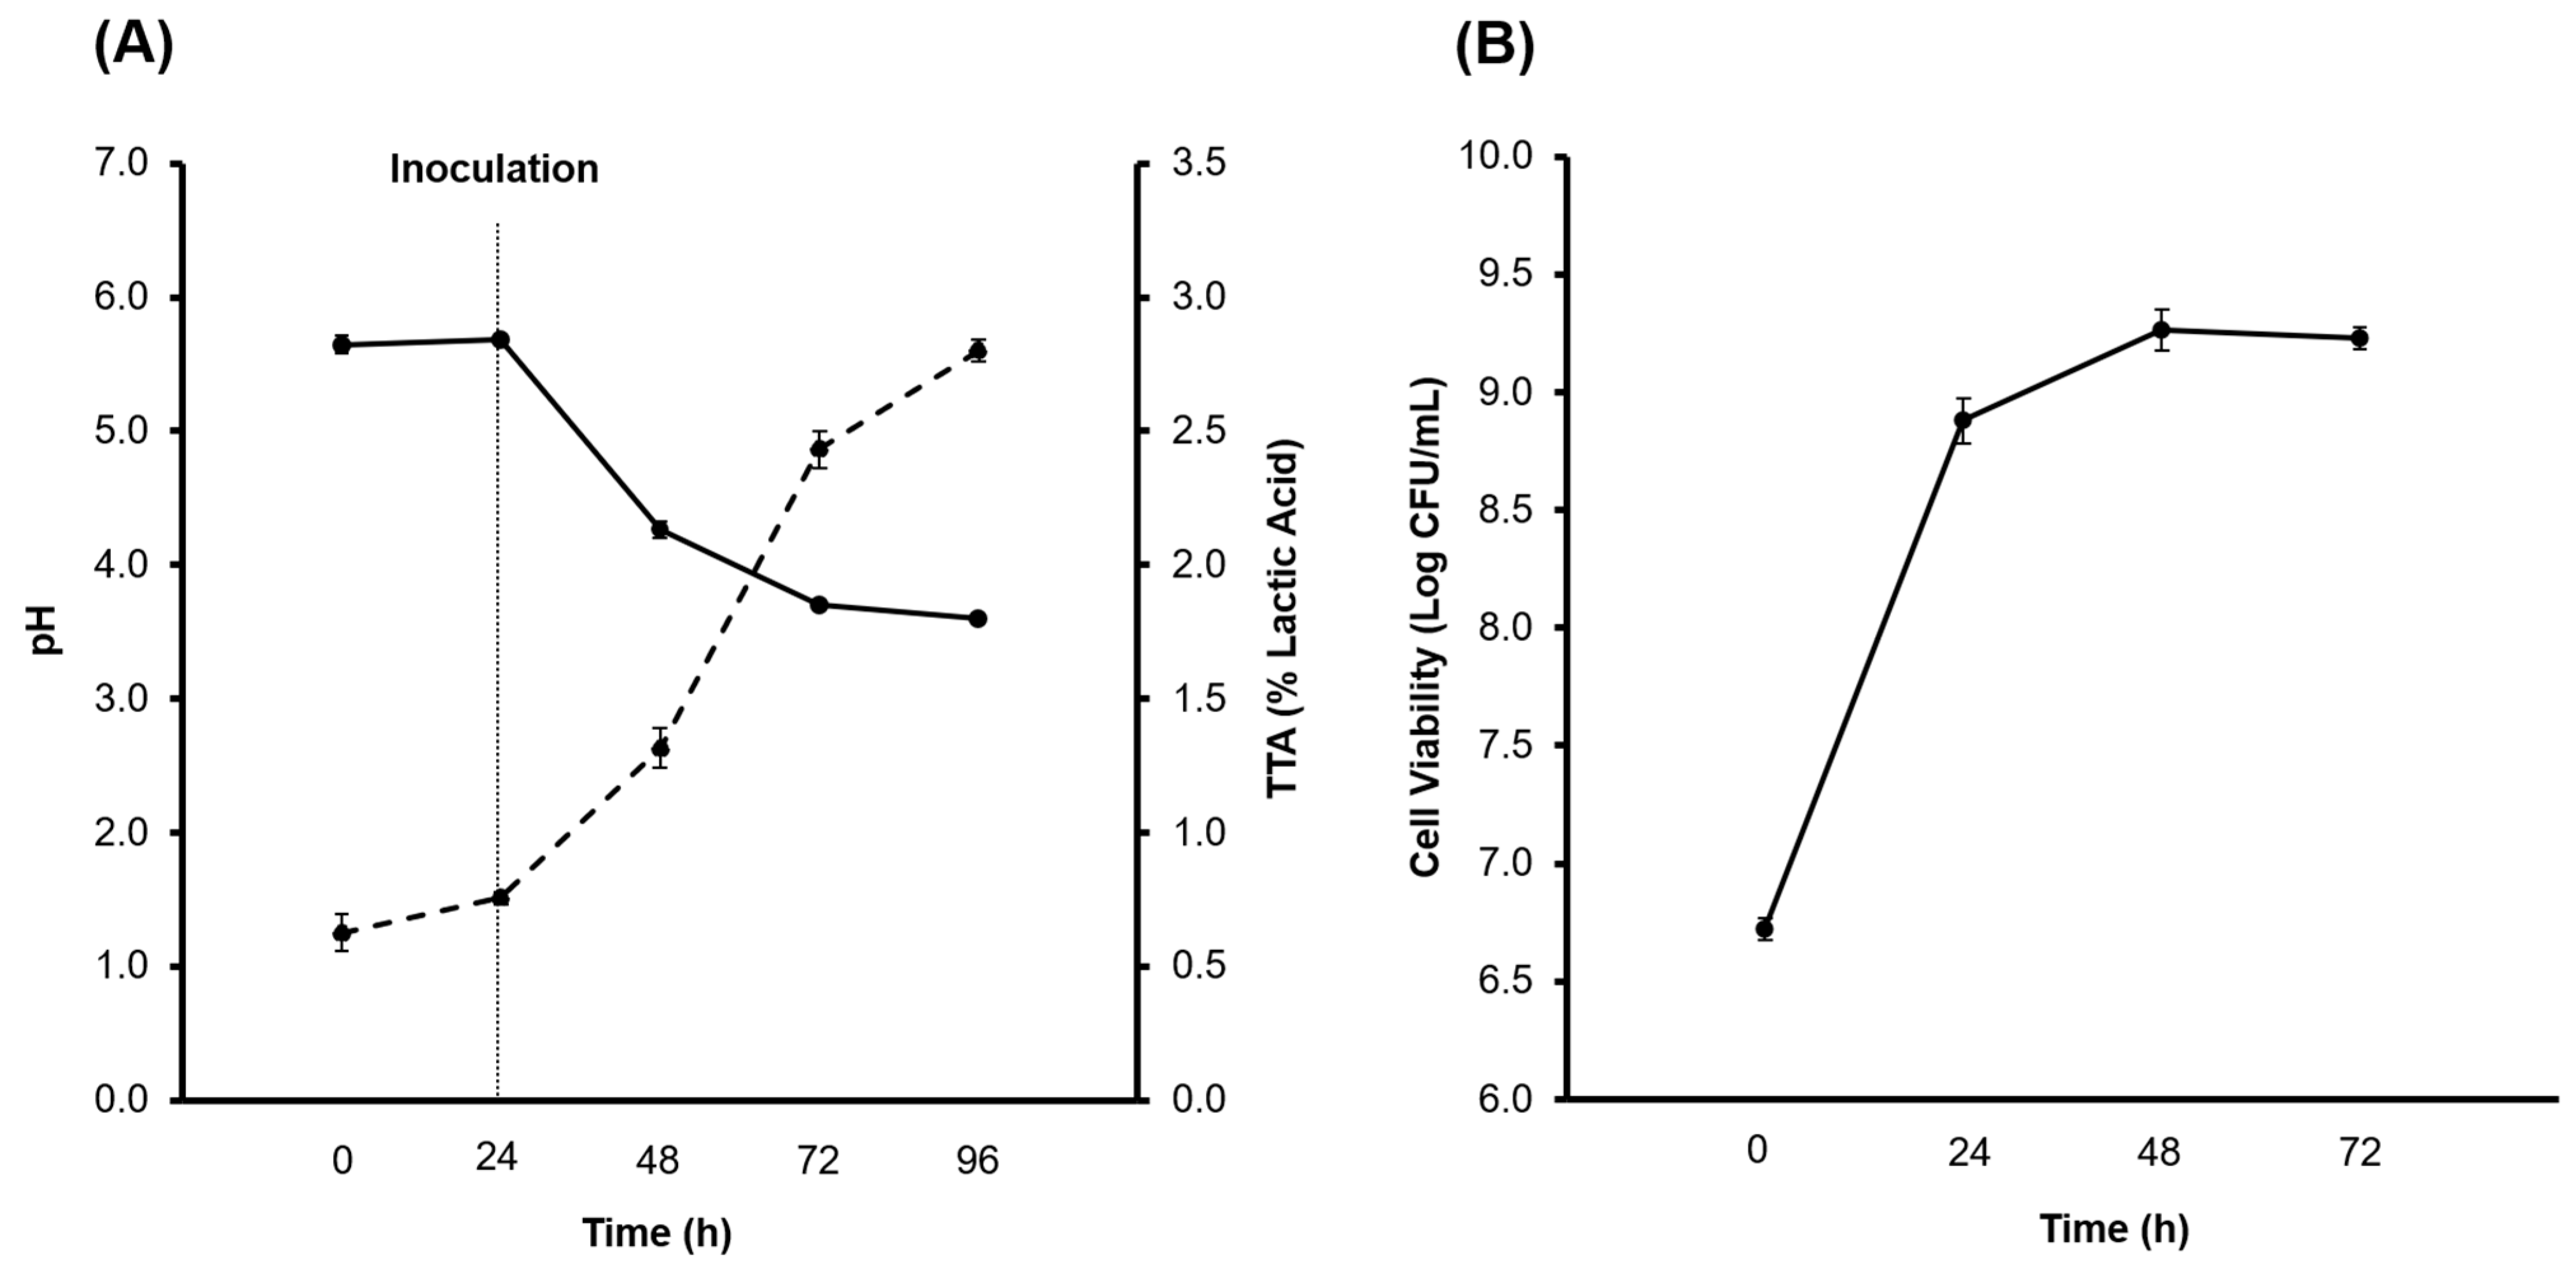
The pH, TTA, Alcohol and Microbial Growth Determination

The pH and TTA of the samples were determined according to a standardised method (AACC 02-31.01) [22], and the TTA was expressed in % lactic acid. The alcohol content (% v/v) was measured using an Alcolyzer beer analysing system consisting of a DMA 4500 M density meter, an Alcolyzer beer ME measuring module and an Xsample 520 sample changer (Anton Paar GmbH, Graz, Austria), as described by Bellut et al. [23]. Briefly, the samples were separated by centrifugation at 5000× g for 5 min and 10 mL of the supernatant used for the analysis. Cell counts of L. amylovorus FST2.11 were determined by diluting 1 mL aliquots of BSY in 9 mL of ¼ strength Ringers’ solution. Samples were serially diluted and 100 µL aliquots were spread-plated onto MRS agar supplemented with 0.05 g/L of bromocresol green and 50 µg/mL of cycloheximide. Plates were incubated anaerobically at 30 °C for 48 h.

2.4. Dried Ingredient Characterisation

2.4.1. Compositional Analysis

Compositional analysis (moisture, protein, fat, energy values, sugars, minerals, amino acids) was performed externally by Chelab SRL (Treviso, Italy): moisture was determined gravimetrically in line with the ISTISAN report [24]; the protein content was analysed using the DUMAS method, with a nitrogen–protein conversion factor of 6.25; the fat was determined using the Soxhlet method, as described in the ISTISAN report [24]; the ash content was determined gravimetrically; sugars were determined by HPLC–pulsed amperometry; the total and free amino acid composition was analysed using HPLC/UV–Vis. Minerals were determined using modified versions of AOAC 2015.06, EN 15763:2010 and EPA 6020 B 2014 [25,26,27]. The fibre composition was determined internally according to AACC 32-05.01 “Total Dietary Fibre” [28].

2.4.2. Sensory Attributes

Sensory analysis of the CBSY and PBSY was performed by a panel of experienced sensory testers (n = 7) recruited from the Department of Food and Nutritional Science at University College Cork. Aqueous testing solutions were prepared at a 5% w/w concentration. Testers were asked to rank the intensity of the following descriptors on a 0–10 scale, with 10 being overwhelming and 0 being undetectable: aroma: intensity, yeast, cereal/grain, beer, fruity, roasted; taste: sour, bitter, sweet, umami, salty; flavour: intensity, mushroom, roasted, yeast, beer, cheese, fruity; aftertaste: intensity. Samples were presented to the panel one at a time. Panellists were provided with water to cleanse the palate between samples, and a reference list defining each of the characteristics of interest was provided. Sensory analysis was conducted in a sensory analysis room and was performed in duplicate in two separate sessions.

2.4.3. Aroma Compounds

The aroma compounds present in the CBSY and PBSY were analysed using gas chromatography–olfactometry (GC-O), and was completed externally by AromaLab (AromaLAB GmbH, Planegg, Germany). To prepare sample for the GC-O, 15 g of sample was extracted with 100 mL of diethyl ether. The organic layer was separated from the residue and the volatile compounds were isolated via distillation. The sample solution was dried over sodium sulphate and concentrated to 100 µL using a Vigreux column. A total of 80 aroma compounds were detected, but 16 of these were unidentified. Intensity was assigned by a trained operator, and the compound was identified based on the linear retention indices and aroma characteristics. Descriptors of individual compounds were found using The Good Scents Company flavour and fragrance database (The Good Scents Company, https://www.thegoodscentscompany.com/, (accessed on 8 December 2021)).

2.4.4. Protein Profile

Sodium dodecyl sulphate–polyacrylamide gel electrophoresis (SDS-PAGE) was used to determine the protein profiles of the CBSY and PBSY. The freeze-dried samples were weighed, targeting a 2% protein content for a 1 mL volume. The samples were extracted in 1 mL of extraction buffer (containing 5 M of urea, 2 M of thiourea, 2% SDS, 1 mM of EDTA and 0.1 M of Tris base) for 16 h while shaking at 500 rpm. After centrifugation and appropriate dilution, the samples were loaded onto tris glycine gels and run at a 200 V constant voltage and 75 Amps for 45 min. Precision Plus Protein Standard (Biorad, Hercules, CA, USA) was run alongside the samples for reference. Fixing (40% w/v methanol, 10% w/v acetic acid), staining (0.025% w/v Coomassie G250, 10% w/v acetic acid) and destaining (10% w/v acetic acid) were carried out until a satisfactory colour was achieved.

2.4.5. Metabolomics

Extraction of the metabolites was performed by dissolving the freeze-dried BSY samples in Milli-Q water, four times that of the weight of the sample, followed by mixing. Then, the sample was centrifuged at 16,000× g for 30 min. The supernatant was transferred into a new tube, followed by centrifugation. This step was repeated to a total of three centrifugations. Metabolomic analysis was carried out by MS-Omics, as follows. Briefly, samples were derivatised with methyl chloroformate using a slightly modified version of the protocol described by Smart et al. (2010) [29]. All samples were analysed in a randomised order. Analysis was performed using an Agilent 7890B gas chromatograph (7890B, Agilent, Hong Kong, China) coupled with an Agilent 5977B quadropole mass spectrometry detector. The system was controlled by ChemStation (Agilent). Raw data were converted to netCDF format using ChemStation (Agilent) before the data were imported and processed in Matlab R2018b (Mathworks, Inc., The Natick Mall, MA, USA) using the PARADISe software described by Johnsen et al. (2017) [30]. Pyruvic acid values were given as normalised peak areas to an internal standard of deuterium-labelled alanine. Samples were analysed in duplicate.

2.4.6. International Bitterness Units

The international bitterness units (IBUs) for the CBSY, PBSY and raw BSY were determined according to “2.17.1 Bittering Units (EBC)” in Jacob (2013) [31]. Briefly, iso-α-acids were extracted from the acidified sample using iso-octane. Then, the concentration of bittering substances in the solution was quantified by measuring the absorbance at 275 nm (Eppendorf BioSpectrometer, Eppendorf AG, Hamburg, Germany).

2.4.7. Colour

The colour of the ingredient powders was measured using the Minolta colour measuring system (Chroma meter CR-400/410 Konica Minolta, Tokyo, Japan). The colour was measured using the CIE colour system (XYZ values) and then translated into and reported using the hunter colour system (L*a*b*).

2.4.8. Ultrastructure

Scanning electron microscopy (SEM) was used to examine the ultrastructure of the CBSY and PBSY according to the method reported by Atzler et al. (2021) [32]. Freeze-dried BSY was mounted on stubs (G 306; 10 mm × 10 mm diameter; Agar Scientific, Essex, UK) and fixated using carbon tape (G3357N; carbon tabs, 9 mm; Agar Scientific, UK). These samples were then sputter-coated with a gold–palladium alloy (at a ratio of 80/20) using a Polaron E5150 sputter-coating unit, and imaging was executed with a JEOL Scanning Electron Microscope (JSM-5510, Jeol Ltd., Tokyo, Japan). The following settings were applied: 5 kV voltage, 20 mm working distance and a magnification factor of 1000.

2.5. Statistical Analysis

All fermentation analyses were performed in triplicate unless otherwise stated. All were subjected to the independent samples t-test of statistical significance using the IBM SPSS software (IBM SPSS Statistics Ver. 28.0.0.0 (190) using a significance level of 5%.

3. Results

3.1. Production of the CBSY and PBSY Ingredients

The acidification of the PBSY during fermentation is demonstrated in Figure 1A. Autolysis and sterilisation did not significantly affect the pH, with just a minor increase from 5.65 to 5.69 observed during this period (p > 0.05). In contrast, a significant increase (p < 0.05) in the TTA from 0.63 to 0.76% lactic acid was observed. Following inoculation with L. amylovorus FST 2.11, the pH decreased significantly to 4.26 during the first 24 h of fermentation. A further pH decrease to 3.70 was observed after 48 h of fermentation, with a moderate decrease to a pH of 3.60 after 72 h. Significant increases in the TTA were observed throughout the fermentation period, with a final value of 2.80% lactic acid determined after 72 h. In comparison, the CBSY had a significantly higher pH (5.98) and a lower TTA (0.26% lactic acid) than that of the PBSY due to the absence of lactic acid bacteria fermentation.
Following standardisation to a solids content of 40%, approximately 7.86 log CFU/mL of viable yeast cells were present in the PBSY. Viable yeast cells were not detected in the PBSY after autolysis due to cell leakage and subsequent death. After inoculation with 1% L. amylovorus FST 2.11, an initial cell density of 6.72 log CFU/mL was determined (Figure 1B). Cell counts increased to 8.88 log CFU/mL after 24 h fermentation, indicating the suitability of the PBSY as a fermentation substrate. The cell numbers of the FST 2.11 increased further to 9.26 log CFU/mL following 48 h fermentation, after which the cells entered the stationary phase, likely due to nutrient depletion and a build-up of waste metabolites. Viable LAB or yeast cells were not detected in the PBSY following pasteurisation. The initial yeast cell viability of the CBSY prior to pasteurisation was 8.75 log CFU/mL. No viable cells were determined in the CBSY following the pasteurisation process.
The alcohol content of the PBSY increased slightly from 3.81% ABV at the beginning of the fermentation to 4.31% ABV after 72 h, with a corresponding decrease in the extract from 11.26% to 10.65%. In contrast, the alcohol content of the CBSY (8.75% ABV) was more than two-fold higher than that of the standardised PBSY. Similarly, the CBSY extract value of 7.87% was lower than that of the PBSY (10.65%).

3.2. Compositional Analysis

Compositional analysis of the CBSY and the PBSY are shown in Table 1. Overall, the differences as a result of the processing are minimal. The fat values are very low, at 1.4 g/100 g for both the CBSY and PBSY. The dietary fibre content is relatively high, with 49.9 g/100 g in the CBSY and 39.73 g/100 g in the PBSY. The ash content reduced significantly from 5.6 g/100 g to 3.4 g/100 g. Also, the mineral composition indicates a significant decrease in phosphorus, magnesium and sodium, with a very large decrease in the levels of potassium, from 1.60 g/100 g to 0.58 g/100 g. Sugars are present in low levels in the CBSY, with 0.301 g/100 g. This is comprised of 0.166 g/100 g glucose, 0.090 g/100 g fructose and 0.045 g/100 g maltose. In contrast, the PBSY contains 10.048 g/100 g total sugars, comprising of 9.924 g/100 g fructose and 0.124 g/100 g maltose, while the glucose was below the level of quantification. Samples were also analysed for sucrose and lactose, but the results were below the limit of detection for both the CBSY and PBSY.

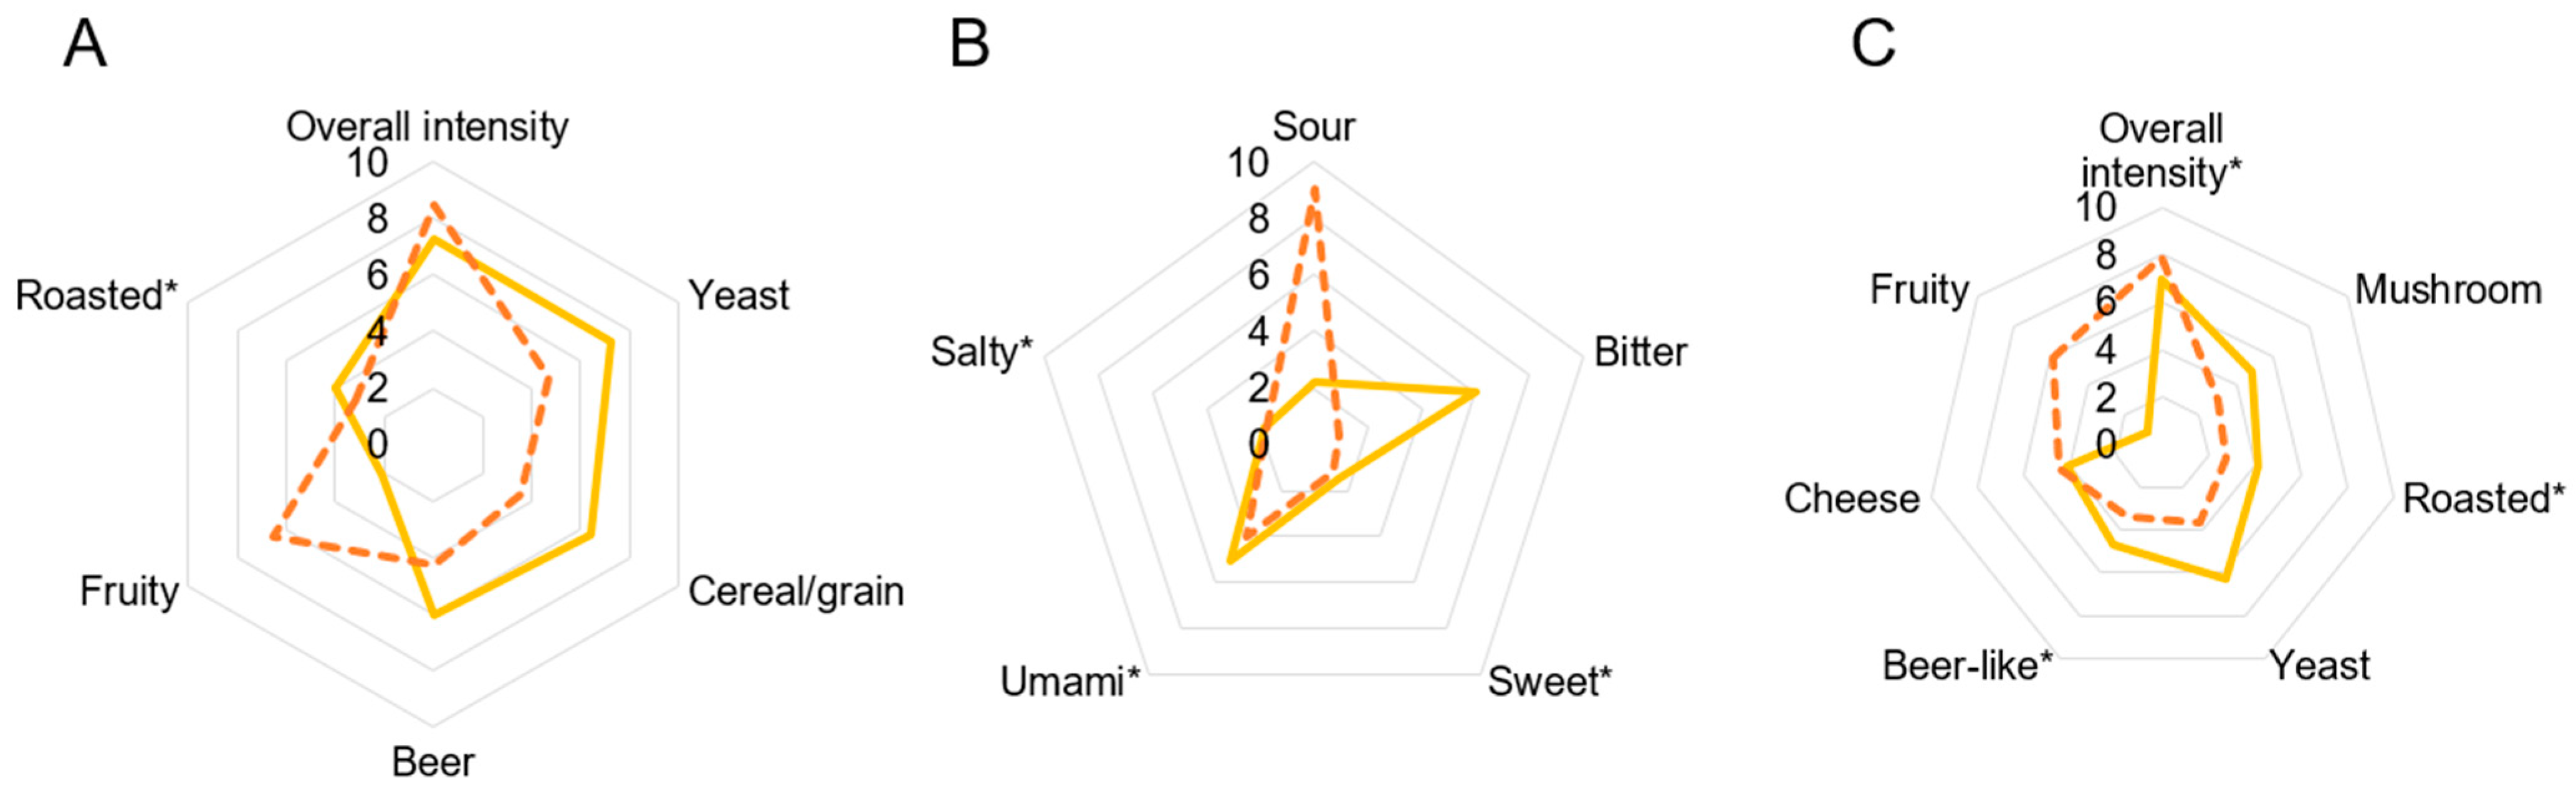
3.3. Sensory Analysis

Sensory analysis by experienced sensory panellists revealed significant differences between the CBSY and PBSY, as shown in Figure 2. There is a marked decrease in the perceivable bitterness. Also, the samples were subjected to analysis for bitterness using international bitterness units (g/L iso-alpha acids), where the CBSY and PBSY contained 129 IBU and 100 IBU, respectively, as can be seen in Table 1. The raw material (prior to pasteurisation) was also analysed and contained 210 IBU.
The sourness and fruitiness perception were significantly increased in the processed ingredient both in aroma and flavour. Lesser differences include a decrease in the beer, grain and yeast aroma. No significant differences were observed in sweet, umami and salty tastes.

3.4. Aroma Compounds

Gas chromatography–olfactory (GC-O) combines gas chromatography technology with the olfactory senses of a trained expert when a sample is analysed to identify chemical compounds, while simultaneously being rated for odour intensity as detected by the expert. The GC-O results for the selected compounds of interest are outlined in Table 2. A total of 64 compounds were detected, but many displayed no differences in intensity between the CBSY and PBSY. Therefore, for clarity, 19 compounds are presented in Table 2.
Firstly, there is an increase in the intensity of acidic and sour compounds, such as lactic acid and acetic acid in the PBSY. Some compounds are significantly detected in both the CBSY and PBSY, including butanoic acid, 2-/3-methyl butanoic acid, isovaleric acid, as well as hexanoic, octanoic and decanoic acid. Several compounds are significantly more detectable in the PBSY, in particular diacetyl (2,3-butandiol). It is very weakly detectable in the control, but is unequivocally detectable in the fermented ingredient. The detection of phenylacetaldehyde is also increased in the PBSY.

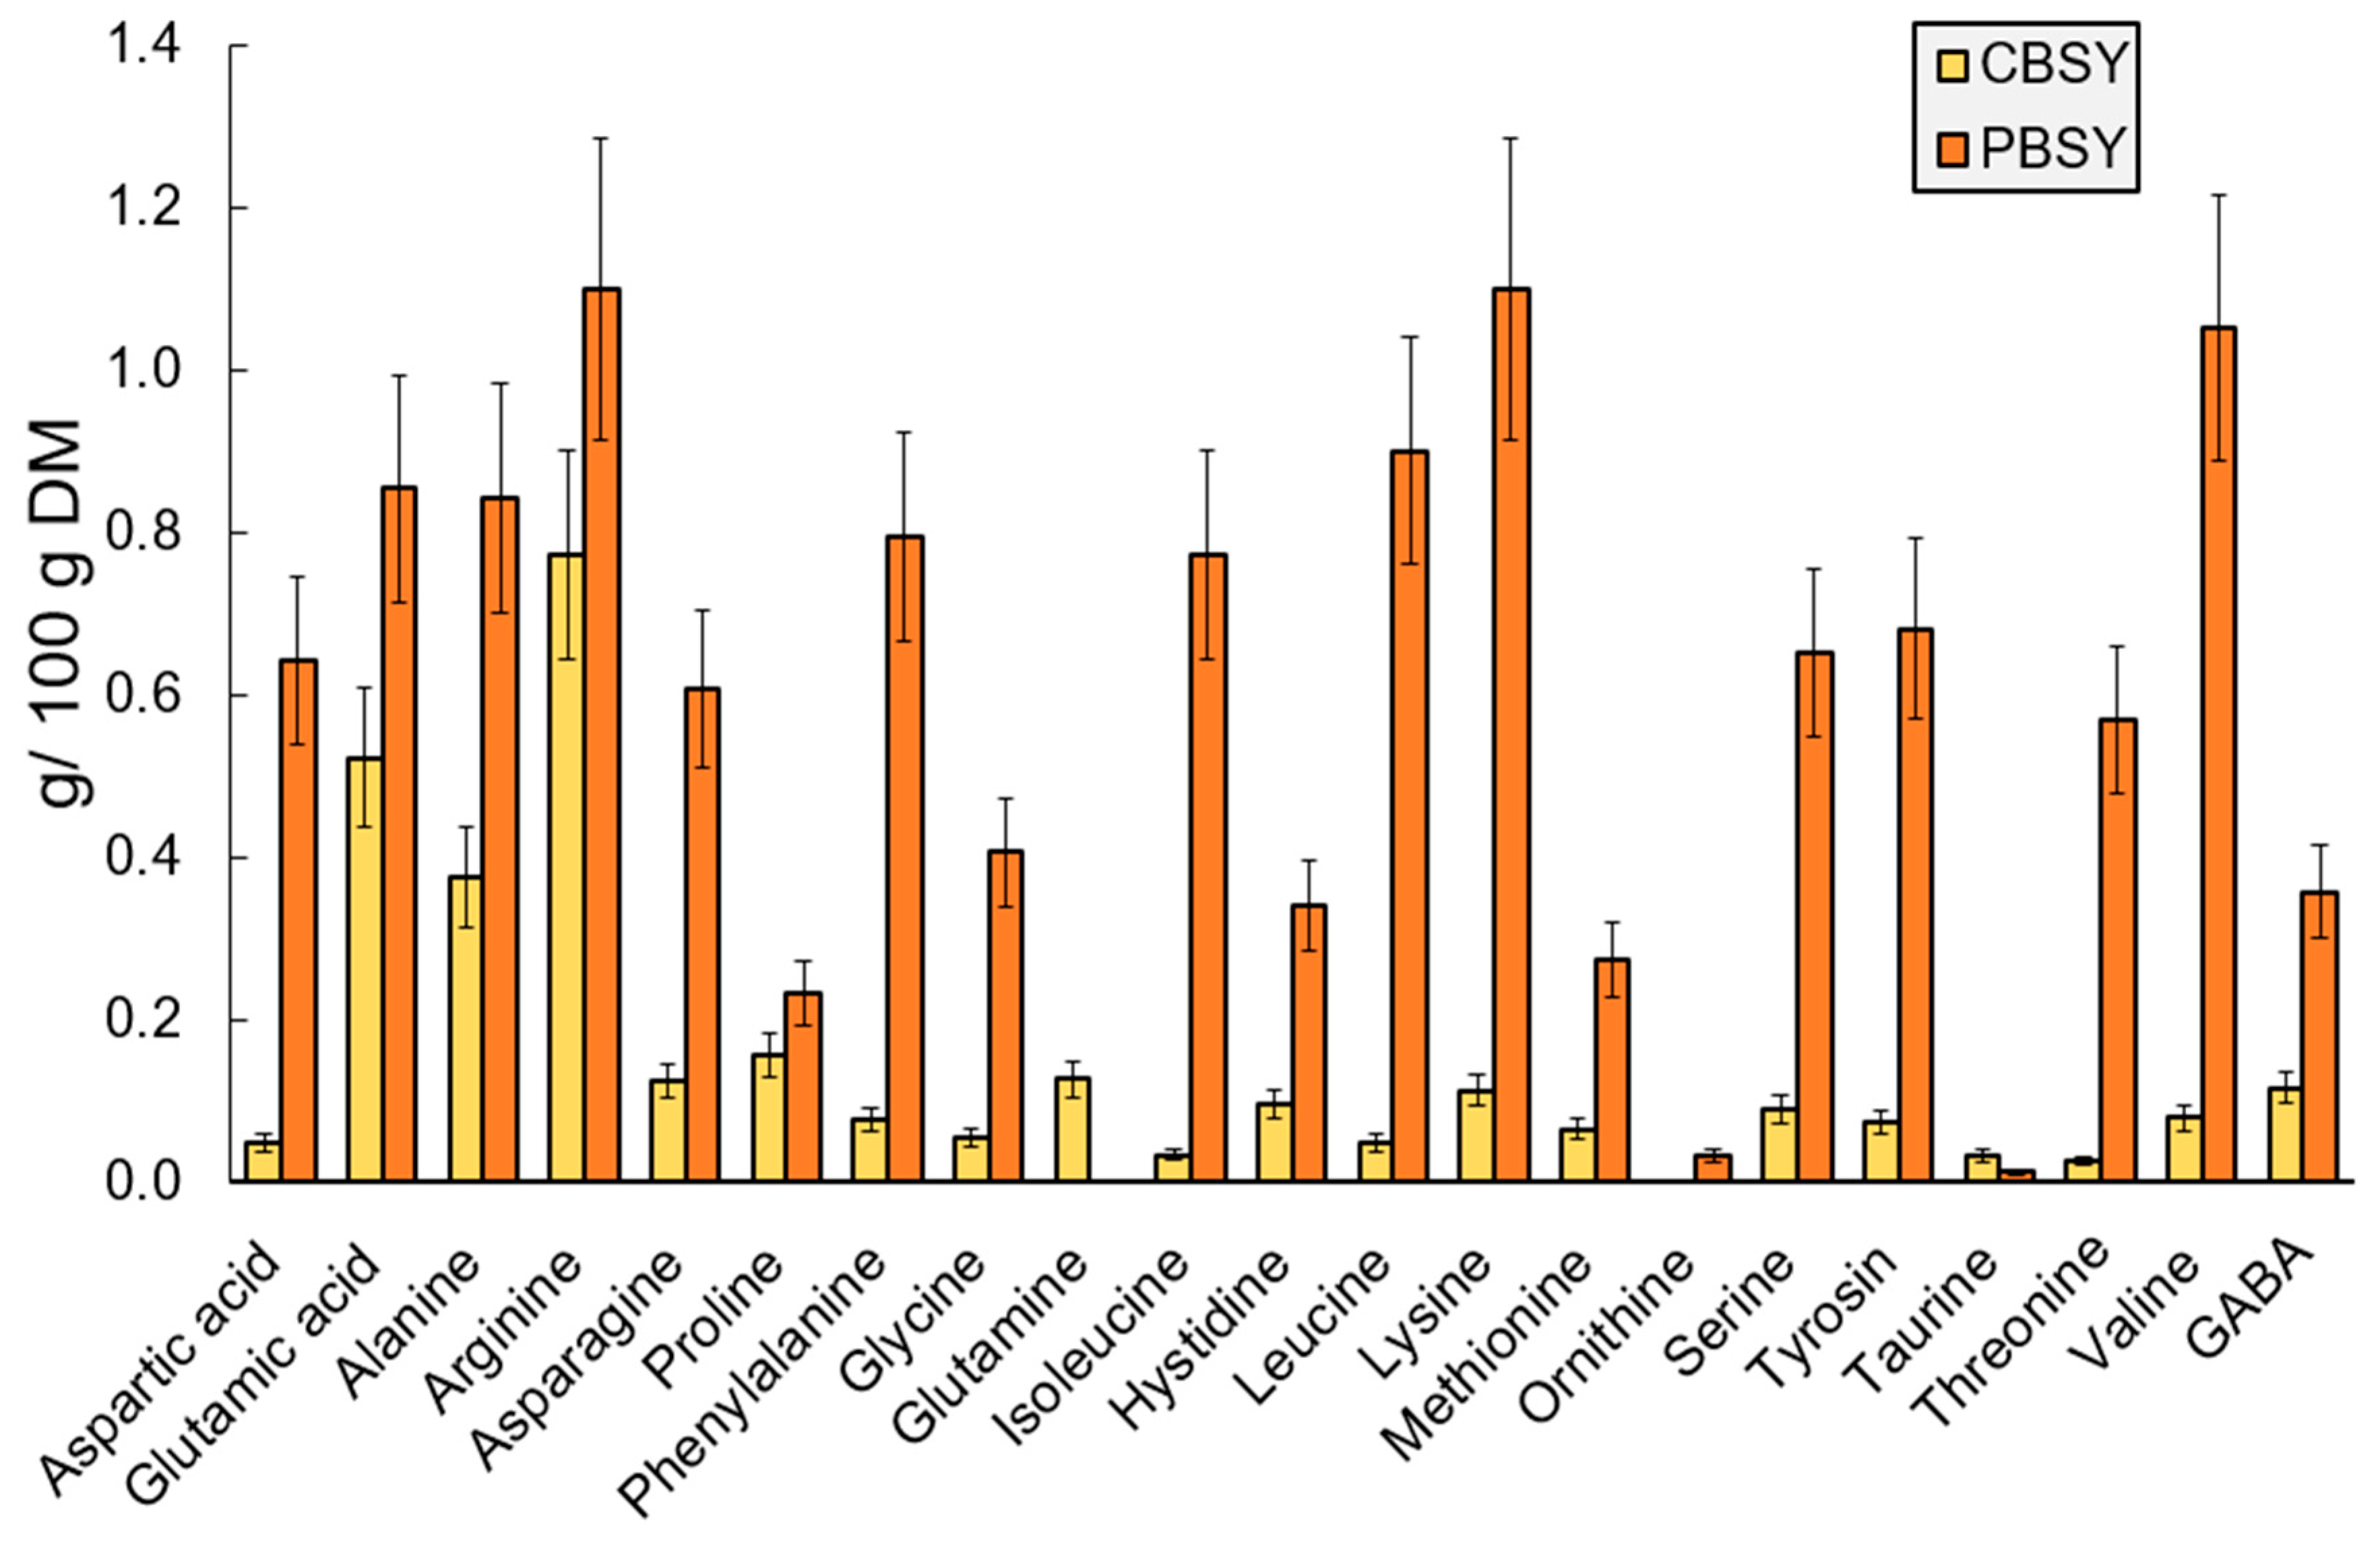
3.5. Free and Total Amino Acid Composition

The free amino acid composition of the BSY samples is represented in Figure 3. The results show a general increase in the levels of free amino acids in the PBSY, with total free amino acids rising from 3.0 g/100 g DM to 12.2 g/100 g DM.
Required daily intakes of the essential amino acids have been advised by the Food and Agriculture Organisation (FAO) [34] and are outlined in Table 3. With regards to the total amino acids, both the CBSY and the PBSY exceed the required intake of essential amino acids per gram of protein. The processed BSY meets the requirements for all essential amino acids as advised by the FAO, with the exception of sulphur-containing amino acids, which are just below the requirement level.

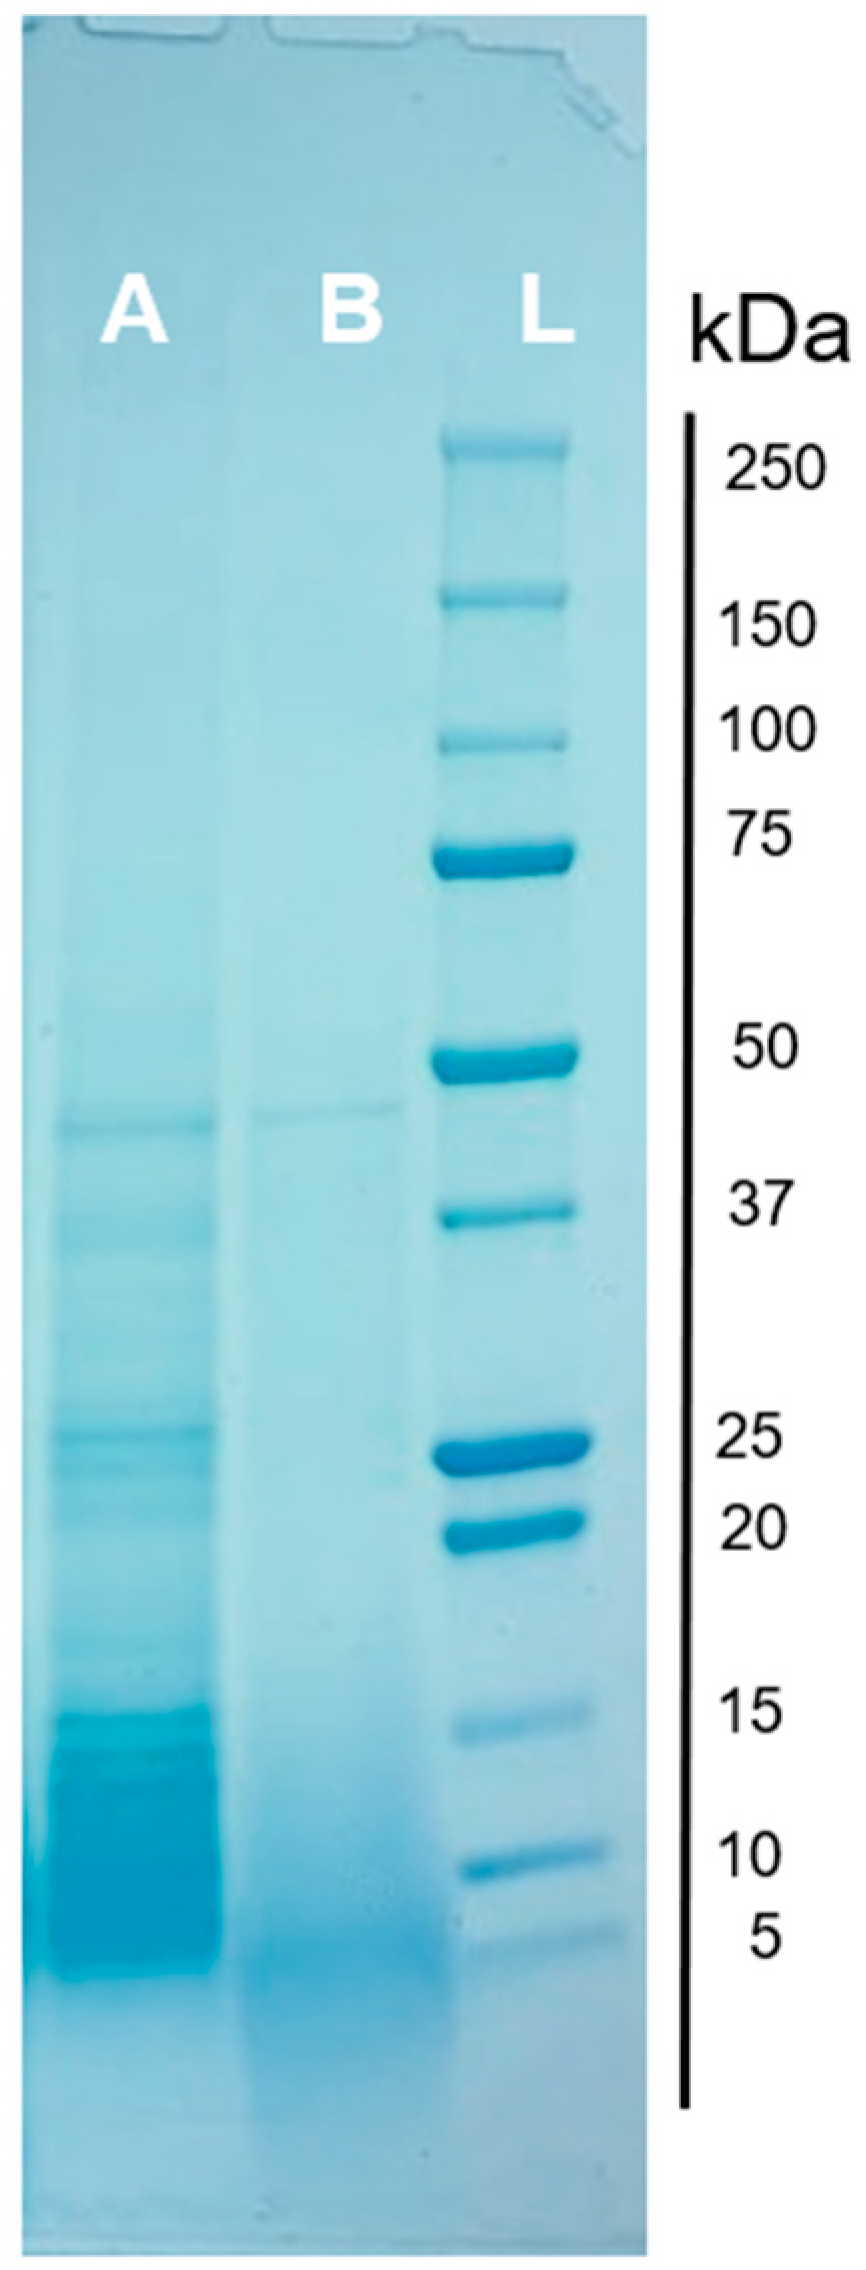
3.6. Protein Profile

The protein profile of the CBSY and PBSY, as analysed using SDS-PAGE, is shown in Figure 4. Many small and defined bands <50 kDa can be observed in the CBSY (A), whereas these bands are absent in the PBSY (B). Only a singular, faint band can be observed in the PBSY at ~45 kDa. In the PBSY, there is a lack of distinct bands, and instead the presence of a gradient, mainly <15 kDa.

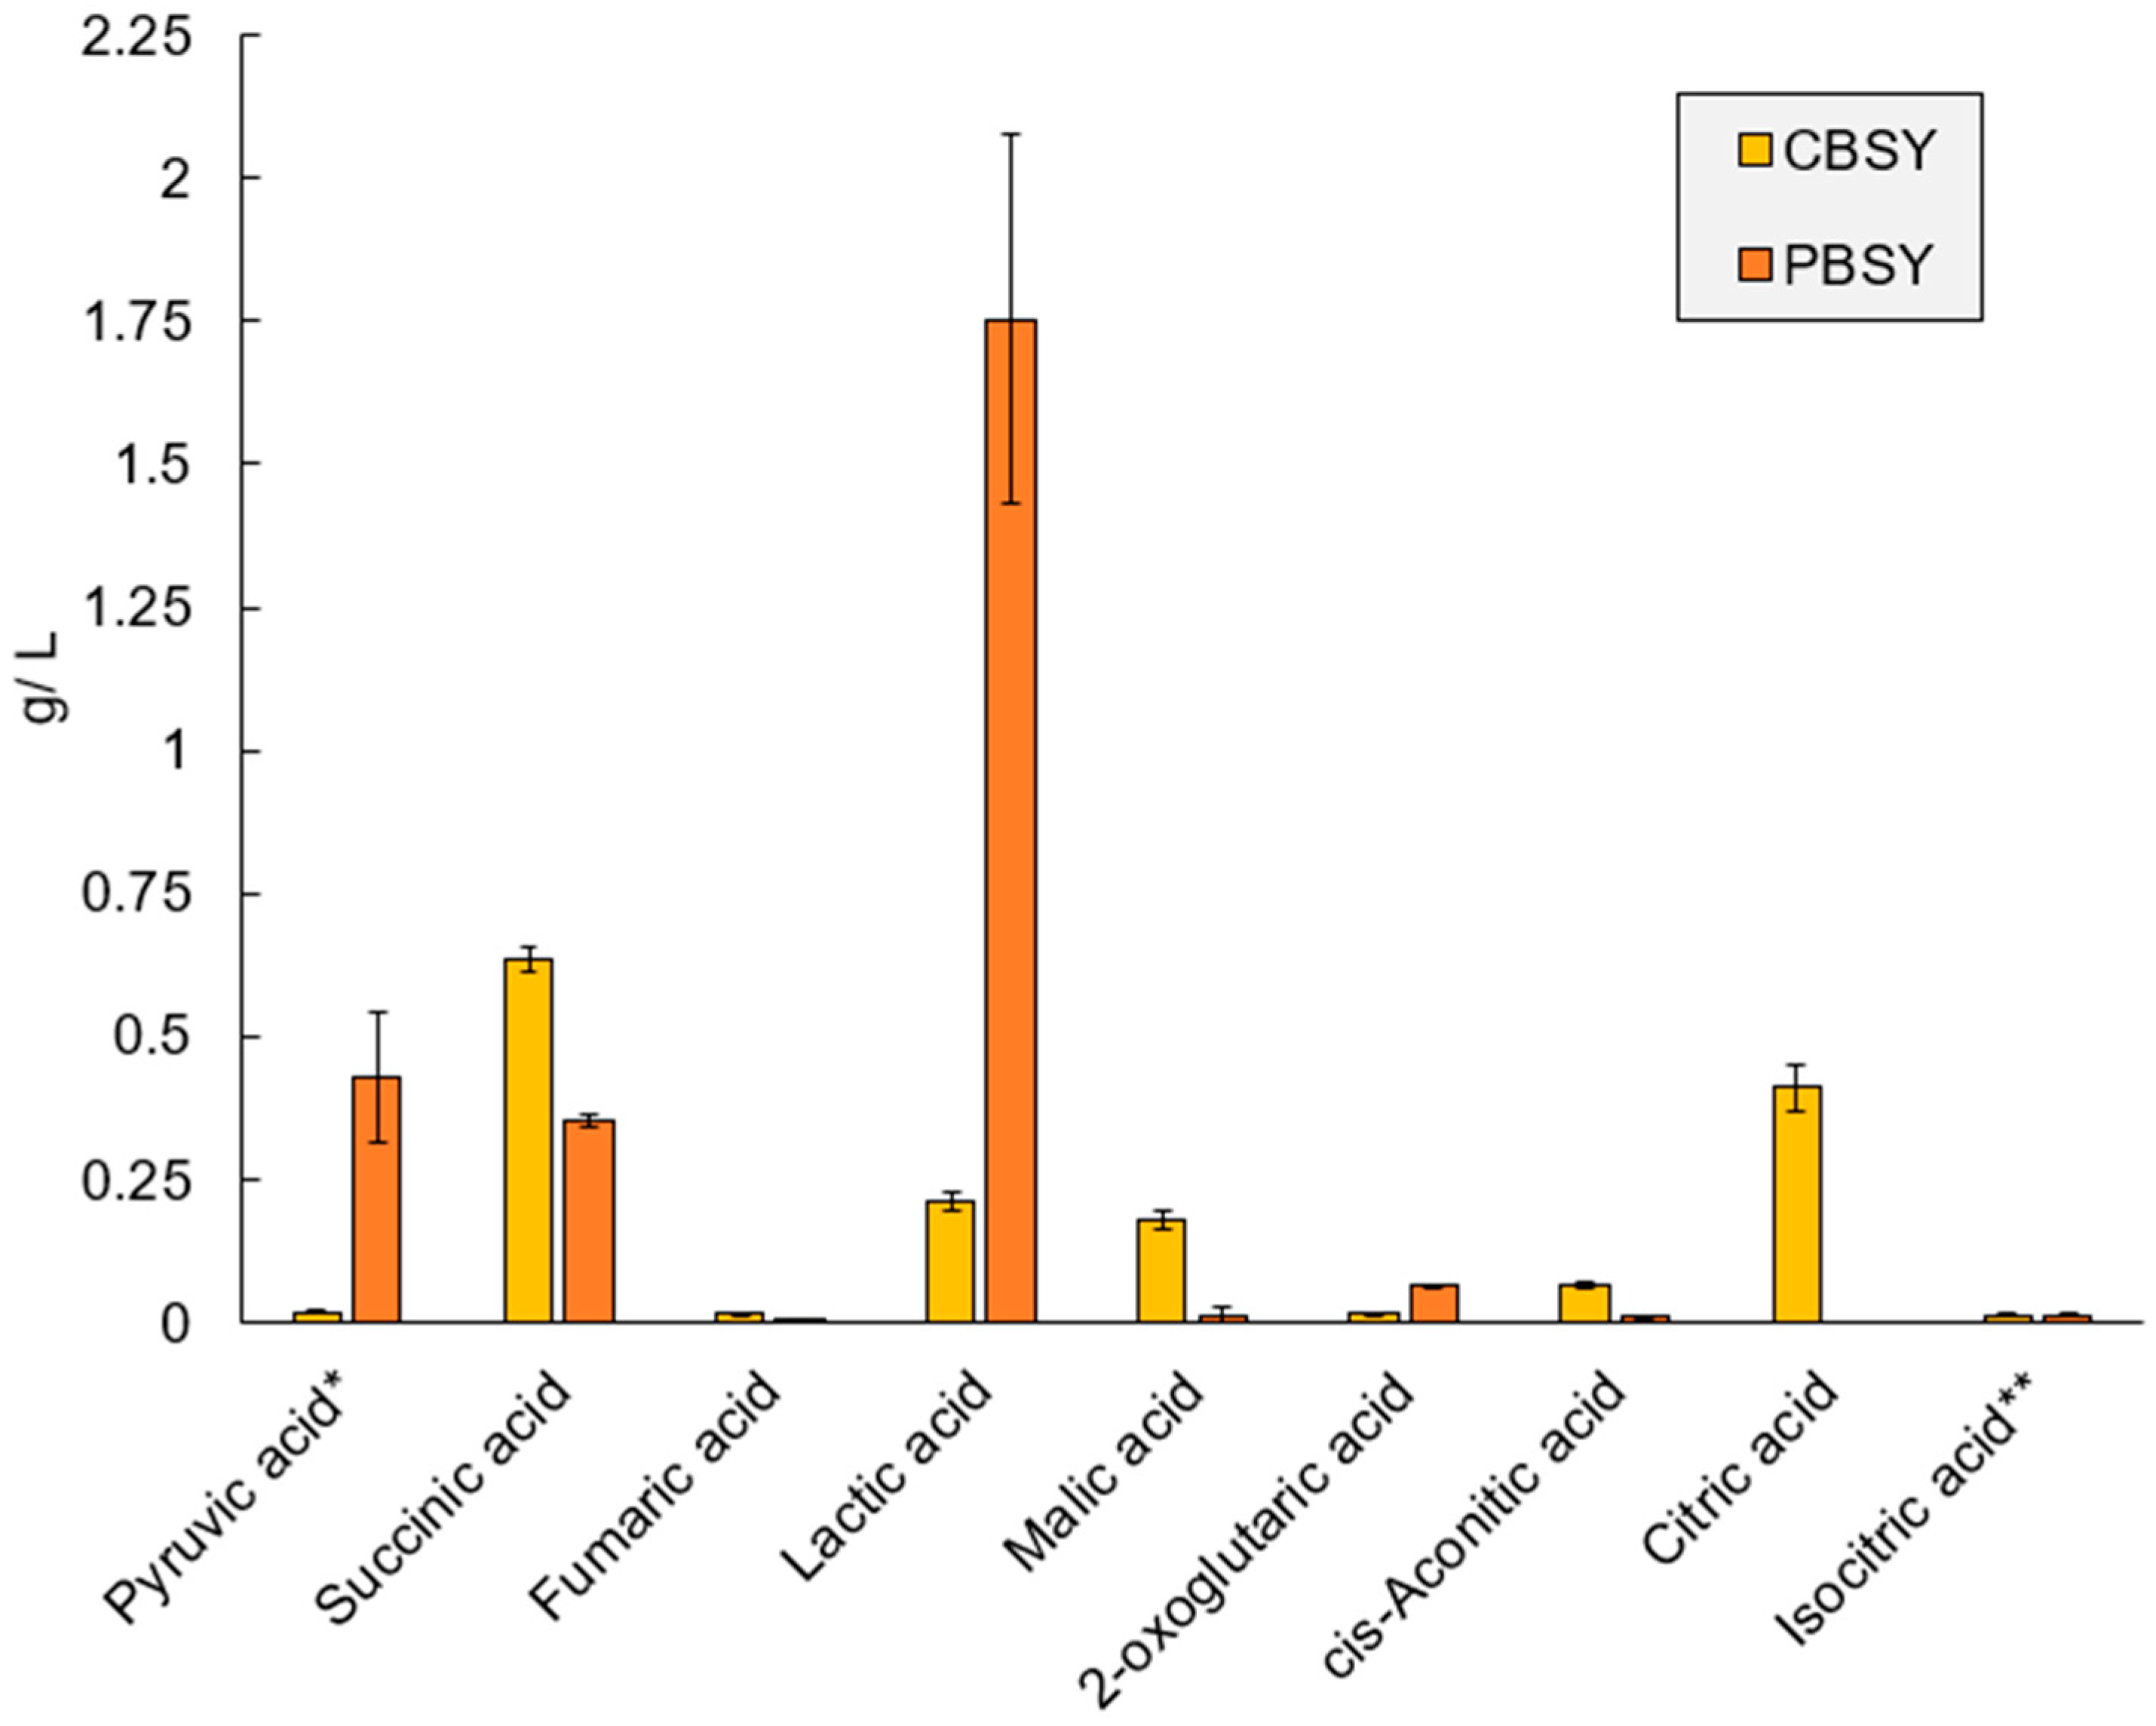
3.7. Metabolomic Analysis

Metabolomic analysis was employed to identify the compounds produced during the processing of the BSY. Detected compounds are presented in Figure 5. Lactic acid was detected in the highest concentration in the PBSY. In the CBSY, succinic acid is present in the highest concentration, followed by citric, lactic and malic acids, respectively. The lactic acid concentration is higher in the PBSY than the CBSY, whereas succinic, malic and citric acids are significantly decreased. Pyruvic acid also significantly increased in concentration, although the value could not be quantified.

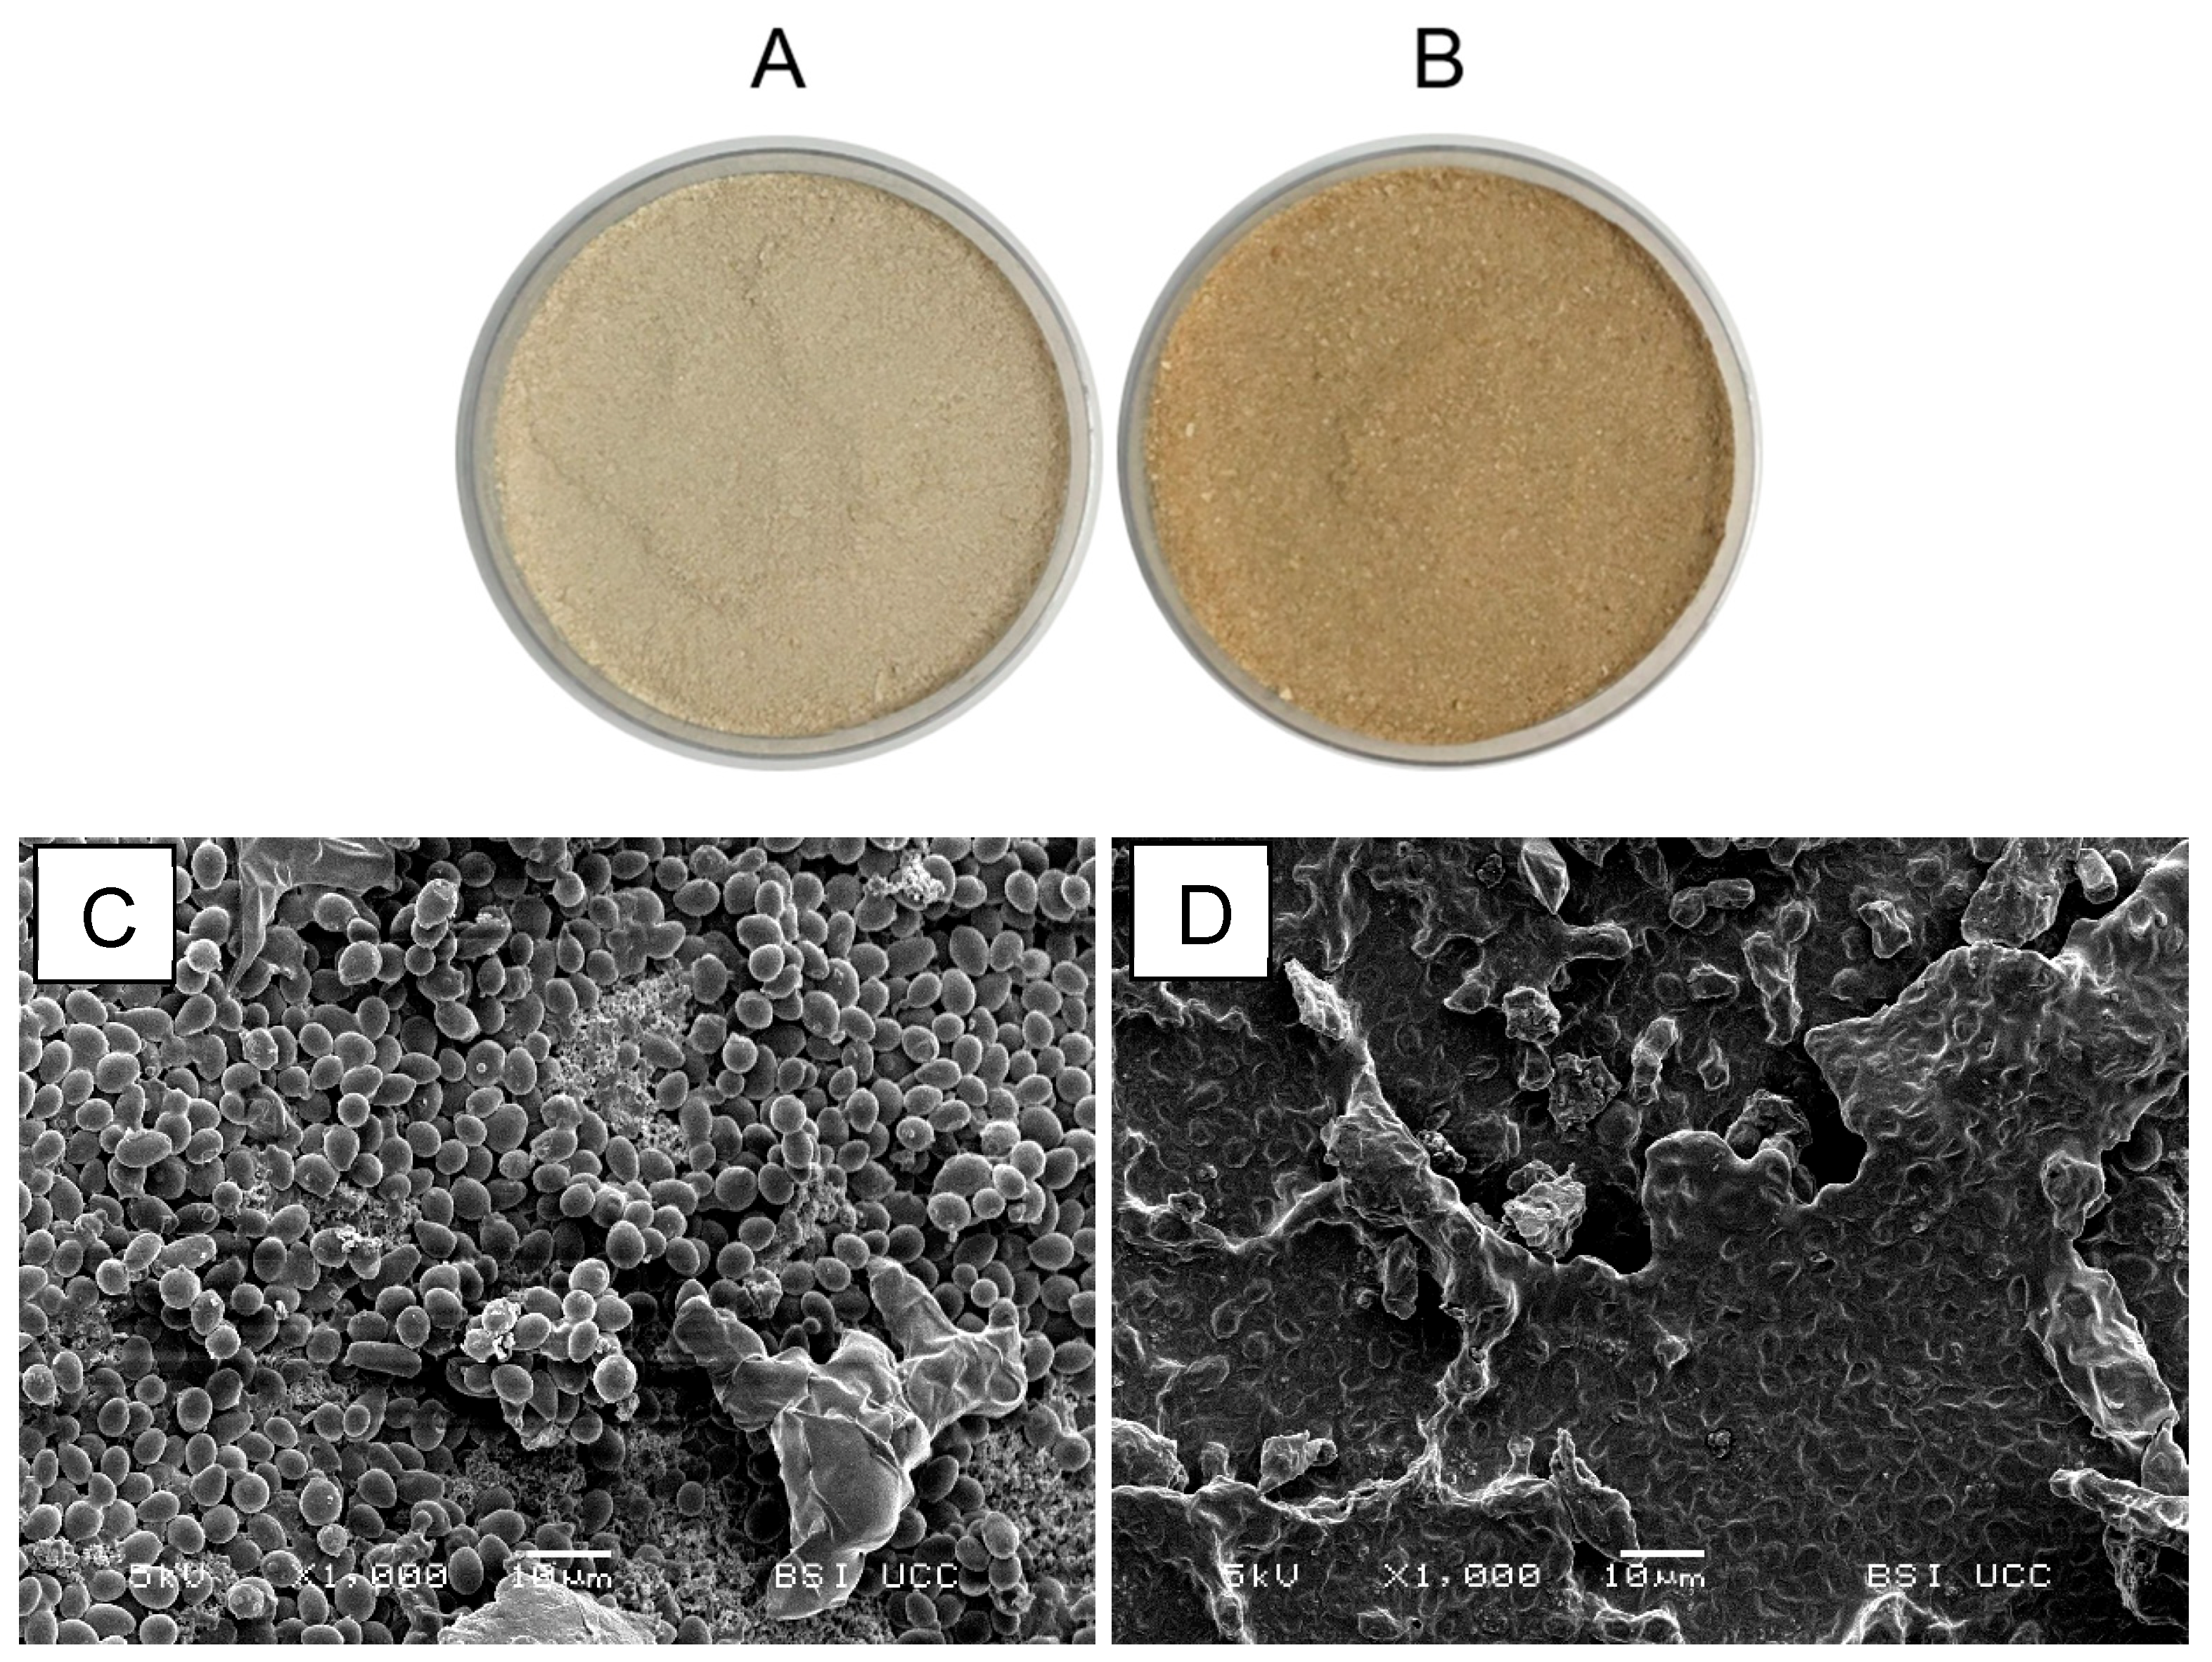
3.8. Appearance and Ultrastructure

The colour of the BSY changed significantly as a result of the processing, as shown in Figure 6. The L-value decreased from 78.6 to 69.7, indicating an overall darkening effect. The a-value increased from 2.4 to 5.1, indicating an increase in the red tone, and the b-value also increased from 14.4 to 18.3, representing a shift towards yellow.
Scanning electron microscopy also shows significant cell breakdown as a result of the BSY processing. The CBSY shows intact yeast cells, while the PBSY is characterised by cells embedded in a ‘film-like’ structure.

4. Discussion

The use of lactic acid bacteria fermentation technology has been shown to improve the sensory, nutritional and functional characteristics of several brewery byproducts, namely, brewer’s spent grain [35] and malt rootlets [20].
Protein comprises of approximately one-third of the spent yeast composition, aligning with the previous literature indicating spent yeast and spent yeast extract as a good source of protein [36,37]. The BSY samples also have a high insoluble fibre content, presumably consisting of mainly β-glucan. In general, yeast material is known to contain significant levels of β-glucans, which constitutes the majority of fibre in yeasts, mushrooms and many grains [38]. β-glucan derived from single-cell sources has also been widely reported to induce positive health effects, including immunomodulation and anti-inflammatory effects [39,40,41]. In light of a high prevalence of dietary fibre deficiency in the Western world [42], as well as the health benefits of dietary fibre [43,44], the high content of β-glucan in the PBSY indicates that it may be a valuable ingredient for added fibre in food applications. It can also be observed that the ash content is reduced in the PBSY. This may primarily be attributed to the fermentation process, where minerals would be consumed by L. amylovorus FST 2.11 to sustain the growth and metabolism, leading to a reduced ash content in the fermented samples. In particular, potassium has been identified as being required by many LAB to sustain growth [45].
There are minimal sugars detected in the CBSY and PSBY, with the exception of fructose in the PBSY. This increase in fructose is most likely due to the degradation of the sucrose, added prior to fermentation, into glucose and fructose by yeast invertase [46]. After this, glucose was preferentially consumed by L. amylovorus; however, some fructose may also have been consumed. Although FST 2.11 has been shown to favour maltose over either glucose or fructose [16], the small increase in maltose in the PBSY may be due to the amylolytic nature of L. amylovorus FST 2.11 and the presence of yeast phytoglycogen or residual starch [15,16].
One of the major factors preventing the widespread use of BSY in food products is its intense bitter taste. This is due to the adsorption of humulones and isohumulones from hops (i.e., isoalpha acids) to the surface of the yeast cells [10]. This is reflected in the high intensity value assigned to the bitterness characteristic of the CBSY by the sensory panellists, as seen in Figure 2. In contrast to this, the bitterness in the PBSY is rated at a very low level, indicating that processing is greatly reducing the perceived bitterness. This could be due to the removal or degradation of the α-acids, or the production of other compounds that disguise the bitter taste. The decrease in the IBU in the CBSY and PBSY is likely due to isoalpha acid degradation during the heat treatment (i.e., pasteurisation, autolysis, sterilisation), as isoalpha acids have been shown to degrade under thermal treatment and at a low pH [47]. It is possible that small amounts of iso-α-acids are discarded along with the supernatant during the applied standardisation process; however, due to the adhesion of the iso-α-acids onto the surface of the yeast cells, it is likely that only minimal amounts are removed. Although the bitterness units are reduced in the processed product, it is more likely that the drastic reduction in the perceived bitterness is due to the production of other strongly flavoured compounds, enhancing the sour and fruity characteristics. These may play a role in masking the unpleasant bitter taste, such as lactic acid, diacetyl and phenylacetaldehyde, which are all detected in increased quantities in the PBSY.
The second major sensory difference detected was an increase in sourness. This is likely a result of the lactic acid fermentation, where lactic acid is the primary product of the homofermentative bacterial strain Lactobacillus amylovorus FST 2.11. In addition, the increase in the fruity aroma and flavour is likely due to the production of highly aromatic compounds such as phenylacetaldehyde during lactic acid fermentation. Yeast-like, grain-like and roasted characteristics are reduced in the PBSY due to the reduction in compounds, such as 2-acetyl-1-pyroline, 2-ethyl-3,5/6-dimethylpyrazine, 2-acetylpyrazine and 2-acetyl-2-thiazoline, responsible for roasted, earthy and grain-like aromas or flavours, as detected via GC-O.
Regarding the GC-O data, the presence of lactic and acetic acids in the PBSY is largely due to fermentation with lactic acid bacteria. However, the presence of acetic acid in the control sample could potentially be due to acid presence in the malt or wort, but is most likely due to acid production during initial yeast fermentation during the brewing process [48]. Butanoic acid is also detected significantly in both the CBSY and PBSY, potentially adding to the acid flavour perceived in the final products. In addition, 2-/3-methyl butanoic acid, or isovaleric acid, is a fatty acid that is highly detectable in both of the samples, contributing to the cheesy, fruity and sour flavours, as well as hexanoic, octanoic and decanoic acids. Given that these compounds are present in similar concentrations in both the CBSY and the PBSY, they are potentially a result of the brewing process, particularly the yeast fermentation. Volatile fatty acids such as these are likely contributing greatly towards the overall sensory profiles of the CBSY and PBSY.
Several compounds are significantly more detectable in the PBSY. Diacetyl (2,3-butandiol) is a buttery-flavoured compound and is a degradation product of many food components, including carbohydrates, fatty acids and proteins [49]. It is very weakly detectable in the control, but is unequivocally detectable in the PBSY. This may be a result of the citrate metabolism by Lactobacillus amylovorus, where citrate is transformed into diacetyl and 2,3-butanediol, as well as several other compounds [50]. Phenylacetaldehyde is also increased in the PBSY, potentially contributing to the increase in sweet, fruity and floral aromas, which is in line with results from the sensory panellists. Other compounds that could be contributing to these sweet, fruity and floral flavours and aromas are detected in high amounts in both ingredients, including ethyl-3-methylbutanote, furaneol, 4-methylphenol, sotolon, phenylacetic acid, vanillin and phenyl propionic acid [51].
Compounds such as 2-ethyl-3,5/6 dimethyl pyrazine and 2-acetyl-2-thiazoline are significantly decreased in the PBSY. Associated with an intense roasted aroma and popcorn-like aroma, 2-acetyl-2-thiazoline is typically a product of the Maillard reaction, and has also been found to be produced during yeast fermentation [52]. Moreover, 2-ethyl-3,5/6 dimethyl pyrazine is another typical product of the Maillard reaction, due to the pyrolysis of serine and threonine, and can also be produced by certain Bacillus species [53]. It has an earthy and burnt aroma which is strongly detected, along with 2-acetyl-2-thiazoline, in the CBSY, but not detected in the PBSY. This could be due to removal with the supernatant during the centrifugation step, or due to degradation during autolysis or fermentation. Methional is extremely detectable in both the CBSY and the PBSY. This compound is a degradation product of methionine, thermally induced during the Maillard reaction process [54], and has a potato-like or vegetable-like aroma. An enhancement of desirable characteristics is displayed and can be correlated with results from the sensory panel and the metabolic analysis, particularly in the case of sourness and fruitiness.
The is also a significant increase in the free amino acids detected in the PBSY. This effect can be attributed to protein and peptide degradation in the BSY during processing, as can be seen via the higher molecular weight band degradation in Figure 4. This may be due to a combination of yeast autolysis and the activity of proteases/peptidases produced by Lactobacillus amylovorus during fermentation [16]. Protein degradation is an important step in the brewing process, prior to fermentation, to allow for sufficient free amino nitrogen (free amino acids, ammonia and small peptides) to support yeast growth [55]. Literature regarding the free amino acid profile in yeast and spent yeast is sparse, likely due to the high variability based on strain and processing parameters. However, free amino acid values for alanine, lysine and valine are comparable to those determined in baker’s yeast [56]. A study by Jacob et al. examines the free amino acid composition of yeast extracts produced from spent yeast and shows a higher level of free amino acids (~20–30 g/100 g DM) than the CBSY and PBSY, although these are not entirely comparable, as the CBSY and PBSY are whole-yeast materials [57].
Autolysis is a natural cell degradation process, defined as the breakdown of cell constituents by endogenous enzymes [58]. Yeast autolysis has been shown to increase the yield of free amino acids and small peptides, as well as increase the digestibility [58,59]. The 90 °C heat treatment to sterilise the BSY after autolysis may have also contributed to this effect, as hydrothermal degradation has also been shown to induce increased amino acid yield in yeast [60]. In addition, fermentation by LAB can increase the concentration of amino acids in cereal and dairy substrates [61,62,63,64]. Proteolysis by Lactobacillus species is well documented, with amino acid production being necessary for LAB growth; however, proteolytic systems differ between species [64,65].
Free amino acids can have a major impact on the flavour profile, with certain peptides and amino acids being responsible for sweet, bitter, sour, kokumi and umami tastes [66,67,68]. Some amino acids are classed as bitter, which is due to the hydrophobicity of certain amino acid side chains. The bitterness of peptides is determined by structural characteristics, such as the proportion of these hydrophobic residues present, as well as the acetylation and esterification of the amino acid or carboxy groups [67]. The ability of these compounds to elicit taste sensation lies in their ability to bind to highly specific taste receptors on the human tongue. Free amino acid determination in both of the ingredients shows a significant increase in free amino acids, including bitter, sweet and sour amino acids. This indicates an increase in taste intensity, as was perceived by sensory analysis. Glutamic acid is present in relatively high amounts in both the CBSY and PBSY, at 0.49 g/100 g and 0.73 g/100 g, respectively, but more so in the processed product. The salts of glutamine, i.e., glutamates, impart an umami flavour, commonly found in yeasts and yeast extracts. While an increase in bitter free amino acids, such as valine, arginine, isoleucine and phenylalanine, is apparent, the bitterness perception is greatly reduced in the PBSY, with the intensity score from the sensory panel falling from 6 to 0.89.
Glutamine, a derivative of glutamic acid, is decreased in the PBSY. This may be due to glutamine being metabolised by LAB, playing a greater role in pH homeostasis and stationary-phase survival [69]. Glutamine has been shown to increase acid resistance in Lactobacillus reuteri via glutamine deamidation, at a pH of 2.5, to a level comparable to acid resistance created via glutamine decarboxylation [70].
GABA, or γ-aminobutyric acid, is a nonproteinaceous amino acid present in both the CBSY and PBSY, with levels of 0.109 g/100 g and 0.305 g/100 g, respectively. This trend is also observed in the metabolomics data, although the values were not able to be quantified (data not shown). GABA acts as one of the major inhibitory neurotransmitters and has potentially been linked to improvements in human health with regards to neurological conditions, improved mood and reduced blood pressure, among other effects [71,72]. GABA is produced from glutamate in a wide variety of microorganisms via glutamate decarboxylase [73]. Lactic acid bacteria, in particular Lactobacillus species, are particularly prevalent GABA producers during food fermentations [71]; therefore, it may be hypothesised that L. amylovorus FST 2.11 is likely also a GABA producer, accounting for the increased level of the compound in the processed product. Saccharomyces yeasts have also been shown to be GABA producers [74], explaining the presence of GABA in the untreated material. The levels of GABA needed to induce positive effects are as follows: 100–300 mg per day for improved sleep, 20–100 mg per day for stress-reduction benefits and 0.3–300 mg per day for reducing blood pressure [71,72].
Some amino acids are classed as essential, and therefore must be taken in through the diet to maintain human health. Required daily intakes of the essential amino acids per gram of protein have been advised by the FAO and are outlined in Table 3 [34]. The processed BSY provides a high proportion of the essential amino acids, meeting the requirements for all essential amino acids, with the exception methionine, which is just below the requirement level. Although, as with the free amino acids, the literature regarding the total amino acid content of brewer’s spent yeast products is very limited. A study by Vieira et al. (2016) examined the amino acid profile of brewer’s spent yeast extract and showed a slightly higher level of total amino acids than CBSY or PBSY [37]. This could be due to the fact that CBSY and PBSY are whole-cell materials, whereas the yeast extracts are only a fraction of the total cell contents, with cell wall debris generally being removed by centrifugation.
Digestion studies on BSY, particularly with regards to protein and the application of a fermentation process, are sparse. However, the presence of an increased level of free amino acids in the processed product suggests a potentially improved nutritional quality, as free amino acids have been shown to be absorbed more quickly than intact proteins, leading to more rapid nutrient availability [75,76]. This indicates that the free amino acids in the processed BSY may improve the protein quality of the ingredient when compared to the control BSY.
Regarding the metabolomic analysis, lactic acid is the most abundant metabolite present in the PBSY, as could be seen in the GC-O and sensory panel data. In LAB, lactic acid is produced from pyruvic acid during a reoxidation reaction catalysed by lactate dehydrogenase (LDH). This process results in the formation of renewed NAD+, required for the continuation of glycolysis [50]. Pyruvate can also be produced via citrate metabolism, which has been previously shown to occur in some L. amylovorus strains [77]. The citrate metabolism is an alternative to the glucose metabolism, where citrate can be used as an alternate carbon source to provide energy for the bacteria. Citrate is broken down via oxaloacetate to pyruvate, a reaction catalysed by citrate lyase and oxaloacetate decarboxylase, respectively. Sugar and citrate cometabolism can lead to an excess of pyruvate, where acidic conditions reduce or potentially inactivate pyruvate-converting enzymes, allowing pyruvate to accumulate [50]. The citrate metabolism is also known for producing a variety of aromatic compounds, such as diacetyl, acetoin and 2,3-butandiol. The increased presence of these compounds in the PBSY, the excess of pyruvate and the reduction in the citrate levels between the CBSY and PBSY is an indicator of the citrate metabolism potentially taking place within the fermentation by L. amylovorus FST 2.11.
Just over 1 g/L succinic acid is present in the CBSY, whereas ~0.6 g/L is detected after processing. The succinic acid present in the CBSY is likely a result of Saccharomyces fermentation via the reductive TCA pathway, or potentially an incomplete oxidative TCA cycle [78]. The reduction in succinate after processing could be due to supernatant removal during the processing of the BSY, or consumption in the oxidative TCA pathway during bacterial fermentation. Succinate can also be produced during LAB fermentation, potentially explaining how succinic acid is not completely depleted in the PBSY. This may be occurring as a result of reductive oxidation or reversed TCA cycle reactions [79]. Succinic acid production is more efficient through this reductive (anaerobic) pathway than through the oxidative (or aerobic) pathway, with 2 mole succinate being produced from 1 mole glucose [80]. However, since BSY fermentation was not performed under strict anaerobic conditions, this may not have occurred.
A significant increase in 2-oxoglutaric acid (α-ketoglutaric acid) is also apparent in the PBSY. This may be due to the presence of an incomplete TCA cycle, as is common in LAB [79]. An absence of α-ketoglutarate dehydrogenase may be halting the TCA cycle at this point, allowing the accumulation of this intermediate compound. Malic acid is decreased in the processed BSY, leading to the conclusion that the malate present in the control from the initial Saccharomyces fermentation is either consumed metabolically during the bacterial fermentation or discarded in the supernatant during the prefermentation centrifugation and resuspension step. Lactobacillus species have been shown to metabolise malate to lactate via a cytoplasmic malolactic enzyme, although this is highly strain-dependent [81]. An increased understanding of these pathways occurring in L. amylovorus FST 2.11 and their effects on taste and aroma may lead to the ability to manipulate the degree to which each metabolite is produced. For example, by the addition of precursors to desired compounds and changes in the pH and temperature, the production of desirable metabolites could be encouraged.
The physical appearance of BSY is also altered as a result of processing. The colour change indicates the presence of the Maillard reaction, as also suggested by the presence of certain compounds, such as methional, furaneol and 2-ethyl-3,5/6-dimethyl pyrazine. A study by Alim et al. (2018) examined the formation of flavour-active compounds in yeast extracts as a result of the Maillard reaction [54]. Similar to the BSY, the yeast extract was rich in nonvolatile flavour precursors, such as amino acids, nucleotides and peptides, which then formed volatile flavour and aroma compounds as a result of a heating process. Analysis of the flavour-active compounds of the yeast extract showed similar compounds to those found in the CBSY and PBSY, including 2,3-butanedione, methional, dimethyl trisulfide and a variety of pyrazines and alcohols [54].
The SEM images clearly show stark differences between the CBSY and PBSY. The CBSY is characterised by clearly visible individual yeast cells, with a diameter of approximately 5–8 µm, as has been previously reported [82]. In the PBSY, the cells are clearly degraded, and the outlines of ‘empty’ cells are visible in the homogenous mass. These micrographs clearly show the extreme physical changes induced in the BSY during processing. This is due to enzymatic degradation via endogenous enzymes, as well as thermal degradation (i.e., autolysis). A study by Martínez-Rodríguez et al. (2001) observed the structural changes that occur in Saccharomyces during autolysis [83]. Similar to the PBSY, after 24 h of autolysis, the Saccharomyces cells were smaller, had more visible surface folds and the cells appeared ‘empty’ [83]. These physical changes likely impact the functional characteristics of the BSY, although further research is required in this area.

5. Conclusions

Brewer’s spent yeast is a plentiful side-stream of the brewing process. While nutritionally valuable, its undesirable sensory characteristics limit its use in human nutrition. However, this study displays the potential for the positive modification of BSY via minimal processing, namely, autolysis (i.e., thermal degradation) and lactic acid fermentation. This process succeeded in drastically reducing the perceived bitterness, as well as increasing sour and fruity characteristics. The applied process induced major changes in taste and aroma due to the removal or production of volatile compounds and peptide degradation. Extensive protein degradation is evident as a result of the processing and potentially impacts the nutritional value in addition to the flavour profile. An increase in free amino acids, as well as compounds such as GABA, indicate improved nutritional properties. Major physical changes in the cells are also observed through SEM. This study shows the impact of LAB fermentation on the taste and structure of the BSY. The drastic reduction in the bitterness is an important step in the incorporation of BSY in foods for use in human nutrition. The upcycling of an otherwise low-value waste product into a highly nutritious ingredient for use in protein and fibre fortification supports the concept of responsible production and consumption, as well as the development of an increasingly circular food system.

Author Contributions

Conceptualisation, E.K.A. and A.W.S.; investigation, A.J. and L.N.; resources, E.K.A.; original draft preparation, A.J. and L.N.; data interpretation, A.J. and L.N.; review and editing A.W.S., L.N., E.Z. and E.K.A.; supervision, E.K.A. and A.W.S.; funding acquisition, E.Z. All authors have read and agreed to the published version of the manuscript.

Funding

This project has received funding from the European Union’s Horizon 2020 research and innovation programme under grant agreement no. 818368, MASTER project. This manuscript reflects only the authors’ views, and the European Commission is not responsible for any use that may be made of the information it contains.

Institutional Review Board Statement

The study was conducted in accordance with the Declaration of Helsinki, and approved by the Social Research and Ethics Committee of University College Cork (Application 2023-129, Approved on 28.07.23).

Informed Consent Statement

Informed consent was obtained from all subjects involved in the study. Written informed consent has been obtained from the participant(s) to publish this paper.

Data Availability Statement

Data available on request.

Acknowledgments

The authors wish to thank Thomas Monin and Patrick O’Riordan for their support and helpful discussions. The authors would also like to thank Jonas Atzler for his help with the SEM, Theresa Boeck for her invaluable support with the SDS-PAGE, Celia Segura Godoy for her expertise in fibre analysis and Tom Hannon for technical support.

Conflicts of Interest

The authors declare no conflicts of interest.

References

  1. Kordialik-Bogacka, E.; Diowksz, A. Physiological State of Reused Brewing Yeast. Czech J. Food Sci. 2013, 31, 264–269. [Google Scholar] [CrossRef]
  2. Ferreira, I.M.P.L.V.O.; Pinho, O.; Vieira, E.; Tavarela, J.G. Brewer ’s Saccharomyces Yeast Biomass: Characteristics and Potential Applications. Trends Food Sci. Technol. 2010, 21, 77–84. [Google Scholar] [CrossRef]
  3. Kunze, W. Technology Brewing and Malting, 2nd ed.; VLB Berlin: Berlin, Germany, 1999. [Google Scholar]
  4. Jaeger, A.; Arendt, E.K.; Zannini, E.; Sahin, A.W. Brewer’s Spent Yeast (BSY), an Underutilized Brewing By-Product. Fermentation 2020, 6, 123. [Google Scholar] [CrossRef]
  5. Harlow, B.E.; Bryant, R.W.; Cohen, S.D.; O’Connell, S.P.; Flythe, M.D. Degradation of Spent Craft Brewer’s Yeast by Caprine Rumen Hyper Ammonia-Producing Bacteria. Lett. Appl. Microbiol. 2016, 63, 307–312. [Google Scholar] [CrossRef] [PubMed]
  6. Oliveira, R.L.; Oliveira, R.J.F.; Bezerra, L.R.; Nascimento, T.V.C.; de Pellegrini, C.B.; de Freitas Neto, M.D.; do Nascimento, N.G.; de Souza, W.F. Substitution of Corn Meal with Dry Brewer’s Yeast in the Diet of Sheep. Rev. Colomb. Ciencias Pecu. 2016, 29, 99–107. [Google Scholar] [CrossRef]
  7. Estévez, A.; Padrell, L.; Iñarra, B.; Orive, M.; Martin, D.S. Brewery By-Products (Yeast and Spent Grain) as Protein Sources in Gilthead Seabream (Sparus Aurata) Feeds. Aquaculture 2021, 543, 736921. [Google Scholar] [CrossRef]
  8. San Martin, D.; Orive, M.; Iñarra, B.; Castelo, J.; Estévez, A.; Nazzaro, J.; Iloro, I.; Elortza, F.; Zufía, J. Brewers’ Spent Yeast and Grain Protein Hydrolysates as Second-Generation Feedstuff for Aquaculture Feed. Waste Biomass Valorization 2020, 11, 5307–5320. [Google Scholar] [CrossRef]
  9. Nand, K. Debittering of Spent Brewer’s Yeast for Food Purposes. Food/Nahrung 1987, 31, 127–131. [Google Scholar] [CrossRef]
  10. Shotipruk, A.; Kittianong, P.; Suphantharika, M.; Muangnapoh, C. Application of Rotary Microfiltration in Debittering Process of Spent Brewer’s Yeast. Bioresour. Technol. 2005, 96, 1851–1859. [Google Scholar] [CrossRef]
  11. Dwivedi, B.K.; Gibson, D.I. Processing of Spent Brewers ’ Yeast for Food Use. Can. Inst. Food Technol. J. 1970, 3, 110–112. [Google Scholar] [CrossRef]
  12. Ganzle, M.G. Lactic Metabolism Revisited: Metabolism of Lactic Acid Bacteria in Food Fermentations and Food Spoilage. Curr. Opin. Food Sci. 2015, 2, 106–117. [Google Scholar] [CrossRef]
  13. Montel, M.C.; Masson, F.; Talon, R. Bacterial Role in Flavour Development. Meat Sci. 1998, 49, S111–S123. [Google Scholar] [CrossRef]
  14. Caplice, E.; Fitzgerald, G.F. Food Fermentations: Role of Microorganisms in Food Production and Preservation. Int. J. Food Microbiol. 1999, 50, 131–149. [Google Scholar] [CrossRef] [PubMed]
  15. Ryan, L.A.M.; Zannini, E.; Dal, F.; Pawlowska, A.; Koehler, P.; Arendt, E.K. Lactobacillus Amylovorus DSM 19280 as a Novel Food-Grade Antifungal Agent for Bakery Products. Int. J. Food Microbiol. 2011, 146, 276–283. [Google Scholar] [CrossRef] [PubMed]
  16. Peyer, L.C.; Zarnkow, M.; Jacob, F.; De Schutter, D.P.; Arendt, E.K. Sour Brewing: Impact of Lactobacillus Amylovorus FST2.11 on Technological and Quality Attributes of Acid Beers. J. Am. Soc. Brew. Chem. 2017, 75, 207–216. [Google Scholar] [CrossRef]
  17. Lowe, D.P.; Ulmer, H.M.; Barta, R.C.; Goode, D.L.; Arendt, E.K. Biological Acidification of a Mash Containing 20% Barley Using Lactobacillus Amylovorus FST 1.1: Its Effects on Wort and Beer Quality. J. Am. Soc. Brew. Chem. 2005, 63, 96–106. [Google Scholar] [CrossRef]
  18. Lynch, K.M.; Pawlowska, A.M.; Brosnan, B.; Coffey, A.; Zannini, E.; Furey, A.; Mcsweeney, P.L.H.; Waters, D.M.; Arendt, E.K. Application of Lactobacillus Amylovorus as an Antifungal Adjunct to Extend the Shelf-Life of Cheddar Cheese. Int. Dairy J. 2014, 34, 167–173. [Google Scholar] [CrossRef]
  19. Gold, R.S.; Meagher, M.M.; Hutkins, R.; Conway, T. Ethanol Tolerance and Carbohydrate Metabolism in Lactobacilli. J. Ind. Microbiol. 1992, 10, 45–54. [Google Scholar] [CrossRef]
  20. Neylon, E.; Nyhan, L.; Zannini, E.; Monin, T.; Münch, S.; Sahin, A.W.; Arendt, E.K. Food Ingredients for the Future: In-Depth Analysis of the Effects of Lactic Acid Bacteria Fermentation on Spent Barley Rootlets. Fermentation 2023, 9, 78. [Google Scholar] [CrossRef]
  21. Nyhan, L.; Sahin, A.W.; Arendt, E.K. Co-Fermentation of Non-Saccharomyces Yeasts with Lactiplantibacillus Plantarum FST 1.7 for the Production of Non-Alcoholic Beer. Eur. Food Res. Technol. 2023, 249, 167–181. [Google Scholar] [CrossRef]
  22. AACC International Approved Methods of Analysis, 11th Edn. Method 02-31.01-Titratable Acidity 2011. Available online: https://www.cerealsgrains.org/resources/Methods/Pages/02Acidity.aspx (accessed on 13 December 2023).
  23. Bellut, K.; Michel, M.; Hutzler, M.; Zarnkow, M.; Jacob, F.; De Schutter, D.P.; Daenen, L.; Lynch, K.M.; Zannini, E.; Arendt, E.K. Investigation into the Potential of Lachancea Fermentati Strain KBI 12.1 for Low Alcohol Beer Brewing. J. Am. Soc. Brew. Chem. 2019, 77, 157–169. [Google Scholar] [CrossRef]
  24. Baldini, M.; Fabietti, F.; Giammarioli, S.; Onori, R.; Orefice, L.; Stacchini, A. Metodi Di Analisi Utilizzati per Il Controllo Chimico Degli Alimenti; Istituto Superiore Di Sanita: Rome, Italy, 1996. [Google Scholar]
  25. AOAC International AOAC Official Method 2015.06-2015 Minerals and Trace Elements in Infant Formula 2015. Available online: http://www.aoacofficialmethod.org/index.php?main_page=product_info&products_id=2937 (accessed on 13 December 2023).
  26. UNE EN 15763:2010; Determination of Trace Elements—Determination of Arsenic, Cadmium, Mercury and Lead in Foodstuffs by Inductively Coupled Plasma Mass Spectrometry (ICP-MS) after Pressure Digestion. iTeh, Inc.: Newark, DE, USA, 2010.
  27. Environmental Protection Agency Analytical Method EPA Method 6020B (SW-846) Inductively Coupled Plasma—Mass Spectrometry 2014. Available online: https://www.epa.gov/esam/epa-method-6020b-sw-846-inductively-coupled-plasma-mass-spectrometry (accessed on 13 December 2023).
  28. AACC International AACC Approved Methods of Analysis, 11th Edition 32-05.01 Total Dietary Fiber 2011. Available online: https://www.cerealsgrains.org/resources/Methods/Pages/32Fiber.aspx (accessed on 13 December 2023).
  29. Smart, K.F.; Aggio, R.B.M.; Van Houtte, J.R.; Villas-Bôas, S.G. Analytical Platform for Metabolome Analysis of Microbial Cells Using Methyl Chloroformate Derivatization Followed by Gas Chromatography–Mass Spectrometry. Nat. Protoc. 2010, 5, 1709–1729. [Google Scholar] [CrossRef] [PubMed]
  30. Johnsen, L.G.; Skou, P.B.; Khakimov, B.; Bro, R. Gas Chromatography Mass Spectrometry Data Processing Made Easy. J. Chromatogr. A 2017, 1503, 57–64. [Google Scholar] [CrossRef] [PubMed]
  31. Jacob, F. Wort, Beer, Beer-Based Beverages: Collection of Brewing Analysis Methods of the Mitteleuropäische Brautechnische Analysenkommission; MEBAK: Freising-Weienstephan, Germany, 2013; ISBN 9783980581479/3980581470. [Google Scholar]
  32. Atzler, J.J.; Sahin, A.W.; Gallagher, E.; Zannini, E.; Arendt, E.K. Investigation of Different Dietary-Fibre-Ingredients for the Design of a Fibre Enriched Bread Formulation Low in FODMAPs Based on Wheat Starch and Vital Gluten. Eur. Food Res. Technol. 2021, 247, 1939–1957. [Google Scholar] [CrossRef]
  33. The Good Scents Company. Available online: https://www.thegoodscentscompany.com/index.html (accessed on 8 December 2021).
  34. FAO. Dietary Protein Quality Evaluation in Human Nutrition; FAO: Rome, Italy, 2013; ISBN 9789251074176. [Google Scholar]
  35. Neylon, E.; Arendt, E.K.; Zannini, E.; Sahin, A.W. Fermentation as a Tool to Revitalise Brewers’ Spent Grain and Elevate Techno-Functional Properties and Nutritional Value in High Fibre Bread. Foods 2021, 10, 1639. [Google Scholar] [CrossRef]
  36. dos Santos Mathias, T.R.; Alexandre, V.M.F.; Cammarota, M.C.; de Mello, P.P.M.; Sérvulo, E.F.C. Characterization and Determination of Brewer’s Solid Wastes Composition. J. Inst. Brew. 2015, 121, 400–404. [Google Scholar] [CrossRef]
  37. Vieira, E.F.; Carvalho, J.; Pinto, E.; Cunha, S.; Almeida, A.A.; Ferreira, I.M.P.L.V.O. Nutritive Value, Antioxidant Activity and Phenolic Compounds Profile of Brewer’s Spent Yeast Extract. J. Food Compos. Anal. 2016, 52, 44–51. [Google Scholar] [CrossRef]
  38. Pinto, M.; Coelho, E.; Nunes, A.; Brandão, T.; Coimbra, M.A. Valuation of Brewers Spent Yeast Polysaccharides: A Structural Characterization Approach. Carbohydr. Polym. 2015, 116, 215–222. [Google Scholar] [CrossRef]
  39. Van Steenwijk, H.P.; Bast, A.; de Boer, A. Immunomodulating Effects of Fungal Beta-Glucans: From Traditional Use to Medicine. Nutrients 2021, 13, 1333. [Google Scholar] [CrossRef]
  40. Du, B.; Lin, C.; Bian, Z.; Xu, B. An Insight into Anti-Inflammatory Effects of Fungal Beta-Glucans. Trends Food Sci. Technol. 2014, 41, 49–59. [Google Scholar] [CrossRef]
  41. Jawhara, S.; Habib, K.; Pignede, G.; Vandekerckove, P.; Maes, E.; Dubuquoy, L.; Fontaine, T.; Guerardel, Y.; Poulain, D. Modulation of Intestinal Inflammation by Yeasts and Cell Wall Extracts: Strain Dependence and Unexpected Anti-Inflammatory Role of Glucan Fractions. PLoS ONE 2012, 7, e40648. [Google Scholar] [CrossRef] [PubMed]
  42. Sempio, R.; Sahin, A.W.; Walter, J.; Arendt, E.K.; Zannini, E. Impact of Isolated and Chemically Modified Dietary Fiber on Bakery Products: Current Knowledge and Future Directions. Cereal Chem. 2023. [Google Scholar] [CrossRef]
  43. O’Keefe, S.J. The Association between Dietary Fibre Deficiency and High-Income Lifestyle-Associated Diseases: Burkitt’s Hypothesis Revisited. Lancet Gastroenterol. Hepatol. 2019, 4, 984–996. [Google Scholar] [CrossRef] [PubMed]
  44. Barber, T.M.; Kabisch, S.; Pfei, A.F.H.; Weickert, M.O. The Health Benefits of Dietary Fibre. Nutrients 2020, 12, 3209. [Google Scholar] [CrossRef]
  45. MacLeod, R.A.; Snell, E.E. Some Mineral Requirements of the Lactic Acid Bacteria. Inorg. Ions Bact. Growth 1947, 170, 351–365. [Google Scholar] [CrossRef]
  46. Kulshrestha, S.; Tyagi, P.; Sindhi, V.; Sharma, K. Invertase and Its Applications e A Brief Review. JOPR J. Pharm. Res. 2013, 7, 792–797. [Google Scholar] [CrossRef]
  47. Kappler, S.; Krahl, M.; Geissinger, C.; Becker, T.; Krottenthaler, M. Degradation of Iso-α-Acids During Wort Boiling. J. Inst. Brew. 2010, 116, 332–338. [Google Scholar] [CrossRef]
  48. Li, H.; Liu, F. Changes in Organic Acids during Beer Fermentation. J. Am. Soc. Brew. Chem. 2015, 73, 275–279. [Google Scholar] [CrossRef]
  49. Shibamoto, T. Diacetyl: Occurrence, Analysis, and Toxicity. J. Agric. Food Chem. 2014, 62, 4048–4053. [Google Scholar] [CrossRef]
  50. Laëtitia, G.; Pascal, D.; Yann, D. The Citrate Metabolism in Homo- and Heterofermentative LAB: A Selective Means of Becoming Dominant over Other Microorganisms in Complex Ecosystems *. Food Nutr. Sci. 2014, 5, 953–969. [Google Scholar] [CrossRef]
  51. Czerny, M.; Christlbauer, M.; Christlbauer, M.; Fischer, A.; Granvogl, M.; Hammer, M.; Hartl, C.; Hernandez, N.M.; Schieberle, P. Re-Investigation on Odour Thresholds of Key Food Aroma Compounds and Development of an Aroma Language Based on Odour Qualities of Defined Aqueous Odorant Solutions. Eur. Food Res. Technol. 2008, 228, 265–273. [Google Scholar] [CrossRef]
  52. Rhlid, R.B.; Fleury, Y.; Blank, I.; Fay, L.B.; Welti, D.H.; Vera, F.A.; Juillerat, M.A. Generation of Roasted Notes Based on 2-Acetyl-2-Thiazoline and Its Precursor, 2-(1-Hydroxyethyl)-4, 5-Dihydrothiazole, by Combined Bio and Thermal Approaches. J. Agric. Food Chem. 2002, 50, 2350–2355. [Google Scholar] [CrossRef] [PubMed]
  53. Zhang, H.; Zhang, L.; Yu, X.; Xu, Y. Chemistry and Biology of Aroma and Taste The Biosynthesis Mechanism Involving 2,3-Pentanedione and Aminoacetone Describes the Production of 2-Ethyl-3,5-Dimethylpyrazine and 2-Ethyl-3,6-Dimethylpyrazine by Bacillus Subtilis. J. Agric. Food Chem. 2020, 68, 3558–3567. [Google Scholar] [CrossRef] [PubMed]
  54. Alim, A.; Song, H.; Liu, Y.; Zou, T.; Zhang, Y.; Zhang, S. Flavour-Active Compounds in Thermally Treated Yeast Extracts. J. Sci. Food Agric. 2018, 98, 3774–3783. [Google Scholar] [CrossRef]
  55. Hill, A.E.; Stewart, G.G. Free Amino Nitrogen in Brewing. Fermentation 2019, 5, 22. [Google Scholar] [CrossRef]
  56. Schieberle, P. Original Paper The Role of Free Amino Acids Present in Yeast as Precursors of the Odorants 2-Acetyl-l-Pyrroline and 2-Acetyltetrahydropyridine in Wheat Bread Crust. Zeitschrift Lebensmittel-Untersuchung Forschung 1990, 191, 206–209. [Google Scholar] [CrossRef]
  57. Jacob, F.F.; Striegel, L.; Rychlik, M.; Hutzler, M.; Methner, F.J. Spent Yeast from Brewing Processes: A Biodiverse Starting Material for Yeast Extract Production. Fermentation 2019, 5, 51. [Google Scholar] [CrossRef]
  58. Hernawan, T.; Fleet, G. Chemical and Cytological Changes during the Autolysis of Yeasts. J. Ind. Microbiol. 1995, 14, 440–450. [Google Scholar] [CrossRef]
  59. Agboola, J.O.; Lapeña, D.; Øverland, M.; Arntzen, M.Ø.; Mydland, L.T.; Hansen, J.Ø. Yeast as a Novel Protein Source - Effect of Species and Autolysis on Protein and Amino Acid Digestibility in Atlantic Salmon (Salmo Salar). Aquaculture 2022, 546, 737312. [Google Scholar] [CrossRef]
  60. Lamoolphak, W.; Goto, M.; Sasaki, M.; Suphantharika, M.; Muangnapoh, C.; Prommuag, C.; Shotipruk, A. Hydrothermal Decomposition of Yeast Cells for Production of Proteins and Amino Acids. J. Hazard. Mater. 2006, 137, 1643–1648. [Google Scholar] [CrossRef]
  61. Petrova, P. Lactic Acid Fermentation of Cereals and Pseudocereals: Ancient Nutritional Biotechnologies. Nutrients 2020, 12, 1118. [Google Scholar] [CrossRef] [PubMed]
  62. Zhao, C.J.; Schieber, A.; Gänzle, M.G. Formation of Taste-Active Amino Acids, Amino Acid Derivatives and Peptides in Food Fermentations—A Review. Food Res. Int. 2016, 89, 39–47. [Google Scholar] [CrossRef]
  63. Liu, M.; Bayjanov, J.R.; Renckens, B.; Nauta, A.; Siezen, R.J. The Proteolytic System of Lactic Acid Bacteria Revisited: A Genomic Comparison. BMC Genom. 2010, 11, 5–8. [Google Scholar] [CrossRef] [PubMed]
  64. Savijoki, M.K.; Ingmer, H.; Varmanen, P. Proteolytic Systems of Lactic Acid Bacteria. Appl. Microbiol. Biotechnol. 2006, 71, 394–406. [Google Scholar] [CrossRef] [PubMed]
  65. Yin, Y.; Wang, J.; Yang, S.; Feng, J.; Jia, F.; Zhang, C. Protein Degradation in Wheat Sourdough Fermentation with Lactobacillus Plantarum M616. Interdiscip. Sci. Comput. Life Sci. 2015, 7, 205–210. [Google Scholar] [CrossRef]
  66. Kato, H.; Rhue, M.R.; Nishimura, T. Role of Free Amino Acids and Peptides in Food Taste; American Chemical Society: Washington, DC, USA, 1989. [Google Scholar]
  67. Kohl, S.; Behrens, M.; Dunkel, A.; Hofmann, T.; Meyerhof, W. Amino Acids and Peptides Activate at Least Five Members of the Human Bitter Taste Receptor Family. J. Agric. Food Chem. 2013, 61, 53–60. [Google Scholar] [CrossRef] [PubMed]
  68. Temussi, P.A. The Good Taste of Peptides. J. Pept. Sci. 2012, 18, 73–82. [Google Scholar] [CrossRef]
  69. Konings, W.N. The Cell Membrane and the Struggle for Life of Lactic Acid Bacteria. Antonie van Leeuwenhoek Int. J. Gen. Mol. Microbiol. 2002, 82, 3–27. [Google Scholar] [CrossRef]
  70. Teixeira, J.S.; Seeras, A.; Sanchez-maldonado, A.F.; Zhang, C.; Su, M.S.; Gänzle, M.G. Glutamine, Glutamate, and Arginine-Based Acid Resistance in Lactobacillus Reuteri. Food Microbiol. 2014, 42, 172–180. [Google Scholar] [CrossRef]
  71. Dhakal, R.; Bajpai, V.K.; Baek, K.H. Production of GABA (γ-Aminobutyric Acid) by Microorganisms: A Review. Braz. J. Microbiol. 2012, 43, 1230–1241. [Google Scholar] [CrossRef]
  72. Hepsomali, P.; Groeger, J.A.; Nishihira, J.; Scholey, A. Effects of Oral Gamma-Aminobutyric Acid (GABA) Administration on Stress and Sleep in Humans: A Systematic Review. Front. Neurosci. 2020, 14, 923. [Google Scholar] [CrossRef]
  73. Siragusa, S.; De Angelis, M.; Di Cagno, R.; Rizzello, C.G.; Coda, R.; Gobbetti, M. Synthesis of γ-Aminobutyric Acid by Lactic Acid Bacteria Isolated from a Variety of Italian Cheeses. Appl. Environ. Microbiol. 2007, 73, 7283–7290. [Google Scholar] [CrossRef]
  74. Li, S.; Zhang, Y.; Yin, P.; Zhang, K.; Liu, Y.; Gao, Y.; Li, Y.; Wang, T.; Lu, S.; Li, B. Probiotic Potential of γ-Aminobutyric Acid (GABA)–Producing Yeast and Its Influence on the Quality of Cheese. J. Dairy Sci. 2021, 104, 6559–6576. [Google Scholar] [CrossRef]
  75. Weijzen, M.E.G.; van Gassel, R.J.J.; Kouw, I.W.K.; Trommelen, J.; Gorissen, S.H.M.; van Kranenburg, J.; Goessens, J.P.B.; van de Poll, M.C.G.; Verdijk, L.B.; van Loon, L.J.C. Ingestion of Free Amino Acids Compared with an Equivalent Amount of Intact Protein Results in More Rapid Amino Acid Absorption and Greater Postprandial Plasma Amino Acid Availability without Affecting Muscle Protein Synthesis Rates in Young Adults in a Double-Blind Randomized Trial. J. Nutr. 2021, 152, 59–67. [Google Scholar]
  76. Rønnestad, I.; Conceicao, L.E.C.; Aragao, C.; Dinis, M.T. Nutrient Metabolism—Research Communication Free Amino Acids Are Absorbed Faster and Assimilated More Efficiently than Protein in Postlarval Senegal Sole (Solea Senegalensis) 1. J. Nutr. 2000, 130, 2809–2812. [Google Scholar] [CrossRef]
  77. Whitley, K.; Marshall, V.M. Heterofermentative Metabolism of Glucose and Ribose and Utilisation of Citrate by the Smooth Biotype of Lactobacillus Amylovorus NCFB 2745. Antonie van Leeuwenhoek Int. J. Gen. Mol. Microbiol. 1999, 75, 217–223. [Google Scholar] [CrossRef]
  78. Raab, A.M.; Gebhardt, G.; Bolotina, N.; Weuster-botz, D.; Lang, C. Metabolic Engineering of Saccharomyces Cerevisiae for the Biotechnological Production of Succinic Acid. Metab. Eng. 2010, 12, 518–525. [Google Scholar] [CrossRef]
  79. Morishita, T.; Yajima, M. Incomplete Operation of Biosynthetic and Bioenergetic Functions of the Citric Acid Cycle in Multiple Auxotrophic Lactobacilli. Biosci. Biotechnol. Biochem. 1995, 59, 251–255. [Google Scholar] [CrossRef]
  80. Tsuji, A.; Okada, S.; Hols, P.; Satoh, E. Enzyme and Microbial Technology Metabolic Engineering of Lactobacillus Plantarum for Succinic Acid Production through Activation of the Reductive Branch of the Tricarboxylic Acid Cycle. Enzyme Microb. Technol. 2013, 53, 97–103. [Google Scholar] [CrossRef]
  81. Bartowsky, E.J.; Costello, P.J.; Chambers, P.J. Emerging Trends in the Application of Malolactic Fermentation. Aust. J. Grape Wine Res. 2015, 21, 663–669. [Google Scholar] [CrossRef]
  82. Zakhartsev, M.; Reuss, M. Cell Size and Morphological Properties of Yeast Saccharomyces Cerevisiae in Relation to Growth Temperature. FEMS Yeast Res. 2018, 18, 1–16. [Google Scholar] [CrossRef] [PubMed]
  83. Martínez-Rodríguez, A.J.; Polo, M.C.; Carrascosa, A.V. Structural and Ultrastructural Changes in Yeast Cells during Autolysis in a Model Wine System and in Sparkling Wines. Int. J. Food Microbiol. 2001, 71, 45–51. [Google Scholar] [CrossRef] [PubMed]
Figure 1. (A) Development of pH (solid line) and TTA (dotted line) and (B) growth of L. amylovorus FST 2.11 during PBSY fermentation.
Fermentation 10 00054 g001
Figure 2. Comparison of aroma (A), taste (B) and flavour (C) characteristics plotted using the mean intensity rating for the CBSY (solid line) and PBSY (dashed line). Insignificant difference of means, at a level of 5% significance, is indicated by *.
Fermentation 10 00054 g002
Figure 3. Free amino acid composition of the CBSY and PBSY, expressed as g/100 g on a dry basis.
Fermentation 10 00054 g003
Figure 4. SDS-PAGE of the CBSY (A) and PSBY (B), alongside the reference ladder (L).
Fermentation 10 00054 g004
Figure 5. Comparison of metabolites in the CBSY and PBSY, expressed as g/L, with the exception of pyruvic acid. *—The relative value is the normalised peak area as compared to an internal standard (deuterium-labelled alanine; **—Indicates no significant difference (p > 0.05).
Fermentation 10 00054 g005
Figure 6. Photographs of CBSY (A) and PBSY (B) alongside scanning electron microscopy (SEM) images of the CBSY (C) and PBSY (D) at 1000× magnification.
Fermentation 10 00054 g006
Table 1. Composition of control BSY (CBSY) and processed BSY (PBSY), expressed as g/100 g on a dry matter basis. N.d. = not detected.
g/100 g DM
CBSYPBSY
Proteins35.588 ± 1.50138.736 ± 1.638
Total Fats1.361 ± 0.0891.393 ± 0.001
Carbohydrates
   Insoluble Dietary Fibre44.367 ± 1.97236.723 ± 1.767
   High MW Soluble3.130 ± 0.4822.095 ± 0.386
   Low MW Soluble2.412 ± 0.0640.925 ± 0.140
Total Dietary Fibre49.909 ± 2.12239.731 ± 1.603
Total Sugars0.301 ± 0.01910.048 ± 0.644
Ash5.628 ± 0.3223.429 ± 0.211
Moisture 6.710 ± 0.38014.530 ± 0.380
Energy value (kcal)314 ± 10294 ± 10
Energy value (kJ)1322 ± 451237 ± 47
mg/kg
Calcium2320 ± 1902700 ± 220
Iron65 ± 1368 ± 14
Phosphorus9860 ± 7906600 ± 530
Magnesium2060 ± 2301310 ± 140
Manganese5.7 ± 1.35.5 ± 1.2
Potassium14,900 ± 15004950 ± 480
Copper3.16 ± 0.673.36 ± 0.71
Sodium271 ± 26166 ± 21
Zinc72 ± 1478 ± 15
Total29,55615,880
g/100 g DM
Glucose0.166 ± 0.014n.d.
Fructose0.090 ± 0.0099.924 ± 0.644
Lactosen.d.n.d.
Sucrosen.d.n.d.
Maltose0.045 ± 0.0100.124 ± 0.020
Total Sugars0.301 ± 0.01910.048 ± 0.644
IBU (mg/L)
Iso-α-acids (IBU)129100
Table 2. Gas chromatography—olfactory analysis indicating the odour intensity of the selected aroma compounds; n.d. = not detected, 1 = weakly detected, 2 = unequivocally detectable, 3 = intensely detectable. Aroma and flavour descriptors were obtained from an online database [33].
CompoundAromaFlavourIntensity
CBSYPBSY
Ethyl-3-methyl butanoatefruity, sweet, applesweet, fruity, spicy1.751.5
2,3,-butanedione (diacetyl)buttery, creamy, sweetbuttery, creamy, sweet0.51.75
Acetic acidsour, acidicsour, acidic1.53
2-ethyl-3,5/6-dimethyl pyrazineearthy/burntearthy/burnt2n.d.
Methionalboiled potato, vegetableboiled potato, vegetable2.752.25
Butanoic acid (butyric acid)cheesy, sharp, aceticsour, acidic, cheesy21.5
Phenylacetaldehydegreen, sweet, floralhoney, floral, sweet, cocoa12
2-/3-methyl butanoic acidcheesy, sour, tropicalcheesy, fruity, fermented32.5
2-acetyl-2-thiazolinecorn, potato, toastedcorn, popcorn, roasted, grain2n.d.
Hexanoic acidfatty, sour, cheesycheesy, fruity, phenolic, goat21.25
Furaneolcaramel, sweet, strawberrycaramel, sweet, burnt sugar, maple33
Octanoic Acidfatty, waxy, cheesy,soapy, rancid, cheesy, fatty22
4-methylphenolphenolic, narcissus, animal, mimosaphenolic1.51.5
Lactic acidlightly acidicsour, acidicn.d.2
Sotoloncaramel-like, sweet, maplecaramel-like, sweet, maple22.5
Decanoic acidfatty, rancid, sour, citrussoapy, waxy, fruity2.52.25
Phenylacetic acidhoney, sweet, floralhoney, sweet, floral2.52.25
Vanillinvanilla, sweet, creamyvanilla, sweet, creamy32.25
Phenylpropionic acidfloral, sweet, fattysweet, balsamic2.252.5
Table 3. Total amino acid profile of the CBSY and PBSY, with results expressed as g/100 g. Additionally, the percentage of essential amino acid requirement met per g of protein is shown, calculated using the FAO 2013 values [34].
Essential Amino AcidsCBSY% of Requirement
mg/g Protein
PBSY% of Requirement
mg/g Protein
g/100 g g/100 g
Isoleucine 1.17 ± 0.191171.49 ± 0.23150
Leucine 2.02 ± 0.271002.15 ± 0.27106
Valine 1.38 ± 0.221041.87 ± 0.25141
Lysine 2.51 ± 0.301582.67 ± 0.32168
Tryptophan0.32 ± 0.041460.27 ± 0.03123
Threonine 1.47 ± 0.231771.70 ± 0.24205
Histidine 0.67 ± 0.111260.65 ± 0.11123
Sulphur AA 105 98
Cysteine and Cystine0.37 ± 0.06 0.25 ± 0.04
Methionine0.43 ± 0.07 0.43 ± 0.08
Aromatic AA 165 177
Tyrosine0.98 ± 0.16 1.07 ± 0.17
Phenylalanine1.26 ± 0.21 1.33 ± 0.22
Nonessential Amino AcidsCBSY PBSY
g/100 g g/100 g
Aspartic acid 3.06 ± 0.35 3.02 ± 0.35
Glutamic acid 4.89 ± 0.52 3.66 ± 0.40
Alanine 2.08 ± 0.27 2.03 ± 0.27
Arginine 2.01 ± 0.26 1.67 ± 0.24
Glycine1.40 ± 0.22 1.33 ± 0.22
Proline 1.71 ± 0.24 1.59 ± 0.23
Serine 1.85 ± 0.25 1.82 ± 0.25
Disclaimer/Publisher’s Note: The statements, opinions and data contained in all publications are solely those of the individual author(s) and contributor(s) and not of MDPI and/or the editor(s). MDPI and/or the editor(s) disclaim responsibility for any injury to people or property resulting from any ideas, methods, instructions or products referred to in the content.

