Article

Production with Fermentation Culture and Antioxidant Activity of Polysaccharides from Morchella esculenta

State Key Laboratory of Biobased Material and Green Papermaking, School of Bioengineering, Shandong Provincial Key Laboratory of Microbial Engineering, Qilu University of Technology, Shandong Academy of Sciences, Jinan 250353, China
*
Author to whom correspondence should be addressed.
Fermentation 2024, 10(1), 46; https://doi.org/10.3390/fermentation10010046
Submission received: 30 November 2023 / Revised: 29 December 2023 / Accepted: 5 January 2024 / Published: 7 January 2024
(This article belongs to the Special Issue New Research on Fungal Secondary Metabolites, 2nd Edition)

Abstract

:
Morchella esculenta is a precious edible and medicinal fungus rich in protein, polysaccharides, polyphenols, amino acids, triterpenes, and other active components. In this study, MS-1 was isolated from the fruiting body of M. esculenta. Through conducting single-factor experiments and the response surface analysis of the culture conditions, the optimal culture components of an M. esculenta fermentation broth for extracellular polysaccharide production were determined, namely, 3.7% glucose, 2% yeast extract, and 0.15% sodium chloride. The polysaccharides MSF and MSL were extracted from the fruiting body of M. esculenta and the fermentation broth, respectively, and analyzed with gel permeation chromatography (GPC), monosaccharide composition, scanning electron microscopy (SEM), Fourier-transform infrared spectroscopy (FTIR), thermogravimetric analysis (TGA), and in vivo and in vitro antioxidant and anti-inflammatory activity analyses. The research results show that the calculated MW of MSF is 2.34 × 10⁵ Da, and the calculated MW of MSL is 1.40 × 10⁵ Da. MSF is composed of three monosaccharides: D-galactose, D-glucose, and D-mannose (molar ratio of 4.34:90.22:5.45). MSL consists of five monosaccharides: D-arabinose, D-galactose, D-glucose, D-mannose, and glucuronic acid (molar ratio of 0.31:14.71:13.03:71.43:0.53). The in vitro antioxidant test results show that MSF and MSL both have significant antioxidant activities. Activity experiments on MSF and MSL in zebrafish showed that MSF and MSL have significant repair effects on the oxidative damage caused by metronidazole in zebrafish embryos, and there were significant changes in the transcriptional activity levels of the oxidative stress-related genes SOD, Keap1, and Nrf2. Therefore, the polysaccharides MSF and MSL from MS-1 can be used as important raw materials for functional foods and drugs.

1. Introduction

Morchella esculenta is a nutrient-rich, edible fungus commonly known as morel, sponge morel, etc. [1]. Morel contains a variety of bioactive substances, including polysaccharides, proteins, trace elements, dietary fiber, and vitamins, which have high edible and medicinal values [2,3]. Polysaccharides are an important active component [1]. Due to the scarcity of wild morel resources and the strict requirements for artificial cultivation conditions [4], it is particularly important to produce morel polysaccharides using liquid fermentation technology.
Polysaccharides are widely found in microorganisms, seaweeds, animals, and plants and play an important role in preventing oxidative damage to organisms [5]. In recent years, safe, natural, and non-toxic fungal polysaccharides have been widely used [6,7,8]. For example, Ganoderma lucidum polysaccharides can enhance antioxidant enzyme activity, eliminate free radicals, and reduce oxidative damage [9]. The polysaccharides of Inonotus hispidus have good antioxidant activity and can alleviate the oxidative damage of normal hepatocytes induced by H2O2 [10]. The research demonstrates that an Astragalus membranaceus polysaccharide could effectively curb the proliferation of H22 hepatoma cells by boosting serum cytokine activity, enhancing immune responses, and ultimately inducing tumor cell apoptosis to minimize the potential harm [11]. Morel polysaccharides enhance humans’ immunity and perform anti-aging and anti-tumor functions [12,13,14]. The extracellular polysaccharides produced by microbial liquid fermentation are similar to those derived from fungal fruiting bodies and have good physiological activity. Liquid fermentation is not affected by external environmental factors, is easy to control, and has a high production efficiency and low cost [15]. It is easier to obtain fungal extracellular polysaccharides produced by liquid fermentation. In order to obtain high-yield fungal extracellular polysaccharides, there have been many studies on the optimization of liquid fermentation conditions for various fungal extracellular polysaccharides, such as Pleurotus ostreatus [16], Leiotrametes gibbosa [17], etc. Therefore, the optimization of fermentation conditions is an important way of further increasing the yield of bio-polysaccharides and the variety of polysaccharides.
The nutritional components in a microbial culture environment directly affect the efficiency and type of cell metabolic product synthesis [18,19]. In this study, the Box–Behnken response surface method was used to optimize the medium formulation of polysaccharides from MS-1 via liquid-submerged fermentation, and the polysaccharide MSL from MS-1 was isolated and extracted from the fermentation broth. The physicochemical properties of the polysaccharide MSL isolated from the MS-1 fermentation broth and the polysaccharide MSF isolated from the fruiting body were compared using gel permeation chromatography and SEM analysis. In addition, the in vivo antioxidant activity assay of zebrafish showed that the MSL produced by liquid fermentation had a stronger antioxidant capacity than did the MSF from the fruiting body. The results show that the production of the MS-1 exopolysaccharide could be significantly increased by optimizing the liquid fermentation medium, and the functional activity of the fermentation broth polysaccharide MSL was better than that of the fruiting body polysaccharide MSF. Liquid-submerged fermentation can not only reduce costs and improve the production efficiency [20], but can also obtain morel polysaccharides with better functional activity levels [15,21]. The results of this study will provide a theoretical reference for the promotion and application of morel polysaccharides in the functional medicine and food industries.

2. Materials and Methods

2.1. Reagents and Chemicals

Cellulose DEAE-52 and Sephadex G-100 were purchased from Beijing Solarbio Science & Technology Co., Ltd. (Beijing, China). 2, 2-Diphenyl-1-picrylhydrazyl (DPPH) was purchased from Macklin Biochemical Co., Ltd. (Shanghai, China). 2, 4, 6-Tripyridyl-s-triazine (TPTZ), metronidazole, and monosaccharide standards were all obtained from Yuan Ye Biotechnology (Shanghai, China). Transgenic zebrafish Tg (Krt4-NTR: GFP) were bred at the Institute of Biology, the Shandong Academy of Sciences (Shandong, China). All analytical grade biochemical reagents used in this study were obtained from Sangon Biotech Co., Ltd. (Shanghai, China).

2.2. Strain

Wild morel fruiting bodies were collected, isolated, and purified for cultivation to obtain M. esculenta.

2.3. Preparation of Polysaccharides

The extraction of polysaccharides involved crushing the fruiting body of M. esculenta, following a material-to-liquid ratio of 1: 30 (w/v, g/mL), and soaking it in a distilled water bath at 80 °C for one hour [22], and then extracting it via ultrasonication for 30 min at 60 °C and 300 W. Centrifugation was performed at 3000 rpm for 10 min, after which the supernatant was extracted. The polysaccharide solution was then concentrated to 1/10 of its original volume using a rotary evaporator [23], after which a three-times-larger volume of 95% ethanol was added to the concentrated extract, mixed well, and left undisturbed at 4 °C for 12 h [24]. The sediment was collected after centrifugation at 3000 rpm for 10 min. The crude polysaccharide was obtained by washing the sediment twice with 95% ethanol [25]. The obtained crude polysaccharide was then freeze-dried in a vacuum. The dried polysaccharide was dissolved in water, and then Sevag reagent was added, mixed, and oscillated. After centrifugation at 3000 rpm for 10 min, the supernatant was taken, and this step was repeated until no protein precipitation occurred [26]. The supernatant was then dialyzed with a dialysis membrane (3500 Da) for 72 h. The dialyzed polysaccharide solution was freeze-dried.
The exopolysaccharide was prepared using MS-1 of M. esculenta. In a 5 L fermenter, 400 mL seed liquid was added, the inoculation concentration was 10%, and the fermentation was performed at 18 °C under aerobic conditions for 132 h. The fermentation supernatant was obtained through filtration to remove the hyphae, and the fermentation supernatant was evaporated and concentrated to 10% of its initial volume using a rotary evaporator. The continuous extraction of fermented liquid polysaccharides was the same as the extraction of fruiting body polysaccharides.

2.4. M. esculenta Culture in Liquid Shaker

2.4.1. Medium Preparation

PDA liquid culture medium: A total of 200 g of sliced potato was boiled in water for 30 min. After that, the supernatant was filtered, water was added to total 1000 mL, and 20 g of glucose was added. PDA solid culture medium: A total of 2% agar powder was added to the PDA liquid culture medium. Liquid fermentation basic culture medium: A total of 30 g of glucose, 5 g of ammonium sulfate, and 0.5 g of dipotassium hydrogen phosphate were added to water to total 1000 mL.

2.4.2. M. esculenta Activation

MS-1 was inoculated on the PDA plate medium and cultured at 18 °C for 7 days until the mycelium was fully grown. The hyphae were scraped and inoculated in the PDA liquid medium, and the flask was shaken for 96 h at 18 °C at 150 rpm.

2.4.3. Single-Factor Screening of Liquid Fermentation Cultivation

Based on liquid fermentation medium, 3% glucose, sucrose, maltose, fructose, and xylose were selected as carbon sources. Totals of 0.5% peptone, yeast extract, ammonium sulfate, ammonium chloride, and sodium nitrate were selected as nitrogen sources. Dipotassium hydrogen phosphate, ferrous sulfate heptahydrate, copper sulfate pentahydrate, sodium chloride, and ammonium chloride were used as inorganic salts, the concentration was 0.05%, and the other ingredients were the same as those in the liquid fermentation medium. The cultures were incubated at 18 °C and 150 rpm for 132 h, with three biological replicates per treatment. The extracellular polysaccharide content was determined by the phenol–sulfuric acid method.

2.4.4. Determination of Single-Factor Concentration in Liquid Culture

The culture medium with added glucose, yeast extract, and sodium chloride was used as the liquid fermentation culture medium. The concentrations of glucose were set at 1%, 2%, 3%, 4%, and 5%; the yeast extract concentrations were set at 0.25%, 0.5%, 1%, 1.5%, and 2%; and the sodium chloride concentrations were set at 0.025%, 0.05%, 0.1%, 0.2%, and 0.3%. The other components were the same as the basic liquid fermentation medium, and the yield of extracellular polysaccharides was used as an evaluation index. Cultivated at 18 °C and 150 rpm for 132 h, with three biological repeats for each treatment, and the average value was taken. The phenol–sulfuric acid method was used to measure the content of extracellular polysaccharides, and the optimal additional amounts of glucose, yeast extract, and sodium chloride were determined.

2.4.5. Box–Behnken Center Combination Experiment

Glucose, yeast extract, and sodium chloride were regarded as significant factors and independent variables, respectively, marked as A, B, and C [27]. Each independent variable was designed with three-level coding according to the best concentration of a single component, and the yield of extracellular polysaccharides in the fermentation liquid was used as the response value for the response surface design experiment. The N = 17 center combination scheme was selected using Design Expert (v13.0.5.0) software.

2.5. Purification and Extraction of M. esculenta Polysaccharides

A total of 160 mg of M. esculenta polysaccharides, with the proteins removed, were solubilized in 8 mL of water and added to a DEAE-52 anion exchange column (2.6 cm × 20 cm) for chromatography purification [28]. The elution of polysaccharides from the column was carried out using a NaCl concentration gradient elution method. Eluates in the first 20 collection tubes were washed with distilled water, and tubes 21–80 contained a linear gradient (0~1 M) of NaCl solution. A total of 13 mL of eluent was collected from each tube, and the concentration of polysaccharides in each tube was detected at 485 nm using the phenol–sulfuric acid method. The presence of NaCl in the collected fluid was removed through dialysis using a 3.5 kDa-Mw cutoff membrane, and the polysaccharide solution was freeze-dried to yield polysaccharides after each round of DEAE-52 column chromatography.
A total of 40 mg of polysaccharides was dissolved in 2 mL water, and the solution was subjected to column chromatography using the Sephadex G-100 (1.6 cm × 70 cm). The elution was washed with distilled water, and 3 mL of eluent was collected in each tube. The concentration of polysaccharides in each tube was detected at 485 nm using the phenol–sulfuric acid method. After combining the collected fluid corresponding to the single collection peak, a polysaccharide sample was obtained after vacuum freeze-drying [29].

2.6. Determination of the Molecular Weight

A total of 3 mg of the polysaccharide sample was dissolved in 1 mL of ultrapure water, and then filtered through a 0.22 μm aqueous phase filter membrane before being analyzed with a gel permeation chromatography (PL aquagel-OH MIXED (7.5 mm × 30 cm) (Agilent, Santa Clara, CA, USA)) system of Waters Corp (Milford, CT, USA). A total of 10 μL of the sample solution was injected into the system, and then eluted at 40 °C with 0.1 M NaNO3 at a flow rate of 1 mL/min. The calibration of the gel permeation chromatography (GPC) analysis was performed with dextran of different molecular weights.

2.7. Monosaccharide Composition Analysis

Stock solutions of monosaccharides with a concentration of 10 mg/mL were prepared. Then, a suitable amount of the monosaccharide stock solution was mixed and diluted to yield 60 μg/mL, 50 μg/mL, and 40 μg/mL monosaccharide mixtures. An ion chromatography system (ICS5000; Thermo Fisher Scientific, USA), an electrochemical detector, was used for the analysis of the monosaccharide standards, and the liquid chromatography column was the DionexTM CarboPacTM PA20 (1.5 cm × 0.3 cm, 10 μm). The proportion of elution gradient of mobile phases A, B, and C, over time: 0–26 min (95:5:0, v/v), 26.1–42 min (85:5:10, v/v), 42.1–52 (60:0:40, v/v), 52.1–60 (95:5:0, v/v), and 60 min (95:5:0, v/v). A standard curve was drawn.
A total of 1 mL 2 M TFA solution was added and hydrolyzed at 121 °C for 2 h. After cooling, the polysaccharide samples were blown dry with nitrogen gas. Then, after washing with pure methanol, the sample was blown dry again and repeatedly washed with pure methanol 2–3 times. Finally, sterile water was added to dissolve it, and it was transferred to a new chromatographic bottle. Mobile phase A was set as H2O, mobile phase B was 0.1 M NaOH, and mobile phase C was 0.1 M NaOH, 0.2 M NaAc mixed solution, and the flow rate was adjusted to 0.5 mL/min. The temperature of the column was maintained at 30 °C. The sample size was 5 μL. The content of monosaccharides in polysaccharides was calculated according to the standard curve.

2.8. FTIR Analysis

Polysaccharide samples of 5 mg MSF and MSL were accurately weighed, mixed, and ground with potassium bromide, and a pellet of the polysaccharide sample was made under a pressure of 5 tons. An FTIR spectrometer (TENSOR II; Leipzig, Germany) scanned the polysaccharide sample in the wavelength range of 4000–400 cm−1.

2.9. TG Analysis

Totals of 9.32 mg of MSF and 3.41 mg of MSL, respectively, were accurately weighted and placed in a crucible. The sample temperature was raised from room temperature to 800 °C at a heating rate of 10 °C/min; the nitrogen flow rate was 50 mL/min, which was kept constant at 800 °C for 10 min. The thermogravimetric curve was drawn based on the change in polysaccharide mass (Beijing-Hengjiu-HTC-4).

2.10. SEM Analysis

A total of 3 mg of polysaccharide sample was taken, and platinum powder was sprayed on the sample surface. Then, the surface morphology was observed using a Scanning Electron Microscope (SEM, JSM-7610FPlus).

2.11. Extracellular Antioxidant Activity Test

2.11.1. Hydroxyl Radical Scavenging Activity

The method for measuring the scavenging activity of hydroxyl radicals of polysaccharide samples is described in reference [30], with minor modifications. Totals of 1 mL of polysaccharide solution of different concentrations, 9.0 mmol/L FeSO4 solution, and 9.0 mmol/L salicylic acid–ethanol solution, respectively, were taken, and then 8.8 mmol/L H2O2 was added and left to react at 37 °C for 30 min; they were centrifuged to remove the precipitate, and the absorbance values at 510 nm were measured for each concentration. The blank group replaced the polysaccharide solution with distilled water, and the control group replaced 8.8 mmol/L H2O2 with distilled water. Three experimental repetitions were performed.

2.11.2. DPPH Radical Scavenging Activity

The method for determining the DPPH scavenging activity of the polysaccharide samples is described in this reference [31]. Totals of 1 mL of the 2, 4, 6, 8, and 10 mg/mL polysaccharide solutions and 2 mL of 0.1 g/L DPPH (1,1-diphenyl-2-trinitrophenylhydrazine) ethanol solution were mixed together and allowed to stand at 25 °C for one hour. The absorbance of reaction solution was measured at a wavelength of 517 nm. For the blank group, distilled water was used to substitute the polysaccharide solution, and for the control group, an anhydrous ethanol solution was used to replace the 0.1 g/L DPPH free radical anhydrous ethanol solution.

2.11.3. Fe2+ Chelating Capacity

The analysis of the iron ion reduction activity of polysaccharides was conducted using the experimental methods [32]. The FRAP (ferric ion reducing antioxidant power) reaction system includes acetic acid buffer (300 mmol/L, pH 3.6), TPTZ solution (10 mmol/L), and FeCl3•6H2O solution (20 mmol/L). A total of 1 mL of 2, 4, 6, 8, and 10 mg/mL of polysaccharide solution was mixed with 2.5 mL of FRAP reagent and left to react at 37 °C for 8 min. After the reaction, the absorbance value at 593 nm was measured. The iron ion reducing ability of polysaccharides was calculated based on the standard curve of FeSO4•6H2O (0–1000 µmol/L).

2.12. Intracellular Antioxidant Activity Test

2.12.1. Estimation of the Oxidative Stress-Induced Intracellular Anti-Apoptotic Potential in Zebrafish Embryos

A polysaccharide solution was prepared in zebrafish embryo culture water (10 mg/mL) and stored at 4 °C for backup. The stock solution (10 mM) of metronidazole was prepared with embryo culture water. In a 24-well plate, the blank control, metronidazole model, and polysaccharide sample groups were prepared. The blank control group was added to 2.0 mL of embryo culture water, the metronidazole model group was added with 1.0 mL of metronidazole solution to a final concentration of 5 mM, and the polysaccharide sample group was added to 1.0 mL of metronidazole solution and different volumes of polysaccharide stock, and the embryo culture water increased the total to 2.0 mL.
A polysaccharide toxicity test was performed on the zebrafish to set the concentration of polysaccharide samples for subsequent experiments. When the fertilized eggs developed to one day post fertilization (dpf), normal zebrafish embryos were selected under a stereomicroscope and placed in a 1 mg/mL streptomycin solution for about three minutes to remove the outer egg membrane of the zebrafish embryo. The decapsulated zebrafish embryos were randomly distributed into the blank control, metronidazole model, and different concentration groups of polysaccharides (10 per well), and the growth of the zebrafish and fluorescence intensity of skin cells were observed under a fluorescence microscope after 24 h culture at 28 °C. The number of fluorescent spots of skin cells in each group was counted using Image J software (v1.8.0), and the results were statistically analyzed using GraphPad Prism software (v8.0.1.244). The relative antioxidant capacity of each group of samples was calculated using the following formula, relative anti-apoptotic capacity (%) = (A1 − A2)/(A0 − A2) × 100, where the blank group’s fluorescent signal is denoted as A0, while the sample and control groups’ fluorescent signals are denoted as A1 and A2, respectively.

2.12.2. RT-qPCR Analysis

The mRNA expression level in zebrafish cells was determined using the quantitative RT-PCR method. Total RNA was isolated from 30 zebrafish larvae in each experiment group with TRIzol reagent. cDNA was synthesized using Prime Script RT Kit (Takara, Tokyo, Japan) according to the manufacturer’s instructions. Real-time fluorescence quantification PCR was performed with SYBR Green (Takara, Tokyo, Japan), with three biological replicates for each group. The housekeeping gene β-actin was used as an internal reference gene to normalize the data, and the relative gene expression levels of the groups were calculated. The primers used in this research are presented in Table S1.

2.13. Anti-Inflammation Activity Evaluation

Female and male zebrafish were separately cultured under alternating light and dark conditions, and fertilized eggs were obtained and transferred into zebrafish embryo culture water (containing 5.0 mM NaCl, 0.17 mM KCl, 0.4 mM CaCl2, and 0.16 mM MgSO4) and cultured under controlled light at 28 °C. At three dpf, normally developing zebrafish embryos were selected and transferred into 24-well plates, with 10 zebrafish embryos per well, and two replicated experimental wells for each condition. Control, model, resveratrol positive drug, and polysaccharide sample groups were established. A total of 20 μM of resveratrol was added to the positive drug group, polysaccharide solution was added to the sample group, and no drug was added to the control and model groups. Then, 2.0 mL of cultured water was added to each group. The 24-well plate was then placed in a 28 °C illuminated incubator for the embryos to continue developing. After two hours of incubation, the model, positive drug, and sample groups were treated with 20 μM of CuSO4 for one hour, and then they continued to be cultured in the dark at 28 °C. The macrophage inflammatory response was observed under a fluorescence microscope (SZX16 type fluorescence microscope; Olympus, Japan), and the number of macrophages around the neural crest was counted to evaluate its anti-inflammatory activity.

3. Results and Discussion

3.1. Strain Identification

M. esculenta is a widely distributed, edible, and medicinal wild mushroom with significant commercial value. In this study, the mycelia of M. esculenta were isolated and cultured from its fruiting bodies. As shown in Figure 1a, the mycelia initially appeared white on the PDA plate, but they then turned slightly yellow in the middle stage, and finally darkened to brown. The chromosome DNA was extracted from the isolated strain, and its ITS sequence was amplified and analyzed in the NCBI database. A phylogenetic tree was constructed using the neighbor-joining method. As shown in Figure S1, the morel belonged to the same branch as M. esculenta (MH517438.1), with a confidence level of 100%. Combined with the observations of mycelial morphology, it was identified as M. esculenta and named MS-1.

3.2. Determination of Liquid Fermentation Medium Conditions

3.2.1. Screening of Single Factors in Medium

The synthesis of microbial extracellular polysaccharides is closely related to the composition of the medium [33]. The main factors affecting the production of morel polysaccharides are the carbon and nitrogen sources, inorganic salts, temperature, etc. [34]. In this study, maltose, glucose, fructose, xylose, and sucrose were used as carbon sources to ferment the morel polysaccharides. As shown in Figure 1b, when glucose was used as a carbon source, the yield of morel extracellular polysaccharides in the liquid fermentation was 1.46 g/L, and the dry weight of mycelia reached 4.5 g/L.
The type of nitrogen source affects the growth of cells and the synthesis of proteins, thereby affecting the expression of extracellular polysaccharides [35]. In this study, peptone, yeast extract, ammonium chloride, ammonium sulfate, and sodium nitrate were used as nitrogen sources for the fermentation of MS-1. The results are shown in Figure 1c. When the yeast extract was used as a nitrogen source, the yield of extracellular polysaccharides of MS-1 was 1.19 g/L, and the dry weight of mycelia was 4.17 g/L. The results show that using yeast extract as a nitrogen source significantly promotes strain growth and increases exopolysaccharide production.
Inorganic salts are important for cell signaling, enzymatic catalysis, and transmembrane transport [6]. In this study, copper sulfate, ammonium chloride, ferrous sulfate, sodium chloride, and potassium dihydrogen phosphate were used as inorganic salt components to produce extracellular polysaccharides from the liquid fermentation of MS-1. The dry weights of the mycelia were 0.44 g, 3.03 g, 6.77 g, 2.78 g, and 2.55 g and the yields of the extracellular polysaccharides of MS-1 were 0.06 g, 0.74 g, 1.13 g, 2.19 g, and 1.04 g. Among them, when NaCl was used as an inorganic salt, the yield of extracellular polysaccharides was the highest, reaching 2.19 g/L (Figure 1d).

3.2.2. Single-Factor Concentration Determination

The single factor of culture media components affecting the polysaccharide yield of MS-1 was tested. It was found that when 3% glucose was added, the extracellular polysaccharide yield of MS-1 was the highest, reaching 1.31 g/L. When 1.5% yeast extract was added, the yield of extracellular polysaccharides was the highest, reaching 2.05 g/L. When 0.2% sodium chloride was added, the yield of extracellular polysaccharides was the highest, reaching 2.06 g/L. The results of the optimal addition screening are shown in Figure 1e–g. The above experimental results show that different types of nutritional components and their concentrations in the fermentation medium have a significant impact on the yield of polysaccharides in MS-1.

3.2.3. Box–Behnken Central Composite Experiment

Based on the experimental results, when using carbon and nitrogen sources and inorganic salts for the liquid fermentation of MS-1, response surface analysis of the fermentation conditions was carried out. The experimental results are shown in Table S2. The regression simulation variance analysis data are shown in Table S3. According to the regression model variance in Table S3, the multiple correlation coefficient R2 = 97.78%, indicating that the polynomial model equation has a higher degree of fit, and there is a significant correlation between the predicted and measured values. The model group F = 34.04, p = 0.0001, indicating that the regression model is significant; the inadequate item F = 3.75, p = 0.1170 > 0.05, indicating that the inadequate item is not significant. Therefore, this model can be used to analyze and predict the yield of extracellular polysaccharides during MS-1 fermentation, as shown in Figure 2a–c. Comparing the two-way interaction effects of three factors on extracellular polysaccharides according to the response surface graph, it can be seen that AB > BC > AC. According to the predicted results of the response surface experiment, when 3.7% glucose was added to the medium, 2% yeast extract was added, and 0.15% sodium chloride was added, the yield of extracellular polysaccharides is 1.08 times larger than the maximum yield in the response surface experiment and 2.54 times larger than the yield under the original liquid fermentation culture conditions. These culture parameters represent the optimized culture composition for the production of extracellular polysaccharides using MS-1 liquid fermentation. By optimizing the carbon and nitrogen sources and inorganic salts, we successfully augmented exopolysaccharide production.

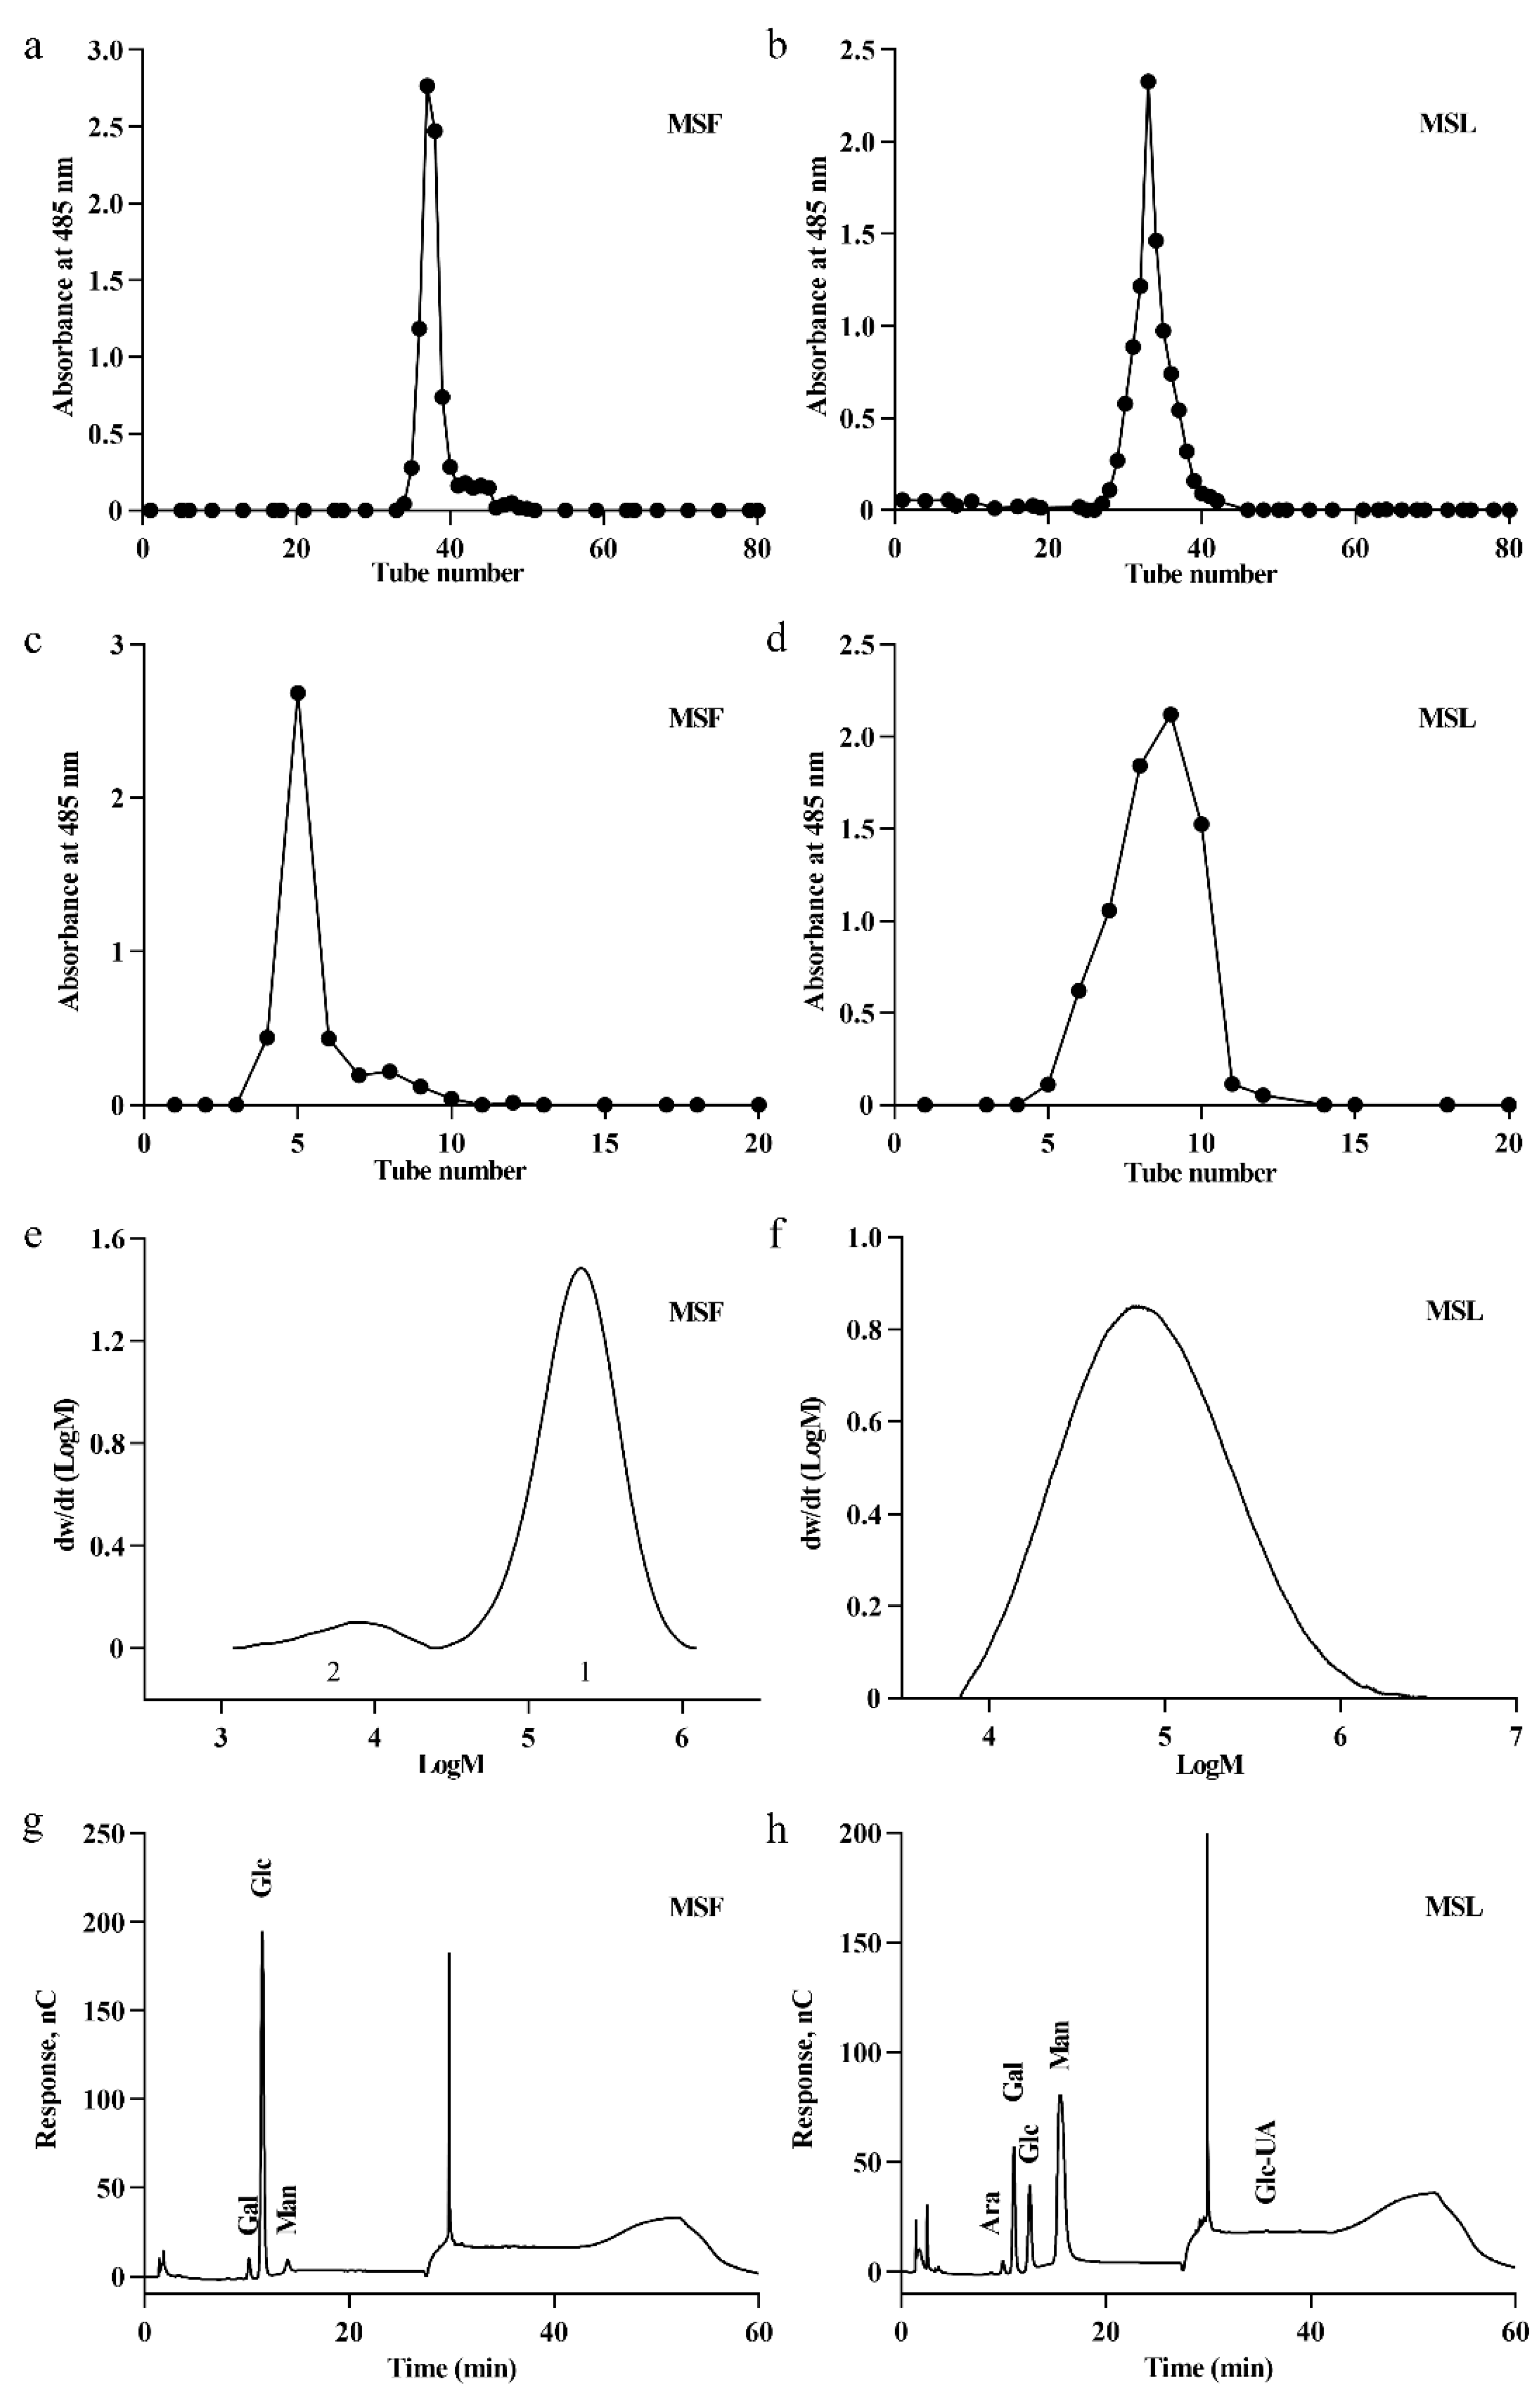
3.3. Isolation and Purification of Polysaccharides

These optimized liquid fermentation conditions could lead to the increased production of exopolysaccharides by MS-1. The polysaccharides produced by MS-1 may have distinct properties when cultivated under solid conditions versus liquid fermentation conditions. Therefore, we have separately isolated and extracted the polysaccharides from MS-1 under different cultivation conditions for analysis. The extraction of polysaccharides involves several stages, including hot water extraction, anhydrous ethanol precipitation, and Sevag reagent deproteinization. DEAE-52 ion exchange and Sephadex G-100 column chromatography were used to obtain the polysaccharides in the fruit body (MSF) and the polysaccharides in the fermentation liquid (MSL) of MS-1. Only a single peak was observed in the plots of MSF (Figure 3a,c) or fermented liquid polysaccharide MSL (Figure 3b,d), indicating the high-level homogeneity of the polysaccharides.

3.4. Analysis of the Molecular Weights of MSF and MSL

The molecular weight of polysaccharides obtained using different fermentation methods is different, and the molecular weight of the polysaccharides directly affects their antioxidant properties [36,37]. The molecular weights of the polysaccharides MSF and MSL were determined using gel permeation chromatography and analyzed using GPC software (A.02.01) [38]. The results are shown in Figure 3e,f; the calculated Mws of MSF and MSL were 2.43 × 10⁵ Da and 1.40 × 10⁵ Da, respectively (Table 1).

3.5. Analysis of the Monosaccharide Composition of MSF and MSL

The composition of monosaccharides in a polysaccharide is a critical factor influencing its structure and bioactivities [39,40]. The monosaccharide compositions of MSF and MSL were analyzed using ion chromatography. MSF is composed of Gal, Glc, and Man at a molar ratio of 4.34%:90.22%:5.45% (Figure 3g and Table S4). Glc is the main monosaccharide component of MSF. Man is the main monosaccharide component of MSL, which is composed of Ara, Gal, Glc, Man, and GlcA, with molar ratios of 0.31%:14.71%:13.03%:71.43%:0.53%, respectively (Figure 3h and Table S4). Therefore, the fermentation process of MS-1 significantly affects the composition of the polysaccharides MSF and MSL.

3.6. Analysis of FTIR Spectra of MSF and MSL

FTIR is an important method for analyzing polysaccharide structure and group characteristics. By using the absorption characteristics of different wavelengths of infrared radiation within the polysaccharide molecules, their molecular structure and chemical composition can be analyzed, including their monosaccharide configuration, glycosidic bond type, and functional groups [41,42]. The infrared spectra of MSF and MSL are shown in Figure 4a,b. The vibrations at 810–900/cm−1 in the polysaccharide samples MSF and MSL are characteristic of β-glycosides [43]. In the 950–1200/cm−1 range, MSF and MSL have three characteristic absorption peaks [28], indicating that both MSF and MSL possess the bending vibration mode of pyranose from C=O stretching. The absorbance of polysaccharides at 1390/cm−1 corresponds to the deformation vibration of CH2 [29]. The absorption peak in the 1350–1485/cm−1 range is due to the bending vibration of -CH(O-CH2). The absorption at 1500/cm−1 may be attributed to the N-H bending vibration. The absorption peak that MSF and MSL show at 1650/cm−1 is caused by the stretching vibration of a free carboxyl group [44]. The smaller absorption peak at 2350/cm−1 in MSF indicates the presence of a small amount of carbon–carbon triple bonds in the polysaccharide. The absorption peak that appears in MSF and MSL in the 2850–2950/cm−1 range may be due to the existence of C-H band [45]. MSF and MSL both have strong absorption peaks in the 3100–3500/cm−1 range, belonging to the O=H band [46]. All of the above absorption bands are characteristic FTIR peaks of carbohydrate polymers, mainly demonstrating the polysaccharidic nature of MSF and MSL [47]. By analyzing the infrared spectra, it can be seen that there are marked differences between the two types of polysaccharides, indicating significant differences in bond structure and group arrangement in the polysaccharides produced by different methods of fermentation M. esculenta mushrooms.

3.7. TG of MSF and MSL

Thermal stability will directly affect the change in polysaccharide mass in accordance with time and temperature [48]. The separation of polysaccharides from free and bound water and the fracture of pyrolysis bonds occurred in different temperature ranges [49]. The TG (%) and derivative DTG (DTG, %/min) curves represent the sample’s weight changes [50], which are helpful for analyzing the thermal stability of MSF and MSL in the polysaccharide samples. Figure 4c,d show that, in the first stage, when MSF and MSL are heated from room temperature to 100 °C, the weight loss rates are 8.2% and 12.2%, respectively; especially, at about 70 °C, the weight loss rate is high, which is related to the evaporation of free water combined with MSF and MSL. The weight loss rates of MSF and MSL are 44.6% and 52.2%, respectively, at 285–400 °C during the second temperature change stage, which may be due to the water generated by the combination of hydrogen and hydroxide in the polysaccharide samples after gradually losing the structure [38]. The weight loss rates of MSF and MSL samples were 14.3% and 12.8%, respectively, in the third temperature change stage, 400–800 °C, and the loss of polysaccharide mass at this stage was mainly caused by decarboxylation. The above results show that MSF has better thermal stability than MSL does.

3.8. Surface Characterization of MSF and MSL

The composition of biological polysaccharides determines the microstructure of its surface morphology [51]. SEM was used to observe the surface morphology of polysaccharide MSF and MSL, as shown in Figure 4e,f. The SEM images show that MSF is rod-like or spindle-like, some polysaccharides are fragmented, the surface is smooth, and the width is 1–10 μm. MSL is mainly composed of fragmentary, spherical, and fine rods; they are more loosely distributed, the spherical structure of the polymer gathered together, the surface fold is rough, and the width is 1–10 μm. It can be seen from the structure that MSL has a pore morphology [51]. Different cultivation methods lead to different monosaccharide compositions of polysaccharides, which, in turn, affect the surface morphology of the polysaccharides.

3.9. Antioxidant Activity Analysis of MSF and MSL

·OH can cause serious damage to neighboring biomolecules, leading to cancer and a variety of diseases, and the removal of hydroxyl radicals is conducive to maintaining the normal metabolic activities of cells [52]. As shown in Figure 5a, both MSF and MSL in the polysaccharide samples have obvious scavenging effects on ·OH within the range of 2–10 mg/mL mass concentration, and the removal efficiency of ·OH becomes more obvious with the increase in polysaccharide concentration. The same effect is also observed for the polysaccharides of Zizyphus Jujuba cv. Jinsixiaozao [40]. When the concentration of MSF and MSL was 10 mg/mL, the ·OH clearance rates were 36.2% and 34.1%, respectively. The above results show that the polysaccharides MSF and MSL are highly efficient at removing ·OH.
DPPH is a stable free radical that is easily cleared by antioxidants [40]. Therefore, DPPH free radical scavenging assays have been widely used to evaluate the antioxidant activity of polysaccharides in vitro [53,54]. At concentrations of 2, 4, 6, 8, and 10 mg/mL, the scavenging activity levels of MSF on DPPH· were 9.2%, 12.5%, 17.5%, 21.4%, and 23.4%, respectively (Figure 5b). The results indicated that MSF had a certain clearance effect on DPPH and showed a dose–response relationship. At concentrations of 2, 4, 6, 8, and 10 mg/mL, the DPPH scavenging activity levels of MSL extracted from liquid fermentation supernatant were 39.8%, 51.6%, 63.6%, 72.9%, and 85.1%, respectively. When the mass concentration of polysaccharides reached 10 mg/mL, the DPPH clearance rate of MSL was 3.64 times larger than that of MSF, and it had more effective antioxidant activity.
FRAP analysis is used to consider the antioxidants in the sample as important substances in an oxidation–reduction-related colorimetric reaction [55]. This method can be used to analyze the antioxidant activity of polysaccharides by measuring the reducing capacity of Fe2+ [56]. The Fe2+ reducing capacity of MSF and MSL was tested, with ascorbic acid as a positive control sample. As shown in Figure 5c, positive control ascorbate showed a very strong reducing ability. At concentrations of 2, 4, 6, 8, and 10 mg/mL, the reducing capacities of MSF are equivalent to 18.9, 34.8, 50.1, 64.2, and 79.1 μmol/L Fe2+, respectively. MSL also exhibited a higher antioxidant activity level than MSF did, and its antioxidant capacity was enhanced with the increase in polysaccharide concentration. This finding is consistent with the results of ferric ion reducing ability studies of Sargassum fusiforme polysaccharides [57]. The reducing capacities of MSL were equivalent to 71.5, 134.1, 184.2, 223.2, and 248.8 μmol/L Fe2+ at the measured concentration of 2, 4, 6, 8, and 10 mg/mL, respectively. When the polysaccharide concentration was 10 mg/mL, the Fe2+ reducing capacity of MSL was 3.15 times larger than that of MSF.

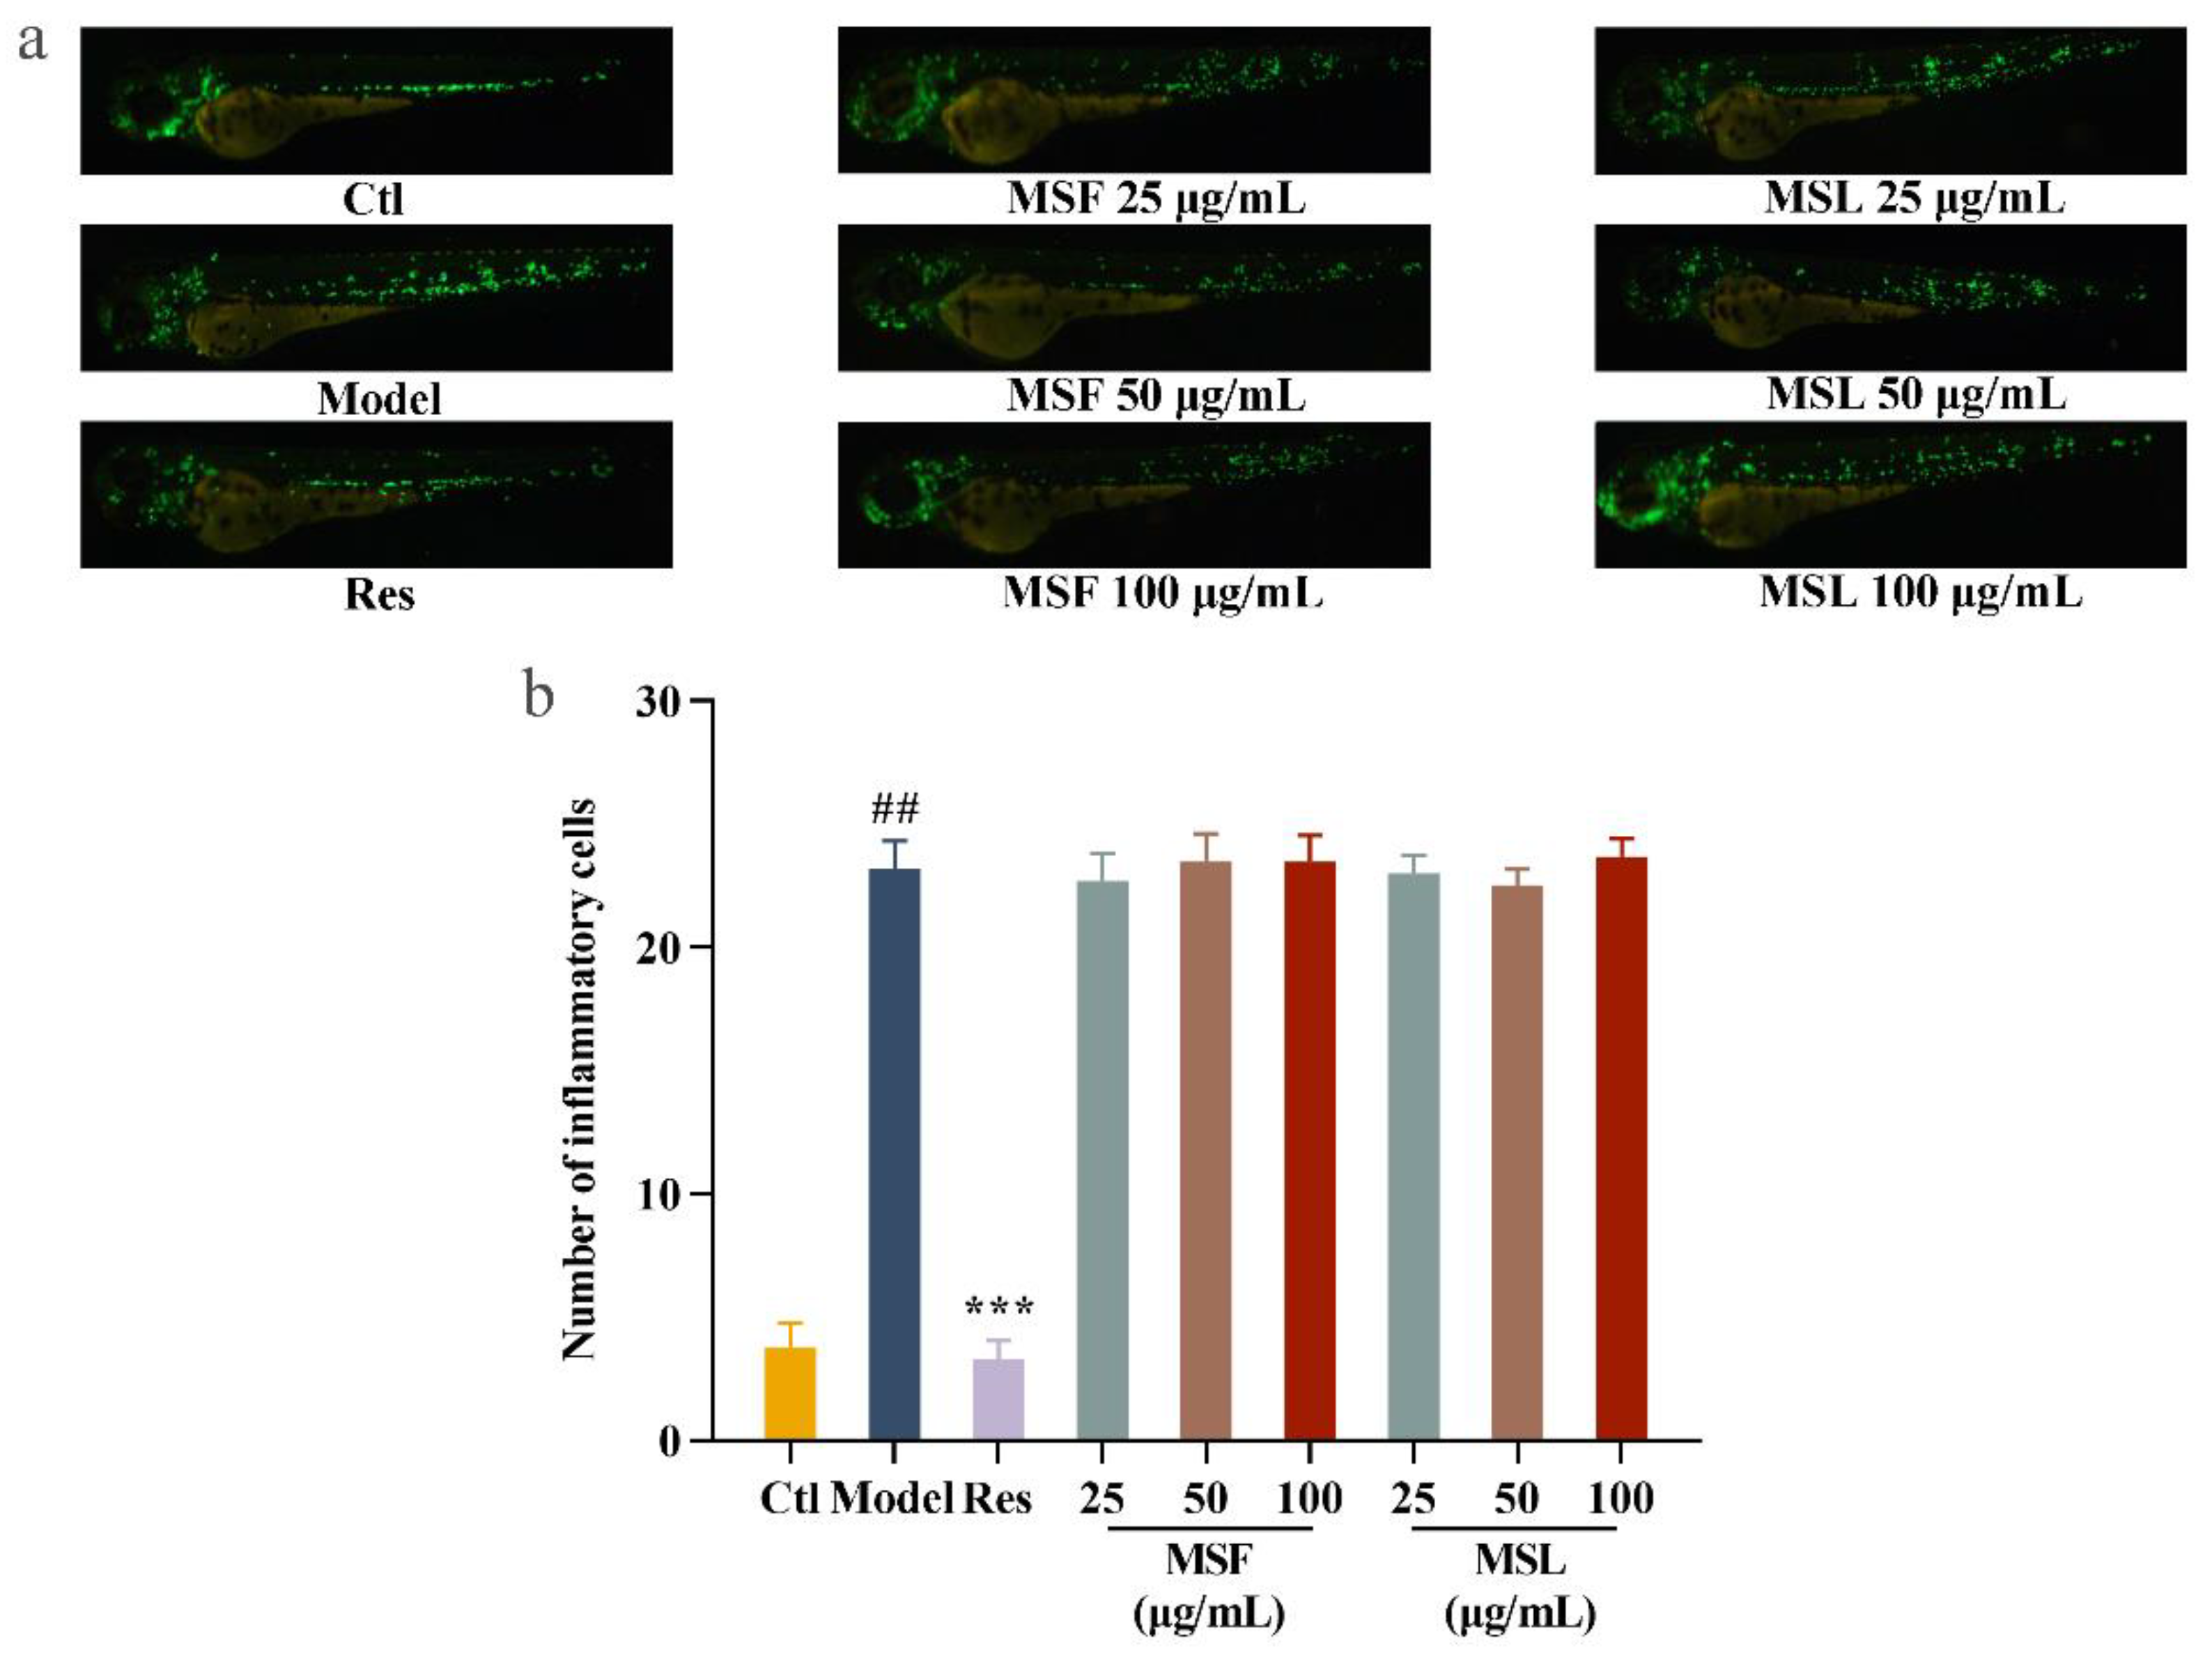
3.10. Effect of MSF and MSL Levels and Antioxidant Activities in Metronidazole-Induced Zebrafish Embryos

Numerous natural polysaccharides are effective at shielding cells against oxidative damage [58], making their antioxidant activity within cells a pivotal indicator for evaluating the biological potency of polysaccharides [59,60]. Indeed, to demonstrate the antioxidant effects of polysaccharides, we explored the effects of MTZ, MSF, and MSL on zebrafish larvae. By fusing nitro reductase (NTR) with green fluorescent protein (GFP) at the C-terminal, transgenic zebrafish-expressing GFP were obtained. The MSF sample concentrations were set at 250, 500, and 1000 μg/mL, followed by MSL sample concentrations of 25, 50, and 100 μg/mL, respectively. The in vivo antioxidant activity of MSF and MSL was evaluated by administering MTZ and MSF and MSL (sample group) to the zebrafish embryos at 24 hpf. The treatment without MTZ represents the blank control group, the treatment with a final concentration of 5 mM MTZ represents the model group, and the treatment with MTZ and the polysaccharides represents the sample group. Figure 6a shows the changes in fluorescent cells in the zebrafish treated with different concentrations of MTZ, MSF, and MSL in the sample group. As can be seen from Figure 6b, the number of fluorescent cells in the Ctl blank group was about 1513, while that in the MTZ model group was significantly reduced to about 119. In the sample group, the addition of MSF and MSL significantly increased the number of fluorescent cells compared with that in the model group, and the change in fluorescent cells was positively correlated with the change in polysaccharide concentration. The anti-oxidation protection rates of MSF at 250, 500, and 1000 μg/mL were 4.71%, 66.21%, and 32.26%, respectively. The anti-oxidation protection rates of MSL at concentrations of 25, 50, and 100 μg/mL were 6.15%, 33.45%, and 30.82%, respectively (Figure 6c). In the model group, the addition of MTZ caused the apoptosis of zebrafish surface cells, and the fluorescence spots in the model group disappeared more than those in the control group, while the sample groups significantly reduced the damage of zebrafish epidermal cells caused by MTZ after the addition of polysaccharide samples with different concentrations of MSF or MSL. Therefore, both the MSF and MSL polysaccharide samples effectively reduced the oxidative damage caused by MTZ to the zebrafish. In addition, the concentration of polysaccharide MSL in the fermentation broth was significantly lower than that of the polysaccharide in the fruit body of M. esculenta, and the antioxidant efficiencies were similar.
In response to cellular oxidative stress, antioxidant enzymes defend against free radical harm. Zebrafish epidermal cells’ antioxidant capacity correlates with the level of related enzyme gene activity [61]. Thus, our objective here was to elucidate the mechanism behind the antioxidant impact of morel polysaccharides on zebrafish. In this study, the genes of Mn-SOD, Cu-Zn-SOD, Keap1, and Nrf2 in the zebrafish were selected as important marker genes for antioxidant levels in zebrafish [62]. Among them, the higher the transcription activity level of Mn-SOD and Cu-Zn-SOD is, the stronger the antioxidant capacity is. The expression intensity of Keap1 was inversely related to the antioxidant level of cells. SOD expression was upregulated in the model group and downregulated in the sample group, indicating that the expression of oxygen free radicals was reduced. The expression intensity of Keap1 in the model group cells was upregulated, indicating that the oxidation level of the cells was increased. The expression intensity of Keap1 decreased after the addition of polysaccharides MSF and MSL in the sample group, indicating that the polysaccharide MSF and MSL inhibited the transcriptional activity of Keap1 gene, thereby improving the antioxidant levels of cells. The upregulation of Nrf2 expression in the model group indicated that the oxidation levels in the model group increased, and the transcription levels decreased with the increase in sample concentration, while the oxidation levels in the sample group decreased, indicating that the polysaccharide samples MSF and MSL had oxidative repair effects (Figure 6d–g). These results indicate that the changes in the transcription intensity of the antioxidation-related genes in zebrafish cells further support the antioxidant activity of M. esculenta polysaccharides in zebrafish cells.

3.11. Anti-Inflammatory Effects of Polysaccharides MSF and MSL

Biological polysaccharides can significantly inhibit the inflammatory response of cells. In this study, zebrafish were used as a biological model. In the zebrafish larva model group treated with CuSO4, the level of migration and accumulation of inflammatory cells increased by 30.6 times compared to that of the blank group treated without CuSO4. The resveratrol-treated Zebrafish larva model group exhibited significantly reduced cell inflammatory damage induced by CuSO4. This indicates that the CuSO4-induced zebrafish inflammation model was successfully established [63]. After the polysaccharide MSF and MSL treatments of the zebrafish larvae model group, there was no significant change in fluorescence cell migration compared with the model group (Figure 7a,b). The results showed that the polysaccharide samples MSF and MSL had no significant inhibitory effect on zebrafish inflammation.

4. Conclusions

This study isolated M. esculenta MS-1 from wild morel fruiting bodies and obtained the polysaccharide samples MSF and MSL from morel fruiting bodies and the fermentation liquid of M. esculenta MS-1, respectively. The physicochemical properties of the polysaccharides MSF and MSL were characterized, which included molecular weight and monosaccharide composition analyses and an in vivo antioxidant test. The results showed that M. esculenta produced polysaccharides with different molecular weights and monosaccharide compositions under different cultivation conditions. The antioxidant activity of the polysaccharide MSL produced under liquid fermentation conditions is superior to that of the polysaccharide MSF from the fruiting bodies, and the antioxidant effect of polysaccharide MSL is positively correlated with its concentration.
In order to further increase the polysaccharide yield of M. esculenta MS-1 under liquid fermentation conditions, this study used single-factor control experiments on the culture medium components and response surface optimization fermentation experiments to study the effects of carbon and nitrogen sources and inorganic salts in the culture medium; the optimal ratio of carbon and nitrogen sources and inorganic salts in fermentation culture medium were determined, i.e., glucose 3.7%, yeast extract 2%, and sodium chloride 0.15%. Finally, the extracellular polysaccharide yield of M. esculenta MS-1 after optimization of liquid culture medium components was 2.54 times higher than that before the optimization. Therefore, this study significantly improved the polysaccharide yield of M. esculenta under liquid fermentation conditions.
The production of morel fruiting bodies has a long production cycle, high production costs, and a high risk, which often leads to the reduction in or even extinction of fruiting bodies due to environmental factors [64]. The production of polysaccharides using the morel liquid fermentation method is highly efficient, stable, and is not easily affected by environmental factors [20]. More importantly, the polysaccharides derived from liquid fermentation conditions have more effective antioxidant biological activity than do the polysaccharides derived from fruiting bodies. Therefore, this study provides a convenient and efficient fermentation method for the production of morel polysaccharides. In particular, it is of great significance for expanding the applications and value of morel. This study will also benefit the application of morel polysaccharides in food and health products.

Supplementary Materials

The following supporting information can be downloaded at: https://www.mdpi.com/article/10.3390/fermentation10010046/s1, Figure S1: Gel permeation chromatography of the monosaccharide standards; Figure S2: Phylogenetic tree analysis of Morchella esculenta; Table S1: Primer pairs used in real-time quantitative PCR assay; Table S2: Analysis of response surface experiment results; Table S3: Regression analysis of variance; Table S4: Monosaccharide composition of MSF and MSL.

Author Contributions

Z.L. and X.L. designed the experiments and wrote the manuscript; Z.L., X.L. and M.C. analyzed the data; X.L., Q.S., S.L., W.C., Z.S., Z.X., L.X. and Z.L. performed the experiments. All authors have read and agreed to the published version of the manuscript.

Funding

This work was supported by the Natural Science Foundation of Shandong Province (ZR2023MC052, ZR2020MC013), a project of the Qilu University of Technology (2022PYI005).

Institutional Review Board Statement

All animal experiments complied with the Animal Welfare Ethical Committee and were endorsed by the Animal Welfare Ethical Committee of the Biological Research Institute at the Shandong Provincial Academy of Sciences (SWS20230116). Approval date was given on 13 January 2023.

Informed Consent Statement

Not applicable.

Data Availability Statement

All data generated or analyzed during this study are included in this published article (and its Supplementary Information files).

Acknowledgments

We thank Rongchun Wang for the anti-inflammatory and antioxidant capacity assay in zebrafish model.

Conflicts of Interest

The authors declare no conflicts of interest.

References

  1. Sunil, C.; Xu, B. Mycochemical profile and health-promoting effects of morel mushroom Morchella esculenta (L.)—A review. Food Res. Int. 2022, 159, 111571. [Google Scholar] [CrossRef] [PubMed]
  2. Li, J.; Wu, H.; Liu, Y.; Nan, J.; Park, H.J.; Chen, Y.; Yang, L. The chemical structure and immunomodulatory activity of an exopolysaccharide produced by Morchella esculenta under submerged fermentation. Food Funct. 2021, 12, 9327–9338. [Google Scholar] [CrossRef] [PubMed]
  3. Lee, S.R.; Roh, H.-S.; Lee, S.; Park, H.B.; Jang, T.S.; Ko, Y.-J.; Baek, K.-H.; Kim, K.H. Bioactivity-guided isolation and chemical characterization of antiproliferative constituents from morel mushroom (Morchella esculenta) in human lung adenocarcinoma cells. J. Funct. Foods 2018, 40, 249–260. [Google Scholar] [CrossRef]
  4. Longley, R.; Benucci, G.M.N.; Mills, G.; Bonito, G. Fungal and bacterial community dynamics in substrates during the cultivation of morels (Morchella rufobrunnea) indoors. FEMS Microbiol. Lett. 2019, 366, fnz215. [Google Scholar] [CrossRef] [PubMed]
  5. Fu, L.; Wang, Y.; Wang, J.; Yang, Y.; Hao, L. Evaluation of the antioxidant activity of extracellular polysaccharides from Morchella esculenta. Food Funct. 2013, 4, 871–879. [Google Scholar] [CrossRef] [PubMed]
  6. Hsieh, C.; Tseng, M.-H.; Liu, C.-J. Production of polysaccharides from Ganoderma lucidum (CCRC 36041) under limitations of nutrients. Enzym. Microb. Technol. 2006, 38, 109–117. [Google Scholar] [CrossRef]
  7. Zhang, C.; Song, X.; Cui, W.; Yang, Q. Antioxidant and anti-ageing effects of enzymatic polysaccharide from Pleurotus eryngii residue. Int. J. Biol. Macromol. 2021, 173, 341–350. [Google Scholar] [CrossRef]
  8. Sun, Y.; Huo, J.; Zhong, S.; Zhu, J.; Li, Y.; Li, X. Chemical structure and anti-inflammatory activity of a branched polysaccharide isolated from Phellinus baumii. Carbohydr. Polym. 2021, 268, 118214. [Google Scholar] [CrossRef]
  9. Shi, M.; Zhang, Z.; Yang, Y. Antioxidant and immunoregulatory activity of Ganoderma lucidum polysaccharide (GLP). Carbohydr. Polym. 2013, 95, 200–206. [Google Scholar] [CrossRef]
  10. Liu, X.; Hou, R.; Xu, K.; Chen, L.; Wu, X.; Lin, W.; Zheng, M.; Fu, J. Extraction, characterization and antioxidant activity analysis of the polysaccharide from the solid-state fermentation substrate of Inonotus hispidus. Int. J. Biol. Macromol. 2019, 123, 468–476. [Google Scholar] [CrossRef]
  11. Yu, J.; Ji, H.-Y.; Liu, A.-J. Alcohol-soluble polysaccharide from Astragalus membranaceus: Preparation, characteristics and antitumor activity. Int. J. Biol. Macromol. 2018, 118, 2057–2064. [Google Scholar] [CrossRef] [PubMed]
  12. Xue, H.; Wang, W.; Bian, J.; Gao, Y.; Hao, Z.; Tan, J. Recent advances in medicinal and edible homologous polysaccharides: Extraction, purification, structure, modification, and biological activities. Int. J. Biol. Macromol. 2022, 222, 1110–1126. [Google Scholar] [CrossRef]
  13. Li, W.; Cai, Z.-N.; Mehmood, S.; Wang, Y.; Pan, W.-J.; Zhang, W.-N.; Lu, Y.-M.; Chen, Y. Polysaccharide FMP-1 from Morchella esculenta attenuates cellular oxidative damage in human alveolar epithelial A549 cells through PI3K/AKT/Nrf2/HO-1 pathway. Int. J. Biol. Macromol. 2018, 120, 865–875. [Google Scholar] [CrossRef] [PubMed]
  14. Wang, D.; Yin, Z.; Ma, L.; Han, L.; Chen, Y.; Pan, W.; Gong, K.; Gao, Y.; Yang, X.; Chen, Y.; et al. Polysaccharide MCP extracted from Morchella esculenta reduces atherosclerosis in LDLR-deficient mice. Food Funct. 2021, 12, 4842–4854. [Google Scholar] [CrossRef] [PubMed]
  15. Yan, M.-Q.; Feng, J.; Liu, Y.-F.; Hu, D.-M.; Zhang, J.-S. Functional Components from the Liquid Fermentation of Edible and Medicinal Fungi and Their Food Applications in China. Foods 2023, 12, 2086. [Google Scholar] [CrossRef] [PubMed]
  16. Confortin, F.G.; Marchetto, R.; Bettin, F.; Camassola, M.; Salvador, M.; Dillon, A.J.P. Production of Pleurotus sajor-caju strain PS-2001 biomass in submerged culture. J. Ind. Microbiol. Biotechnol. 2008, 35, 1149–1155. [Google Scholar] [CrossRef] [PubMed]
  17. Chen, W.; Zhao, Z.; Chen, S.-F.; Li, Y.-Q. Optimization for the production of exopolysaccharide from Fomes fomentarius in submerged culture and its antitumor effect in vitro. Bioresour. Technol. 2008, 99, 3187–3194. [Google Scholar] [CrossRef]
  18. Zhou, J.; Yang, C.; Meng, Q.; Fu, S. Characterization of Secondary Metabolites from Mycelial Cultures of Black Morel Mushroom Morchella importuna (Ascomycota). Int. J. Med. Mushrooms 2023, 25, 49–54. [Google Scholar] [CrossRef]
  19. Yang, C.; Jiang, X.; Ma, L.; Xiao, D.; Liu, X.; Ying, Z.; Li, Y.; Lin, Y. Transcriptomic and Metabolomic Profiles Provide Insights into the Red-Stipe Symptom of Morel Fruiting Bodies. J. Fungi 2023, 9, 373. [Google Scholar] [CrossRef]
  20. López-Legarda, X.; Rostro-Alanis, M.; Parra-Saldivar, R.; Villa-Pulgarín, J.A.; Segura-Sánchez, F. Submerged cultivation, characterization and in vitro antitumor activity of polysaccharides from Schizophyllum radiatum. Int. J. Biol. Macromol. 2021, 186, 919–932. [Google Scholar] [CrossRef]
  21. Zhao, P.; Guan, M.; Tang, W.; Walayat, N.; Ding, Y.; Liu, J. Structural diversity, fermentation production, bioactivities and applications of triterpenoids from several common medicinal fungi: Recent advances and future perspectives. Fitoterapia 2023, 166, 105470. [Google Scholar] [CrossRef] [PubMed]
  22. He, N.; Yang, X.; Jiao, Y.; Tian, L.; Zhao, Y. Characterisation of antioxidant and antiproliferative acidic polysaccharides from Chinese wolfberry fruits. Food Chem. 2012, 133, 978–989. [Google Scholar] [CrossRef]
  23. Li, Y.; Yuan, Y.; Lei, L.; Li, F.; Zhang, Y.; Chen, J.; Zhao, G.; Wu, S.; Yin, R.; Ming, J. Carboxymethylation of polysaccharide from Morchella angusticepes Peck enhances its cholesterol-lowering activity in rats. Carbohydr. Polym. 2017, 172, 85–92. [Google Scholar] [CrossRef] [PubMed]
  24. Li, S.; Sang, Y.; Zhu, D.; Yang, Y.; Lei, Z.; Zhang, Z. Optimization of fermentation conditions for crude polysaccharides by Morchella esculenta using soybean curd residue. Ind. Crop. Prod. 2013, 50, 666–672. [Google Scholar] [CrossRef]
  25. Ge, Y.; Duan, Y.; Fang, G.; Zhang, Y.; Wang, S. Polysaccharides from fruit calyx of Physalis alkekengi var. francheti: Isolation, purification, structural features and antioxidant activities. Carbohydr. Polym. 2009, 77, 188–193. [Google Scholar] [CrossRef]
  26. Zhou, S.; Huang, G. Extraction, structural analysis and antioxidant activity of aloe polysaccharide. J. Mol. Struct. 2023, 1273, 134379. [Google Scholar] [CrossRef]
  27. Garai, D.; Kumar, V. A Box–Behnken design approach for the production of xylanase by Aspergillus candidus under solid state fermentation and its application in saccharification of agro residues and Parthenium hysterophorus L. Ind. Crop. Prod. 2013, 44, 352–363. [Google Scholar] [CrossRef]
  28. Jiang, J.; Kong, F.; Li, N.; Zhang, D.; Yan, C.; Lv, H. Purification, structural characterization and in vitro antioxidant activity of a novel polysaccharide from Boshuzhi. Carbohydr. Polym. 2016, 147, 365–371. [Google Scholar] [CrossRef]
  29. Zhu, H.; Tian, L.; Zhang, L.; Bi, J.; Song, Q.; Yang, H.; Qiao, J. Preparation, characterization and antioxidant activity of polysaccharide from spent Lentinus edodes substrate. Int. J. Biol. Macromol. 2018, 112, 976–984. [Google Scholar] [CrossRef]
  30. Xiong, S.L.; Li, A.; Huang, N.; Lu, F.; Hou, D. Antioxidant and immunoregulatory activity of different polysaccharide fractions from tuber of Ophiopogon japonicus. Carbohydr. Polym. 2011, 86, 1273–1280. [Google Scholar] [CrossRef]
  31. Mensor, L.L.; Menezes, F.S.; Leitão, G.G.; Reis, A.S.; dos Santos, T.C.; Coube, C.S.; Leitão, S.G. Screening of Brazilian plant extracts for antioxidant activity by the use of DPPH free radical method. Phytother. Res. 2001, 15, 127–130. [Google Scholar] [CrossRef] [PubMed]
  32. Fakhfakh, J.; Athmouni, K.; Mallek-Fakhfakh, H.; Ayedi, H.; Allouche, N. Polysaccharide from Lycium arabicum: Structural Features, in Vitro Antioxidant Activities and Protective Effect against Oxidative Damage in Human Erythrocytes. Chem. Biodivers. 2020, 17, e2000614. [Google Scholar] [CrossRef] [PubMed]
  33. Yu, C.; Fang, Y.; Huang, W.; Lei, P.; Xu, X.; Sun, D.; Wu, L.; Xu, H.; Li, S. Effect of surfactants on the production and biofunction of Tremella fuciformis polysaccharide through submerged fermentation. LWT 2022, 163, 113602. [Google Scholar] [CrossRef]
  34. He, H.; Li, Y.; Fang, M.; Li, T.; Liang, Y.; Mei, Y. Carbon Source Affects Synthesis, Structures, and Activities of Mycelial Polysaccharides from Medicinal Fungus Inonotus obliquus. J. Microbiol. Biotechnol. 2021, 31, 855–866. [Google Scholar] [CrossRef] [PubMed]
  35. Feng, J.; Feng, N.; Tang, Q.-J.; Liu, Y.-F.; Yang, Y.; Liu, F.; Zhang, J.-S.; Lin, C.-C. Optimization of Ganoderma lucidum Polysaccharides Fermentation Process for Large-Scale Production. Appl. Biochem. Biotechnol. 2019, 189, 972–986. [Google Scholar] [CrossRef]
  36. Ji, X.; Wang, Z.; Hao, X.; Zhu, Y.; Lin, Y.; Li, G.; Guo, X. Structural characterization of a new high molecular weight polysaccharide from jujube fruit. Front. Nutr. 2022, 9, 1012348. [Google Scholar] [CrossRef]
  37. Li, T.; Yang, Y.; Liu, Y.; Zhou, S.; Yan, M.Q.; Wu, D.; Zhang, J.; Tang, C. Physicochemical characteristics and biological activities of polysaccharide fractions from Phellinus baumii cultured with different methods. Int. J. Biol. Macromol. 2015, 81, 1082–1088. [Google Scholar] [CrossRef]
  38. Varma, C.A.K.; Kumar, K.J. Structural, functional and pH sensitive release characteristics of water-soluble polysaccharide from the seeds of Albizia lebbeck L. Carbohydr. Polym. 2017, 175, 502–508. [Google Scholar] [CrossRef]
  39. Zhong, Q.; Wei, B.; Wang, S.; Ke, S.; Chen, J.; Zhang, H.; Wang, H. The Antioxidant Activity of Polysaccharides Derived from Marine Organisms: An Overview. Mar. Drugs 2019, 17, 674. [Google Scholar] [CrossRef]
  40. Li, J.; Liu, Y.; Fan, L.; Ai, L.; Shan, L. Antioxidant activities of polysaccharides from the fruiting bodies of Zizyphus Jujuba cv. Jinsixiaozao. Carbohydr. Polym. 2011, 84, 390–394. [Google Scholar] [CrossRef]
  41. Zhang, Z.; Shi, M.; Zheng, H.; Ren, R.; Zhang, S.; Ma, X. Structural characterization and biological activities of a new polysaccharide isolated from Morchella Sextelata. Glycoconj. J. 2022, 39, 369–380. [Google Scholar] [CrossRef] [PubMed]
  42. Xu, Y.; Zhang, X.; Yan, X.-H.; Zhang, J.-L.; Wang, L.-Y.; Xue, H.; Jiang, G.-C.; Ma, X.-T.; Liu, X.-J. Characterization, hypolipidemic and antioxidant activities of degraded polysaccharides from Ganoderma lucidum. Int. J. Biol. Macromol. 2019, 135, 706–716. [Google Scholar] [CrossRef] [PubMed]
  43. Yu, C.-H.; Dai, X.-Y.; Chen, Q.; Zang, J.-N.; Deng, L.-L.; Liu, Y.-H.; Ying, H.-Z. Hypolipidemic and antioxidant activities of polysaccharides from Rosae Laevigatae Fructus in rats. Carbohydr. Polym. 2013, 94, 56–62. [Google Scholar] [CrossRef] [PubMed]
  44. Chen, R.; Jin, C.; Tong, Z.; Lu, J.; Tian, L.; Chang, Q. Optimization extraction, characterization and antioxidant activities of pectic polysaccharide from tangerine peels. Carbohydr. Polym. 2016, 136, 187–197. [Google Scholar] [CrossRef] [PubMed]
  45. Sun, Y.; Wang, S.; Li, T.; Li, X.; Jiao, L.; Zhang, L. Purification, structure and immunobiological activity of a new water-soluble polysaccharide from the mycelium of Polyporus albicans (Imaz.) Teng. Bioresour. Technol. 2008, 99, 900–904. [Google Scholar] [CrossRef] [PubMed]
  46. Gu, S.; Sun, H.; Zhang, X.; Huang, F.; Pan, L.; Zhu, Z. Structural characterization and inhibitions on α-glucosidase and α-amylase of alkali-extracted water-soluble polysaccharide from Annona squamosa residue. Int. J. Biol. Macromol. 2020, 166, 730–740. [Google Scholar] [CrossRef]
  47. Wang, L.C.; Zhang, K.; Di, L.Q.; Liu, R.; Wu, H. Isolation and structural elucidation of novel homogenous polysaccharide from Mactra veneriformis. Carbohydr. Polym. 2011, 86, 982–987. [Google Scholar] [CrossRef]
  48. Abuduwaili, A.; Nuerxiati, R.; Mutailifu, P.; Gao, Y.; Lu, C.; Yili, A. Isolation, structural modification, characterization, and bioactivity of polysaccharides from Folium Isatidis. Ind. Crop. Prod. 2022, 176, 114319. [Google Scholar] [CrossRef]
  49. da Rocha, L.B.N.; Sousa, R.B.; dos Santos, M.V.B.; Neto, N.M.A.; Soares, L.L.d.S.; Alves, F.L.C.; de Carvalho, M.A.M.; Osajima, J.A.; Silva-Filho, E.C. Development of a new biomaterial based on cashew tree gum (Anarcadium occidentale L.) enriched with hydroxyapatite and evaluation of cytotoxicity in adipose-derived stem cell cultures. Int. J. Biol. Macromol. 2023, 242, 124864. [Google Scholar] [CrossRef]
  50. Kong, L.; Yu, L.; Feng, T.; Yin, X.; Liu, T.; Dong, L. Physicochemical characterization of the polysaccharide from Bletilla striata: Effect of drying method. Carbohydr. Polym. 2015, 125, 1–8. [Google Scholar] [CrossRef]
  51. Li, Q.; Geng, X.; Zhu, L.; Zheng, F.; Chen, E.; Wang, G.; Li, X. Structural characterization and antioxidant properties of a novel polysaccharide isolated from Jiuzao in vitro and in vivo. Food Res. Int. 2022, 162, 111940. [Google Scholar] [CrossRef] [PubMed]
  52. Jeong, J.B.; Seo, E.W.; Jeong, H.J. Effect of extracts from pine needle against oxidative DNA damage and apoptosis induced by hydroxyl radical via antioxidant activity. Food Chem. Toxicol. 2009, 47, 2135–2141. [Google Scholar] [CrossRef] [PubMed]
  53. Biswas, M.; Haldar, P.K.; Ghosh, A.K. Antioxidant and free-radical-scavenging effects of fruits of Dregea volubilis. J. Nat. Sci. Biol. Med. 2010, 1, 29–34. [Google Scholar] [CrossRef] [PubMed]
  54. Chen, Y.; Xie, M.-Y.; Nie, S.-P.; Li, C.; Wang, Y.-X. Purification, composition analysis and antioxidant activity of a polysaccharide from the fruiting bodies of Ganoderma atrum. Food Chem. 2008, 107, 231–241. [Google Scholar] [CrossRef]
  55. Jo, Y.-J.; Cho, H.-S.; Chun, J.-Y. Antioxidant activity of β-cyclodextrin inclusion complexes containing trans-cinnamaldehyde by DPPH, ABTS and FRAP. Food Sci. Biotechnol. 2021, 30, 807–814. [Google Scholar] [CrossRef] [PubMed]
  56. Tian, L.; Zhao, Y.; Guo, C.; Yang, X. A comparative study on the antioxidant activities of an acidic polysaccharide and various solvent extracts derived from herbal Houttuynia cordata. Carbohydr. Polym. 2011, 83, 537–544. [Google Scholar] [CrossRef]
  57. Chen, B.-J.; Shi, M.-J.; Cui, S.; Hao, S.-X.; Hider, R.C.; Zhou, T. Improved antioxidant and anti-tyrosinase activity of polysaccharide from Sargassum fusiforme by degradation. Int. J. Biol. Macromol. 2016, 92, 715–722. [Google Scholar] [CrossRef]
  58. Zuofa, Z.; Guoying, L.; Meng, S.; Tingting, S.; Juan, P. Protective effect of polysaccharide from the artificially cultivated Sanghuangporus vaninii against H2O2-induced toxicity in vitro and in zebrafish models. Arab. J. Chem. 2023, 16, 105115. [Google Scholar] [CrossRef]
  59. Cai, Z.-N.; Li, W.; Mehmood, S.; Pan, W.-J.; Wang, Y.; Meng, F.-J.; Wang, X.-F.; Lu, Y.-M.; Chen, Y. Structural characterization, in vitro and in vivo antioxidant activities of a heteropolysaccharide from the fruiting bodies of Morchella esculenta. Carbohydr. Polym. 2018, 195, 29–38. [Google Scholar] [CrossRef]
  60. Huang, J.; Mckee, M.; Huang, H.D.; Xiang, A.; Davidson, A.J.; Lu, H.A. A zebrafish model of conditional targeted podocyte ablation and regeneration. Kidney Int. 2013, 83, 1193–1200. [Google Scholar] [CrossRef]
  61. Ko, S.-C.; Kim, D.; Jeon, Y.-J. Protective effect of a novel antioxidative peptide purified from a marine Chlorella ellipsoidea protein against free radical-induced oxidative stress. Food Chem. Toxicol. 2012, 50, 2294–2302. [Google Scholar] [CrossRef] [PubMed]
  62. Yang, X.; Wang, X.; Gao, D.; Zhang, Y.; Chen, X.; Xia, Q.; Jin, M.; Sun, C.; He, Q.; Wang, R.; et al. Developmental toxicity caused by sanguinarine in zebrafish embryos via regulating oxidative stress, apoptosis and wnt pathways. Toxicol. Lett. 2021, 350, 71–80. [Google Scholar] [CrossRef] [PubMed]
  63. Gui, Y.-H.; Liu, L.; Wu, W.; Zhang, Y.; Jia, Z.-L.; Shi, Y.-P.; Kong, H.-T.; Liu, K.-C.; Jiao, W.-H.; Lin, H.-W. Discovery of nitrogenous sesquiterpene quinone derivatives from sponge Dysidea septosa with anti-inflammatory activity in vivo zebrafish model. Bioorganic Chem. 2020, 94, 103435. [Google Scholar] [CrossRef] [PubMed]
  64. Liu, W.; He, P.; Shi, X.; Zhang, Y.; Perez-Moreno, J.; Yu, F. Large-Scale Field Cultivation of Morchella and Relevance of Basic Knowledge for Its Steady Production. J. Fungi 2023, 9, 855. [Google Scholar] [CrossRef]
Figure 1. Phenotypic analysis of MS-1 and optimization of culture conditions. Phenotypic analysis of MS-1 on PDA plate (a). The screening of the optimal carbon source (b), nitrogen source (c), and inorganic salts’ picture (d). The screening of the optimal carbon source (e), nitrogen source (f), and inorganic salt concentrations (g).
Fermentation 10 00046 g001
Figure 2. Response surface analysis of the components of liquid fermentation medium for MS-1. The chart’s hue shifts from blue to red, signifying an increase in extraction quality. Colored dots correspond to exopolysaccharide production in the experimental group (red represents production above the response value, pink represents production below the response value). The colored lines depict the contours of corresponding response surface plots. Effect of interaction between glucose and yeast extract (a), between yeast extract and NaCl (b), and between glucose and NaCl (c) on exopolysaccharide production.
Fermentation 10 00046 g002
Figure 3. Purification, molecular weight, and monosaccharide composition analyses of polysaccharides MSF and MSL. Elution profiles of polysaccharide MSF on DEAE-52 (a) and Sephadex G-100 columns (c). Elution profiles of polysaccharide MSL on DEAE-52 (b) and Sephadex G-100 columns (d). Determination of polysaccharide molecular weight using gel permeation chromatography of MSF (e) and MSL (f). Monosaccharide components of MSF (g) and MSL (h).
Fermentation 10 00046 g003
Figure 4. Characteristic analysis of the polysaccharide samples MSF and MSL. FTIR spectrum of MSF (a) and MSL (b). Thermogravimetric analysis of MSF (c) and MSL (d). Scanning electron micrographs of MSF (e) and MSL (f).
Fermentation 10 00046 g004
Figure 5. Hydroxyl radical scavenging activity (a), DPPH free radical (b), and reducing iron ion analyses (c) of polysaccharide samples MSF and MSL.
Fermentation 10 00046 g005
Figure 6. Antioxidant analysis of MSF and MSL in a zebrafish model. Fluorescent images (a) and calculated total cell number (b,c). The mRNA expression levels of Cu-Zn-SOD, Mn-SOD, Keap1, and Nrf2 measured with qPCR in zebrafish embryos at 24 hpf after Met exposure (dg). The data are expressed as the mean ± SD. ## p < 0.01, * p < 0.05, ** p < 0.01, and *** p < 0.001 versus the MTZ group.
Fermentation 10 00046 g006
Figure 7. Anti-inflammatory analysis of MSF and MSL in zebrafish model. Fluorescent images (a) and calculated total cell number (b). The data are expressed as the mean ± SD. ## p < 0.01 versus the control group; *** p < 0.001 versus the CuSO4 group.
Fermentation 10 00046 g007
Table 1. The molecular weights of purified MSF and MSL.
Peak No.Mn (KDa)Mw (KDa)Mz (KDa)Mw/Mn
MSF-11732433281.41
MSF-25.657.9610.31.41
MSL50.21403962.80
Disclaimer/Publisher’s Note: The statements, opinions and data contained in all publications are solely those of the individual author(s) and contributor(s) and not of MDPI and/or the editor(s). MDPI and/or the editor(s) disclaim responsibility for any injury to people or property resulting from any ideas, methods, instructions or products referred to in the content.

