Article

Electrical Resistance Evolution of Graphite and Talc Geological Heterostructures under Progressive Metamorphism

by
Augusto Gonçalves Nobre
1,*,
Fabio Ramos Dias de Andrade
2,
Andres Fabian Salazar-Naranjo
2,
Josue Neroti Rigue
1,
Ricardo Barreto da Silva
1,
Silvio Roberto Farias Vlach
2 and
Romulo Augusto Ando
3
1
Center for Natural and Exact Sciences, Federal University of Santa Maria, Santa Maria 97105-900, RS, Brazil
2
Institute of Geosciences, University of São Paulo, São Paulo 05508-080, SP, Brazil
3
Institute of Chemistry, University of São Paulo, São Paulo 05508-900, SP, Brazil
*
Author to whom correspondence should be addressed.
Submission received: 21 June 2023 / Revised: 22 July 2023 / Accepted: 26 July 2023 / Published: 30 July 2023

Abstract

:
The electrical properties of isolated graphene established precedents for studies of electrical superconducting materials at room temperature. After the discovery of stabilized graphene and graphite nanoplatelets in a geological context, the interest in characterizing the properties of these minerals arose. This work evaluates the electrical resistance evolution of mineral graphite and talc heterostructures under progressive metamorphism simulated in the laboratory. The experiments were conducted on an end-loaded piston-cylinder apparatus. This equipment allows for the application of equal pressure in all sample directions (lithostatic pressure) and heating, simulating geological phenomena. The behavior of two sets of mineral samples were compared: graphite and talc in billets and powder. Samples in billets were submitted to treatments at 400 °C and 4 kbar; 400 °C and 6 kbar; and 700 °C and 9 kbar. The powder samples were subjected to 700 °C and 9 kbar, with two ways of disposing the mineral powders (mixed and in adjacent contact) beyond 900 °C and 9 kbar (in adjacent contact). The results show that the samples in billets had lower electrical resistance when compared to the powder samples. The lowest electrical resistance was observed in the sample treated at 400 °C and 6 kbar, conditions that are consistent with metamorphic mineral assemblage observed in the field. Powdered samples showed better cleavage efficiency during the experiment, resulting in thinner flakes and even graphene, as pointed out by Raman spectroscopy. However, these flakes were not communicating, which resulted in high electrical resistance, due to the need for an electrical current to pass through the talc, resulting in a Joule effect. The maximum electrical resistance obtained in the experiment was obtained in the sample submitted to 900 °C, in which talc decomposed into other mineral phases that were even more electrically insulating. This work demonstrates that electrical resistance prospecting can be an efficient tool to identify potential target rocks with preserved mineral nanometric heterostructures that can form an important raw material for the nanotechnology industry.

1. Introduction

The graphite mechanical microcleavage to obtain graphene was responsible for the emergence of two-dimensional (2D) materials science [1]. Among the outstanding properties of 2D materials are the electrical superconductivity at room temperature and high transparency, initially observed in graphene [2,3,4], which earned its authors the 2010 Nobel Prize in Physics [5]. Graphene’s electrical and optical properties are key to the development of high-speed electronics [6,7,8], single molecule detection [9,10,11], high-capacity sensors [12,13], field-effect devices [14,15,16], and transparent electrodes devices [17,18,19].
Despite its strategic properties, graphene is still not widely available in industry [20,21]. The two main problems with the popularization of graphene devices are instability and the high cost of producing the material [22]. Graphene is unstable and tends to recombine with itself or other flakes in the sample. To avoid this phenomenon, graphene needs to be anchored in a substrate or dispersed in a solvent that reduces its surface energy [23,24]. Graphene production processes are still expensive, especially when dependent on synthetic raw materials [25]. In addition, most large-scale processes have low profitability and logistical difficulties (with storage and transport) [26].
Bøggild et al. [27] pointed out that the price of an ideal monolayer graphene flake in 2006 was 1 EUR/µm2. In 2016, this value dropped to 1 EUR/cm2, which represents a factor 108 reduction. The evolution of both top-down (from bulk precursors) and bottom-up (from chemical reagents) techniques led graphene production processes to become progressively more profitable, allowing the production of larger volumes of material at a lower operating cost. Even so, it is still of high value to make graphene an everyday material.
A new way of obtaining graphene and other 2D substances via top-down techniques is the extraction from mineral deposits [28]. There are tectono-structural contexts that allow graphite-bearing rocks to be sheared, forming graphite nanoplatelets and graphene [29]. These contexts are recorded in metamorphic rocks. Metamorphism is the process in which any type of rock undergoes structural and compositional transformations (mineralogically) in a solid state, becoming denser and more compact. This process occurs as a result of the increase in temperature, pressure, presence and composition of fluids, in addition to the time the rock was kept under these deformation conditions [30].
The thin crystals of graphite and graphene found in rocks have crystalline defects and compositional impurities but are stabilized in rock, remaining stable for over a hundred million years [31]. These nanomaterials require simple and low-cost processing and have the potential to be used for various functionalities that do not depend on perfect crystallinity and analytical purity [32,33,34,35].
In a geological context, graphene stabilization also needs to occur in a substrate. It is necessary that the rock has another mineral of placoid structure with van der Waals forces to anchor the exfoliated graphite [36]. Clay minerals [37,38], micas [39,40], molybdenite [41,42] and talc [43,44] are examples of minerals with these characteristics.
Talc is proving to be a prominent candidate as a mineral substrate for geological graphenes [45]. The epitaxial relationship between bulk minerals favors the maintenance of thin flakes, in addition to the relative abundance of talc and graphite in metamorphic rocks deformed by shear zones [45,46,47,48]. Therefore, talc was chosen as the graphite substrate in this study’s experiments.
The possibility of prospecting, identifying, and extracting graphene or its by-products from rocks opens possibilities to transform it into a mineral commodity. This would be an important step towards popularizing its use in everyday products. These are mineral deposits of smaller dimensions, with less environmental impact for their extraction, with simpler processing than other mineral commodities that require large mining plants. This would enable the production of large volumes of raw material for the nanotechnology industry [49,50].
Graphene geology had its first mention in 2011 [51] and is an emerging interdisciplinary area between Material Sciences and Geosciences. Research in this area has been highlighted by demonstrating that the petrological genesis of graphite directly affects the properties of graphene and graphene oxide produced from it [52]. At the same time, this research line demonstrated the existence of rocks bearing stabilized graphene [33,47] and showed that the presence of graphenes and graphite nanoplatelets added quality to lithic artifacts [53].
As the variation in electrical resistance is one of the main mechanisms for recognizing the presence of graphene in rock during fieldworks, this property was chosen to characterize the samples of the proposed studies. Field reconnaissance is the first tool used in mineral resource prospecting surveys. In graphitic rocks, significant reductions in electrical resistivity are indicative that the mineral was cleaved in a privileged way, possibly being a graphene-bearing rock.
This experimental study proposes the formation simulation of fine talc and graphite heterostructures in different metamorphic contexts to evaluate which one presents the lowest electrical resistivity. In this way, the developed studies aimed to evaluate the electrical resistance behavior of bulk and nanometric talc and graphite geological heterostructures. The precursor minerals (graphite and talc) were treated under different conditions of pressure and temperature (simulating the metamorphic process) that favor minerals’ mutual diffusion in the solid state. The minerals were placed in different ways in the sample holder so that the arrangement of precursor minerals as controllers of electrical resistance could be analyzed.
The cleavage efficiency of graphite was analyzed by Raman spectroscopy. Raman spectroscopy gained notoriety for the study of graphitic materials as it allows the relative measurement of the covalent bonds and van der Waals forces abundance in their structure. This analytical technique can represent whether an originally multilayer graphite passed to a 2D system after treatment or deformation.
The diffusion zones formed under experimental conditions were subjected to electrical resistance measurements. These results allowed us to infer which metamorphism conditions and which distribution of minerals in the rock are more favorable for the natural availability of heterostructures with low electrical resistance.

2. Materials and Methods

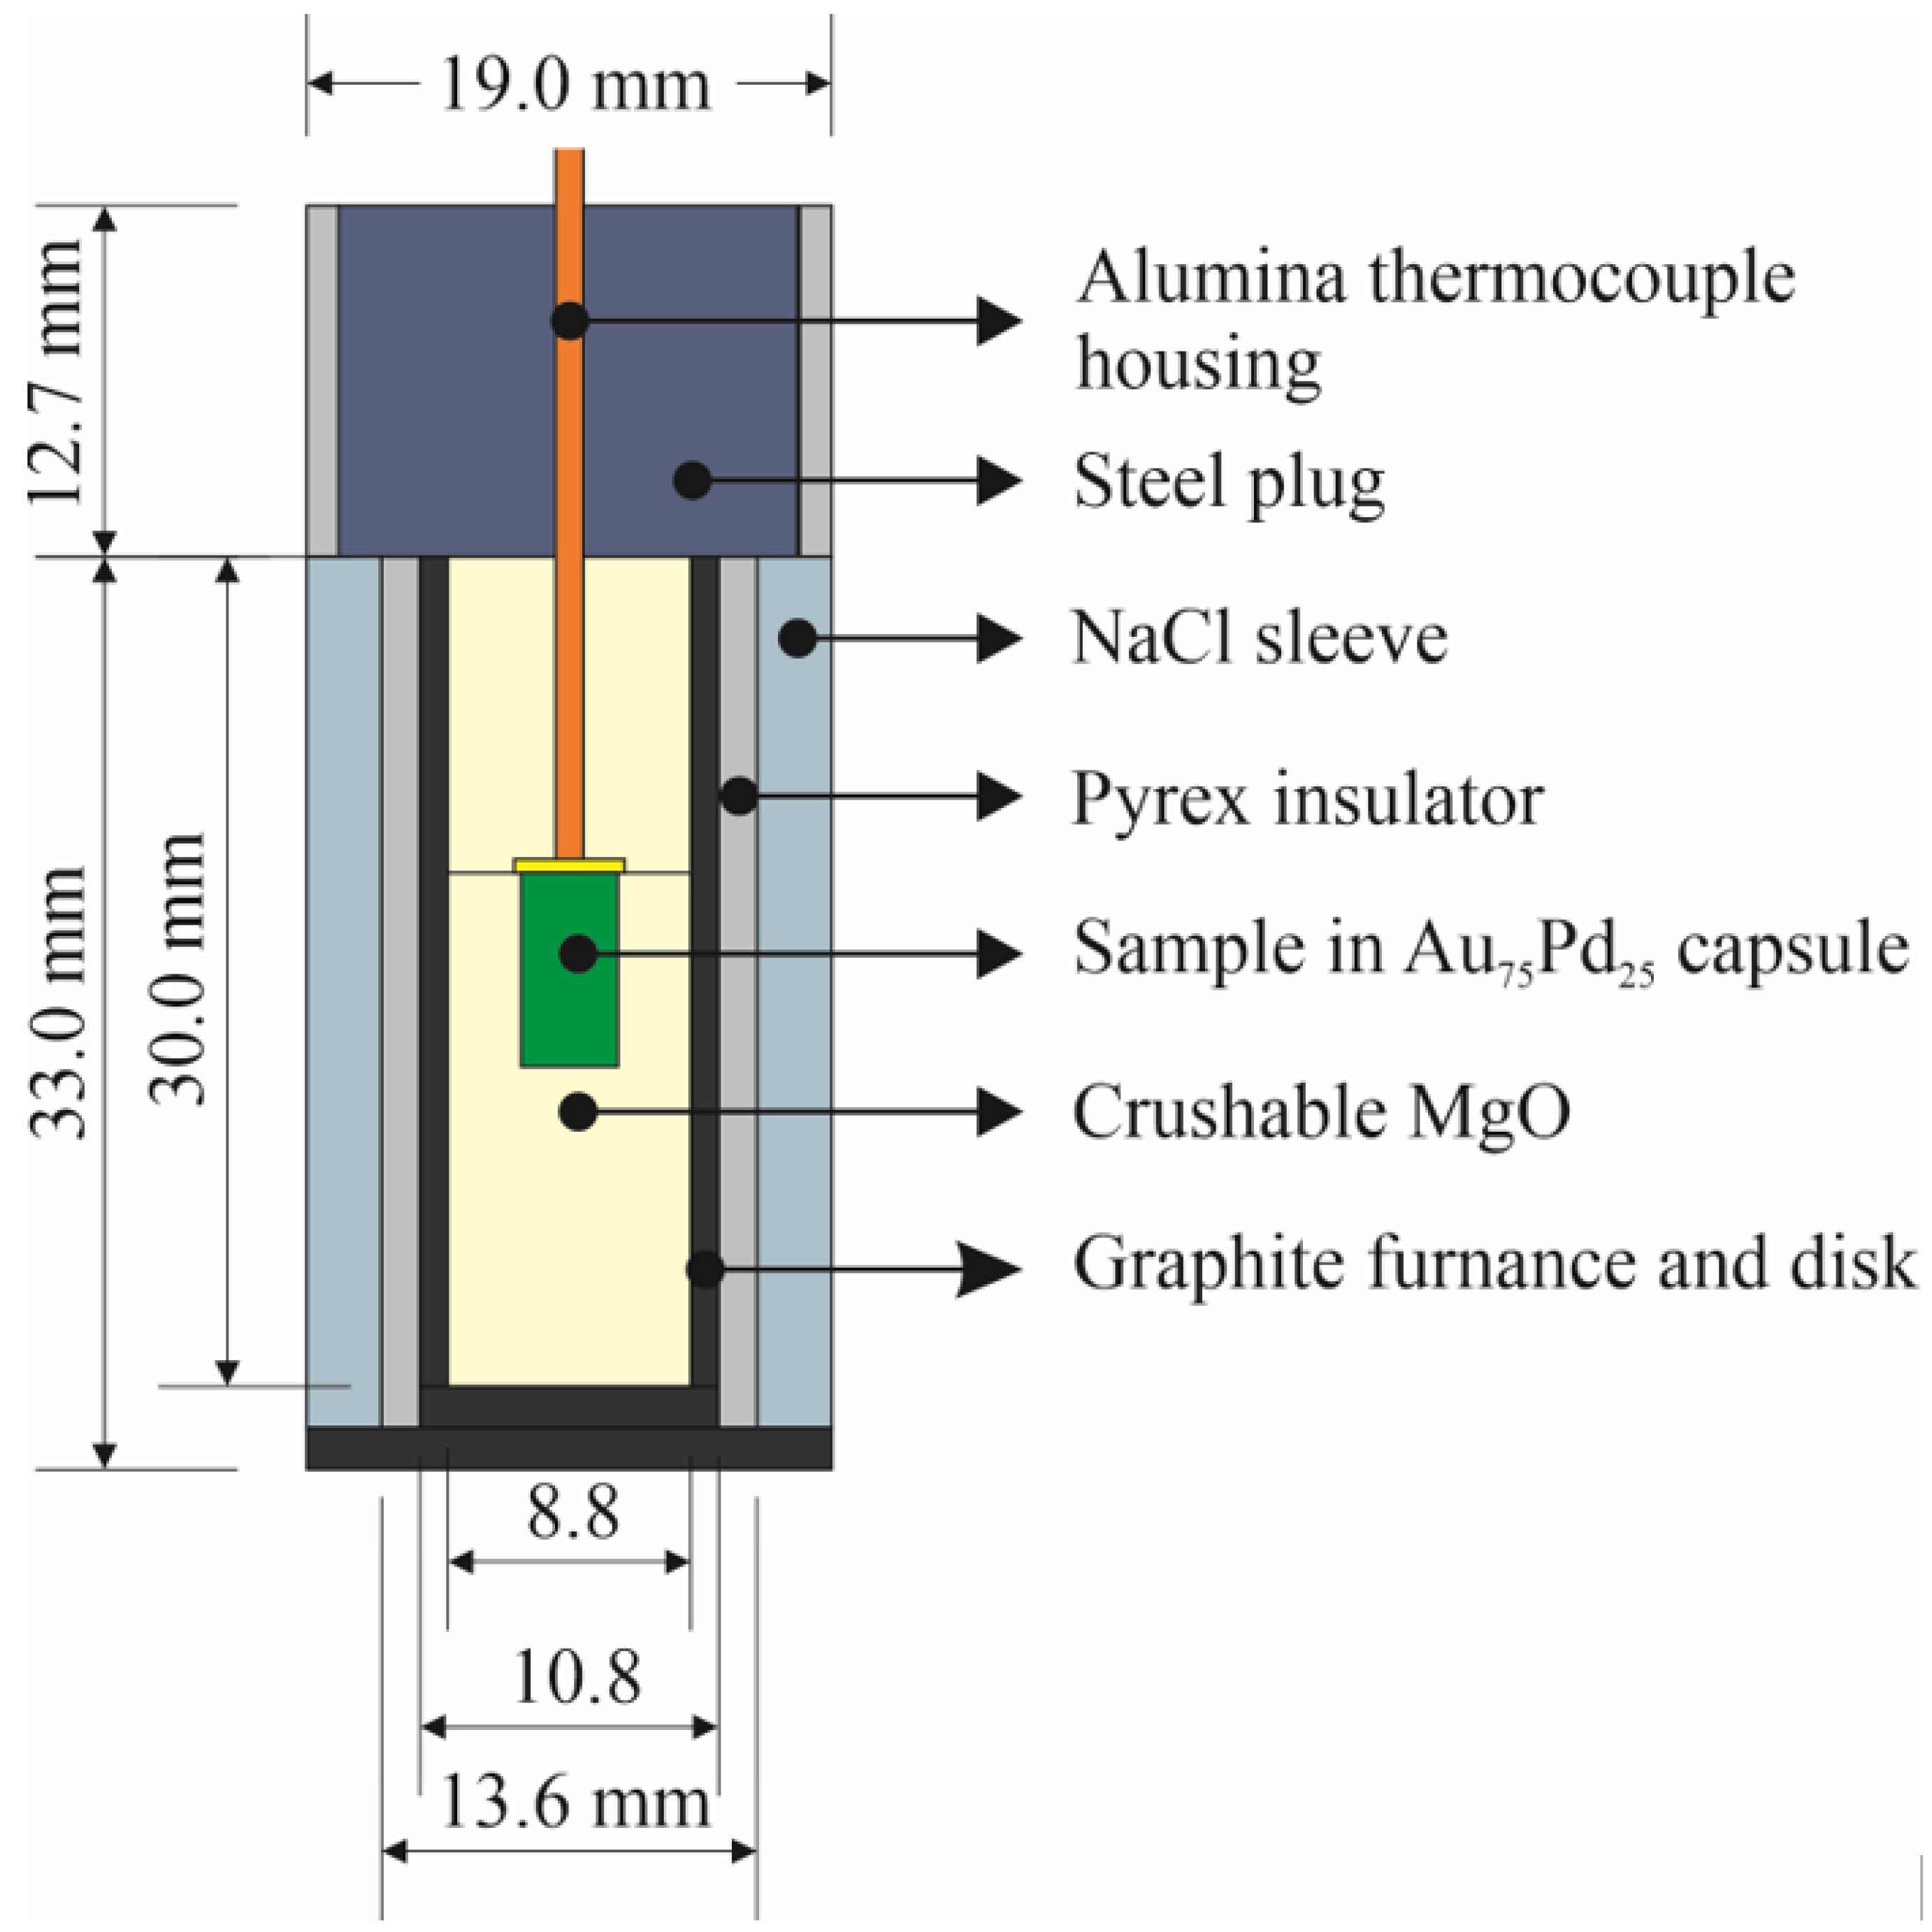
2.1. Precursor Minerals and Piston-Cylinder Apparatus

The study included the preparation and analysis of six samples. The thermobarometric treatment conditions chosen were 400 °C and 4 kbar; 400 °C and 6 kbar; 700 °C and 9 kbar; 900 °C and 9 kbar, which correspond to conditions of progressive metamorphism existing inside the Earth’s continental crust.
The samples treated under 700 °C and 9 kbar were arranged in three different ways in the sample holder: (i) minerals in billets (named B); (ii) minerals in adjacent powders (named P); and (iii) minerals in homogeneous powder mixture (named MP). These configurations allowed for the evaluation of the contact relationship between precursor minerals for electrical resistance analysis purposes.
In this way, the nomenclature of the samples and their experimentation conditions were as follows:
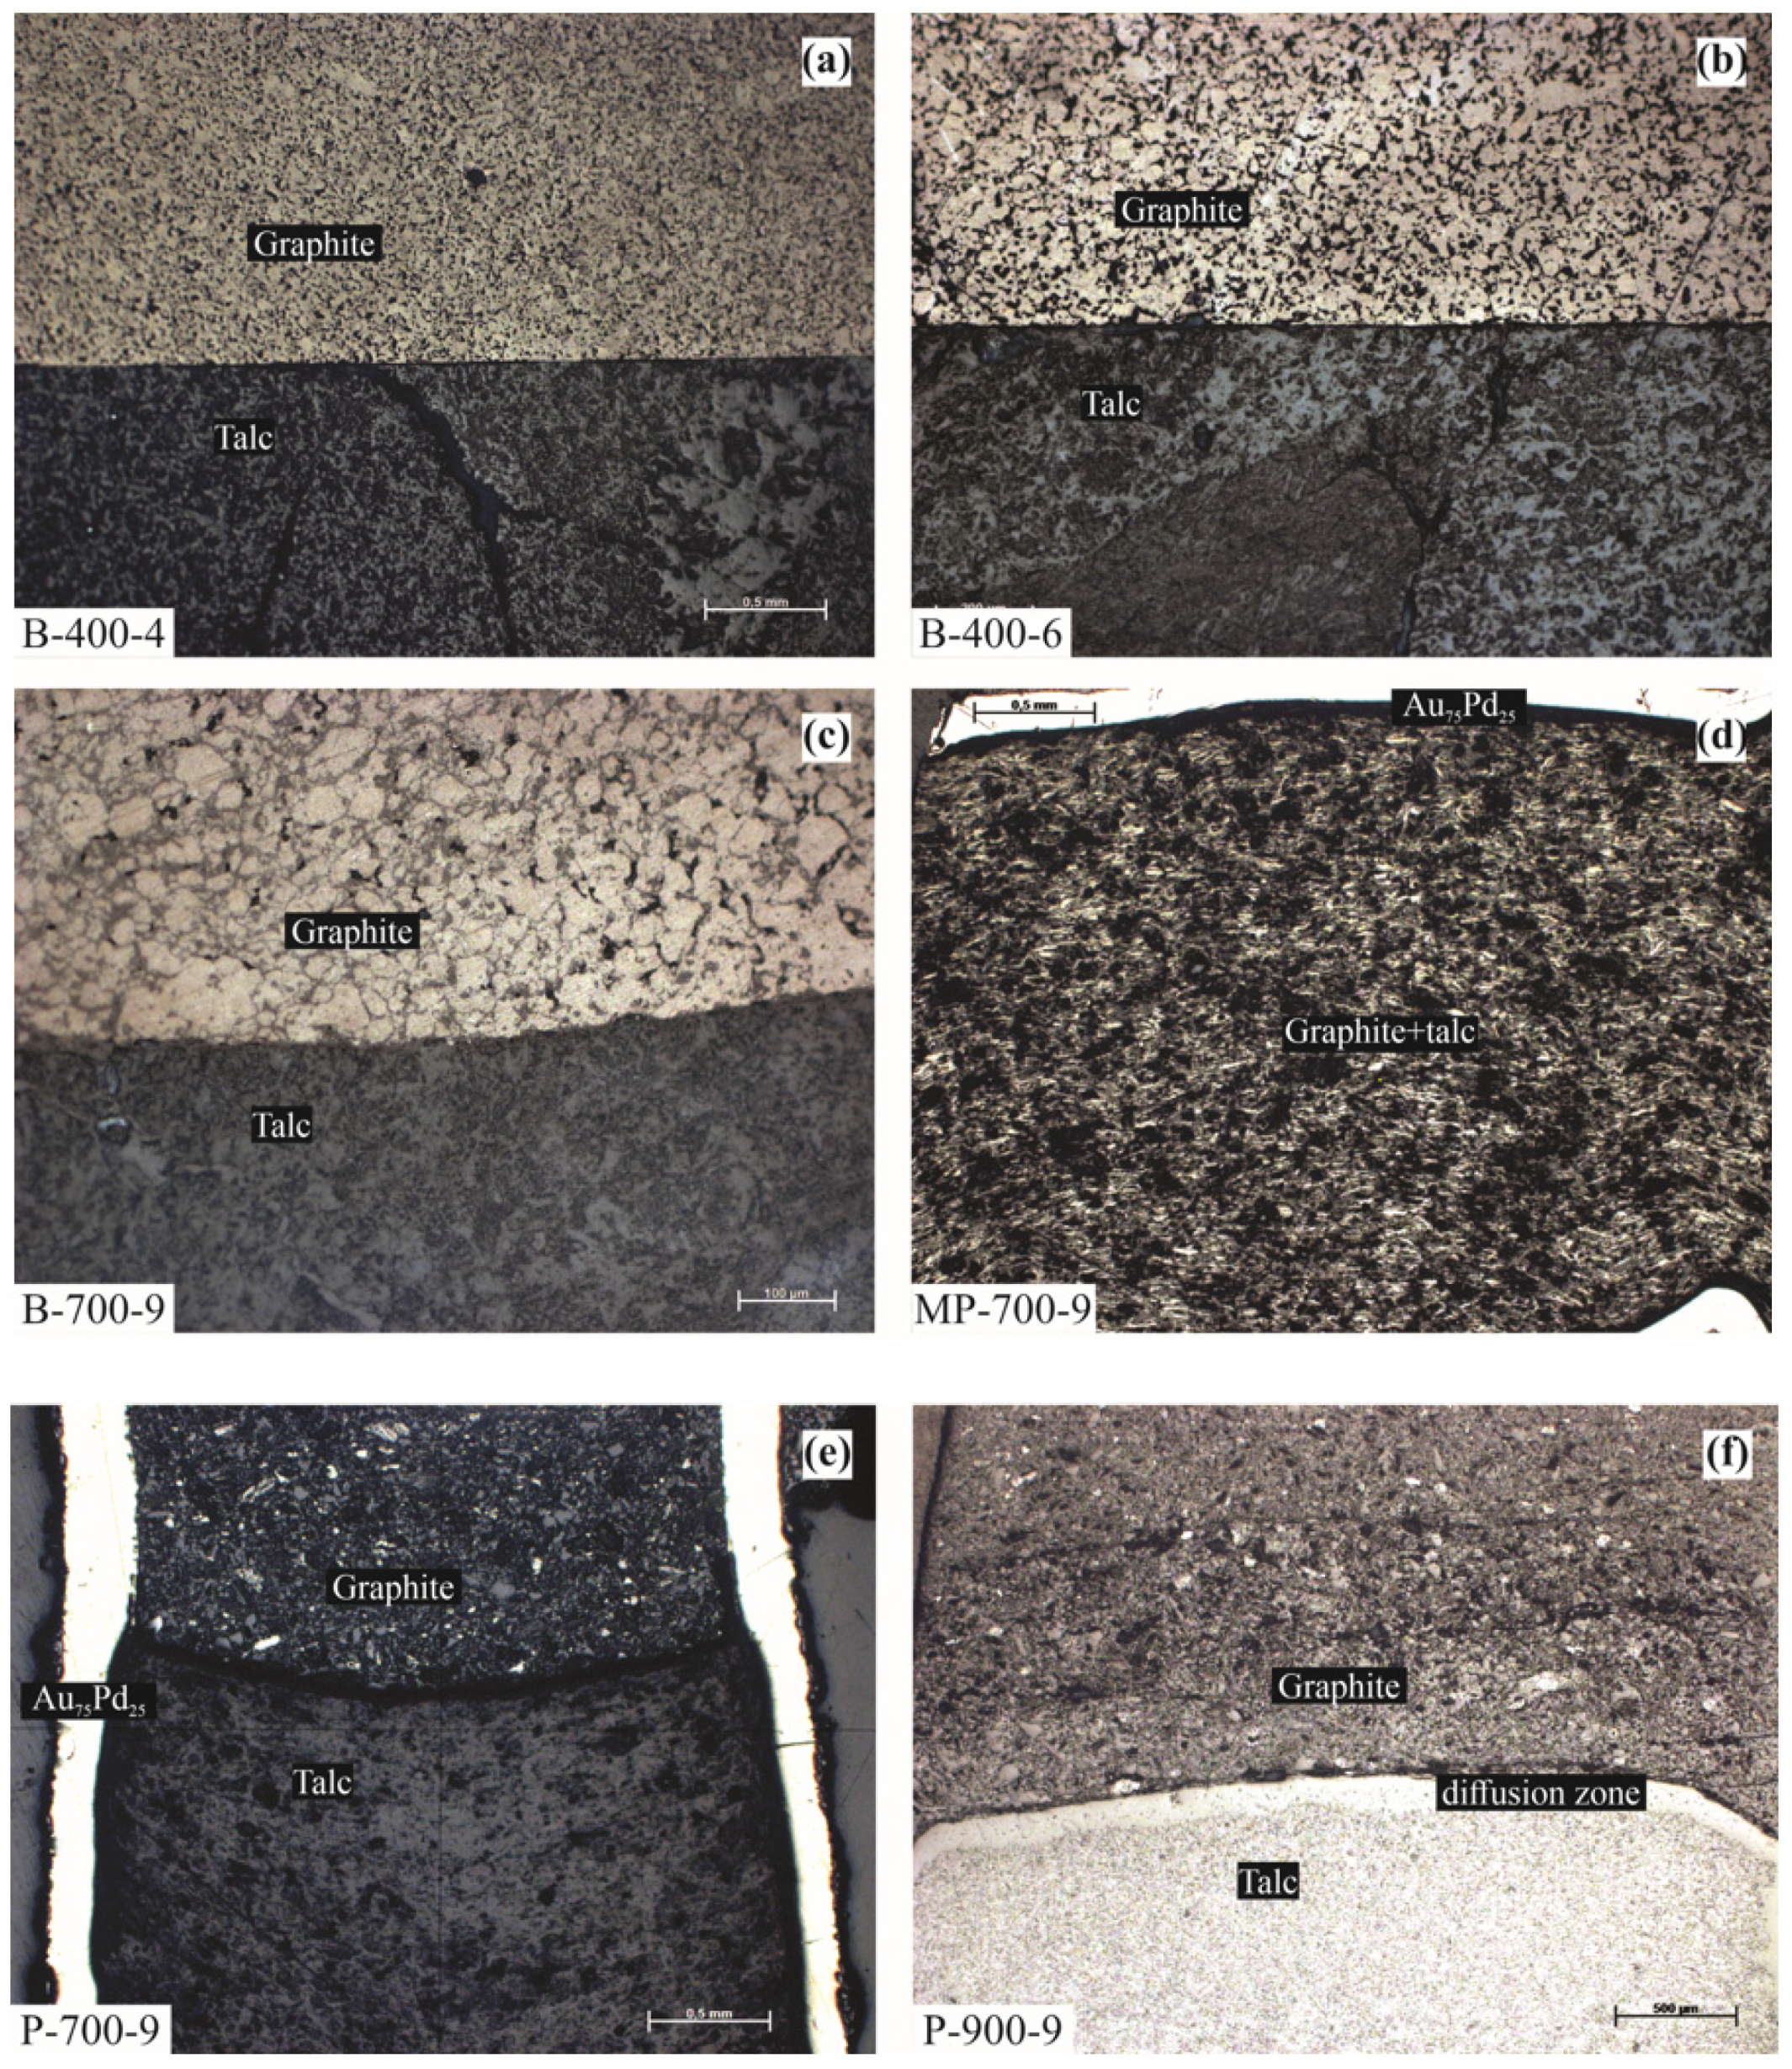
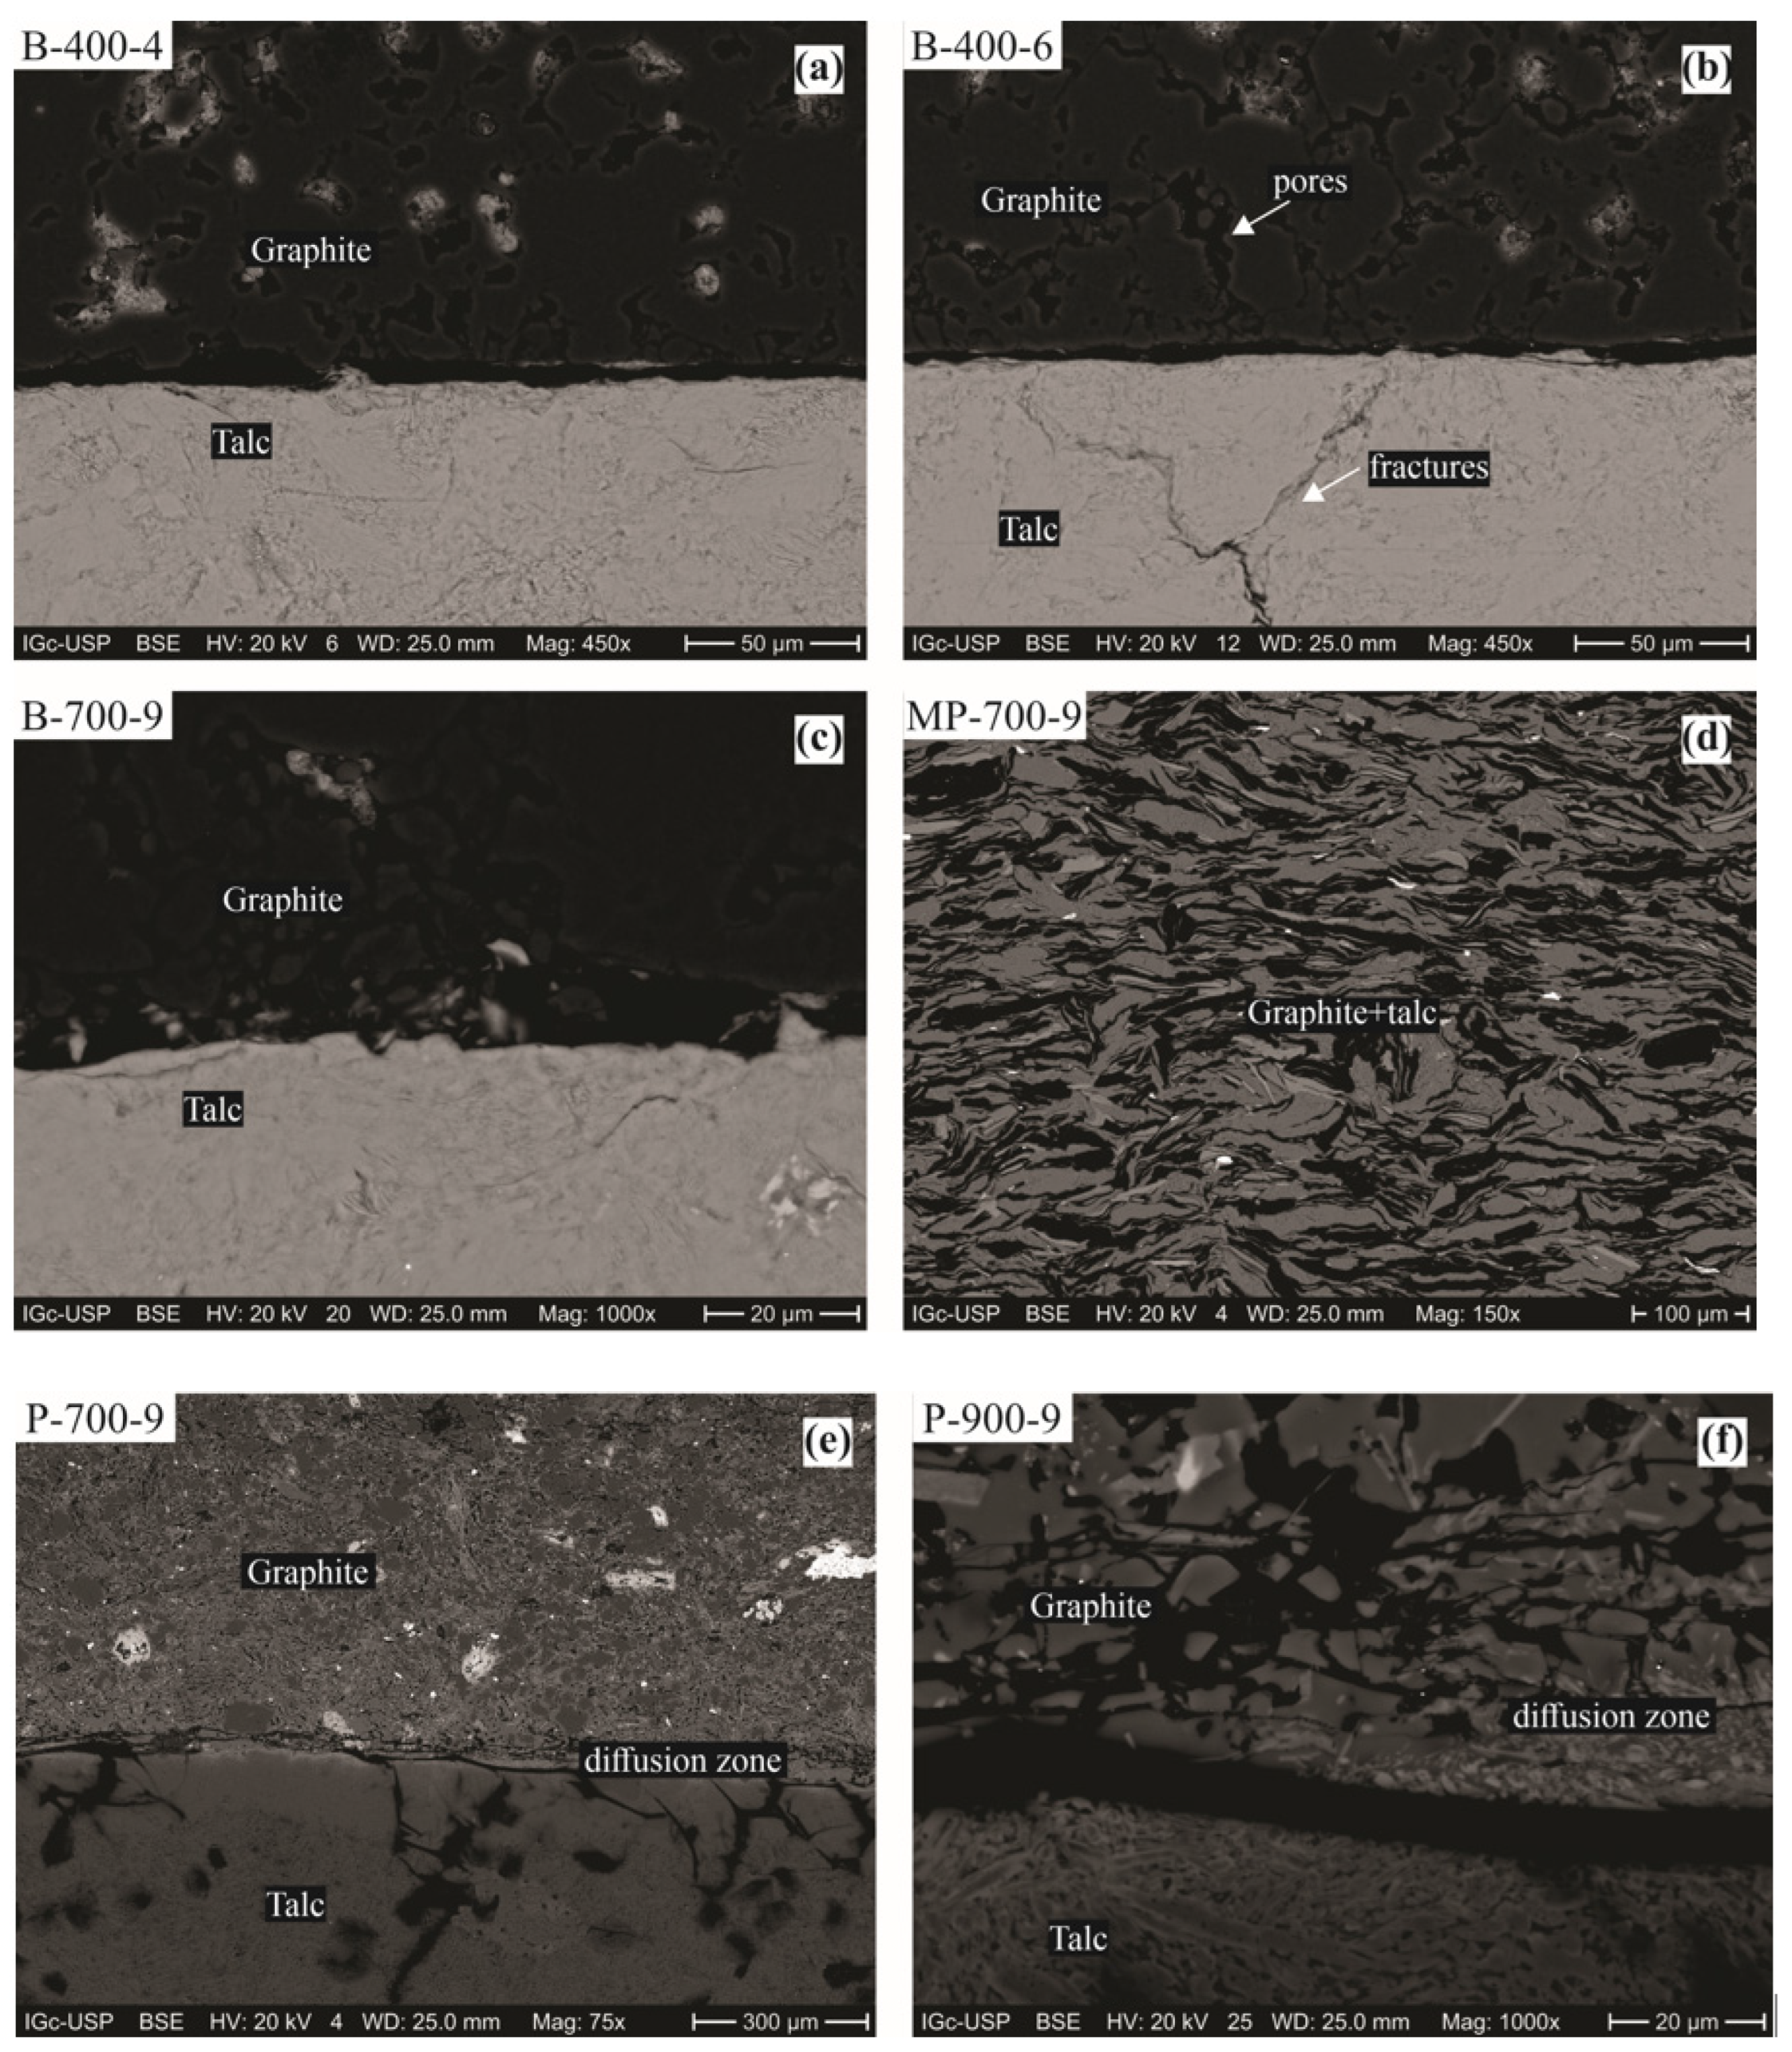
  • B-400-4: Graphite and talc in billets, treated at 400 °C and 4 kbar;
  • B-400-6: Graphite and talc in billets, treated at 400 °C and 6 kbar;
  • B-700-9: Graphite and talc in billets, treated at 700 °C and 9 kbar;
  • MP-700-9: Graphite and talc in a homogeneous mixture of powders, treated at 700 °C and 9 kbar;
  • P-700-9: Graphite and talc in adjacent contact powders, treated at 700 °C and 9 kbar;
  • P-900-9: Graphite and talc in adjacent contact powders, treated at 900 °C and 9 kbar.
The end-loaded piston-cylinder apparatus is a set of equipment adapted from commercial devices that allows for the simulation of temperature and pressure conditions found in the Earth’s crust and upper mantle [54]. Traditionally, it is used for melting and crystallization studies of geological materials [55]. In this study, the equipment simulated processes for obtaining and stabilizing natural graphite nanoplatelets and graphenes in rocks [45].
The studies were carried out with an end-loaded Bristol-type piston-cylinder apparatus, and the temperature was set up and monitored using a B-type thermocouple and a 2404 Eurotherm PID controller.
The precursor minerals were placed in contact to yield diffusion and mutual exfoliation inside the sample holder. The sample holder was a tube 6 mm long (L) and 2.6 mm in diameter (w), made of a Au75Pd25 alloy, which was welded at its ends to avoid material exchange with the outside. This metal capsule was inserted into a 3/4” concentric furnace assembly consisting of crushable MgO, which acts as a sample holder fixer, graphite heater, pyrex (B-silicate) glass (spacer), and NaCl sleeves to maintain the almost friction-free sample, besides steel plugs. An alumina two-bore insulator allowed thermocouple insertion and temperature measures on the capsule top-end, isolated from the thermocouple probe with a thin Al disk [56]. The 3/4” furnace assembly used in the studies can be seen in Figure 1.
All samples were subjected to thermobarometric treatment for 24 h so that it was possible to observe diffusion zones. The experiments were carried out up to a pressure of 9 kbar, which ensures the phase stability of graphite [57]. Experiments carried out in temperatures up to 700 °C aimed to keep the talc stable in the system, as it transitions to other phases at higher temperatures, given the pressure conditions used [58]. The experiment conducted at 900 °C analyzed whether the progressive phase change from talc (Mg3 Si4 O10(OH)2) to enstatite (MgSiO3), silica (SiO2), and water (H2O) was relevant to the electrical resistance of graphite nanoplatelets and graphene formed in the diffusion zone.
After completing the 24 h period, the power supply to the equipment was cut and the furnace set was cooled down to room temperature at a rate of approximately −30 °C/s. This cooling rate was fast enough to avoid phase re-equilibrium, which preserved the structures formed under the chosen thermobarometric conditions.

2.2. Diffusion Zones Characterization

The AuPd capsules after the experiments were sawn by microtome to expose the minerals and their diffusion zone and were fixed in epoxy resin to facilitate handling during characterization.
A diffusion zone between the mineral precursors contacts was observed with reflected-light optical microscopy (RLOM, Zeiss Axio Imager, equipped with the Zeiss AxioCam system) and scanning electron microscopy (SEM, LEO 440I) with compositional mode of backscattered electrons (BSE). The SEM analytical conditions were 20 kV voltage, working distance of 25 mm, and a sample current between 600 and 1200 pA.
Contact zones between graphite and talc were studied by Raman spectroscopy using a WITec Raman microscope alpha 300 R with a 633 nm excitation laser, with 30 accumulations in an integration time of 3 s.
Raman spectroscopy is a strategic characterization technique used to evaluate the systematic cleavage of van der Waals interactions in the graphite structure [59,60]. This technique measures the relative intensity between discrete graphite–graphene spectral bands, namely D (approximately 1350 cm−1, corresponding to defects in covalent bonds), G (approximately 1580 cm−1, associated with the sp2 carbon atoms’ plane vibration), and 2D (approximately 2700 cm−1, linked to the structural arrangement of the two-dimensional plane) [61,62].

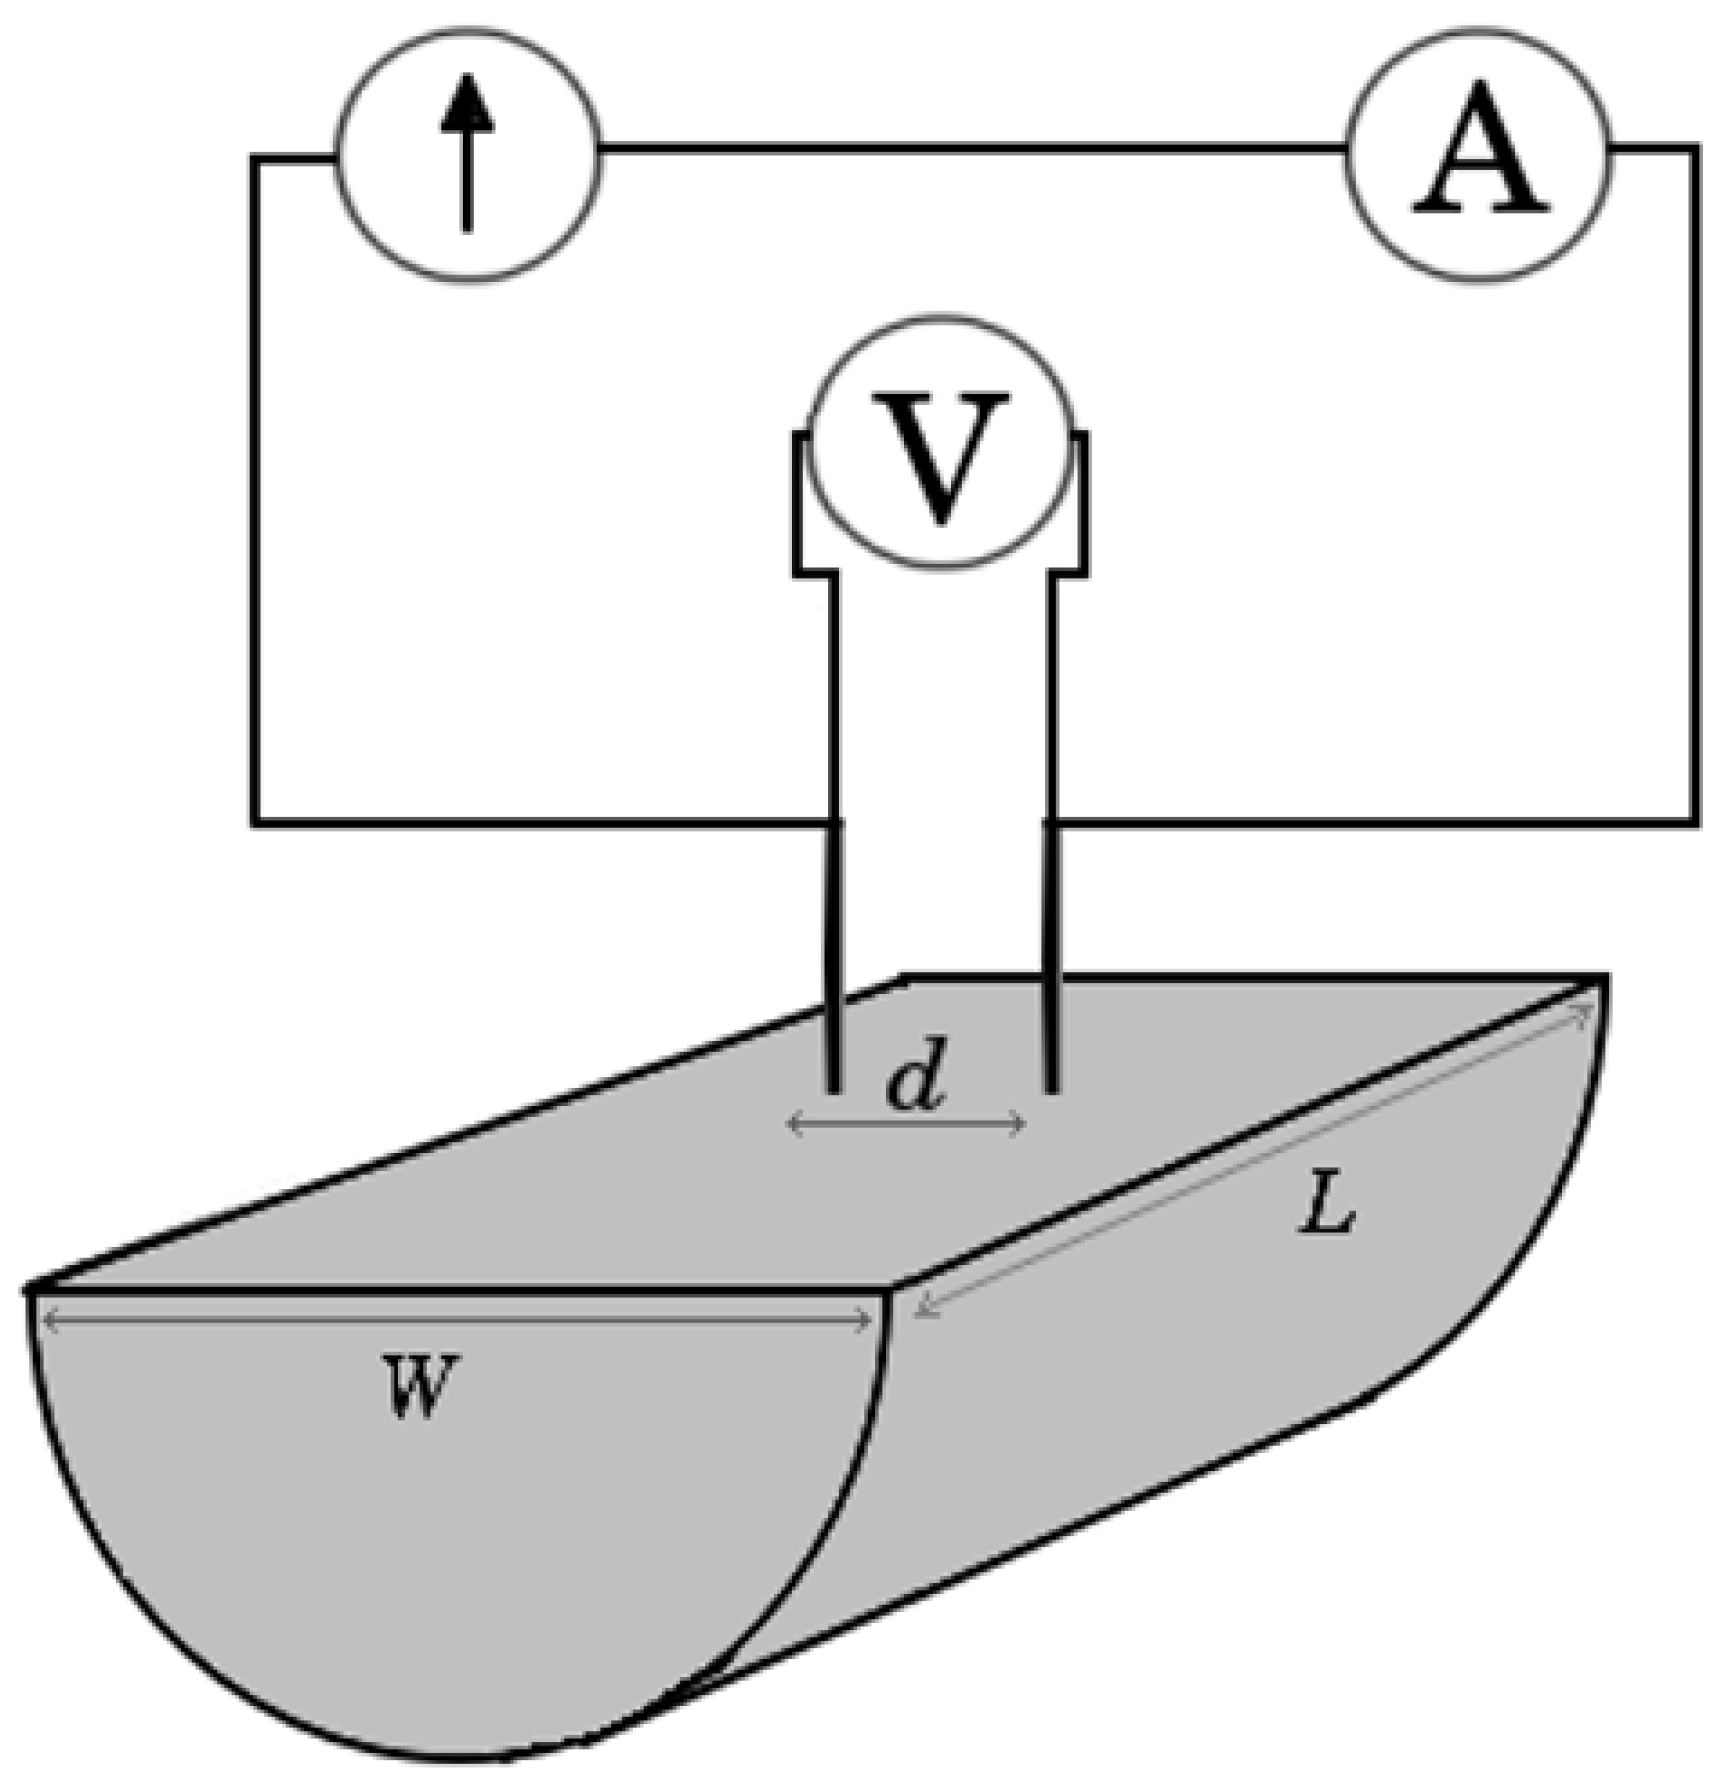
2.3. Electrical Resistance Tests

The electrical resistances of the samples were obtained using a two-probe method (in a modified version of the four-wire Kelvin method) [63,64]. Due to the small dimensions of the sample plane surfaces, the same pair of probes, separated by a distance (d) of 1.30 mm, was used to impinge the probe current and to measure the voltage on the device under test (DUT). The constant current values were adjusted with a precision digital ammeter connected in series with the DC source and the DUT, so the voltage drop was measured directly on the DUT using a precision digital voltmeter and a separated pair of wires. The high resistance of the digital voltmeter ensures the probe current flows predominantly through the DUT and that the measured voltage is the voltage drop (V)2 across the DUT, allowing an accurate resistance measurement. Figure 2 shows a scheme of the experimental setup.

3. Results

3.1. Microscopy of Treated Samples

Figure 3 presents the RLOM result. In these images, it is possible to verify the distribution of talc and graphite, in addition to the formation of diffusion zones between the precursor minerals.
Details of the interface zone between graphite and talc can be seen in the BSE-SEM images in Figure 4.
It was possible to verify that in all six samples, there was the formation of a diffusion zone, proving the success of experiments in simulating metamorphic rock structures from which the electrical resistance was measured.
The microscopy images showed that the samples treated under lower-pressure and temperature conditions (B-400-4 and B400-6) practically did not deform the flat surface of contact between the precursor minerals. This is indicative of an efficient mineral diffusion and intercalation process with low precursor crystal deformation, while in the other samples (MP-700-9, B-700-9, P-700-9, and P-900-9), despite having formed zones of efficient diffusion, the sample deformation was significant. The least efficient diffusion occurred in the MP-700-9 sample, as the minerals were already uniformly mixed before the thermobarometric treatment. The main phenomenon that occurred that was observed in this sample was the minerals’ dynamic recrystallization. Among the samples treated equally at 700 °C and 9 kbar, sample B-700-9 had the formation of a low-strain diffusion zone with greater efficiency, while P-700-9 showed strong deformation and formation of microfractures in the diffusion zone.

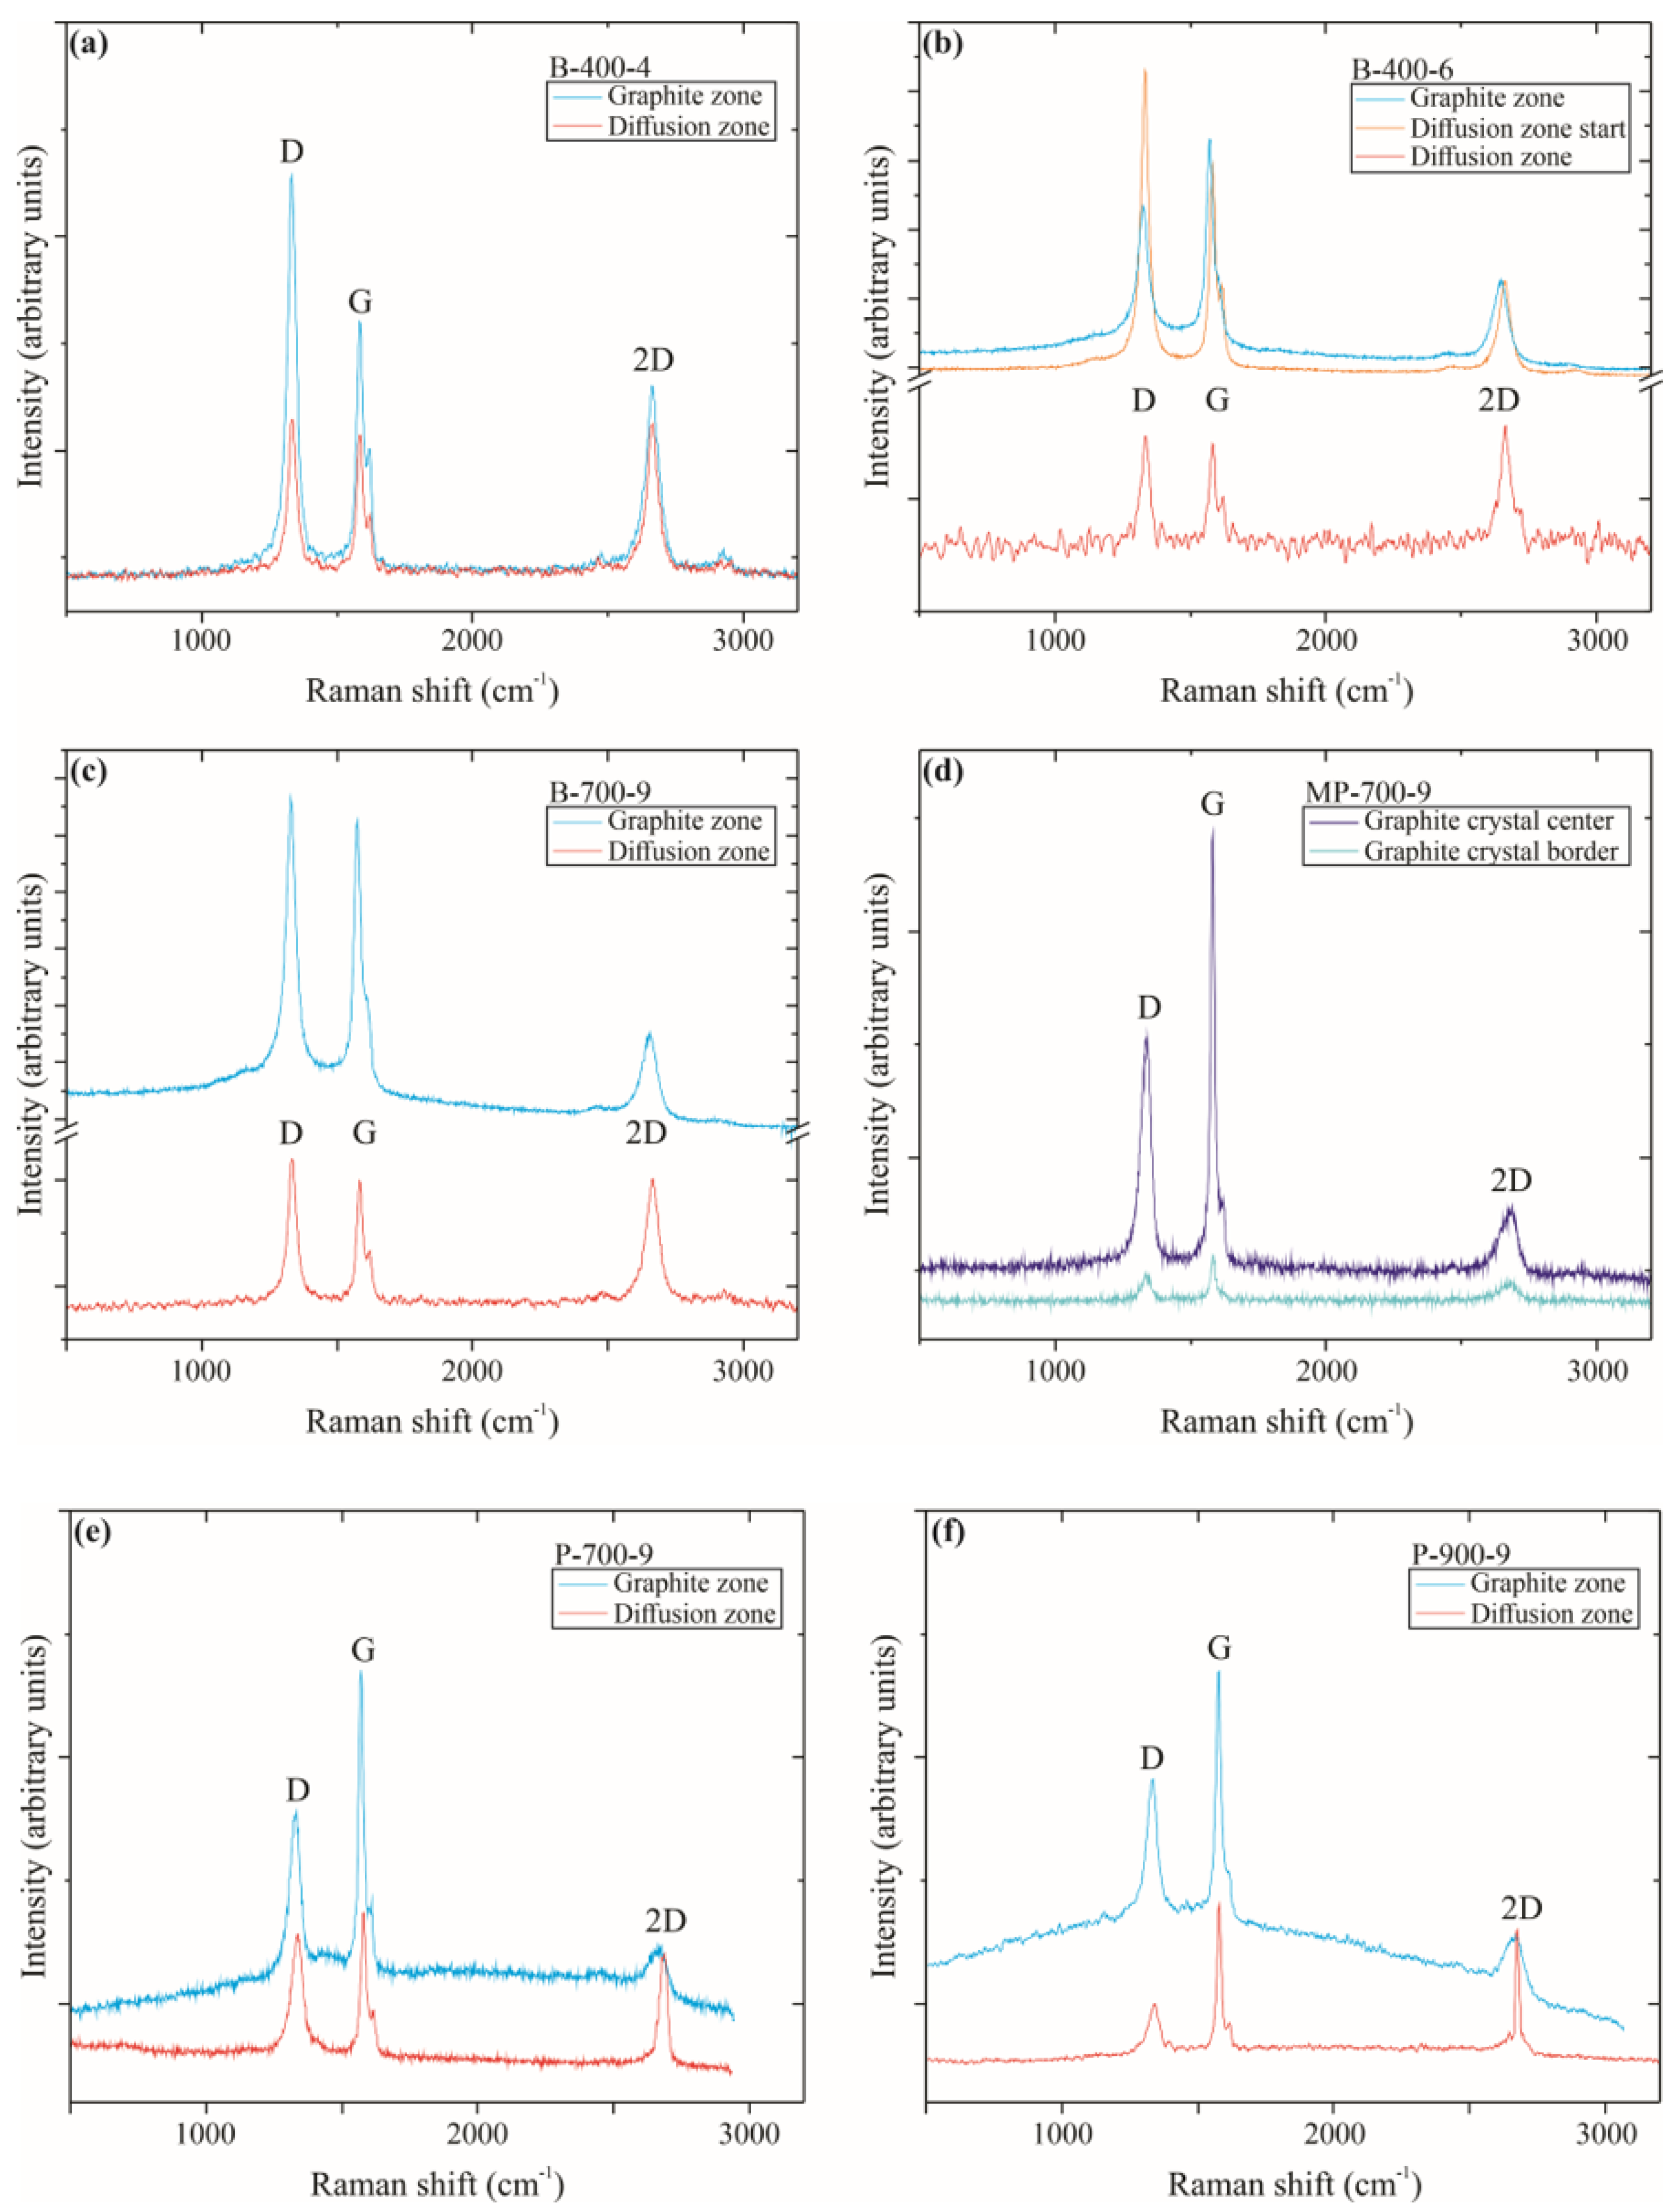
3.2. Raman Spectroscopy of Graphite and Graphene

Raman spectroscopy aimed to analyze the evolution of the graphite–graphene system from the pure graphite zone to the interior of the talc–graphite diffusion zone to show an effective disruption of the van der Waals forces in the graphitic structure. Graphene and graphite nanoplatelet formations are evidence of efficient exfoliation and, consequently, a reduction in electrical resistance in flakes in heterostructures. Figure 5 displays the Raman spectra of the six studied samples.
It is possible to observe that in all samples, there is a relative increase in the intensity of the 2D band in relation to the graphite G band in the diffusion zone. This is evidence of the efficient cleavage of graphite in all simulations of metamorphic conditions. It was also possible to observe an increase in the intensity of the D band in sample B-400-6 where the diffusion zone begins, revealing that before cleaving, the graphite deforms to form heterostructures. This happens because the graphitic structure is stressed before breaking the van der Waals interactions in the formation of heterostructures.

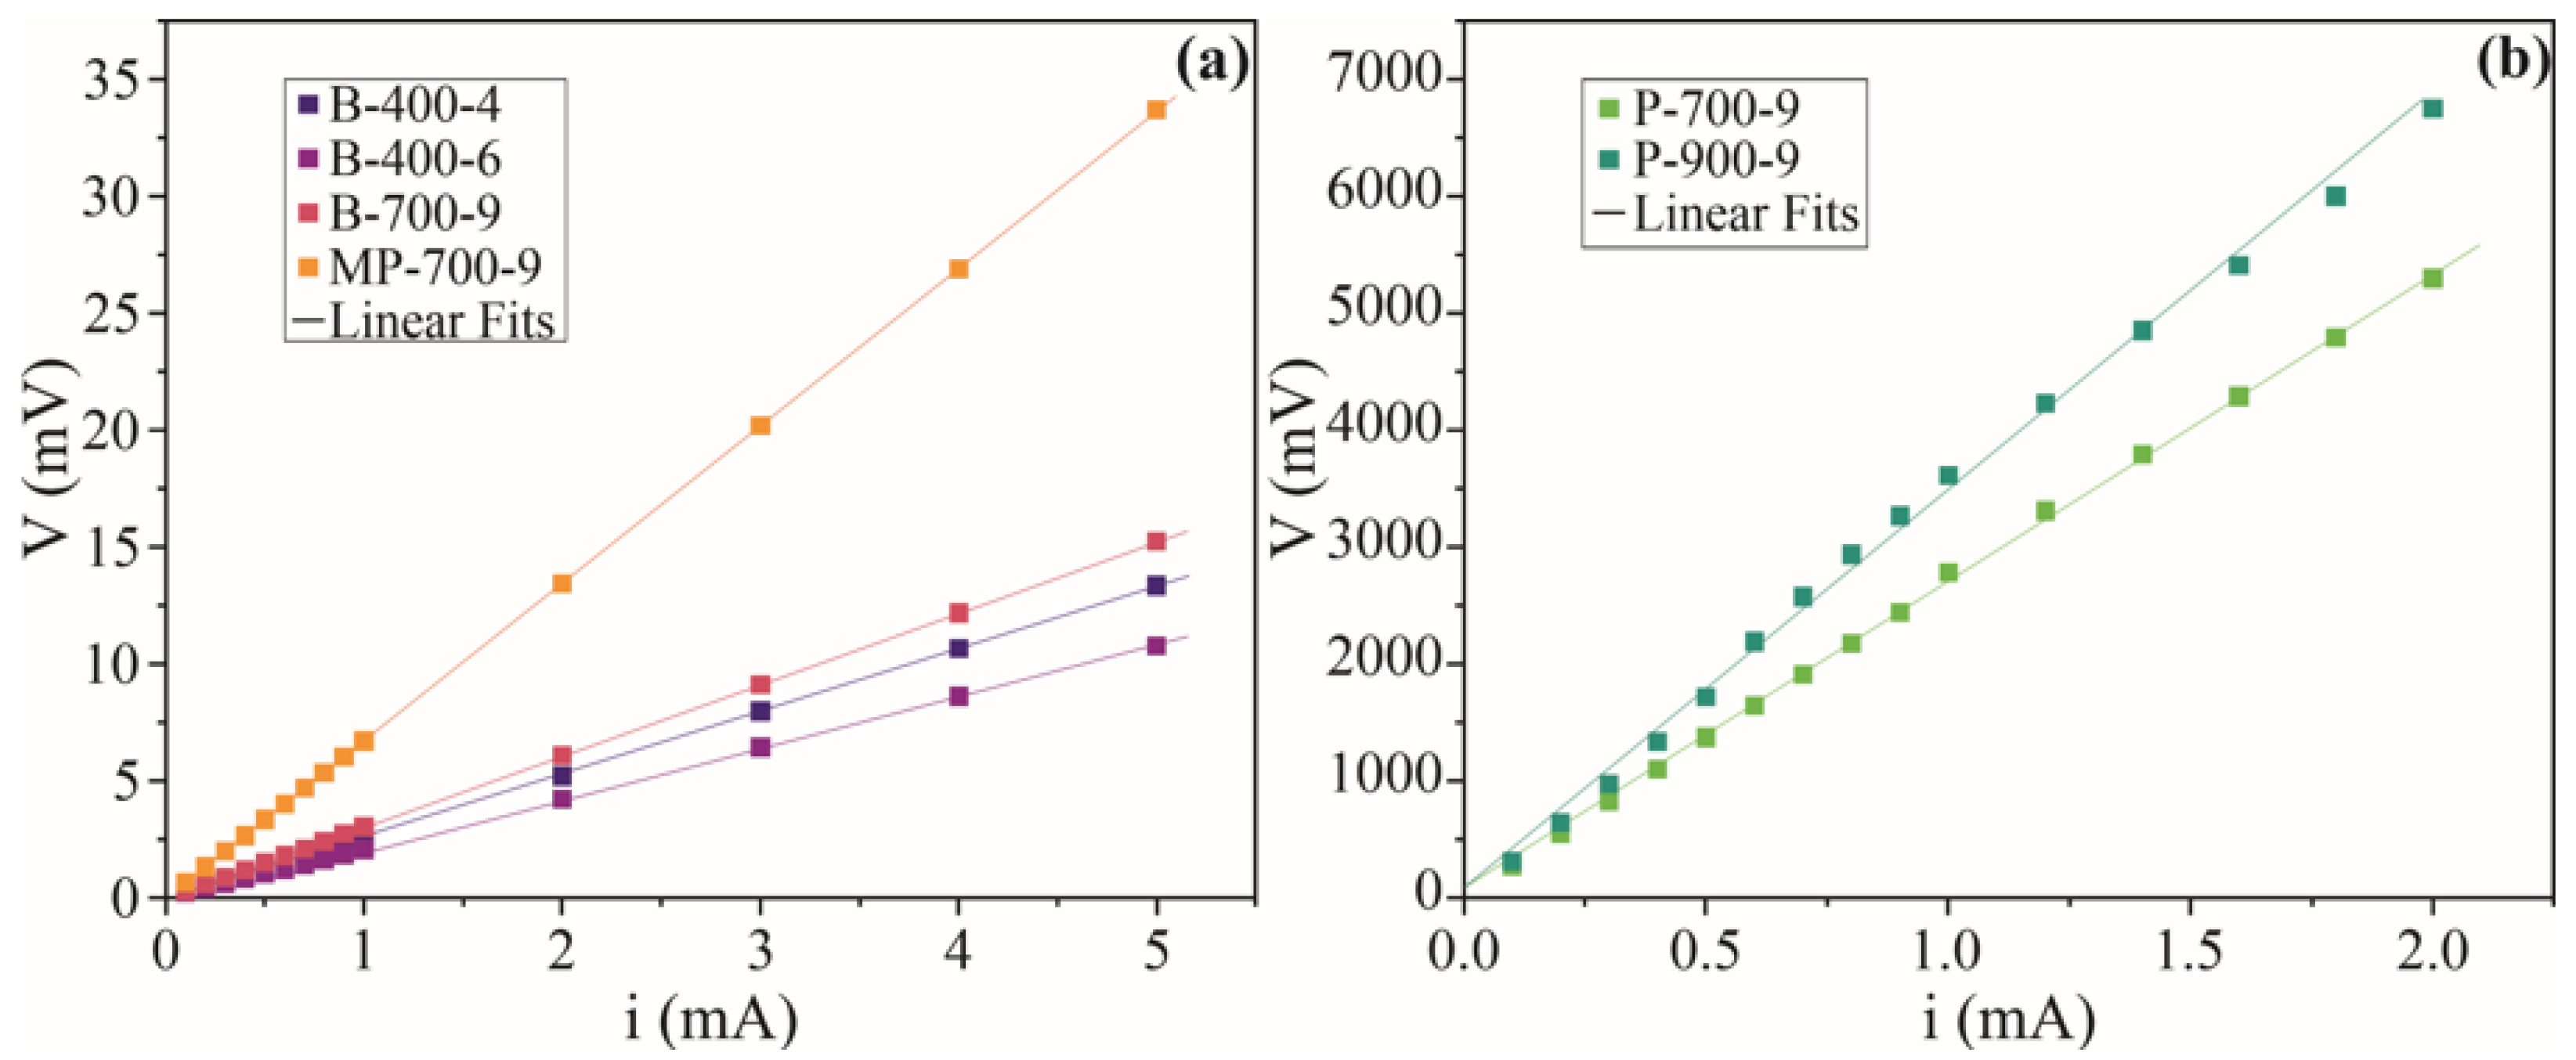
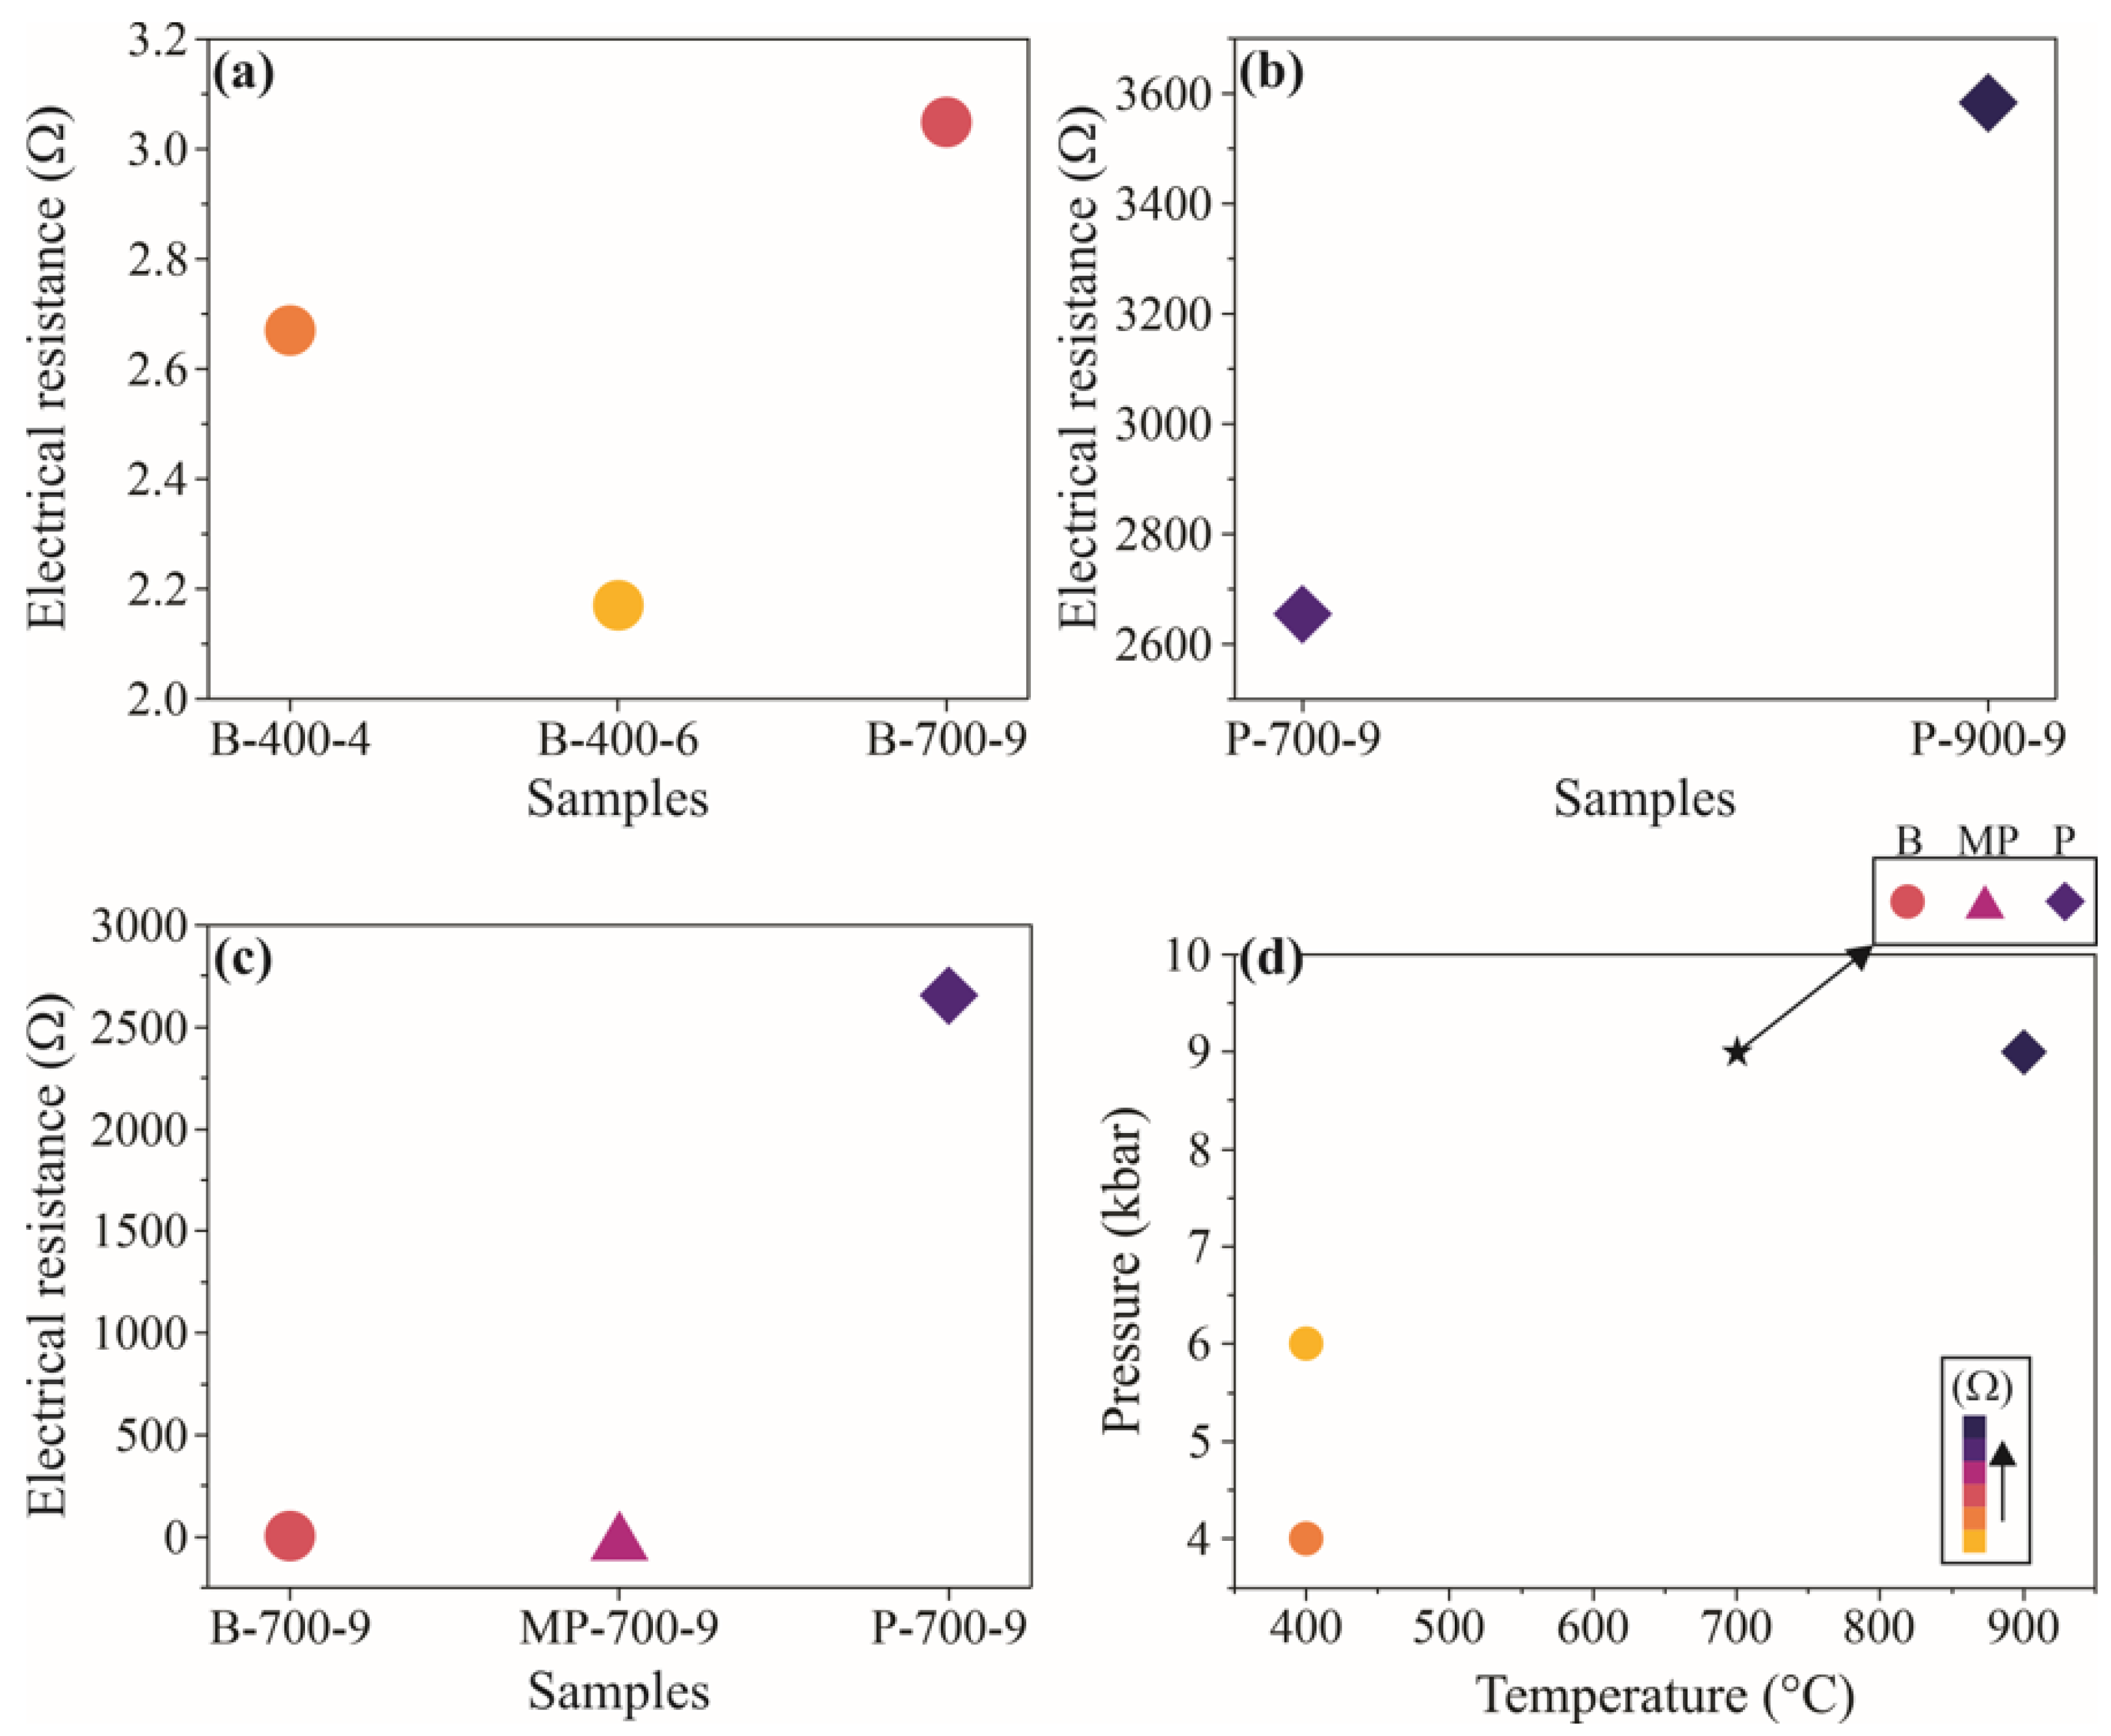
3.3. Electrical Resistance Tests

The V vs. I curves are shown in the Figure 6. The symbols represent the experimental data, while the lines are the linear fits obtained using commercial data analysis software. The probe current values were varied from zero up to 5 mA and 2 mA for the low (Figure 6a) and high resistance (Figure 6b) samples, respectively. In these ranges of current values, all samples presented ohmic behavior, so the electrical resistance could be obtained from the Ohm law (V = RI) as the linear coefficients of the linear fits. The results are shown in Table 1.

4. Discussion

Six samples were processed using a piston-cylinder apparatus to simulate the metamorphic behavior of natural talc and graphite for the formation of heterostructures. The choice of 400 °C and 4 kbar refers to conditions where these structures have already been reported in the literature [65,66]. Based on these conditions, the aim was to assess the progression of metamorphism for the cleavage and generation of graphite heterostructures in another mineral substrate.
All experiments were successful in forming a diffusion zone after 24 h of processing. The micrographs reveal that the samples treated at 700 °C and 900 °C deformed severely, losing the flat faces between the precursor minerals. The experiments at 400 °C, on the other hand, formed diffusion zones but preserved the original structure of the precursor minerals in the sample holder.
The graphite zone showed uniform behavior in all samples following Raman spectroscopy. The G band in all graphite zones was always more intense than the 2D band. Similarly, Raman spectra acquired from the diffusion zone of all experimental products revealed an approximation of the intensity of the G and 2D bands. This represents a significant reduction in the van der Waals forces of the mineral structure compared to its covalent bonds, which is indicative of efficient cleavage.
Considering the potential of graphene and its associated materials as an electrical superconductor at room temperature, the electrical resistivity of the heterostructures formed in the diffusion zone was measured to verify which metamorphism conditions allowed the formation of less resistive flakes.
Figure 7 shows the electrical resistance as a function of the samples. In Figure 7a, it is possible to observe the electrical resistance of the samples in billets, showing that the conditions of lower resistance are those observed in B-400-6. Figure 7b reveals the electrical behavior of the powdered samples, highlighting the greater resistance obtained in the experiments on the P-900-9 sample. As there was the beginning of the talc phase transition and the formation of other more resistive minerals, the diffusion zone did not allow the fine flakes formed to communicate and reduce the electrical conductivity in this sample. Figure 7c shows the comparison of samples treated at 700 °C and 9 kbar under different disposition of precursor minerals. Figure 7c shows the comparison of samples treated at 700 °C and 9 kbar under different disposition of precursor minerals. It is possible to observe that the samples in adjacent powders are not efficient in communicating fine heterostructures of low electrical resistance, whereas in the samples in billets, diffusion occurs in the most prominent way and maintains the communicating flakes. The sample in homogeneous mixed powders presents communicant flakes; however, the exfoliation of the graphitic structure is less prominent, which justifies the intermediate resistance. Figure 7d summarizes all electrical characterization results as a function of the pressure and temperature conditions of each sample.
The highest values of electrical resistance were obtained in samples P-700-9 and P-900-9. As the P-900-9 sample surpassed the talc stability temperature at 9 kbar, there was the beginning of the formation of other mineral phases (such as enstatite and quartz) that do not have a planar structure and do not act as an efficient substrate for exfoliated graphites. Despite the treatment conditions of the P-700-9 sample maintaining the stability of the precursor minerals, the high pressure is more efficient in deforming the precursor crystals than in allowing the interdigitation of talc and graphite, fundamental for the formation of heterostructures with lower electrical resistance.

5. Conclusions

The results indicate that graphene formation is feasible in metamorphism and shearing of graphite and talc-bearing rocks. If talc is the mineral substrate for natural graphenes, the most suitable metamorphism temperature occurs below 700 °C, guaranteeing the thermal stability of talc.
To ensure the barometric stability of graphite, it is important that the pressure does not exceed 9 kbar. At the same time, it was possible to observe that pressures above 6 kbar are severe enough to deform the minerals in a non-planar way, which compromises the formation of communicating heterostructures that are, consequently, less electrically resistive.
The most efficient way to form heterostructures of low electrical resistance is from precursor minerals in billets. This arrangement favors the formation of communicating heterostructures that are more electrically conductive.
It was possible to verify that graphene and other 2D structures can be prospected in natural rocks when there are favorable mineralogical and tectonic contexts for their formation and stabilization. The electrical resistance survey can be used as a preliminary analysis tool, in fieldwork or even in a laboratory environment, to assess whether a given metamorphic graphite-bearing rock may have stabilized graphite nanoplatelets and graphene in its structure. Based on systematic surveys and discoveries of areas where this phenomenon is complete, it will be possible to obtain graphene in abundance as mineral resources.

Author Contributions

Conceptualization, A.G.N.; Methodology, A.G.N. and F.R.D.d.A.; Validation, A.G.N. and F.R.D.d.A.; Formal analysis, A.G.N., F.R.D.d.A., A.F.S.-N., J.N.R., R.B.d.S., S.R.F.V. and R.A.A.; Investigation, A.G.N., F.R.D.d.A., A.F.S.-N., J.N.R., R.B.d.S., S.R.F.V. and R.A.A.; Resources, A.G.N., F.R.D.d.A., A.F.S.-N., J.N.R., R.B.d.S., S.R.F.V. and R.A.A.; Data curation, A.G.N., F.R.D.d.A., A.F.S.-N., J.N.R., R.B.d.S., S.R.F.V. and R.A.A.; Writing—original draft, A.G.N. and F.R.D.d.A.; Writing—review & editing, A.G.N., F.R.D.d.A. and A.F.S.-N. Supervision, A.G.N. and F.R.D.d.A.; Project administration, A.G.N. Funding acquisition, S.R.F.V. All authors have read and agreed to the published version of the manuscript.

Funding

This research received no external funding.

Data Availability Statement

All the raw data used in this work can be obtained by contacting the corresponding author via email request.

Acknowledgments

The authors would like to thank the Laboratory of Petrology and Experimental Geochemistry of the Multiusuary Geoanalytical Center (CMGeo), in addition to the Laboratory of Petrographic Microscopy Laboratory and Laboratory of Scanning Electronic Microscopy (LabMev) of the IGc-USP for carrying out, respectively, the test on the piston-cylinder apparatus and microscopic characterization of the samples; the Laboratory of Molecular Spectroscopy (LEM) at IQ-USP for the Raman spectroscopy characterization; and the Laboratory of Magnetism and Magnetic Materials at Federal University of Santa Maria (UFSM) for electrical tests and Professor. The authors also thank Romario Trentin from UFSM who made the initial electrical tests possible.

Conflicts of Interest

The authors declare no conflict of interest. The funders had no role in the design of the study; in the collection, analyses, or interpretation of data; in the writing of the manuscript; or in the decision to publish the results.

References

  1. Geim, A.K.; Novoselov, K.S. The rise of graphene. Nat. Mater. 2007, 6, 183–191. [Google Scholar] [CrossRef]
  2. Novoselov, K.S.; Geim, A.K.; Morozov, S.V.; Jiang, D.; Zhang, Y.; Dubonos, S.V.; Grigorieva, I.V.; Firsov, A.A. Electric Field Effect in Atomically Thin Carbon Films. Science 2004, 306, 666–669. [Google Scholar] [CrossRef] [PubMed] [Green Version]
  3. Schwierz, F. Graphene Transistors: Status, Prospects, and Problems. Proc. IEEE 2013, 101, 1567–1584. [Google Scholar] [CrossRef]
  4. Tiwari, S.K.; Sahoo, S.; Wang, N.; Huczko, A. Graphene research and their outputs: Status and prospect. J. Sci. Adv. Mater. Devices 2020, 5, 10–29. [Google Scholar] [CrossRef]
  5. Geim, A.K. Graphene: Status and Prospects. Science 2009, 324, 1530–1534. [Google Scholar] [CrossRef] [Green Version]
  6. Liao, L.; Lin, Y.C.; Bao, M.; Cheng, R.; Bai, J.; Liu, Y.; Qu, Y.; Wang, K.L.; Huang, Y.; Duan, X. High-speed graphene transistors with a self-aligned nanowire gate. Nature 2010, 467, 305–308. [Google Scholar] [CrossRef] [Green Version]
  7. Sreeprasad, T.S.; Berry, V. How Do the Electrical Properties of Graphene Change with its Functionalization? Small 2012, 9, 341–350. [Google Scholar] [CrossRef]
  8. Cusati, T.; Fiori, G.; Gahoi, A.; Passi, V.; Lemme, M.C.; Fortunelli, A.; Iannaccone, G. Electrical properties of graphene-metal contacts. Sci. Rep. 2017, 7, 5109. [Google Scholar] [CrossRef] [Green Version]
  9. Guan, J.; Jia, C.; Li, Y.; Liu, Z.; Wang, J.; Yang, Z.; Gu, C.; Su, D.; Houk, K.N.; Zhang, D.; et al. Direct single-molecule dynamic detection of chemical reactions. Sci. Adv. 2018, 4, eaar2177. [Google Scholar] [CrossRef] [Green Version]
  10. Aguillon, F.; Marinica, D.C.; Borisov, A.G. Molecule Detection with Graphene Dimer Nanoantennas. J. Phys. Chem. C 2020, 124, 28210–28219. [Google Scholar] [CrossRef]
  11. Yang, C.; Yang, C.; Guo, Y.; Feng, J.; Guo, X. Graphene–molecule–graphene single-molecule junctions to detect electronic reactions at the molecular scale. Nat. Protoc. 2023, 18, 1958–1978. [Google Scholar] [CrossRef] [PubMed]
  12. Nag, A.; Mitra, A.; Mukhopadhyay, S.C. Graphene and its sensor-based applications: A review. Sens. Actuators A Phys. 2018, 270, 177–194. [Google Scholar] [CrossRef]
  13. Liu, J.; Bao, S.; Wang, X. Applications of Graphene-Based Materials in Sensors: A Review. Micromachines 2022, 13, 184. [Google Scholar] [CrossRef] [PubMed]
  14. Fu, W.; Jiang, L.; van Geest, E.P.; Lima, L.M.C.; Schneider, G.F. Sensing at the Surface of Graphene Field-Effect Transistors. Adv. Mater. 2016, 29, 1603610. [Google Scholar] [CrossRef] [PubMed] [Green Version]
  15. Giubileo, F.; Di Bartolomeo, A. The role of contact resistance in graphene field-effect devices. Prog. Surf. Sci. 2017, 92, 143–175. [Google Scholar] [CrossRef] [Green Version]
  16. Lu, N.; Wang, L.; Li, L.; Liu, M. A review for compact model of graphene field-effect transistors. Chin. Phys. B 2017, 26, 036804. [Google Scholar] [CrossRef] [Green Version]
  17. Ma, Y.; Zhi, L. Graphene-Based Transparent Conductive Films: Material Systems, Preparation and Applications. Small Methods 2018, 3, 1800199. [Google Scholar] [CrossRef] [Green Version]
  18. Suriani, A.B.; Muqoyyanah; Mohamed, A.; Alfarisa, S.; Mamat, M.H.; Ahmad, M.K.; Birowosuto, M.D.; Soga, T. Synthesis, transfer and application of graphene as a transparent conductive film: A review. Bull. Mater. Sci. 2020, 43, 310. [Google Scholar] [CrossRef]
  19. Miao, J.; Fan, T. Flexible and stretchable transparent conductive graphene-based electrodes for emerging wearable electronics. Carbon 2023, 202, 495–527. [Google Scholar] [CrossRef]
  20. Allen, M.J.; Tung, V.C.; Kaner, R.B. Honeycomb Carbon: A Review of Graphene. Chem. Rev. 2010, 110, 132–145. [Google Scholar] [CrossRef]
  21. Novoselov, K.S. Graphene: Materials in the Flatland (Nobel Lecture). Angew. Chem. Int. Ed. 2011, 50, 6986–7002. [Google Scholar] [CrossRef] [PubMed]
  22. Kin, Y.J.; Kin, Y.; Novoselov, K.; Hong, B.H. Engineering electrical properties of graphene: Chemical approaches. 2D Mater. 2015, 2, 042001. [Google Scholar] [CrossRef]
  23. Kiesel, M.L.; Platt, C.; Hanke, W.; Abanin, D.A.; Thomale, R. Competing many-body instabilities and unconventional superconductivity in graphene. Phys. Rev. B 2012, 86, 020507. [Google Scholar] [CrossRef] [Green Version]
  24. Han, T.H.; Kim, H.; Kwon, S.J.; Lee, T.W. Graphene-based flexible electronic devices. Mater. Sci. Eng. R 2017, 118, 1–43. [Google Scholar] [CrossRef]
  25. Kong, W.; Kum, H.; Bae, S.H.; Shim, J.; Kim, H.; Kong, L.; Meng, Y.; Wang, K.; Kim, C.; Kim, J. Path towards graphene commercialization from lab to market. Nat. Nanotechnol. 2019, 14, 927–938. [Google Scholar] [CrossRef] [PubMed]
  26. Zurutuza, A.; Marinelli, C. Challenges and opportunities in graphene commercialization. Nat. Nanotechnol. 2014, 9, 730–734. [Google Scholar] [CrossRef] [PubMed]
  27. Bøggild, P.; Mackenzie, D.M.A.; Whelan, P.R.; Petersen, D.H.; Buron, J.D.; Zurutuza, A.; Gallop, J.; Hao, L.; Jepsen, P.U. Mapping the electrical properties of large-area graphene. 2D Mater. 2017, 4, 042003. [Google Scholar] [CrossRef] [Green Version]
  28. Nobre, A.G.; Martínez, J.A.E.; Florêncio, O. Mineral Nanotechnology in Circular Economy. In Smart Innovation, Systems and Technologies; Iano, Y., Saotome, O., Kemper, G., Seixas, A.C.M., Oliveira, G.G., Eds.; Springer: Cham, Switzerland, 2021; Volume 233, pp. 220–226. [Google Scholar] [CrossRef]
  29. Nobre, A.G.; da Silva, L.P.N.; Andrade, F.R.D. Graphene Geology and the Fourth Industrial Revolution. In Smart Innovation, Systems and Technologies; Iano, Y., Saotome, O., Vásquez, G.L.K., Pezzuto, C.C., Arthur, R., Oliveira, G.G., Eds.; Springer: Cham, Switzerland, 2022; Volume 207, pp. 342–348. [Google Scholar] [CrossRef]
  30. Yardley, B.; Warren, C. An Introduction to Metamorphic Petrology; Cambridge University Press: Cambridge, UK, 2021. [Google Scholar] [CrossRef]
  31. Nobre, A.G.; Martínez, J.A.E.; Terence, M.C.; Florêncio, O. The action of shear zones in the natural availability of graphite nanoplatelets: The example of the metadolomites of the Itaiacoca Group and the mica schist of the Dom Silverio Group. Braz. J. Anim. Environ. Res. 2020, 3, 3108–3118. [Google Scholar] [CrossRef]
  32. Alaferdov, A.V.; Gholamipour-Shirazi, A.; Canesqui, M.A.; Danilov, Y.A.; Mashkalev, S.A. Size-controlled synthesis of graphite nanoflakes and multi-layer graphene by liquid phase exfoliation of natural graphite. Carbon 2014, 69, 525–535. [Google Scholar] [CrossRef]
  33. Kottegoda, I.R.M.; Gao, X.; Nayanajith, L.D.C.; Manorathne, C.H.; Wang, J.; Wang, J.Z.; Liu, H.K.; Gofer, Y. Comparison of Few-layer Graphene Prepared from Natural Graphite through Fast Synthesis Approach. J. Mater. Sci. Technol. 2015, 31, 907–912. [Google Scholar] [CrossRef]
  34. Suragtkhuu, S.; Tserendavag, O.; Vandandoo, U.; Bati, A.S.R.; Bat-Erdene, M.; Shapter, J.G.; Batmunkh, M.; Davaasambuu, S. Efficiency and stability enhancement of perovskite solar cells using reduced graphene oxide derived from earth-abundant natural graphite. RSC Adv. 2020, 10, 9133–9139. [Google Scholar] [CrossRef]
  35. Mu, Y.; Han, M.; Li, J.; Liang, J.; Yu, J. Growing vertical graphene sheets on natural graphite for fast charging lithium-ion batteries. Carbon 2021, 173, 477–484. [Google Scholar] [CrossRef]
  36. Frisenda, R.; Niu, Y.; Gant, P.; Muñoz, M.; Castellanos-Gomez, A. Naturally occurring van der Waals materials. npj 2D Mater. Appl. 2020, 4, 38. [Google Scholar] [CrossRef]
  37. Zhou, Y.; LaChance, A.M.; Smith, A.T.; Cheng, H.; Liu, Q.; Sun, L. Strategic Design of Clay-Based Multifunctional Materials: From Natural Minerals to Nanostructured Membranes. Adv. Funct. Mater. 2019, 29, 1807611. [Google Scholar] [CrossRef]
  38. Saha, K.; Deka, J.; Gogoi, R.K.; Datta, K.K.R.; Raidongia, K. Applications of Lamellar Membranes Reconstructed from Clay Mineral-Based Nanosheets: A Review. ACS Appl. Nano Mater. 2022, 5, 15972–15999. [Google Scholar] [CrossRef]
  39. Liu, S.; Zou, D.; Yu, X.; Wang, Z.; Yang, Z. Transfer-Free PZT Thin Films for Flexible Nanogenerators Derived from a Single-Step Modified Sol–Gel Process on 2D Mica. ACS Appl. Mater. Interfaces 2020, 12, 54991–54999. [Google Scholar] [CrossRef]
  40. Piao, H.; Choi, G.; Rejinold, N.S.; Vinu, A.; Choy, J.H. g-C3N4 Monolayer/2D Mica Nanohybrids with Highly Effective UV–HEV-Screening Function. Adv. Mater. Interfaces 2023, 10, 2202486. [Google Scholar] [CrossRef]
  41. Ulian, G.; Moro, D.; Valdrè, G. Electronic and optical properties of graphene/molybdenite bilayer composite. Compos. Struct. 2021, 255, 112978. [Google Scholar] [CrossRef]
  42. Li, L.; Wang, H.; Liang, T.; Cao, J.M.; Yan, C.; Wu, X.L. Natural ore molybdenite as a high-capacity and cheap anode material for advanced lithium-ion capacitors. Nanotechnology 2022, 33, 255401. [Google Scholar] [CrossRef]
  43. Vasić, B.; Czibula, C.; Kratzer, M.; Neves, B.R.A.; Matković, A.; Teichert, C. Two-dimensional talc as a van der Waals material for solid lubrication at the nanoscale. Nanotechnology 2021, 32, 265701. [Google Scholar] [CrossRef]
  44. Zhao, J.; Gao, T.; Dang, J.; Cao, W.; Wang, Z.; Li, S.; Shi, Y. Using Green, Economical, Efficient Two-Dimensional (2D) Talc Nanosheets as Lubricant Additives under Harsh Conditions. Nanomaterials 2022, 12, 1666. [Google Scholar] [CrossRef] [PubMed]
  45. Nobre, A.G.; Salazar-Naranjo, A.F.; Andrade, F.R.D.; Vlach, S.R.F.; Ando, R.A. Simulation of geological graphene genesis by the piston-cylinder apparatus. Matéria 2022, 27, e20220122. [Google Scholar] [CrossRef]
  46. Alencar, A.B.; Barboza, A.P.M.; Archanjo, B.S.; Chacham, H.; Neves, B.R.A. Experimental and theoretical investigations of monolayer and few-layer talc. 2D Mater. 2015, 2, 015004. [Google Scholar] [CrossRef]
  47. Mania, E.; Alencar, A.B.; Cadore, A.R.; Carvalho, B.R.; Watanabe, K.; Taniguchi, T.; Neves, B.R.A.; Chacham, H.; Campos, L.C. Spontaneous doping on high quality talc-graphene-hBN van der Waals heterostructures. 2D Mater. 2017, 4, 031008. [Google Scholar] [CrossRef]
  48. Barcelos, I.D.; Cadore, A.R.; Alencar, A.B.; Maia, F.C.B.; Mania, E.; Oliveira, R.F.; Bufon, C.C.B.; Malachias, A.; Freitas, R.O.; Moreira, R.L.; et al. Infrared Fingerprints of Natural 2D Talc and Plasmon–Phonon Coupling in Graphene–Talc Heterostructures. ACS Photonics 2018, 5, 1912–1918. [Google Scholar] [CrossRef] [Green Version]
  49. Yakobson, B.I.; Ding, F. Observational Geology of Graphene, at the Nanoscale. ACS Nano 2011, 5, 1569–1574. [Google Scholar] [CrossRef]
  50. Wong, C.H.A.; Sofer, Z.; Pumera, M. Geographical and Geological Origin of Natural Graphite Heavily Influence the Electrical and Electrochemical Properties of Chemically Modified Graphenes. Chem.-Eur. J. 2015, 21, 8435–8440. [Google Scholar] [CrossRef]
  51. Prinsloo, L.C.; Bordes, L.; Mauran, G.; Lombard, M.; Wadley, L. Graphite and multilayer graphene detected on ~70,000-year-old stone tools: Geological origin or constituent of hafting resin? J. Raman Spectrosc. 2022, 54, 182–190. [Google Scholar] [CrossRef]
  52. Boccard, N. Commodities & Sustainability. SSRN 2021, 1, 1–37. [Google Scholar] [CrossRef]
  53. Hushko, S.; Botelho, J.M.; Maksymova, I.; Slusarenko, K.; Kulishov, V. Sustainable development of global mineral resources market in Industry 4.0 context. IOP Conf. Ser. Earth Environ. Sci. 2021, 628, 012025. [Google Scholar] [CrossRef]
  54. Boyd, F.R.; England, J.L. Apparatus for phase-equilibrium measurements at pressures up to 50 kilobars and temperatures up to 1750 °C. J. Geophys. Res. 1960, 65, 741–748. [Google Scholar] [CrossRef]
  55. Holloway, J.R.; Wood, B.J. Simulating the Earth: Experimental Geochemistry, 1st ed.; Springer Science & Business Media: London, UK, 2012. [Google Scholar]
  56. Vlach, S.R.F.; Salazar-Naranjo, A.F.; Torres-Corredor, J.S.; Carvalho, P.R.; Mallmann, G. Calibration of high-temperature furnace assemblies for experiments between 200 and 600 MPa with end-loaded piston-cylinder apparatuses. Braz. J. Geol. 2019, 49, 1–7. [Google Scholar] [CrossRef]
  57. Pawley, A.R.; Wood, B.J. The high-pressure stability of talc and 10 Å phase: Potential storage sites for H2O in subduction zones. Am. Mineral. 1995, 9, 998–1003. [Google Scholar] [CrossRef]
  58. Oganov, A.R.; Hemley, R.J.; Hazen, R.M.; Jones, A.P. Structure, Bonding, and Mineralogy of Carbon at Extreme Conditions. Rev. Mineral. Geochem. 2013, 75, 47–77. [Google Scholar] [CrossRef]
  59. Tuinstra, F.; Koenig, J.L. Raman Spectrum of Graphite. J. Chem. Phys. 1970, 53, 1126–1130. [Google Scholar] [CrossRef] [Green Version]
  60. Ferrari, A.C.; Meyer, J.C.; Scardaci, V.; Casiraghi, C.; Lazzeri, M.; Mauri, F.; Piscanec, S.; Jiang, D.; Novoselov, K.S.; Roth, S.; et al. Raman spectrum of graphene and graphene layers. Phys. Rev. Lett. 2006, 97, 187401. [Google Scholar] [CrossRef] [PubMed] [Green Version]
  61. Ferrari, A.C. Raman spectroscopy of graphene and graphite: Disorder, electron–phonon coupling, doping and nonadiabatic effects. Solid State Commun. 2007, 143, 47–57. [Google Scholar] [CrossRef]
  62. Singh, V.; Joung, D.; Zhai, L.; Das, S.; Khondaker, S.; Seal, S. Graphene based materials: Past, present and future. Prog. Mater. Sci. 2011, 56, 1178–1271. [Google Scholar] [CrossRef]
  63. Martin, J.P. Measuring resistance/impedance with the four-wire Kelvin method. Watts Curr. Tech. Bull. 2014, 1, 1–11. [Google Scholar]
  64. Heaney, M.B. Electrical Conductivity and Resistivity. In Electrical Measurement, Signal Processing, and Displays; CRC Press: Boca Raton, FL, USA, 2003. [Google Scholar]
  65. Szabó, G.A.J.; Andrade, F.R.D.; Guimarães, G.B.; Carvalho, F.M.S.; Moya, F.A. As Jazidas de Talco no Contexto da História Metamórfica dos Metadolomitos do Grupo Itaiacoca, PR. Geol. USP Série Científica 2006, 5, 13–31. [Google Scholar] [CrossRef]
  66. Saunite, D.M.; Bello, R.M.S.; Andrade, F.R.D.; Szabó, G.A.J. Metadolomitos talcificados do Grupo Itaiacoca, Paraná: Regime de fluidos e implicações genéticas. Geol. USP Série Científica 2011, 11, 171–187. [Google Scholar] [CrossRef] [Green Version]
Figure 1. The 3/4” furnace assembly used in samples processing at the piston-cylinder apparatus.
Carbon 09 00075 g001
Figure 2. Experimental setup used for the electrical resistance measurement. L = 6 mm; w = 2.6 mm; d ≅ 1.30 mm; V: voltmeter; A: ammeter.
Carbon 09 00075 g002
Figure 3. RLOM photomicrographs. (a) B-400-4; (b) B-400-6; (c) B-700-9; (d) MP-700-9; (e) P-700-9; (f) P-900-9.
Carbon 09 00075 g003
Figure 4. BSE-SEM photomicrographs. (a) B-400-4; (b) B-400-6; (c) B-700-9; (d) MP-700-9; (e) P-700-9; (f) P-900-9.
Carbon 09 00075 g004
Figure 5. Results of graphite–graphene system Raman spectroscopy. (a) B-400-4; (b) B-400-6; (c) B-700-9; (d) MP-700-9; (e) P-700-9; (f) P-900-9.
Carbon 09 00075 g005
Figure 6. Measurements of electrical resistance as a function of V and I. (a) The V vs. I curves for the low-resistance samples. (b) The V vs. I curves for the high-resistance samples.
Carbon 09 00075 g006
Figure 7. Compilation of electrical resistance data as a function of thermobarometric treatment. (a) Samples in billets. (b) Adjacent powder samples. (c) Comparison of samples arranged differently in the sample holder and uniformly treated at 700 °C and 9 kbar. (d) Compilation of electrical resistance as a function of pressure and temperature of each evaluated sample.
Carbon 09 00075 g007
Table 1. Resistance values obtained from the linear fit of the V vs. I curves.
SampleResistance (Ω)
B-400-42.67
B-400-62.17
B-700-93.05
MP-700-96.51
P-700-92655.00
P-900-93583.00
Disclaimer/Publisher’s Note: The statements, opinions and data contained in all publications are solely those of the individual author(s) and contributor(s) and not of MDPI and/or the editor(s). MDPI and/or the editor(s) disclaim responsibility for any injury to people or property resulting from any ideas, methods, instructions or products referred to in the content.

