Article

Investigation of Electron Transfer Mechanistic Pathways of Ferrocene Derivatives in Droplet at Carbon Electrode

1
Department of Chemistry, Quaid-Azam University, Islamabad 45320, Pakistan
2
School of Applied Sciences and Humanities, National University of Technology (NUTECH), Islamabad 44000, Pakistan
*
Author to whom correspondence should be addressed.
Submission received: 13 August 2022 / Revised: 3 September 2022 / Accepted: 7 September 2022 / Published: 9 September 2022

Abstract

:
The results of cyclic, differential pulse and square wave voltammetric studies of four ferrocene derivatives, i.e., 4-ferrocenyl-3-methyl aniline (FMA), 3-Chloro-4-ferrocenyl aniline (CFA), 4-ferrocenyl aniline (FA) and ferrocenyl benzoic acid (FBA) on carbon electrode, revealed that the redox behavior of these compounds is sensitive to pH, concentration, scan number and scan rate. One electron, diffusion controlled, with a quasi-reversible redox signal displaying ferrocene/ferrocenium couple was observed for each of the studied ferrocenyl derivatives. Quasi-reversibility of this signal is evidenced by ∆Ep, Ia/Ic current ratio and ksh values. Another one electron and one proton irreversible oxidation signal was noticed in the voltammograms of these compounds except FBA. This signal corresponds to the electro-oxidation of the amine group and its irreversibility, as supported by ∆Ep, Ia/Ic current ratio and ksh values, is due to the influence of the electron donating nature of the amine group. A number of electrochemical parameters such as D, ksh, LOD and LOQ were evaluated for the targeted ferrocene derivatives. The obtained parameters are expected to provide insights into the redox mechanism for understanding their biochemical actions. The electrochemistry presented in this work is done using a unique environmentally benign and cost-effective droplet electrochemical approach.

Graphical Abstract

1. Introduction

Ferrocene is an organometallic compound of the general class metallocene, with the formula Fe(η5-C5H5)2, where iron is sandwiched between two cyclopentadienyl rings [1,2,3]. Ferrocene finds applications in the design and fabrication of sensors, biosensors, electrochemically active supramolecular switches, catalysis, drugs and fuel additives etc. It has been reported that ferrocenes could fit in the cavity of water-soluble β-cyclodextrin (βCD) [4,5,6,7,8,9,10]. The diverse applications of ferrocene derivatives are mainly attributed to their electrochemical properties, which govern their chemical and biological action. Therefore, the family of ferrocene has been rapidly developing in the last 60+ years, with synthesis of its derivatives having applications in homogeneous asymmetric catalysis, chemical sensors, biosensing, molecular electronics and electrocatalysis [11,12,13,14,15,16,17]. Ferrocene is also used in biological treatments, because it is chemically stable, neutral and able to cross the cell membrane.
Owing to its favorable and reversible redox peaks, a huge fraction of research is devoted to the electron transfer studies of ferrocene derivatives. Electrochemical sensors based on ferrocene as mediators have been extensively documented [18,19,20,21,22,23,24,25]. They are also considered as ideal redox mediators, due to the stability of each form of the redox couple and their insensitivity to physiological oxygen... It serves as a reference material due to its chemical and electrochemical reversibility in organic electrolytes and its invariant redox potential [26]. Abraham et al., have reported that ferrocene and its derivatives to be potentially beneficial redox reagents for the chemical overcharge protection of rechargeable lithium and lithium ion batteries [27] Other applications of ferrocene derivatives include their role as combustion regulators, radiation absorbers and components of various redox systems.
There is a wealth of research on ferrocene derivatives in medicinal chemistry, where they are documented as anticancerous drugs with antiproliferative activities [6]. Taking advantage of their favorable bioorganometallic chemistry, they are frequently employed in bioelectronics and in making glucose biosensors [7]. Moreover, ferrocene has been reported to improve the activity of various drugs such as ferrocene aspirin, the anticancer drug, ferrocifen, and an anti-malarial drug, ferroquine [28]. Similarly ferrocene-conjugated pepstatin, bioconjugate-3, is used for the detection of HIV-I protease [29].
Use of ferrocene and its derivatives in various fields of science have made them an essential class of compounds for further investigation [30]. The role of ferrocene and its derivatives for the welfare of mankind is obvious and is believed to relate to their favorable electron transfer behavior. The electrochemical studies of new ferrocene derivatives are crucial for the evaluation of their properties and potential biomedical applications. In this regard, we have assessed the electrochemical properties of some novel ferrocene derivatives using cyclic voltammetry (CV), differential pulse voltammetry (DPV) and square wave voltammetry (SWV) in different pH media to propose their redox mechanisms. The electrochemical measurements are performed using a unique environmentally benign and cost-effective droplet electrochemical approach. The chemical structures of the investigated ferrocenes can be seen in Scheme 1.

2. Experimental Section

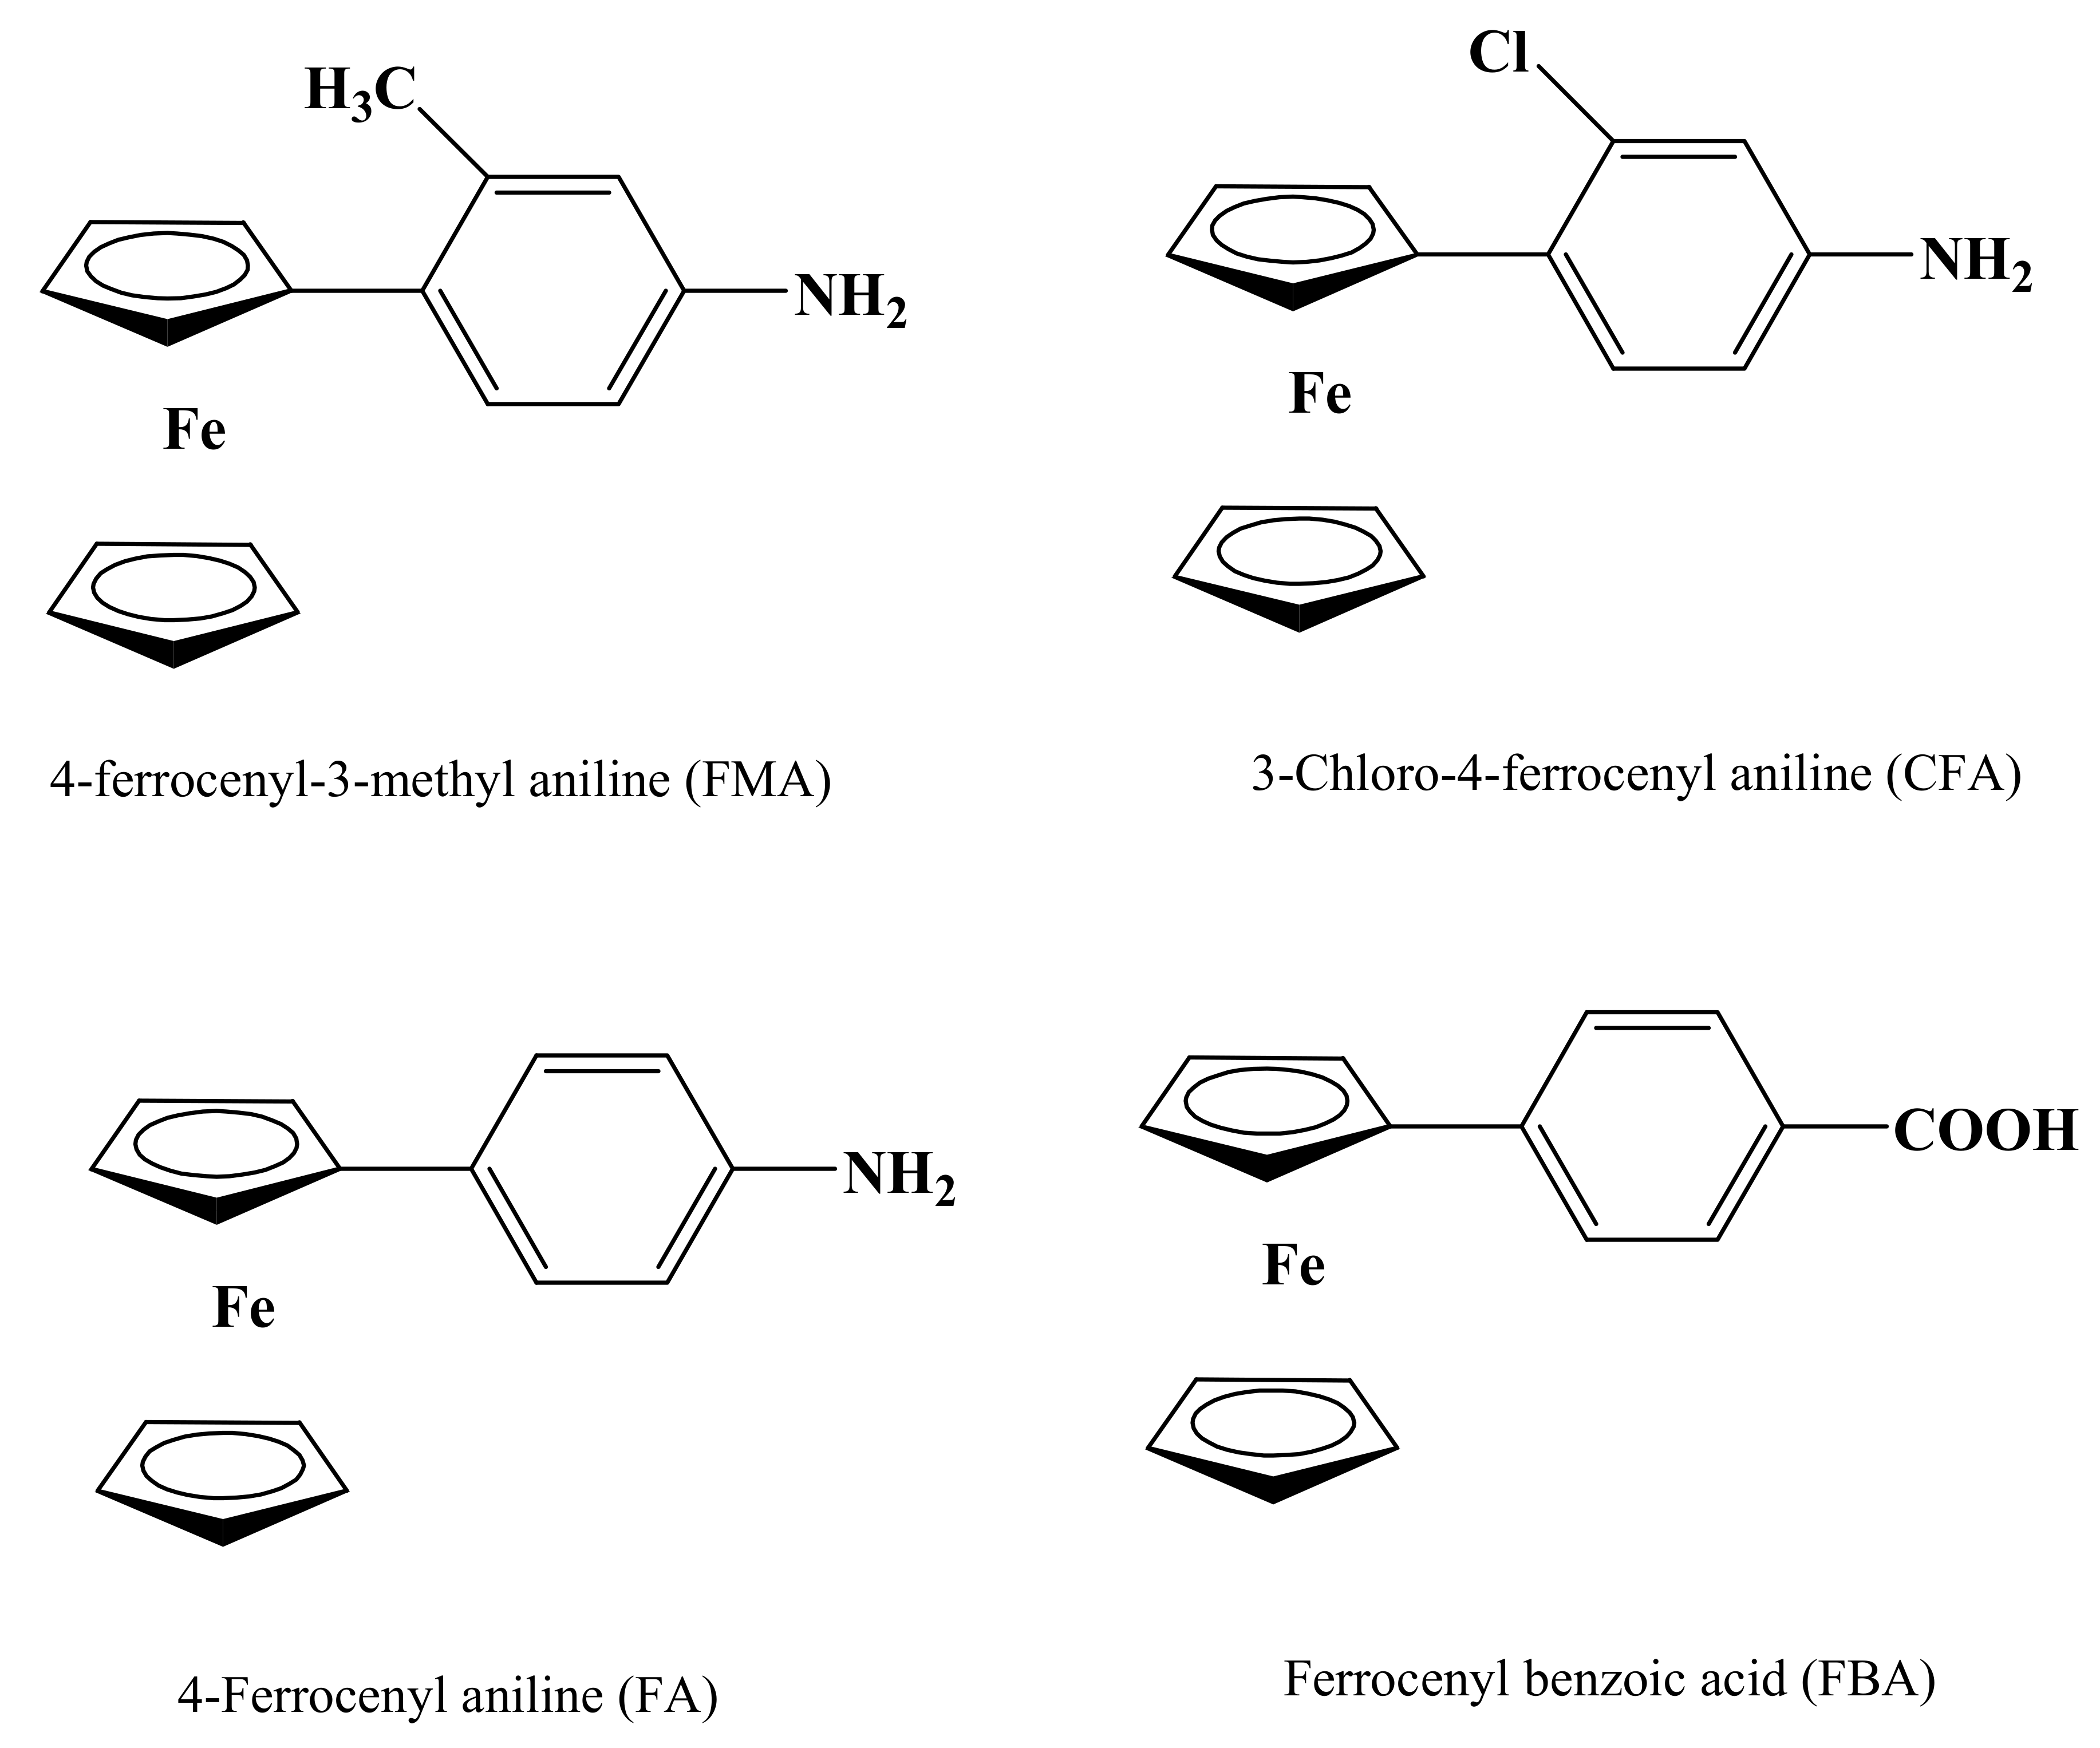
2.1. Materials and Reagents

The derivatives of ferrocene used in the current work were kindly gifted by Professor Dr. Amin Badshah [31,32,33,34]. 2 mM stock solutions of the compounds were prepared in an analytical grade ethanol solvent purchased from Sigma Aldrich. All supporting electrolytes in the pH range of 2–12 were prepared using a Britton–Robinson (BR) buffer solution prepared by using sodium hydroxide and a mixture of 0.04 mM boric acid, 0.04 mM acetic acid and 0.04 mM phosphoric acid. All the components of BR buffer were obtained from Sigma Aldrich. For pH measurements, an INOLAB pH meter with model no. pH 720 was used. Micro volume measurements were done by EP-10 and EP-100 plus motorized µL pipettes.

2.2. Voltammetric Parameters and Electrochemical Cells

Voltammetric experiments were performed using the three-electrode system. The instrument used was a three-electrode Digi-ivy potentiostat received from Austin, TX, USA. The potentiostat was controlled using the DY2100 series software version. The reference electrode Ag/AgCl and the counter electrode, a piece of Pt foil, were attached to each other and hung with the stand. A large area (0.07 cm2) glassy carbon electrode was polished with 0.3-micron micro polish powder before each experiment and placed parallel to the two upper electrodes. A small droplet of different solutions containing a 2 mM concentration with supporting electrolyte was placed on the surface of the carbon electrode. All electrodes were then connected to the instrument to record the voltammograms. The distance between the upper electrodes and working electrode was controlled by the screw of stand and volume of droplet of solution was controlled using micropipette.
The operations of placing the droplet on the surface of the GC electrode and precise positioning of upper electrode’s tip were observed with a magnifying glass, which allowed for magnification of the object. To make the droplet sit well on the GC electrode, the surface of the pipette tip was in contact with the carbon surface at start, and then was slowly pulled away while the droplet grew.
Conditions selected for differential pulse voltammetric experiment were pulse amplitude 50 mV, pulse width 50 ms, pulse period 200 ms and scan rate 100 mV s−1. For SWV, the experimental conditions were as follows. The frequency of 5 Hz and potential increment 0.02 V, corresponding to an effective scan rate of 100 mV s−1, unless stated otherwise.

2.3. Acquisition and Presentation of Voltammetric Data

All the voltammograms recorded were background subtracted and baseline corrected by using the moving average with a step window of 2 mV. This treatment helps in improving visualization and identification of peaks over the baseline without introducing any artefact, although the peak height in some cases is reduced (<10%) relative to that of the untreated curve. The peak current (Ip) values reported were taken from the original untreated voltammograms before the subtraction of the baseline.

3. Results and Discussion

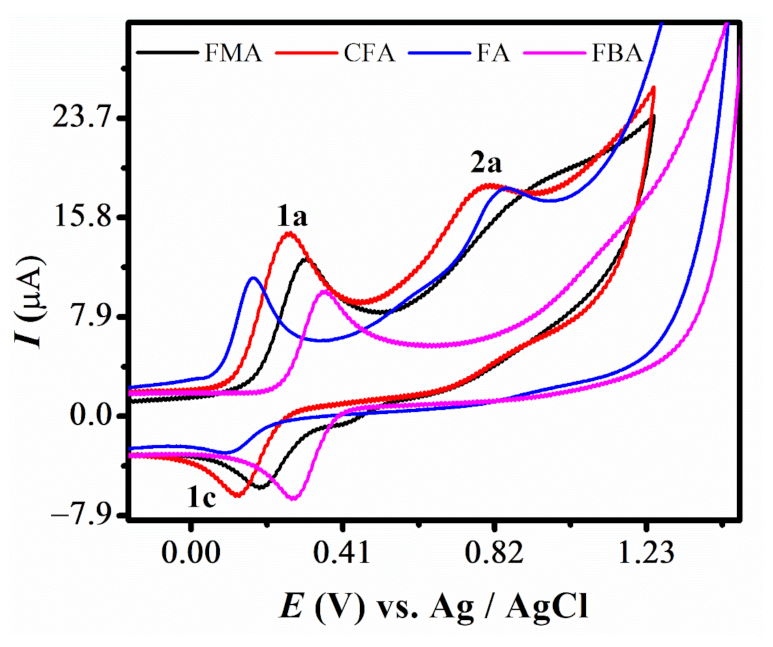
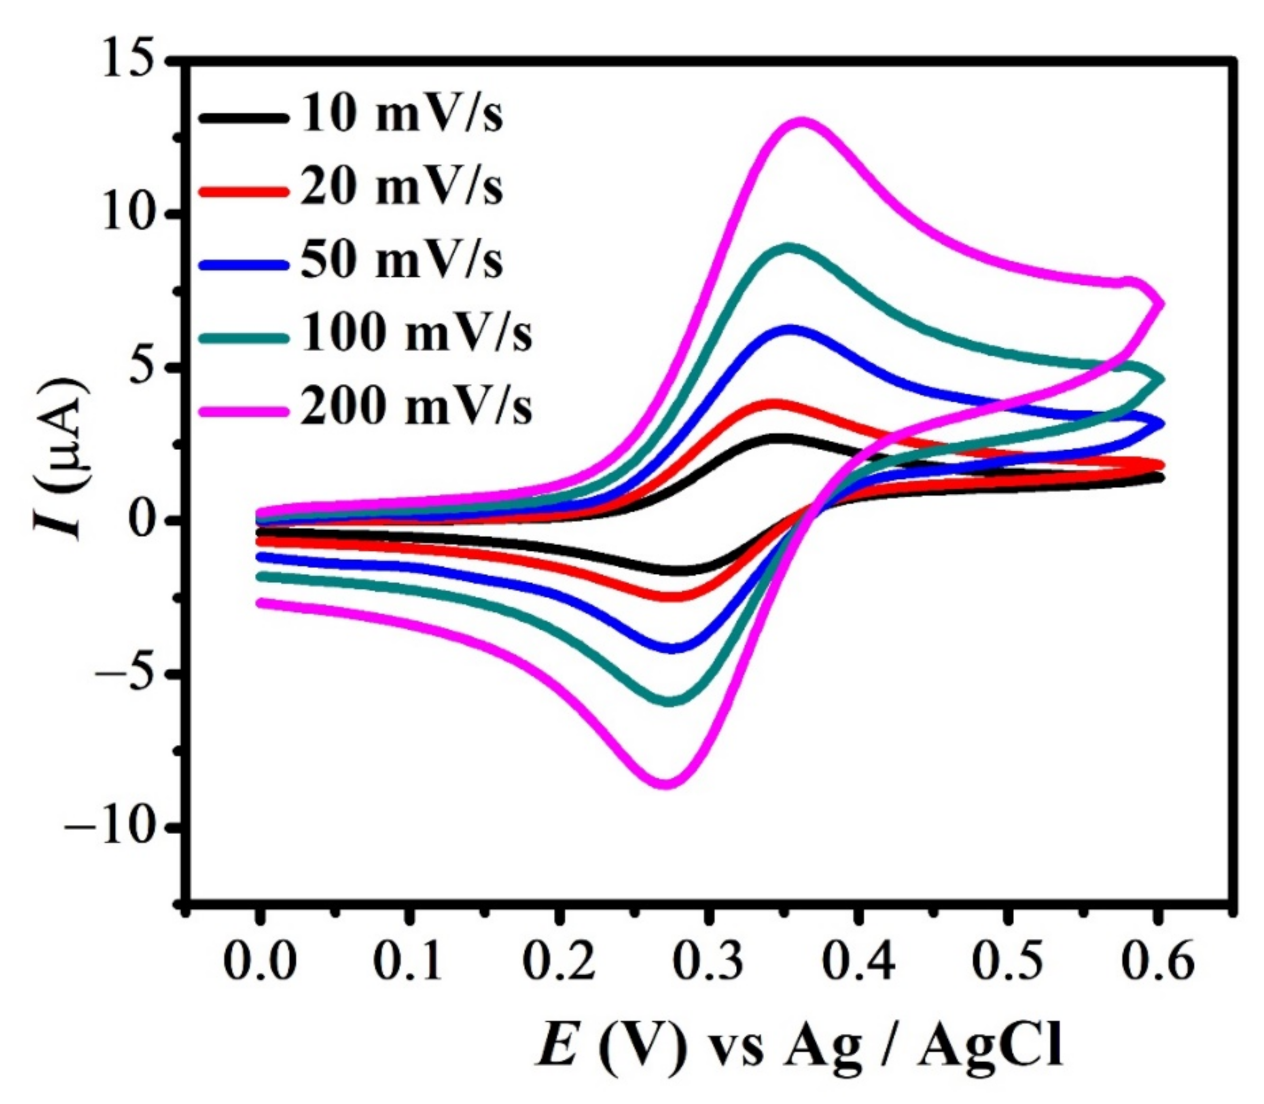
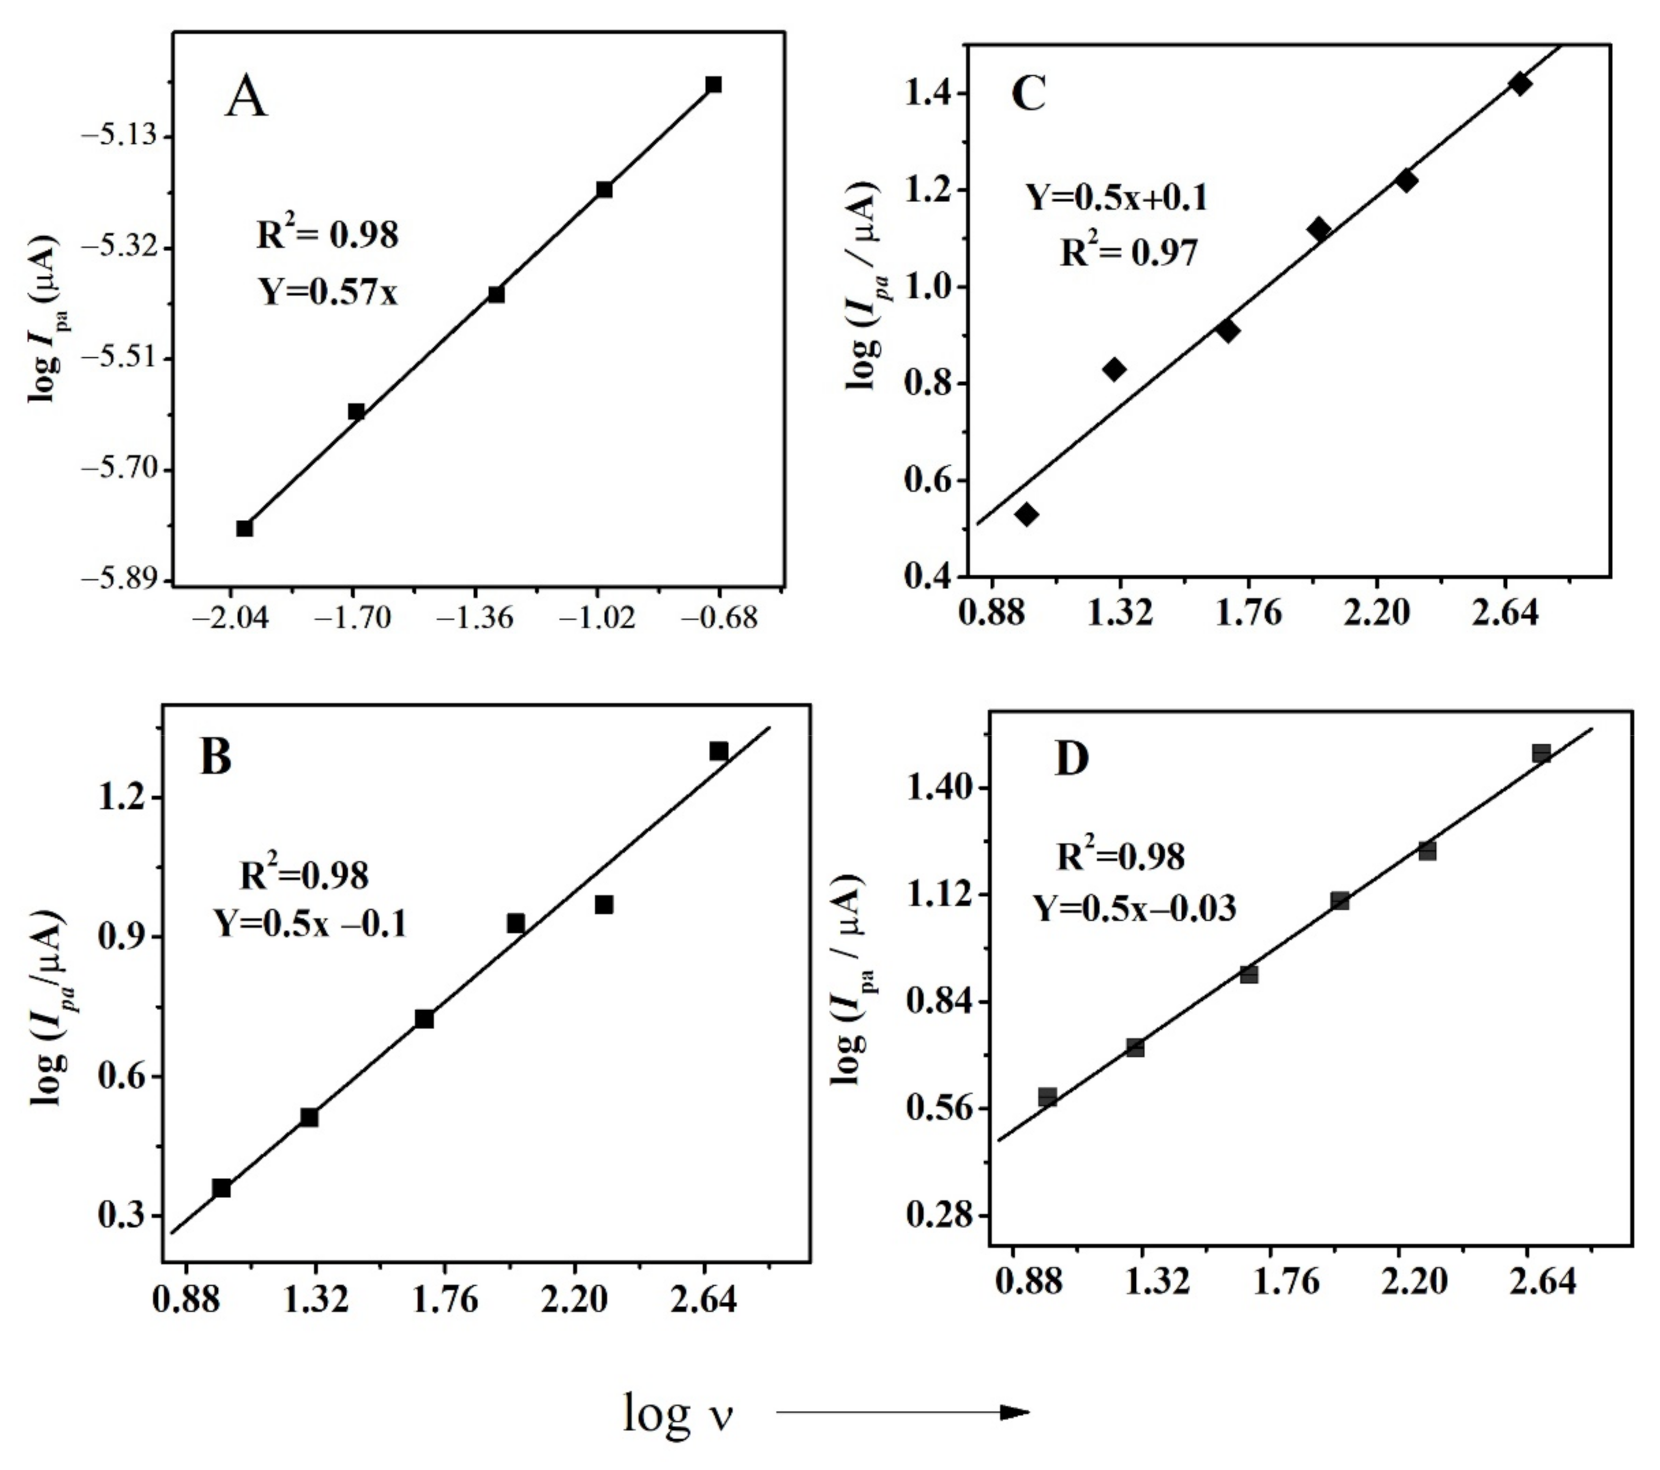
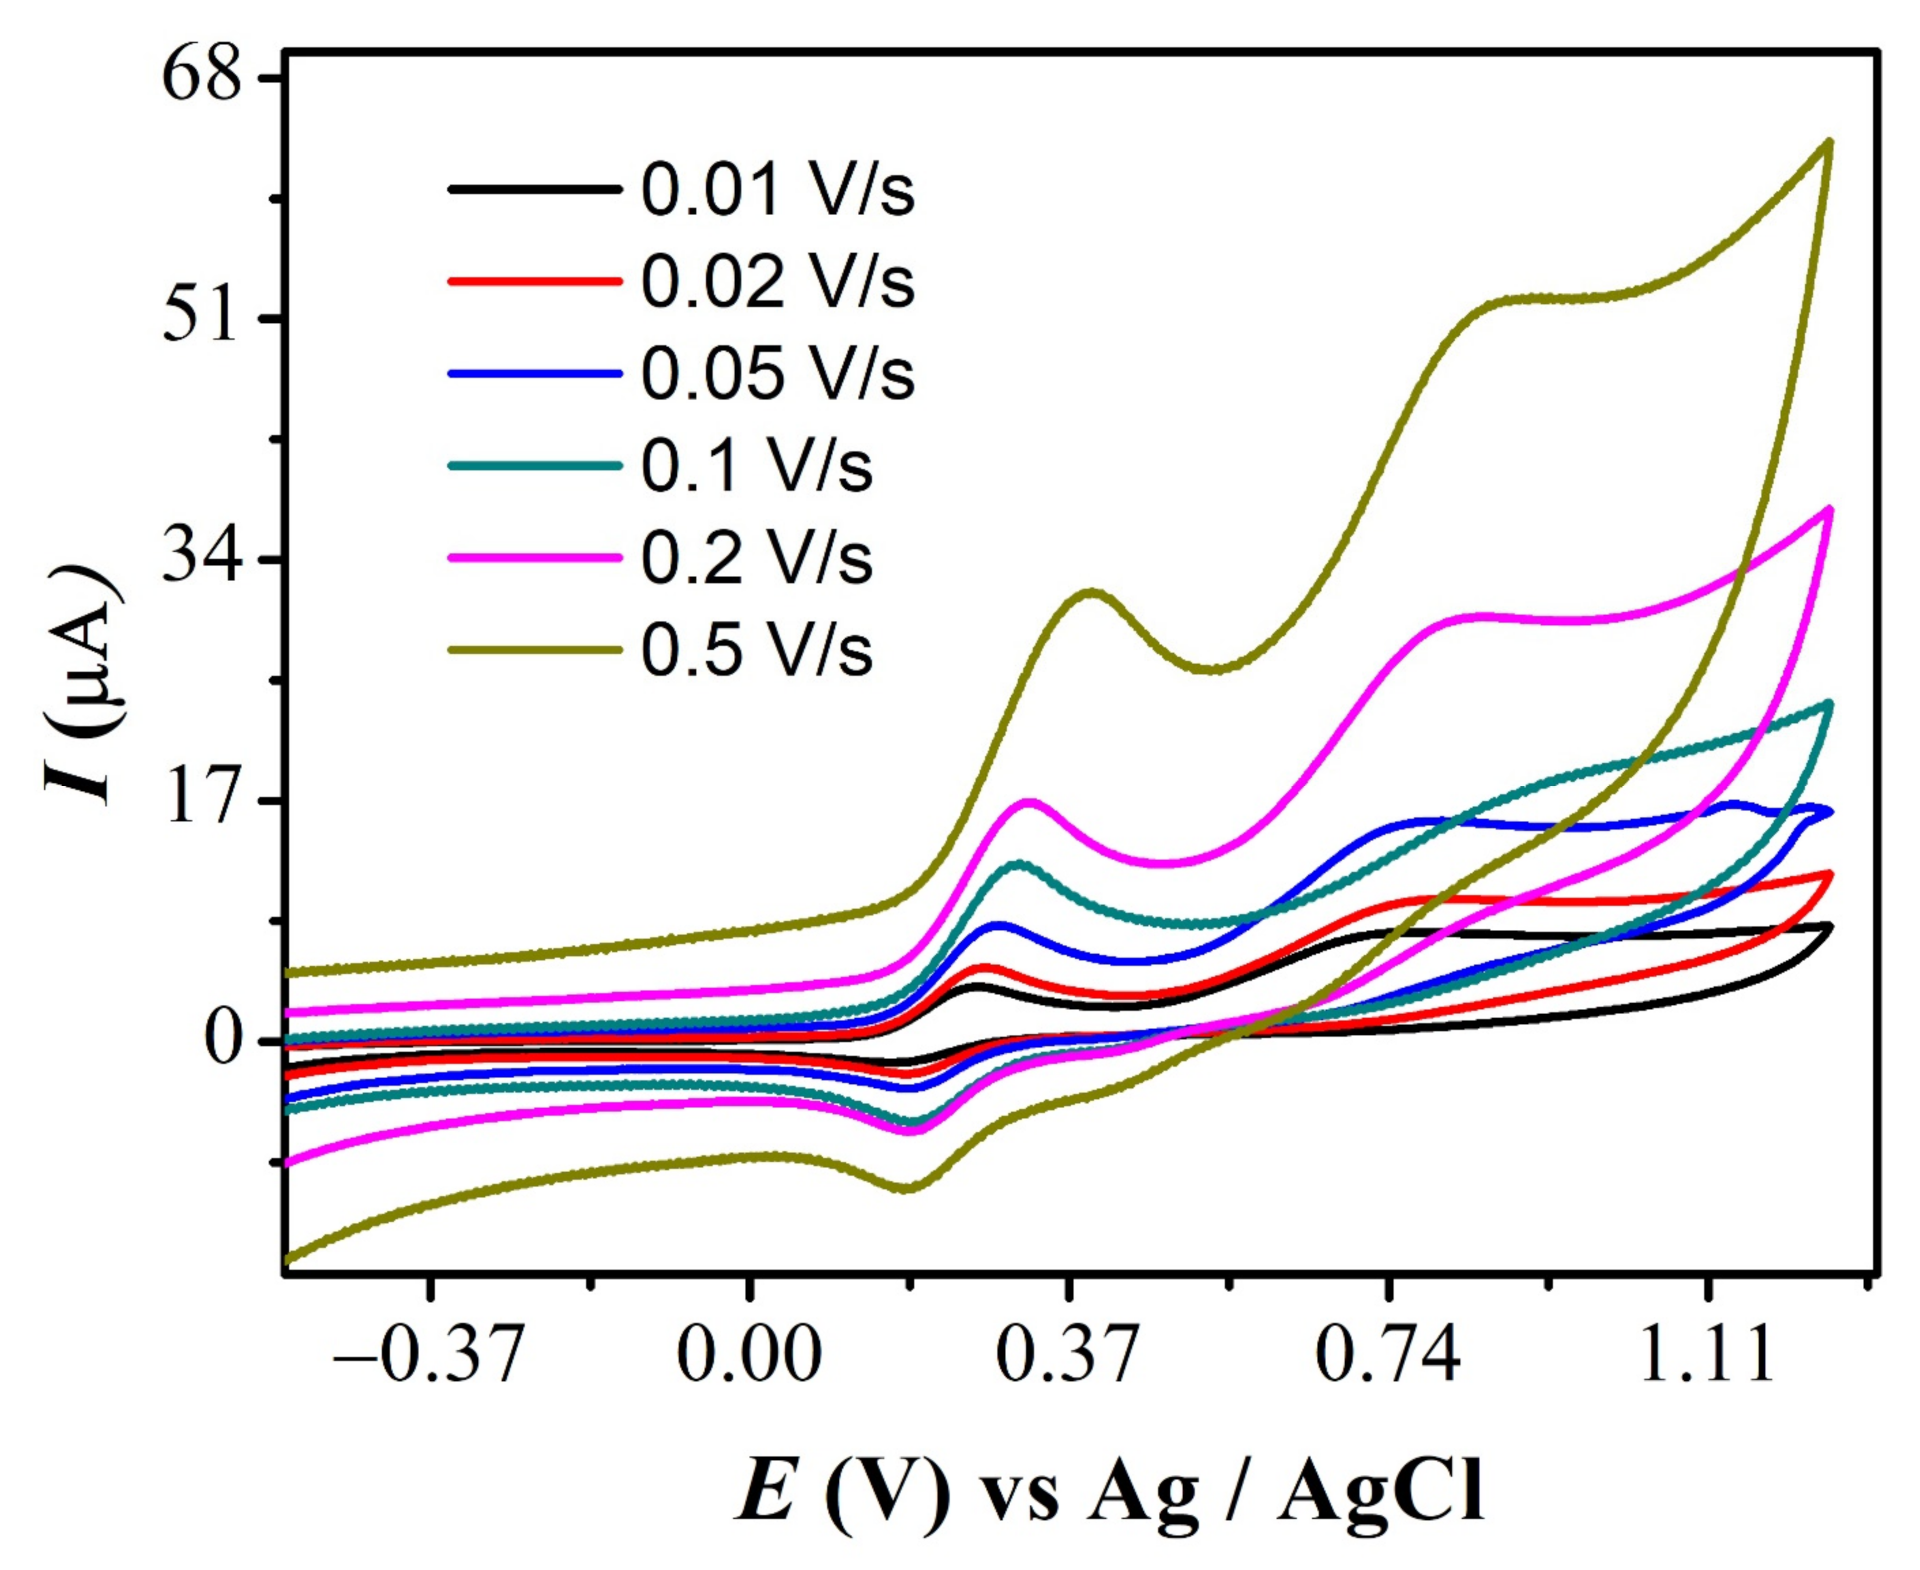
3.1. Cyclic Voltammetry

Cyclic voltammetry (CV) was employed to determine the diffusion coefficient (D) and heterogeneous electron transfer rate constant (ksh) of the compounds. The CVs of the 2 mM solution of all compounds were initially recorded between −0.1 and +1.5 V in 90% aqueous ethanol, buffered at pH 7 with a scan rate of 0.1 V/s. A redox couple labelled as 1a and 1c was observed for all derivatives. A 2nd oxidation peak, labeled as 2a, was also observed for FMA, CFA and FMA. The CVs were also recorded by limiting the potential range between −0.1 and +1.5 to clearly represent the 2a peaks of CFA and FMA, as displayed in Figure 1. The voltammetric response of all the selected ferrocenes featured well-defined and stable oxidation and reduction peaks (1a and 1c), which are assigned to the oxidation of the ferrocene nucleus in analogy with other ferrocene molecules [35,36]. An observation of these overlayed voltammograms reflect that the anodic signal of FA is obtained at least positive potential, displaying its favored oxidation. Most facile oxidation of FA is attributed to the electron donating effect of the attached aniline group. Whereas for CFA, oxidation peak is shifted to more positive potential displaying comparatively difficult oxidation than FA, mainly because of the electron withdrawing inductive effect of the attached chloro group. Similarly, the voltammetric signal of FBA, noticed at most positive potential, suggested the most difficult electron abstraction from its ferrocene moiety, due to the strong electron withdrawing effect of the benzoic acid group. This variation in the oxidation behavior of closely related ferrocene derivations demonstrated the sensitivity of ferrocene to the electronic effect of the attached substituents [37,38]. The CV of the pristine ferrocene molecule is reported to be 0.29 V, very close to FMA, with a peak separation of 0.074 V in aqueous solvent at glassy carbon electrode. However, the peak separation in case of FMA is larger, i.e., 0.12 V, compared to the pristine ferrocene molecule. The well-defined redox peaks 1a and 1c correspond to the oxidation of Fe as reported in the previous studies [16,39,40]
Ep values much higher than the expected Nernstian value of 59 mV per electron and Ipa/Ipc current ratio deviating from 1, predicted that the redox process is electrochemically quasi-reversible for all the derivatives of ferrocene [36]. A literature review reveals that ferrocene alone shows a well-defined, reversible redox signal [41]. This disparity is attributed to solution resistance and slow electron transfer [38]. Moreover, slightly displaced potential values observed for Fc/Fc+ couple for these compounds in comparison to unsubstituted ferrocene reveals that the redox behavior of ferrocene is dependent on the electronic properties of the attached ligands [35]. A second anodic signal, 2a, was also noted for these derivatives, except FBA, representing the oxidation of the para-amine moiety present in these derivatives. Absence of its corresponding reduction signal in the reverse scan shows the stability of this moiety to reduction and indicates the irreversible nature of this 2nd oxidation step. Epa-Epa/2 > 60 mV also supports the irreversibility of this electrode process. Summary of electrochemical data of these four ferrocene derivatives is listed in Table 1.
Cyclic voltammograms of FBA (1a & 1c peak) obtained at different scan rates are shown in Figure 2. The CVs depict that peak current varies linearly with the increasing scan rate. The reversible signal for Fc/Fc+ couple principally occurs at the same potential. [41] However, the slight variation in anodic and its corresponding reduction signal observed here is due to the presence of finite solution resistance and slightly slow electron transfer kinetics [37]. This ensures the quasi-reversible nature of redox peaks, presumably due to the bulky substituent attached to it. A similar trend with increasing scan rate was observed for redox signal 1a and 1c in all studied ferrocene derivatives (Figure S1A–C).
This study of the effect of scan rate was employed in determining an important parameter, i.e., diffusion coefficient (D). This is done by plotting log Ipa vs. log ν, as demonstrated in all compounds, by the procedure mentioned elsewhere. Figure 3 shows the plot of log Ipa vs. log ν for all compounds. The diffusion coefficient was calculated using the slope of straight lines by applying Randles–Sevcik equation [42]. For FBA, the slope value of 0.56 confirmed the diffusion limited nature of the first redox signal [43].
The effect of the scan rate for FMA is displayed in Figure 4, where the much greater positive potential shift observed for the 2a anodic signal with increasing scan rate supports the irreversible nature of this oxidation step. The values of D for all derivatives (peak 1a) are displayed in Table 1 and were found to be in the range of 10−7 cm2 s−1.
The Nicholson method [44] has been used to calculate the rate constant ksh at the electrode. Peak separation (ΔEp) between the anodic and cathodic peak from the background subtracted voltammogram is used to evaluate ψ using the classic relation given by Nicholson between ΔEp value of 0.07 V and the relation is presented in Figure 3 of Nicholson’s paper [44]. The value of Ψ = 1.51 was then employed to determine the value of ksh using Equation (1).
Ψ = k sh ( α D   ) 1 / 2
where α is for charge transfer coefficient, which has been calculated using the relation α = nFν/RT (ν being the scan rate, 1.46 V/s for this experiment) and was found to be α = 5.69 (Table 2). D is the diffusion coefficient, and its value was obtained from the study of the scan rate effect of FBA and was found to be 5.645 × 10⁻⁷cm2 s−1 (see Table 1). By putting the values of α, D and Ψ in Equation (1), the heterogeneous rate constant ksh was calculated giving the value of 6.74 × 10⁻⁴ cm s−1 for FBA. The values of ksh calculated for all other derivatives are listed in Table 2.

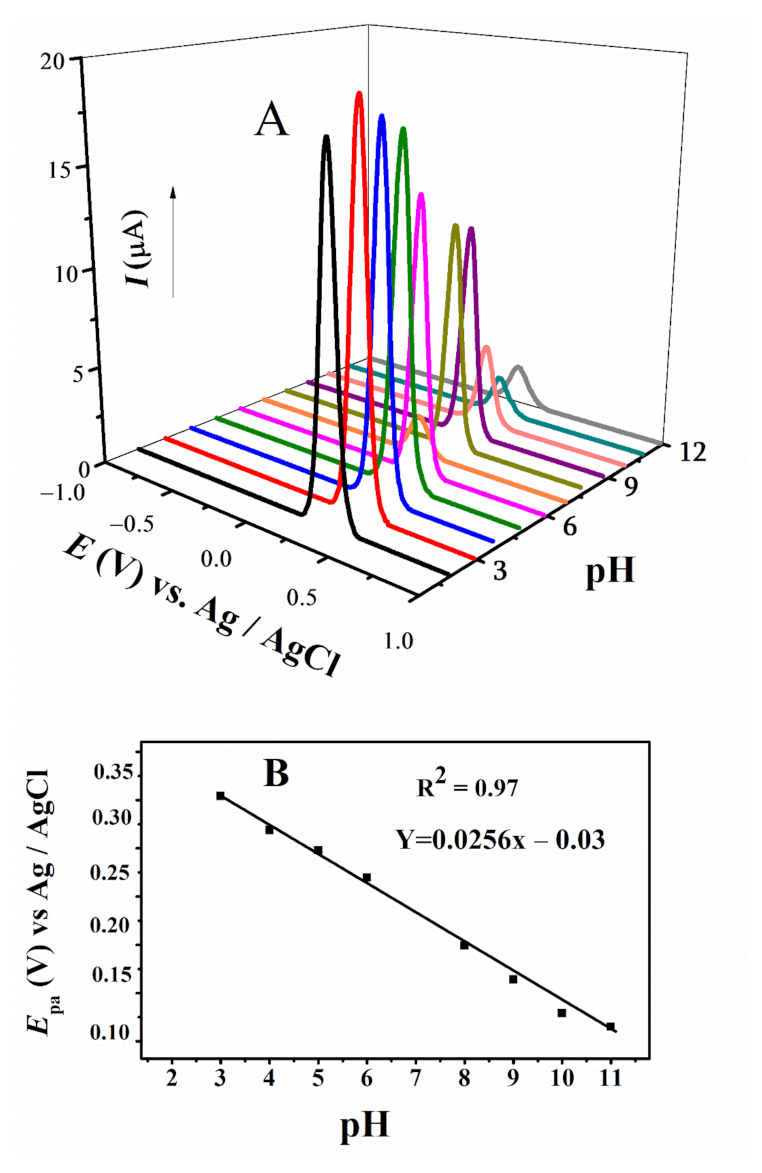
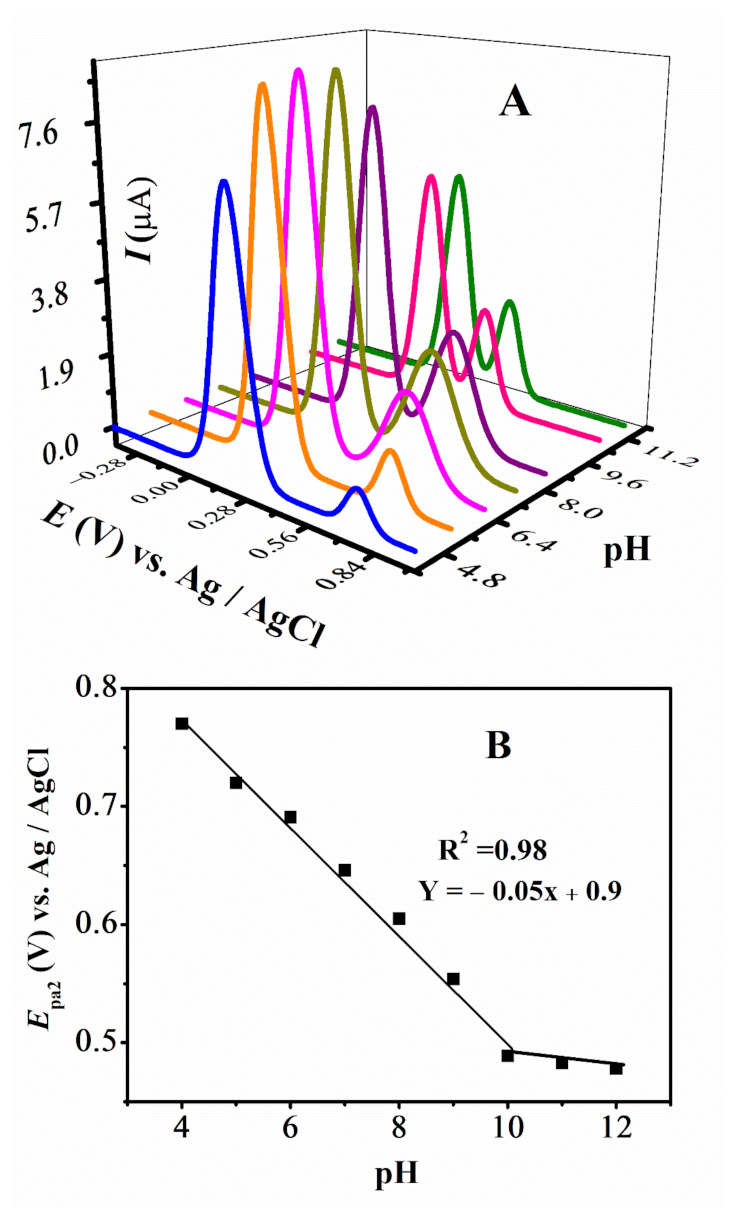
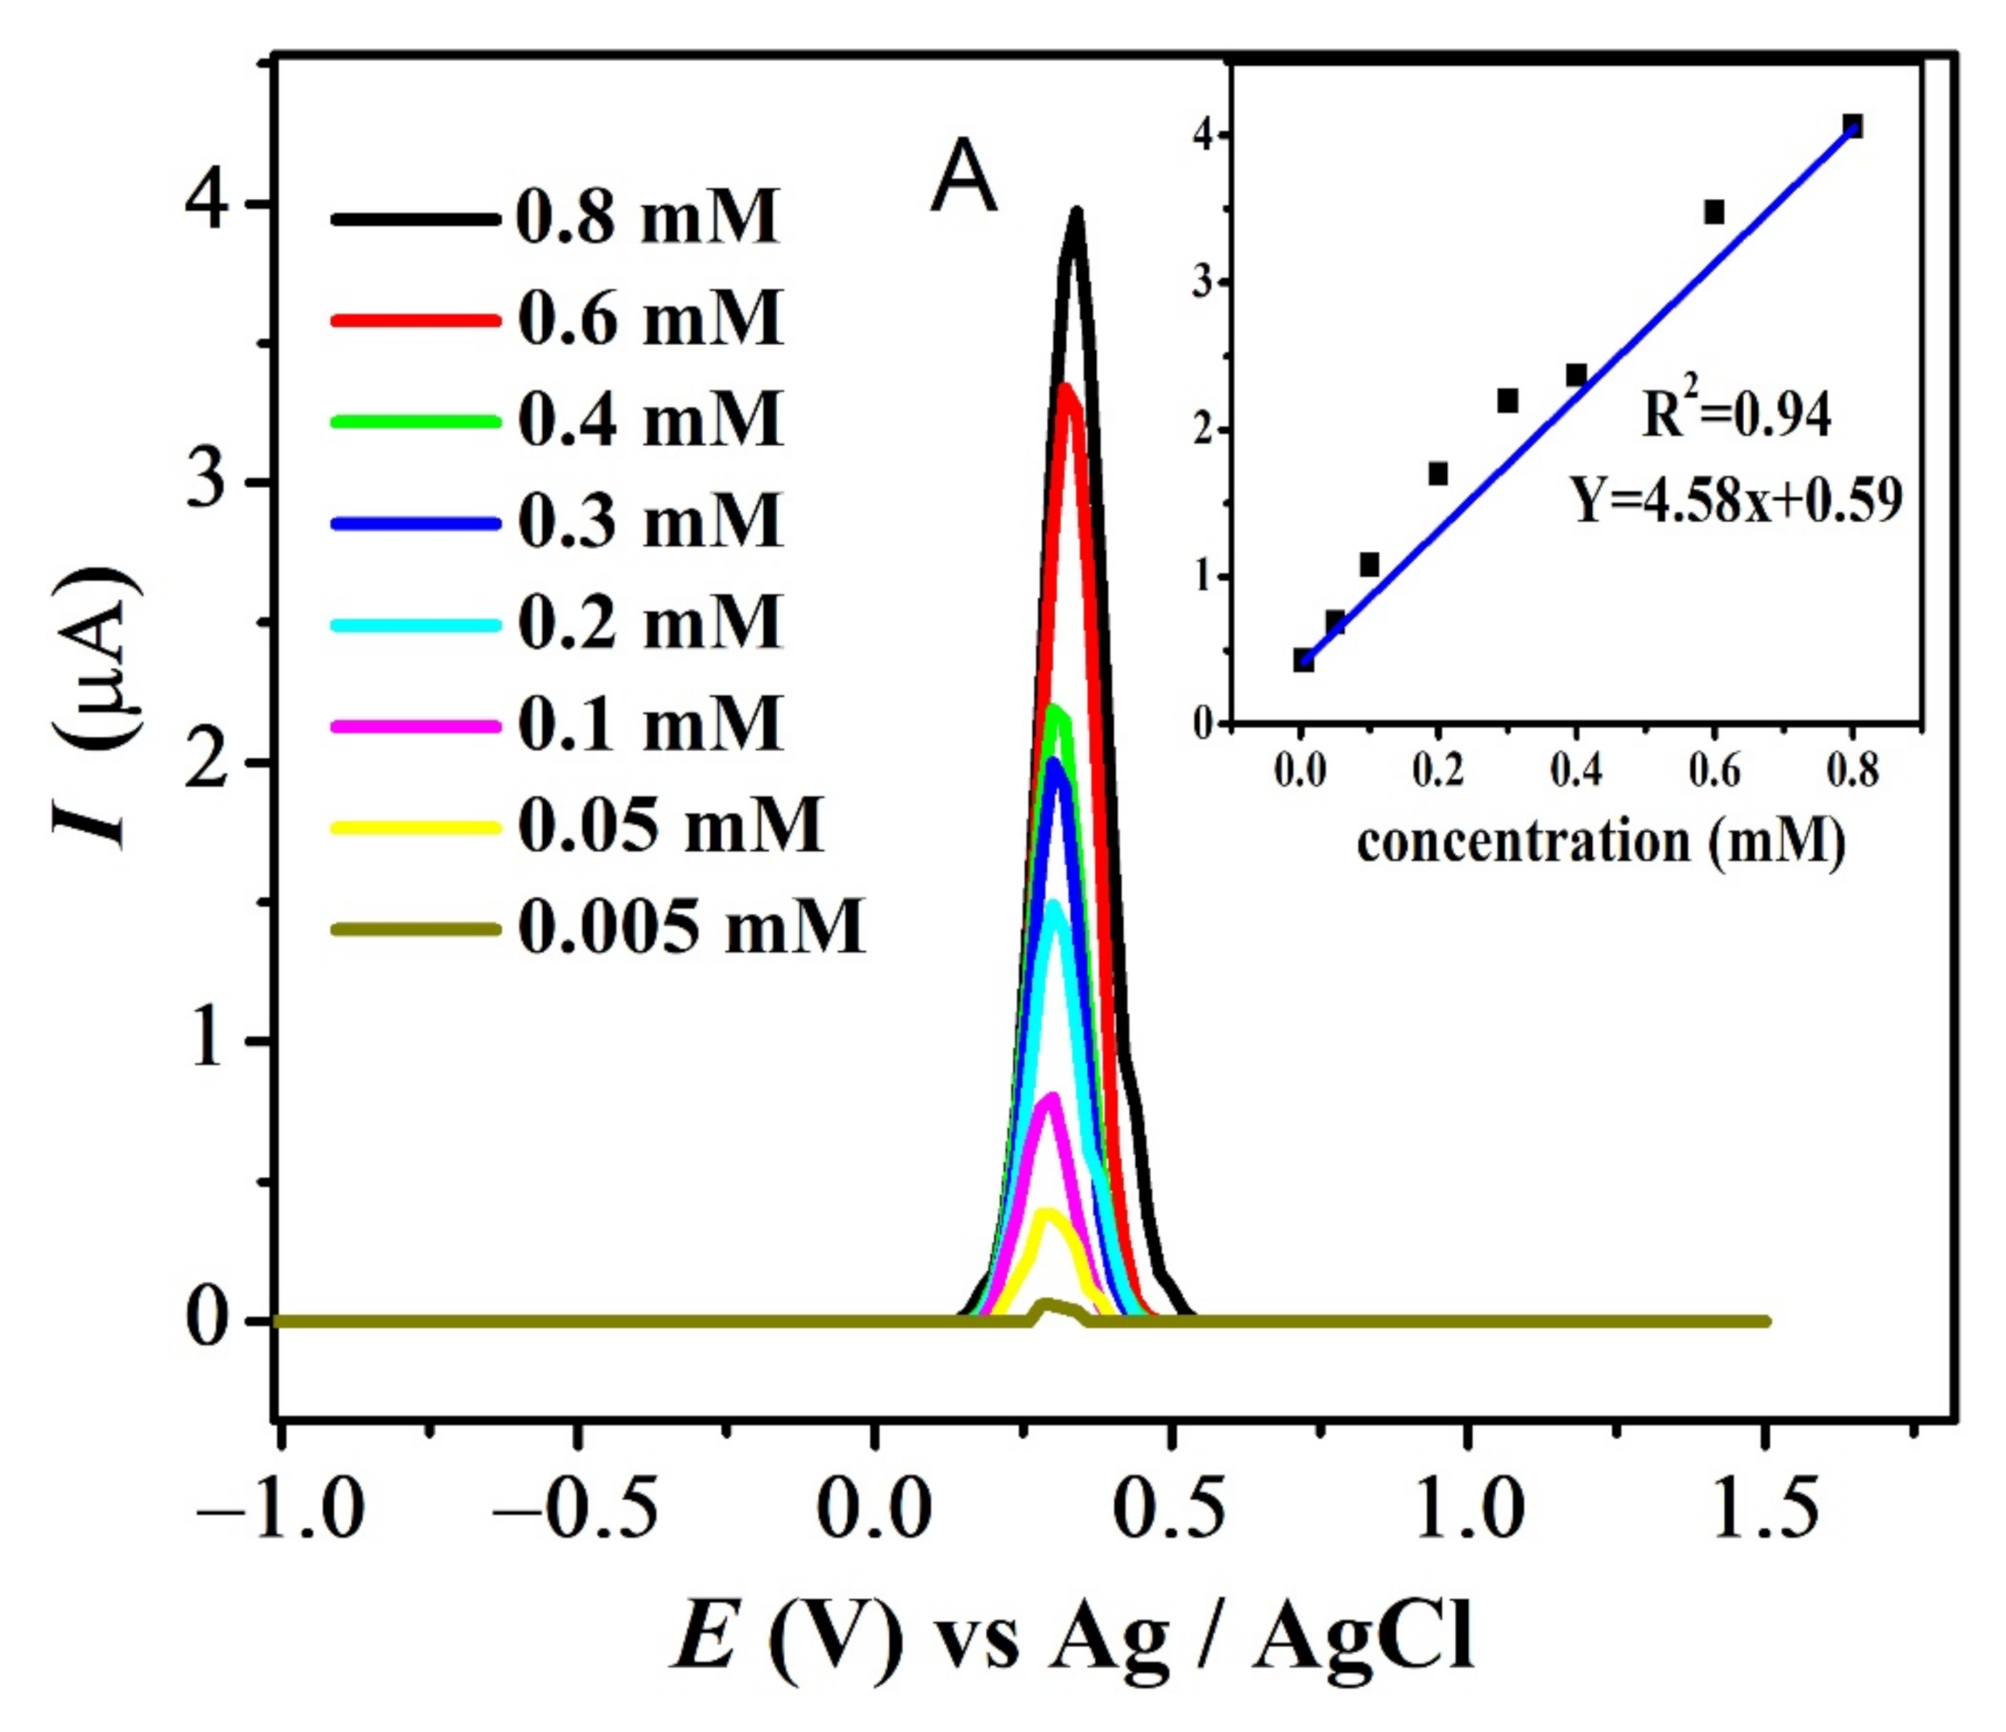
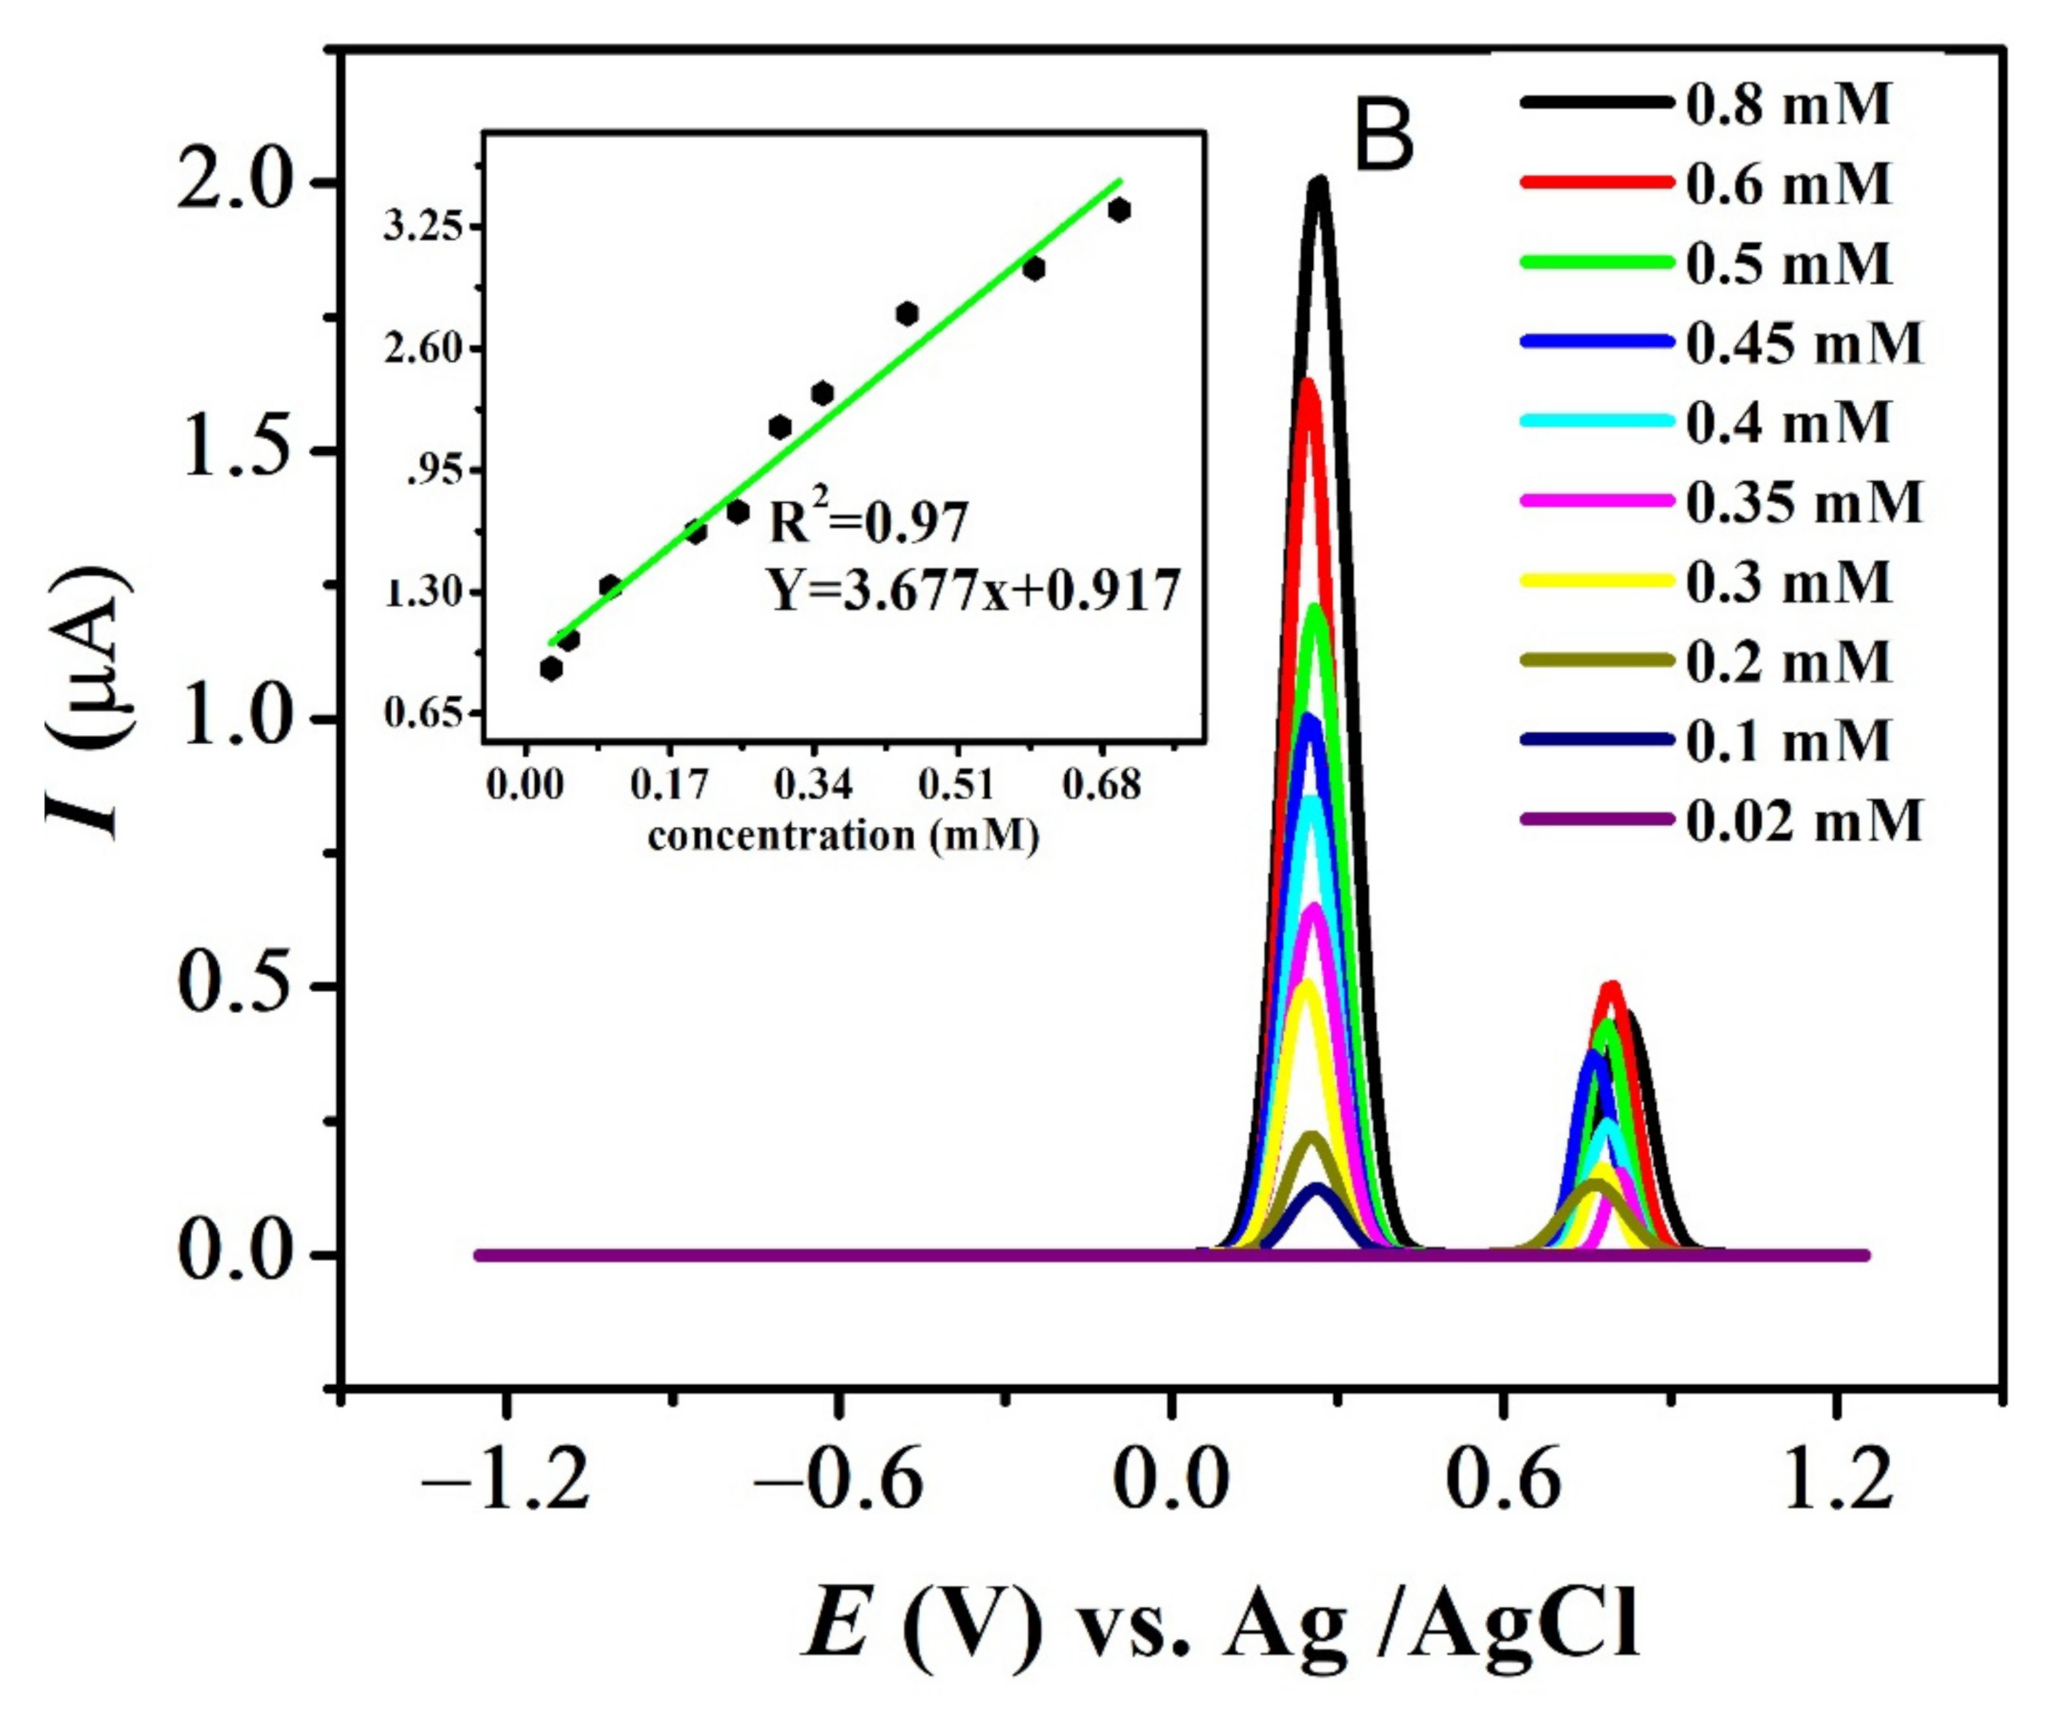
3.2. Differential Pulse Voltammetry

Differential pulse voltammetry (DPV) was employed to study the effect of pH and determine the number of electrons and protons involved in the redox processes. DPV is a very sensitive technique to reduce background charging currents. The waveform in DPV is a succession of pulses, where a baseline potential is a particular period of time earlier than the application of a potential pulse. The medium effect was successfully studied in the pH range from 3–12 using DPV. The shifting of anodic peaks towards less positive potential with increasing pH projects the convenience of the oxidation process in basic media [43,45]. For FBA, only one anodic signal was observed in accordance with CV, which displayed slight shifting towards positive potential with increasing pH (Figure 5A). The width at half peak height, W1/2, value close to 90 mV and literature review of structurally similar ferrocenyl derivatives confirmed one electron involvement in its oxidation [46,47,48]. Participation of protons in the oxidation step were calculated by plotting Ep vs. pH plot (Figure 5B), using relation E = EO–m/n × 0.059 pH where m is the number of protons and n is number of electrons involved in the redox process [46,47,48]. The slope value deviating from 25.6 mV per pH unit suggested the m = 0.4, indicating almost no proton involvement in this oxidation step [46,47,48].
Variation in current has also been observed with the changing pH, owing to medium effect. The variation in voltammetric response reflects that the change in pH can alter the biochemical pathways, as they depend on the redox potential of compounds.
The DPV plots of FMA vs pH are displayed in Figure 6A,B. Anodic peak 1a does not show any significant shift with pH, however, 2a has a large shift towards negative potential with increasing pH and displayed ease of oxidation of -NH2 group of FMA in a basic environment. The variation of Epa2 with pH for FMA, with a slope of 58 mV per pH unit close to 59 mV per pH unit, suggests that the oxidation of the -NH2 group for this and other amino ferrocenyl derivatives involve the same number of protons as electrons. Rising pH is also accompanied by the changing current values for 2a. This variation in redox potentials and currents confirmed the medium sensitivity, complementing CV results.
The W1/2 FMA, CFA and FA are approximately equal to 90 mV (Figure S2A,B) and a literature review of structurally related derivatives suggests one electron involvement in oxidation of these ferrocenyl compounds [35]. The pka is determined to be at pH 10, as evidenced from the plot of Epa2 vs. pH. No significant peak shifting is observed for FA and CFA, with changing pH values indicating the involvement of only electrons in the oxidation process.

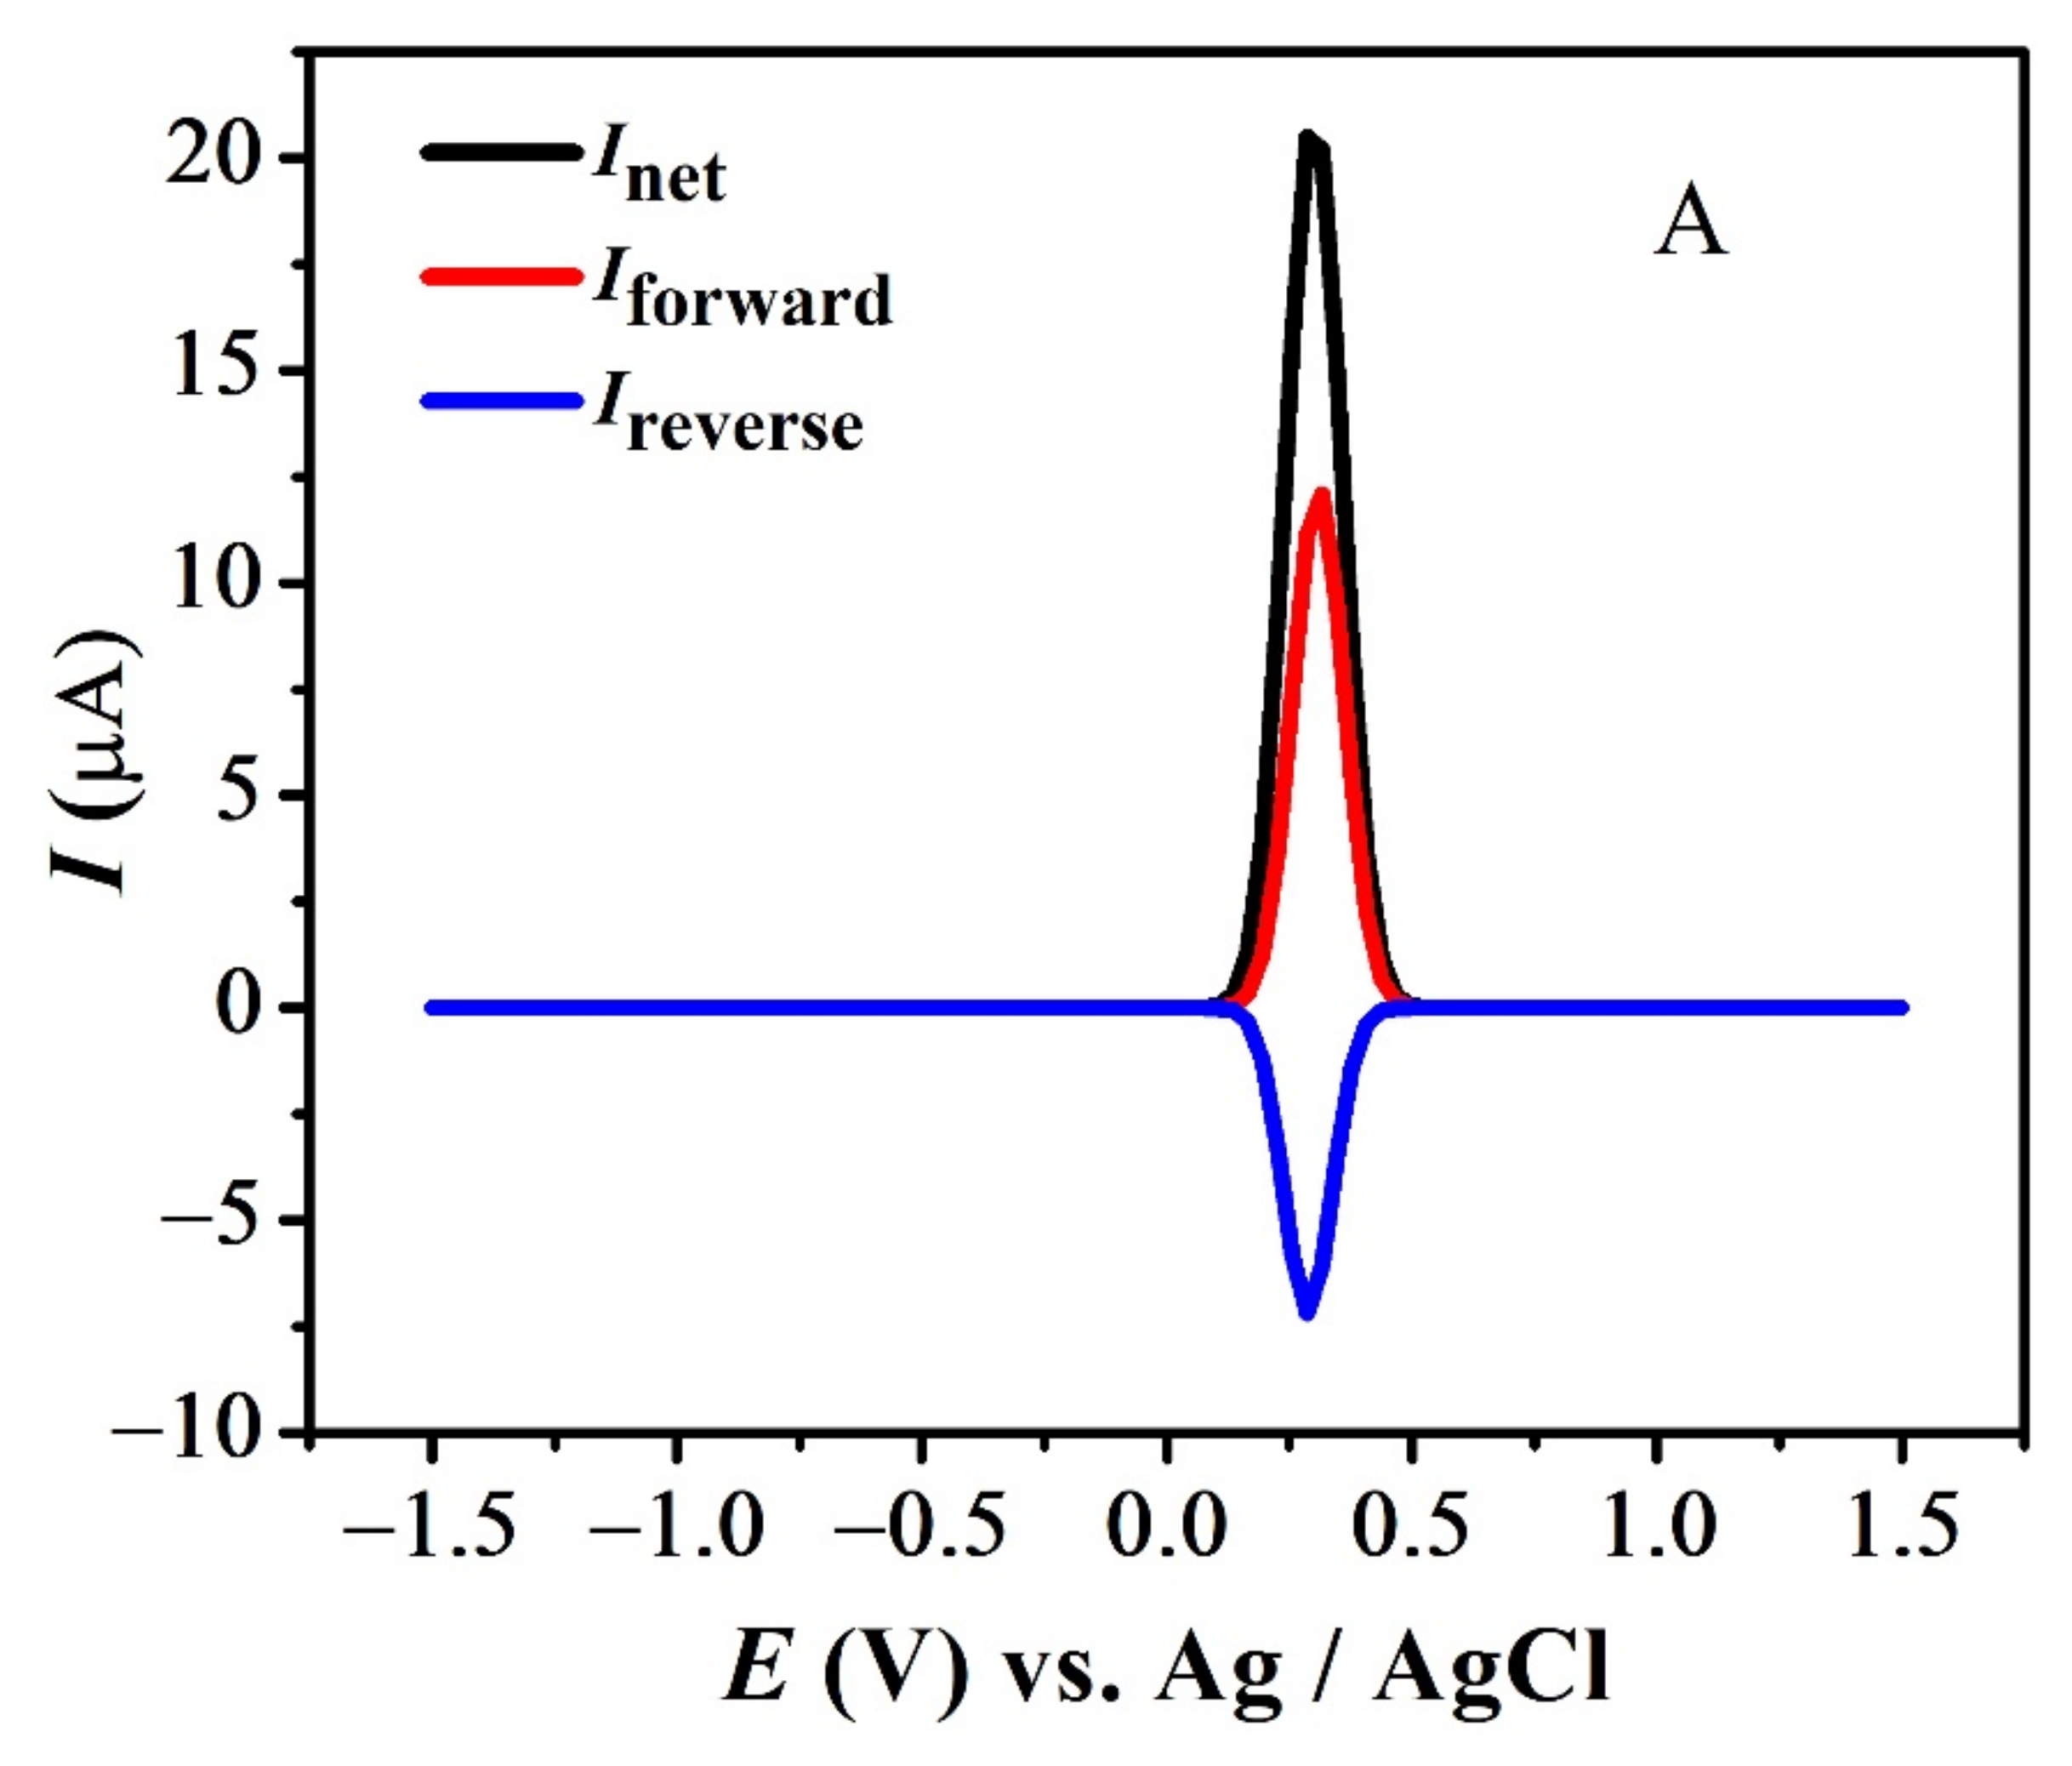
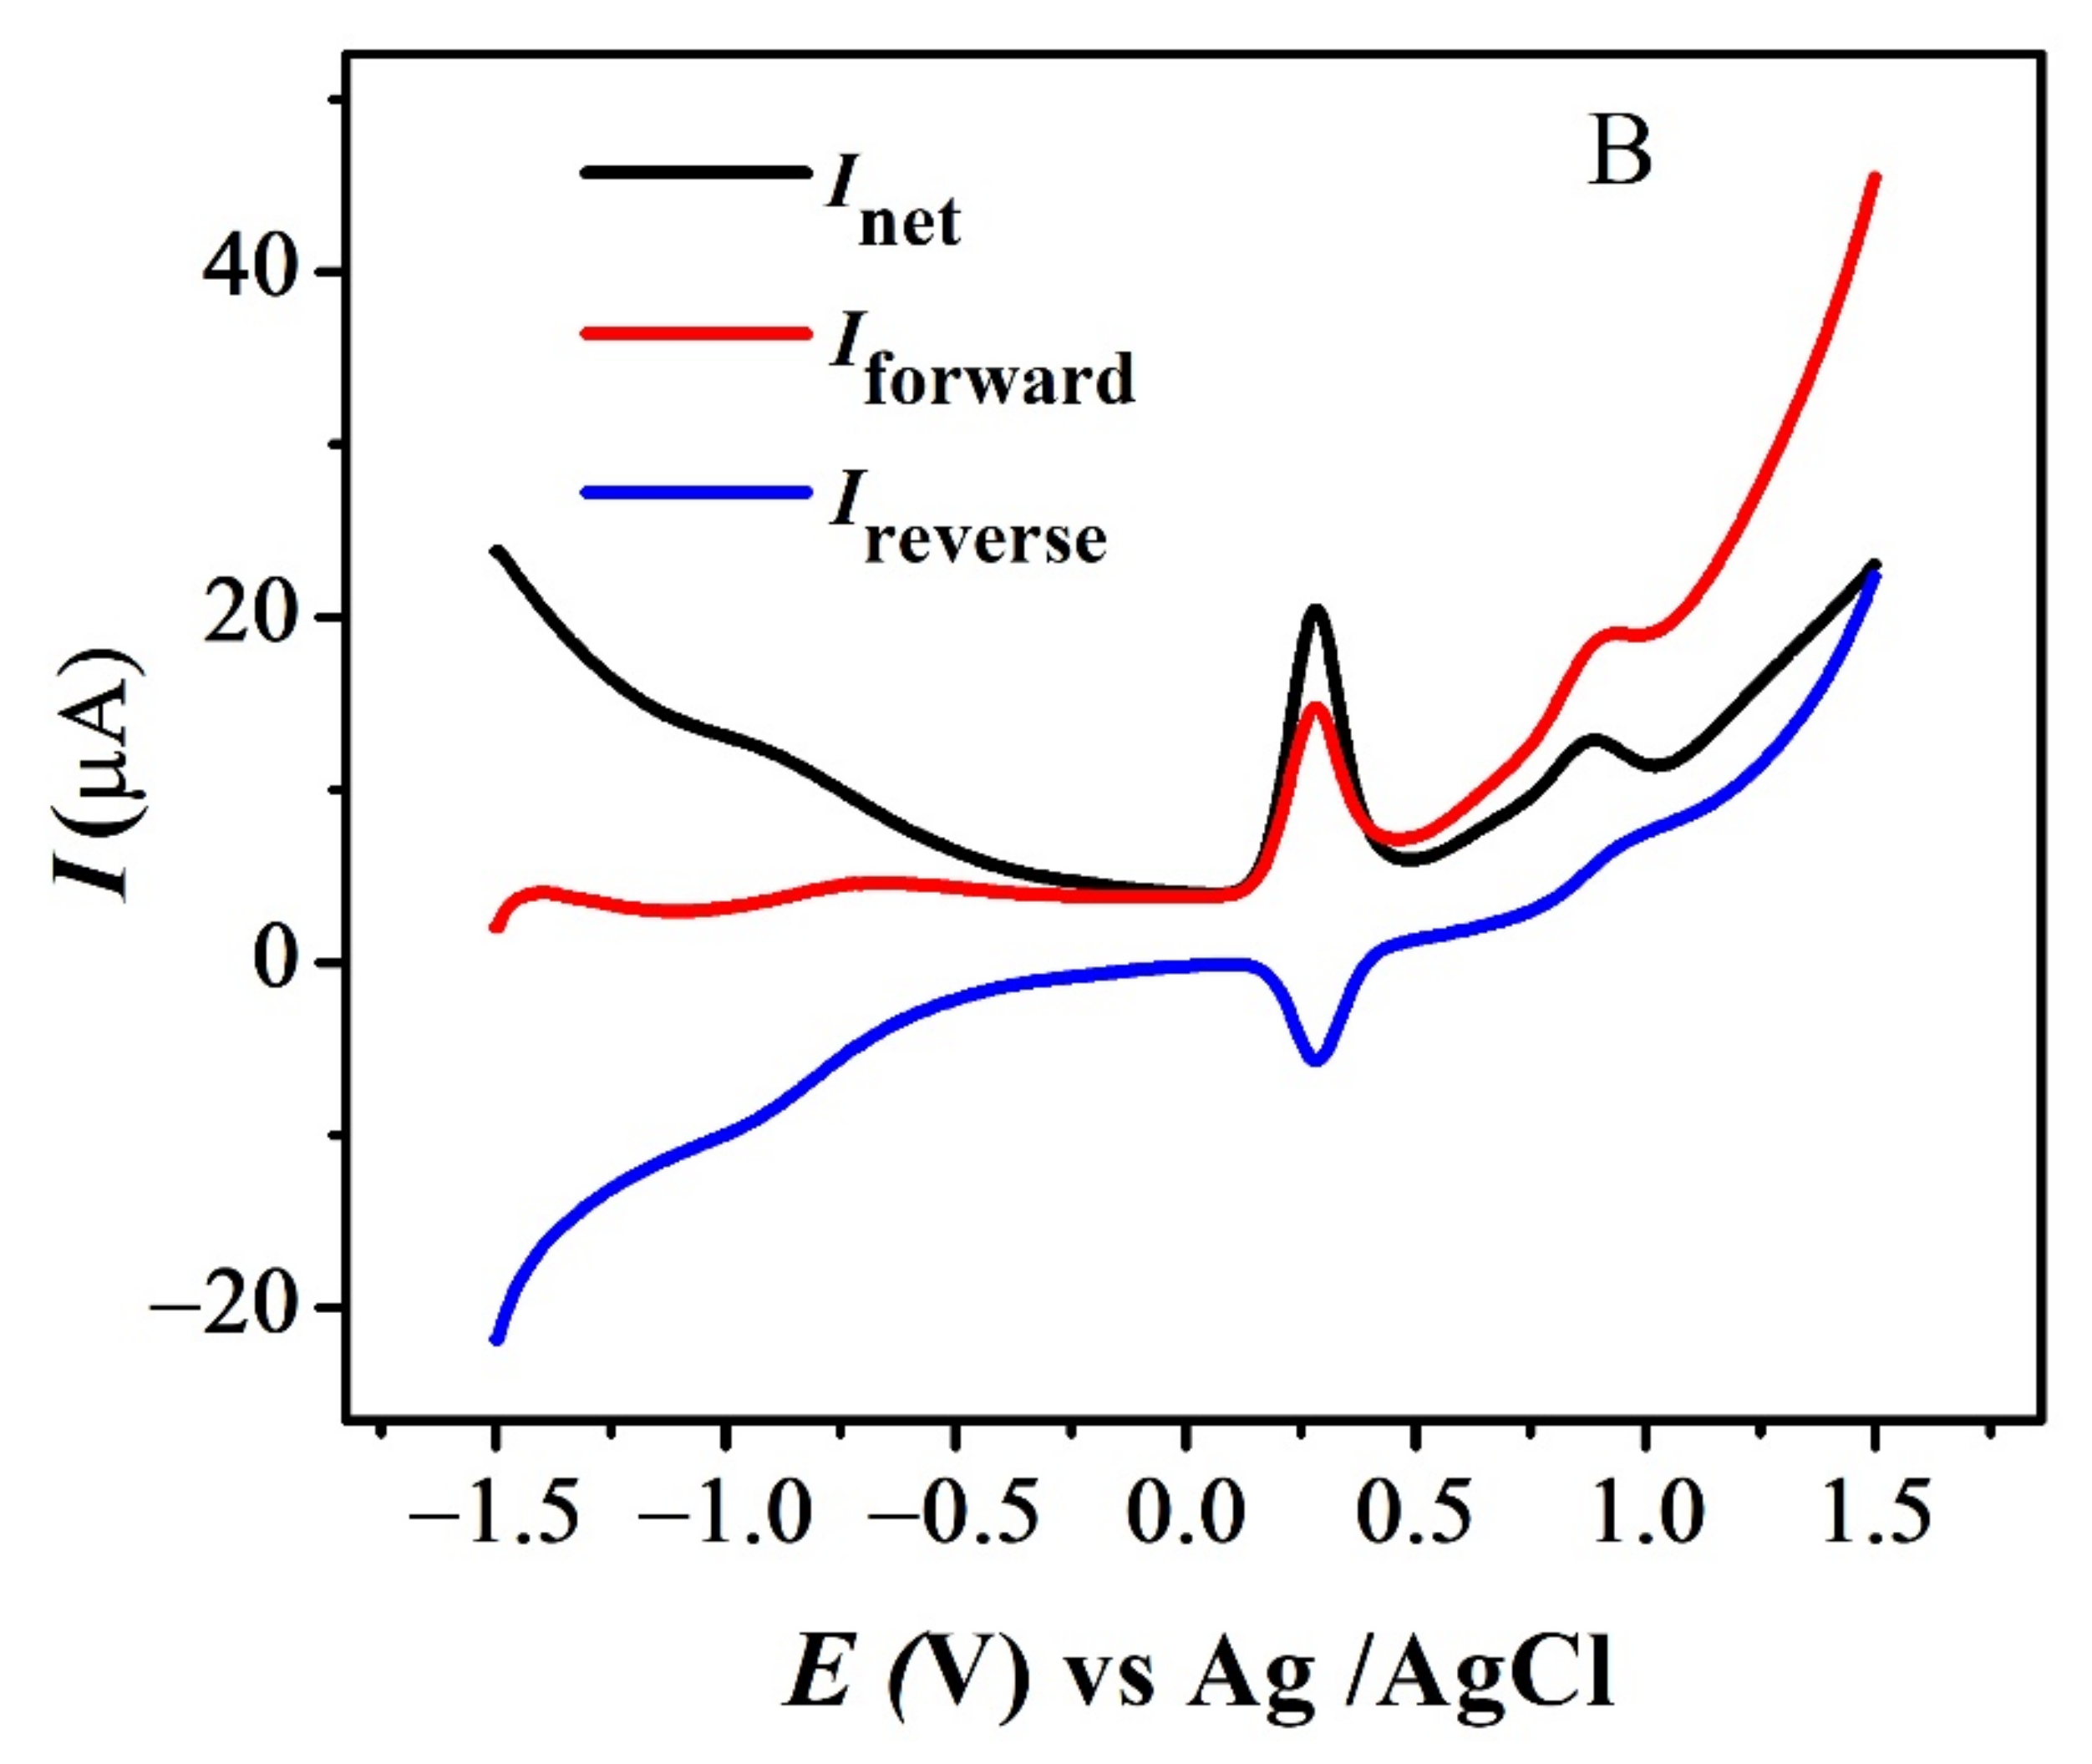
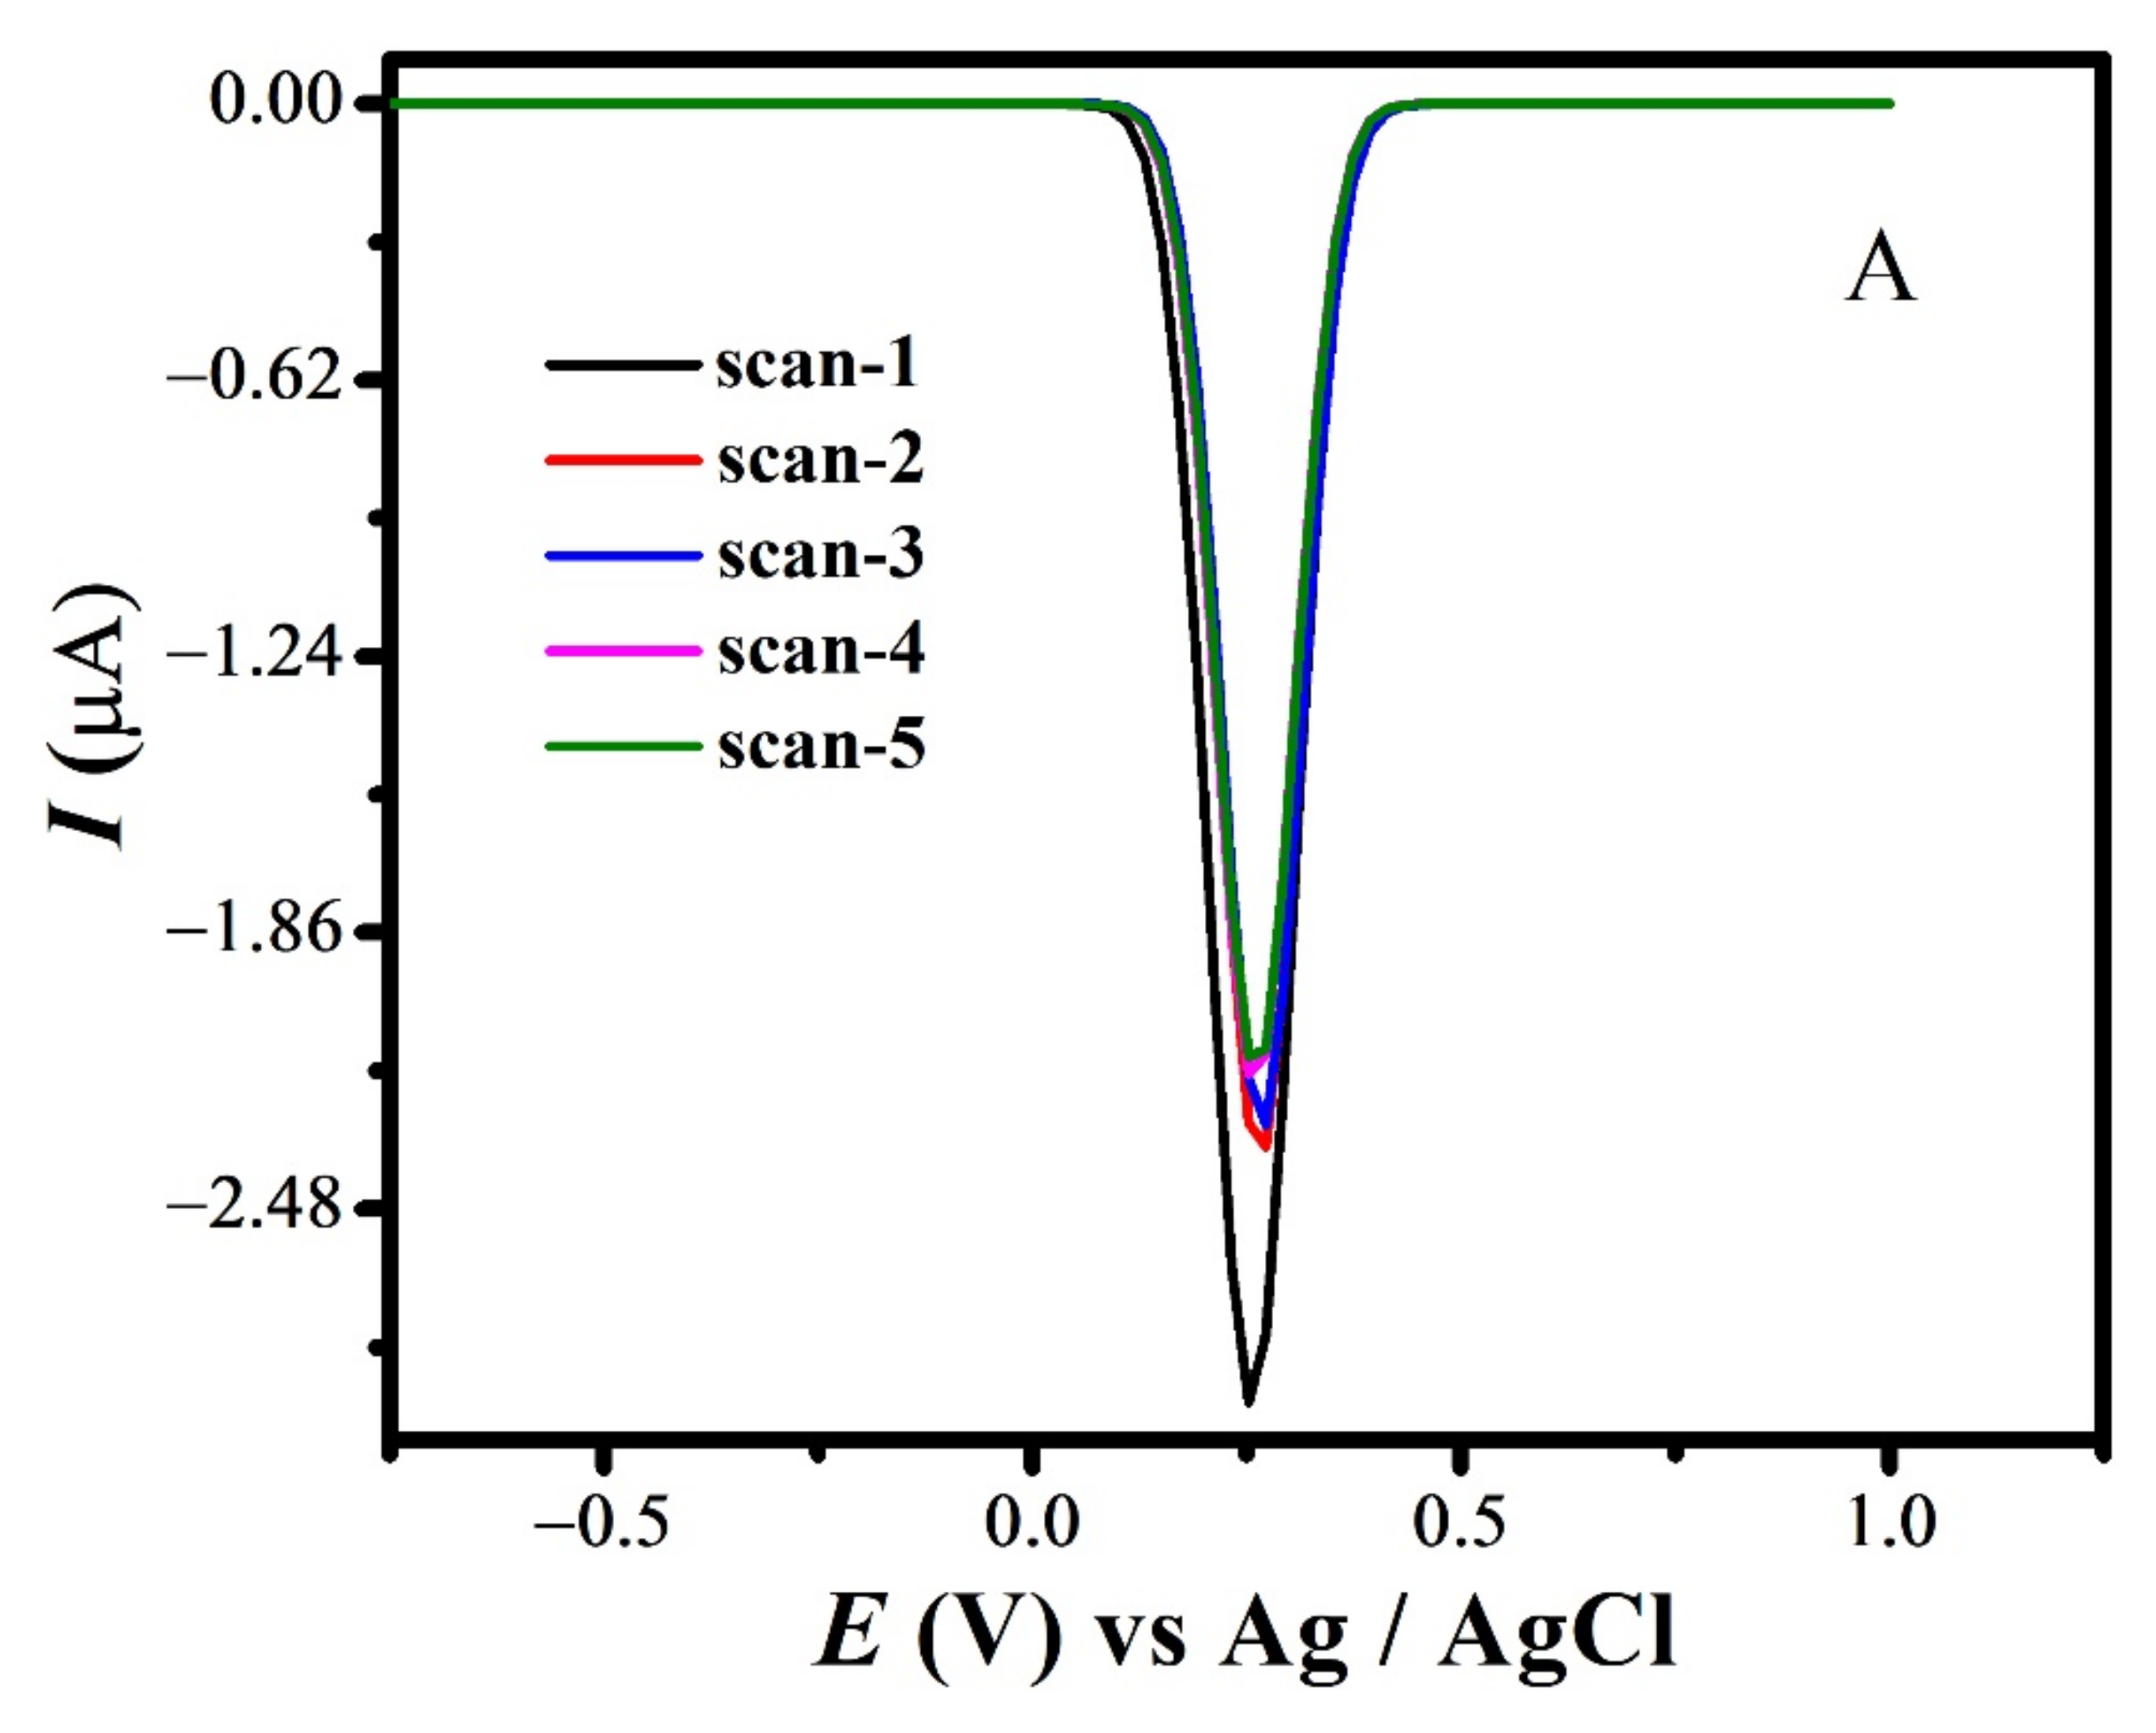
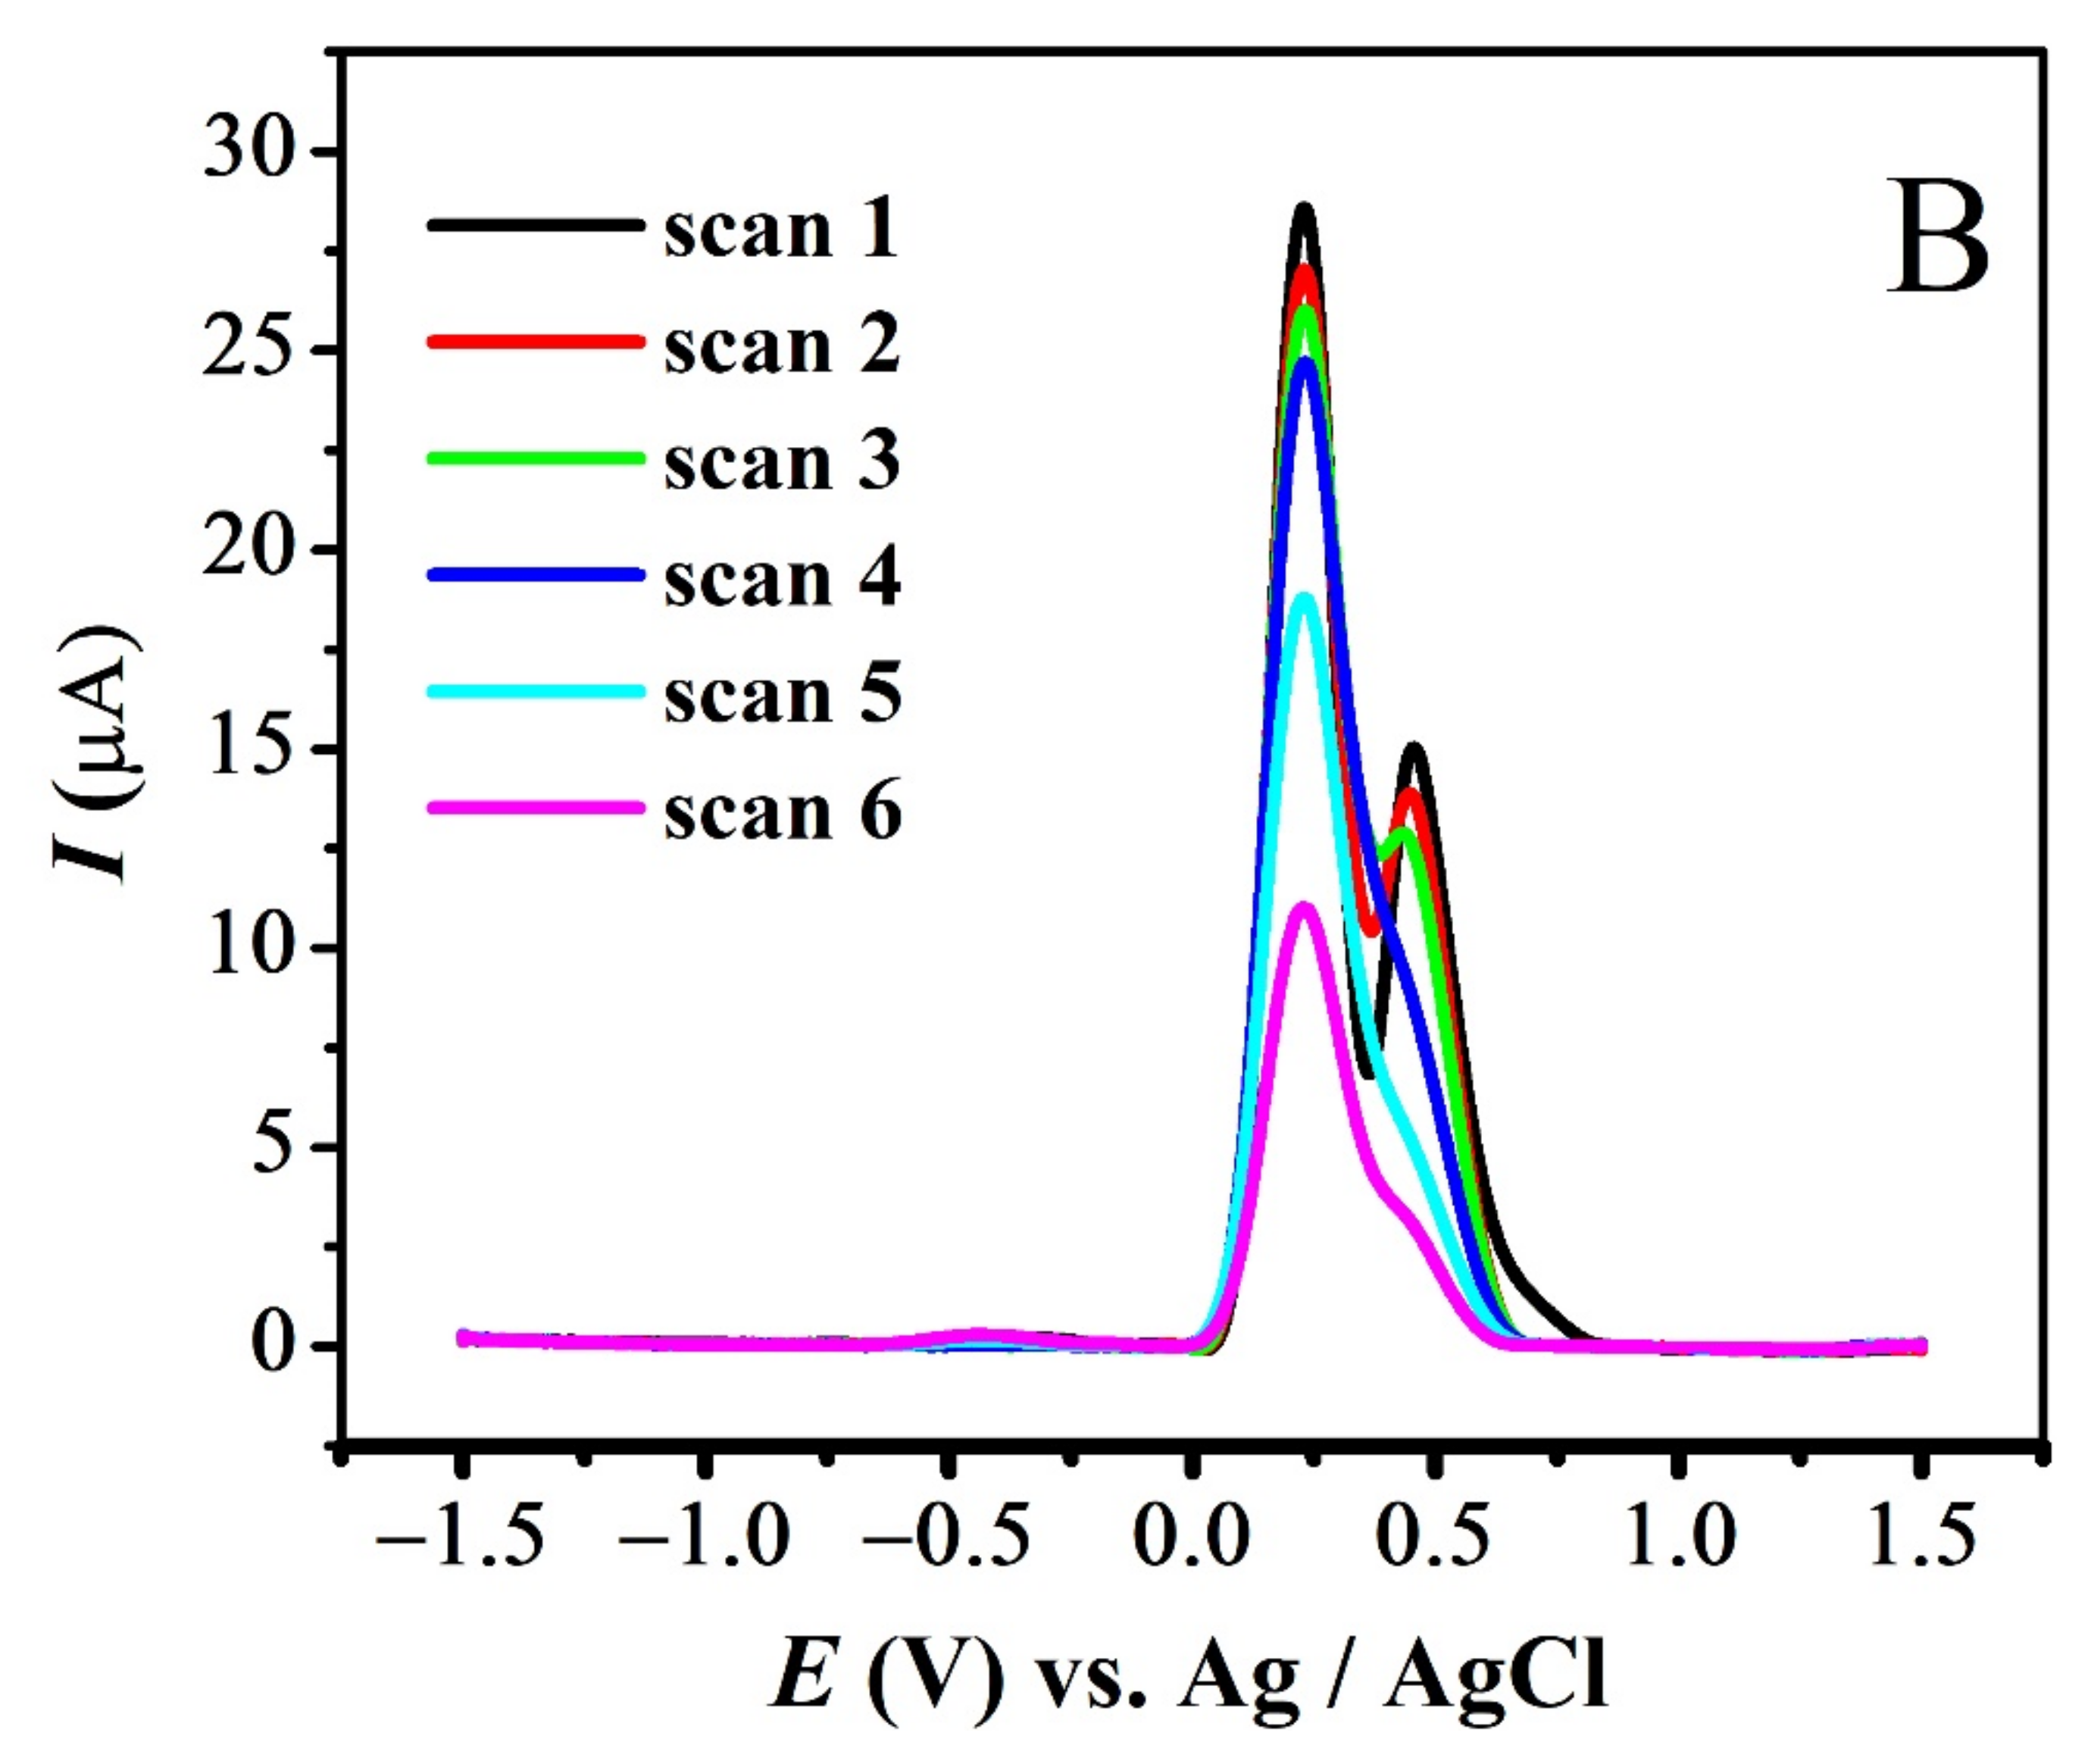
3.3. Square Wave Voltammetry

SWV is the most sensitive technique, as compared to other electrochemical techniques, because of greater pace of analysis, reserved consumption of electro-active species, rather than DPV and minimized problems of electrode surface poisoning [49]. The main advantage of SWV is the simultaneous recording of oxidation and reduction currents in one scan. This improvement thus helps in confirming the reversibility, irreversibility or quasi-reversibility of any electrochemical processes. Thus, SWV was employed to confirm the reversibility of redox peaks and to calculate ksh using diffusion coefficient values obtained from CV.
The quasi-reversible nature of the redox peaks of FBA and FA was confirmed by the inequality of magnitudes of If and Ir [46,47,48], as observed in SWV (see Figure 7 and Figure S3A,B). The effect of consecutive scans, by recording successive SWVs in the same solution for FBA without cleaning the GCE surface, also depicts the reversibility or non-reversibility of the redox process. In case of FBA, the peak intensity of the oxidation peak almost remained constant after the first scan without cleaning the electrode surface (see Figure 8A), displaying the electrochemical stability of ferrocene/ferrocenium [37] couple, complementing the CV results. Whereas for FMA, CFA and FA, intensity of the oxidation peak decreased significantly with the number of scans, owing to the adsorption of the oxidation product, making the redox process non-reversible (Figure 8B).
The effect of different concentrations was evaluated at pH 7 for all compounds. The results for FBA and FA are displayed in Figure 9A,B (see also Figure S4A,B). Decrease in the analyte concentration was followed by the decrease in anodic current intensity at 0.1 V/s. Values of ksh for all compounds listed in Table 3 were calculated using Reinmuths expression [50]. The values in the order of 10−4 cm/s supports the quasi-reversible nature of their oxidation process, in accordance with the reported criterion [50].
The standard deviation of concentration vs. peak current provided the values of the limit of detection (LOD) and limit of quantification (LOQ), using the relations LOD = 3s / m (slope = µA M−1) and LOQ = 10 s/m where ‘s’ is the standard deviation of the intercept and ‘m’ is the slope of the related calibration plot as listed in Table 4 [51] (Figure 9).

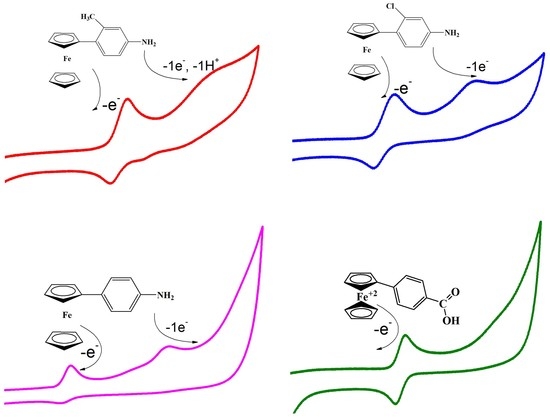
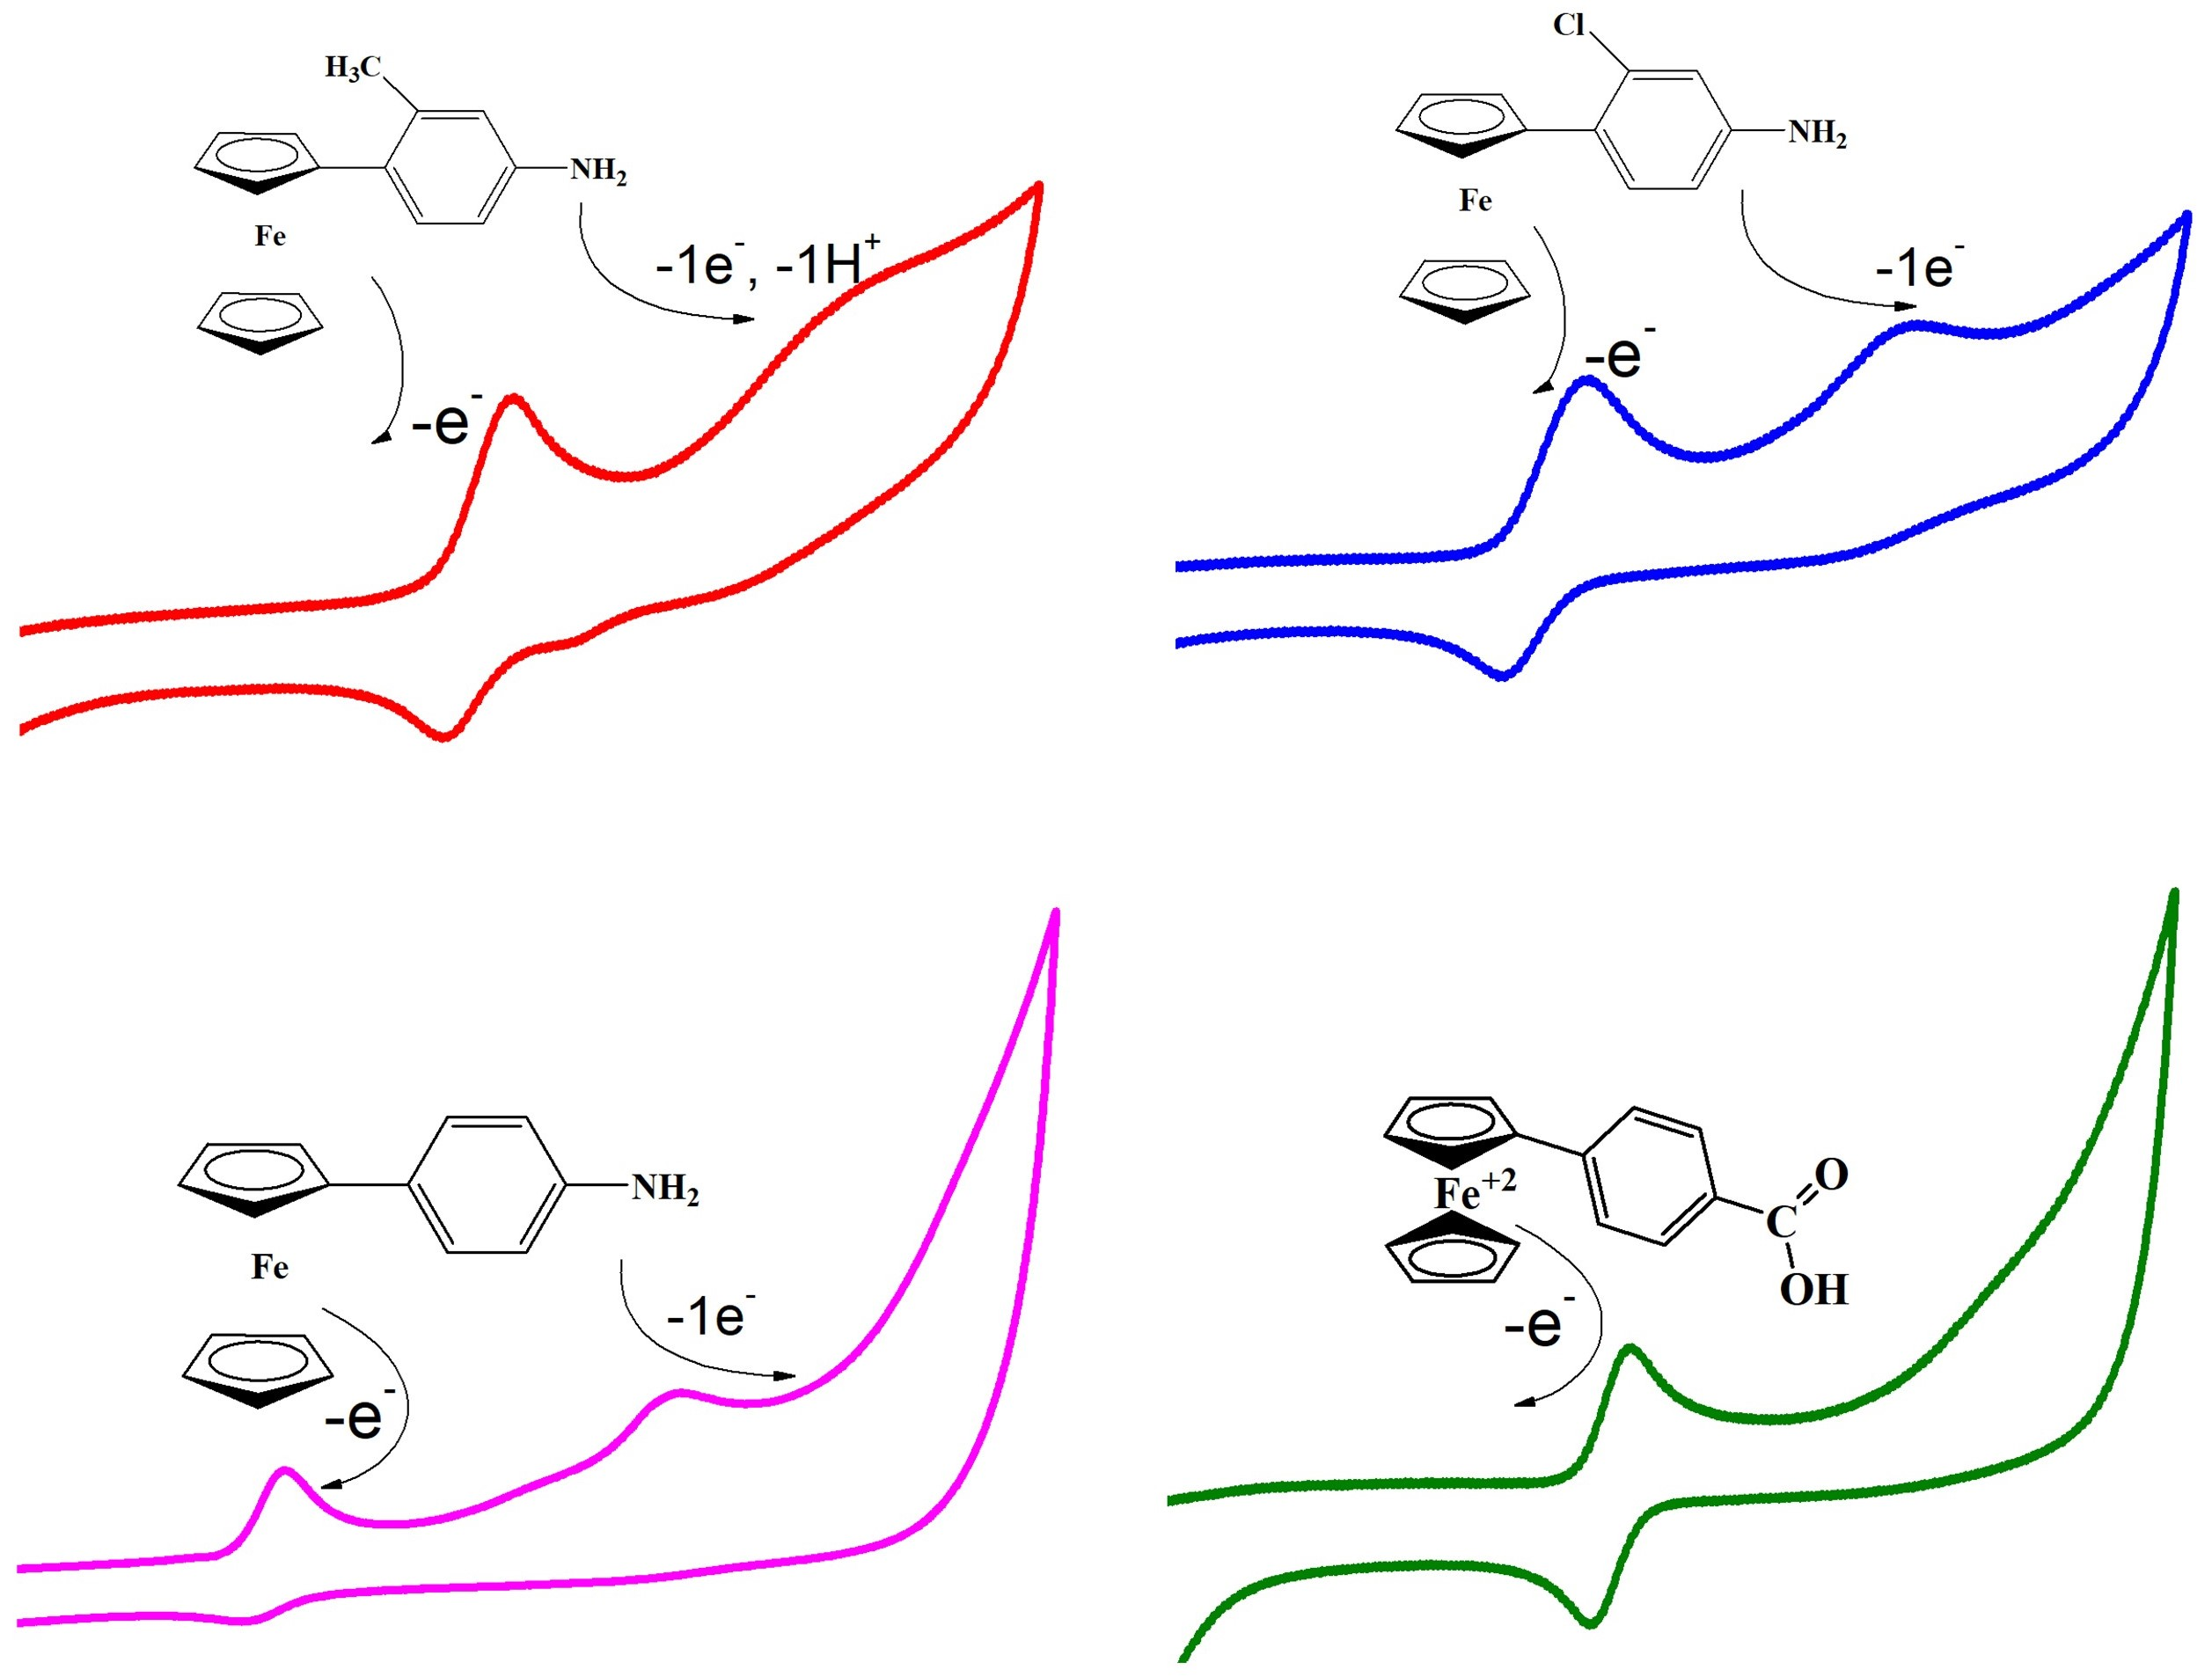
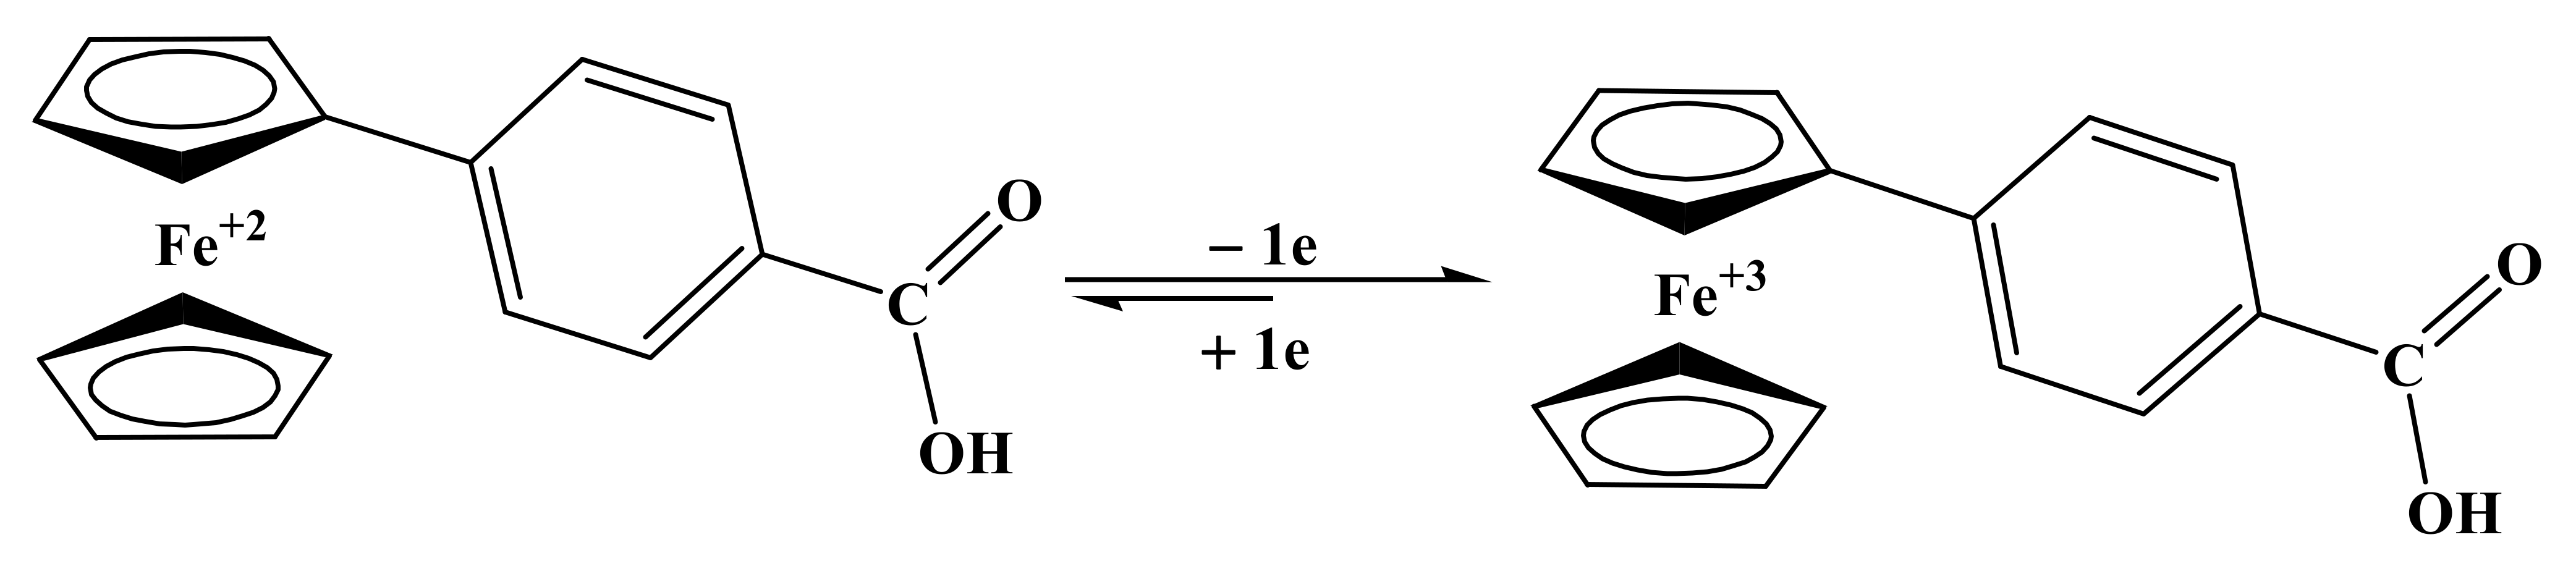
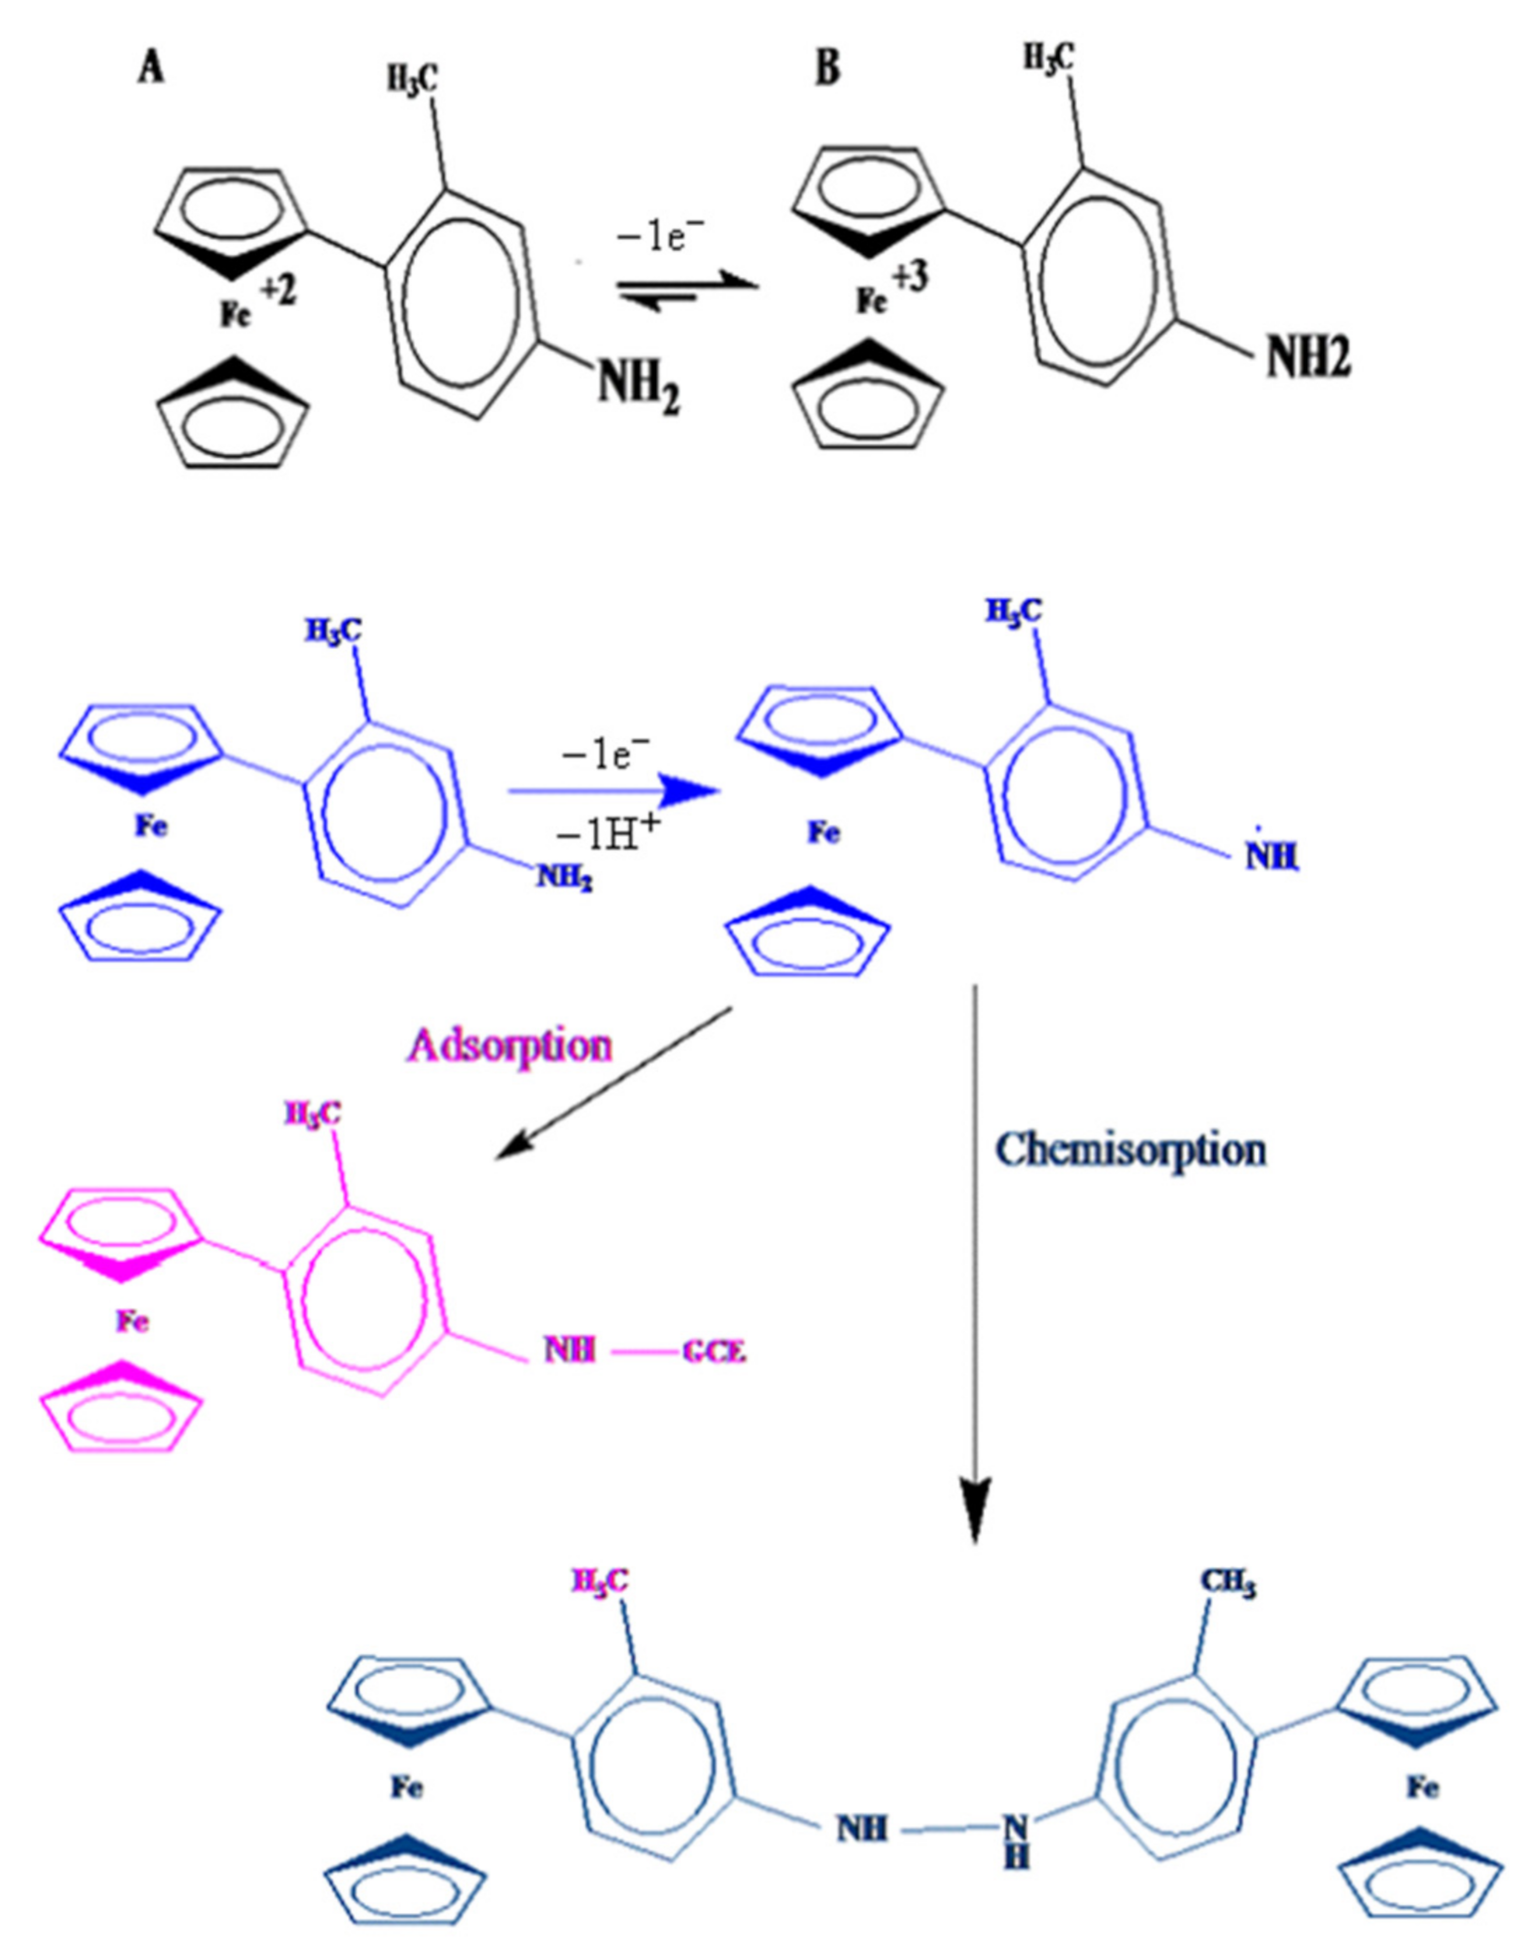
4. Proposed Redox Mechanism

Based on the information obtained from voltammetric measurements, we have proposed the redox mechanism of all the selected compounds on a carbon electrode surface. For FBA, peak 1a and 1c is attributed to redox behavior of the ferrocene nucleus, supported by various research publications [36]. Ep, W1/2, ∆Ep and Ia/Ic current ratio, D and ksh values revealed one electron, quasi-reversible, diffusion-controlled oxidation of ferrocene moiety as shown in Scheme 2.
For the other three aniline containing ferrocenyl compounds, (CFA, FMA and FA), redox signals (1a and 1c) are representative of the Fe+2/Fe+3 reversible couple. The second chemically irreversible oxidation peak (2a) is attributed to the oxidation of -NH2 group, by the loss of 1e and 1H+ in FMA and loss of 1e with no proton involvement in CFA and FA. The pka value of 11 for FMA (2a) shows protonation/deprotonation at this pH. Decrease in the original 2a signal (see Figure 5B) with scan numbers and the appearance of a new voltammetric signal corresponded to the electro polymerization of amine group, similar to what happens in the electrochemically induced electro polymerization of 4- N,N –Dimethyl amino phenyl group (DMAPP), attached to 1-ferrocenyl-prop-2-en-1-one. Scheme 3 shows the redox mechanism for one of these derivatives, FMA.

5. Conclusions

Detailed electrochemistry of four ferrocene derivatives was investigated using cyclic voltammetry, differential pulse voltammetry and square wave voltammetry. Cyclic voltammetry of ferrocenyl derivatives revealed that they displayed well-defined redox behavior of ferrocene moiety. A 2nd irreversible oxidation signal was also observed in addition to the conventional ferrocene redox couple, associated with attached -NH2 groups. The effect of different scan rates was employed to determine the diffusion coefficient of the compounds. Differential pulse voltammetry established that redox signals were found to be sensitive to pH and was employed to determine the number of electrons and protons involved in the process. Physical parameters like ksh, LOD and LOQ have been successfully determined through square wave voltammetry. Moreover, the reversibility of redox peaks was also evaluated through SWV, showing the quasi-reversible nature of redox peaks associated with ferrocene moiety in compounds. A redox mechanism was proposed based on the results of CV, DPV and SWV, demonstrating 1e oxidation of ferrocene moiety and 1e/1H+ oxidation of -NH2 groups attached with FMA. The peak potentials of CFA and FA did not shift with pH, therefore, indicating the involvement of one electron for both oxidation peaks. Results obtained from all three voltammetry techniques complemented well with each other and proposed a mechanism provided insight into the action mechanism of these derivatives in biological systems.

Supplementary Materials

The following supporting information can be downloaded at: https://www.mdpi.com/article/10.3390/c8030045/s1, Figure S1. Effect of scan rate using cyclic voltammetry for (A) FMA (B) CFA (C) FA. Figure S2. DPV of (A) CFA and (B) FA at various pH values. Figure S3. SWV of (A) CFA and (B) FA. Figure S4. Concentration effect of (A) CFA and (B) FMA studied using SWV to determine LOQ and LOD.

Author Contributions

S.A. performed the experiments and wrote the manuscript. S.M. contributed to the interpretation of results and explanation of the redox mechanism. A.S. supervised the research project. All authors have read and agreed to the published version of the manuscript.

Funding

This research received no external funding.

Institutional Review Board Statement

Not applicable.

Informed Consent Statement

Not applicable.

Data Availability Statement

The data presented in this study are available within the article and supplementary materials.

Acknowledgments

Afzal Shah gratefully acknowledges the research facilities provided by Quaid-i-Azam University, Islamabad, Pakistan.

Conflicts of Interest

The authors declare no conflict of interest.

References

  1. Koch, H.; Jørgensen, P.; Helgaker, T. The molecular structure of ferrocene. J. Chem. Phys. 1996, 104, 9528–9530. [Google Scholar] [CrossRef]
  2. Fabbrizzi, L. The ferrocenium/ferrocene couple: A versatile redox switch. ChemTexts 2020, 6, 22. [Google Scholar] [CrossRef]
  3. Bhatt, V. Essentials of Coordination Chemistry: A Simplified Approach with 3D Visuals; Academic Press: Cambridge, MA, USA, 2015. [Google Scholar]
  4. Saenger, W. Cyclodextrin inclusion compounds in research and industry. Angew. Chem. Int. Ed. Engl. 1980, 19, 344–362. [Google Scholar] [CrossRef]
  5. Bersier, P.M.; Bersier, J.; Klingert, B. Electrochemistry of cyclodextrins and cyclodextrin inclusion complexes. Electroanalysis 1991, 3, 443–455. [Google Scholar] [CrossRef]
  6. Heinze, K.; Lang, H. Ferrocene—Beauty and Function; ACS Publications: Washington, WA, USA, 2013; Volume 32, pp. 5623–5625. [Google Scholar]
  7. Amer, W.A.; Wang, L.; Amin, A.M.; Ma, L.; Yu, H. Recent progress in the synthesis and applications of some ferrocene derivatives and ferrocene-based polymers. J. Inorg. Organomet. Polym. Mater. 2010, 20, 605–615. [Google Scholar] [CrossRef]
  8. Corra, S.; Curcio, M.; Baroncini, M.; Silvi, S.; Credi, A. Photoactivated artificial molecular machines that can perform tasks. Adv. Mater. 2020, 32, 1906064. [Google Scholar] [CrossRef]
  9. Wang, C.-H.; Chen, K.-J.; Wu, T.-H.; Chang, H.-K.; Tsuchido, Y.; Sei, Y.; Chen, P.-L.; Horie, M. Ring rotation of ferrocene in interlocked molecules in single crystals. Chem. Sci. 2021, 12, 3871–3875. [Google Scholar] [CrossRef]
  10. Kaifer, A.E.; Gómez-Kaifer, M. Supramolecular Electrochemistry; John Wiley & Sons: Hoboken, NJ, USA, 2008. [Google Scholar]
  11. Shim, N.Y.; Bernards, D.A.; Macaya, D.J.; DeFranco, J.A.; Nikolou, M.; Owens, R.M.; Malliaras, G.G. All-plastic electrochemical transistor for glucose sensing using a ferrocene mediator. Sensors 2009, 9, 9896–9902. [Google Scholar] [CrossRef]
  12. Cunningham, L.; Benson, A.; Guiry, P.J. Recent developments in the synthesis and applications of chiral ferrocene ligands and organocatalysts in asymmetric catalysis. Org. Biomol. Chem. 2020, 18, 9329–9370. [Google Scholar] [CrossRef]
  13. Altun, A.; Apetrei, R.-M.; Camurlu, P. Reagentless amperometric glucose biosensors: Ferrocene-tethering and copolymerization. J. Electrochem. Soc. 2020, 167, 107507. [Google Scholar] [CrossRef]
  14. Soon, G.H.; Deasy, M.; Dempsey, E. An Electrochemical Evaluation of Novel Ferrocene Derivatives for Glutamate and Liver Biomarker Biosensing. Biosensors 2021, 11, 254. [Google Scholar] [CrossRef]
  15. Guven, N.; Apetrei, R.-M.; Camurlu, P. Next step in 2nd generation glucose biosensors: Ferrocene-loaded electrospun nanofibers. Mater. Sci. Eng. C 2021, 128, 112270. [Google Scholar] [CrossRef] [PubMed]
  16. Beitollahi, H.; Khalilzadeh, M.A.; Tajik, S.; Safaei, M.; Zhang, K.; Jang, H.W.; Shokouhimehr, M. Recent advances in applications of voltammetric sensors modified with ferrocene and its derivatives. ACS Omega 2020, 5, 2049–2059. [Google Scholar] [CrossRef] [PubMed]
  17. Zhang, M.; Ma, C.; Du, D.; Xiang, J.; Yao, S.; Hu, E.; Liu, S.; Tong, Y.; Wong, W.Y.; Zhao, Q. Donor–acceptor metallopolymers containing ferrocene for brain inspired memristive devices. Adv. Electron. Mater. 2020, 6, 2000841. [Google Scholar] [CrossRef]
  18. Salas, M.; Gordillo, B.; González, F.J. Current measurements as a tool to characterise the H-bonding between 1-ferrocenylmethylthymine and 9-octyladenine: A voltammetric and chronoamperometric analysis. J. Electroanal. Chem. 2004, 574, 33–39. [Google Scholar] [CrossRef]
  19. Camm, K.D.; Furtado, S.J.; Gott, A.L.; McGowan, P.C. Synthesis and structural studies of bis-amino-functionalised ferrocene salts and ferrocenium salts. Polyhedron 2004, 23, 2929–2936. [Google Scholar] [CrossRef]
  20. Padeste, C.; Steiger, B.; Grubelnik, A.; Tiefenauer, L. Molecular assembly of redox-conductive ferrocene–streptavidin conjugates—towards bio-electrochemical devices. Biosens. Bioelectron. 2004, 20, 545–552. [Google Scholar] [CrossRef]
  21. Zhang, F.-F.; Wan, Q.; Wang, X.-L.; Sun, Z.-D.; Zhu, Z.-Q.; Xian, Y.-Z.; Jin, L.-T.; Yamamoto, K. Amperometric sensor based on ferrocene-doped silica nanoparticles as an electron transfer mediator for the determination of glucose in rat brain coupled to in vivo microdialysis. J. Electroanal. Chem. 2004, 571, 133–138. [Google Scholar] [CrossRef]
  22. Asaftei, S.; Walder, L. Covalent layer-by-layer type modification of electrodes using ferrocene derivatives and crosslinkers. Electrochim. Acta 2004, 49, 4679–4685. [Google Scholar] [CrossRef]
  23. Pandey, P.; Upadhyay, S.; Upadhyay, A. Electrochemical sensors based on functionalized ormosil-modified electrodes—Role of ruthenium and palladium on the electrocatalysis of nadh and ascorbic acid. Sens. Actuators B Chem. 2004, 102, 126–131. [Google Scholar] [CrossRef]
  24. Pandey, P.; Upadhyay, S.; Shukla, N.; Sharma, S. Studies on the electrochemical performance of glucose biosensor based on ferrocene encapsulated ORMOSIL and glucose oxidase modified graphite paste electrode. Biosens. Bioelectron. 2003, 18, 1257–1268. [Google Scholar] [CrossRef]
  25. Pandey, P.; Upadhyay, S.; Tiwari, I.; Sharma, S. A Novel Ferrocene-Encapsulated Palladium-Linked Ormosil-Based Electrocatalytic Biosensor. The Role of the Reactive Functional Group. Electroanal. Int. J. Devoted Fundam. Pract. Asp. Electroanal. 2001, 13, 1519–1527. [Google Scholar] [CrossRef]
  26. Gritzner, G.; Kuta, J. Recommendations on reporting electrode potentials in nonaqueous solvents (Recommendations 1983). Pure Appl. Chem. 1984, 56, 461–466. [Google Scholar] [CrossRef]
  27. Abraham, K. Directions in secondary lithium battery research and development. Electrochim. Acta 1993, 38, 1233–1248. [Google Scholar] [CrossRef]
  28. Nawaz, H.; Akhter, Z.; Yameen, S.; Siddiqi, H.M.; Mirza, B.; Rifat, A. Synthesis and biological evaluations of some Schiff-base esters of ferrocenyl aniline and simple aniline. J. Organomet. Chem. 2009, 694, 2198–2203. [Google Scholar] [CrossRef]
  29. Kerman, K.; Mahmoud, K.A.; Kraatz, H.-B. An electrochemical approach for the detection of HIV-1 protease. Chem. Commun. 2007, 37, 3829–3831. [Google Scholar] [CrossRef]
  30. Sarhan, A.A.; Ibrahim, M.S.; Kamal, M.M.; Mitobe, K.; Izumi, T. Synthesis, cyclic voltammetry, and UV–Vis studies of ferrocene-dithiafulvalenes as anticipated electron-donor materials. Mon. Chem.-Chem. Mon. 2009, 140, 315–323. [Google Scholar] [CrossRef]
  31. Lal, B.; Kanwal, A.; Altaf, A.A.; Badshah, A.; Asghar, F.; Akhter, S.; Ullah, S.; Khan, S.I.; Tahir, M.N. Synthesis, crystal structure, spectral and electrochemical characterization, DNA binding and free radical scavenging studies of ferrocene-based thioureas. J. Coord. Chem. 2019, 72, 2376–2392. [Google Scholar] [CrossRef]
  32. Asghar, F.; Munir, S.; Fatima, S.; Murtaza, B.; Patujo, J.; Badshah, A.; Butler, I.S.; Taj, M.B.; Tahir, M.N. Ferrocene-functionalized anilines as potent anticancer and antidiabetic agents: Synthesis, spectroscopic elucidation, and DFT calculations. J. Mol. Struct. 2022, 1249, 131632. [Google Scholar] [CrossRef]
  33. Asghar, F.; Badshah, A.; Fatima, S.; Zubair, S.; Butler, I.S.; Tahir, M.N. Biologically active meta-substituted ferrocenyl nitro and amino complexes: Synthesis, structural elucidation, and DFT calculations. J. Organomet. Chem. 2017, 843, 48–61. [Google Scholar] [CrossRef]
  34. Nawaz, S.; Asghar, F.; Patujo, J.; Fatima, S.; Murtaza, B.; Munir, S.; Naz, M.; Badshah, A.; Butler, I.S. New ferrocene-integrated multifunctional guanidine surfactants: Synthesis, spectroscopic elucidation, DNA interaction studies, and DFT calculations. New J. Chem. 2022, 46, 185–198. [Google Scholar] [CrossRef]
  35. Muller, T.J.; Conradie, J.; Erasmus, E. A spectroscopic, electrochemical and DFT study of para-substituted ferrocene-containing chalcone derivatives: Structure of FcCOCHCH (p-tBuC6H4). Polyhedron 2012, 33, 257–266. [Google Scholar] [CrossRef]
  36. Cardona, R.A.; Hernández, K.; Pedró, L.E.; Otaño, M.R.; Montes, I.; Guadalupe, A.R. Electrochemical and spectroscopical characterization of ferrocenyl chalcones. J. Electrochem. Soc. 2010, 157, F104. [Google Scholar] [CrossRef]
  37. Terki, B.; Lanez, T. Anodic behaviour investigation of (ferrocenylmethyl) trimethylammonium cation. Ann. Sci. Technol. 2007, 1, 6. [Google Scholar]
  38. Kennedy, K.G.; Miles, D.T. Electrochemistry of ferrocene-modified monolayer-protected gold nanoclusters at reduced temperatures. J. Undergrad. Chem. Res. 2004, 4, 145. [Google Scholar]
  39. Neghmouche, N.; Lanez, T. Electrochemical properties of ferrocene in aqueous and organic mediums at glassy carbon electrode. Recent Trends Phys. Chem. Int. J. 2013, 1, 1–3. [Google Scholar]
  40. Seiwert, B.; Karst, U. Ferrocene-based derivatization in analytical chemistry. Anal. Bioanal. Chem. 2008, 390, 181–200. [Google Scholar] [CrossRef]
  41. Pournaghi-Azar, M.; Ojani, R. Catalytic oxidation of ascorbic acid by some ferrocene derivative mediators at the glassy carbon electrode. Application to the voltammetric resolution of ascorbic acid and dopamine in the same sample. Talanta 1995, 42, 1839–1848. [Google Scholar] [CrossRef]
  42. Shah, A.; Nosheen, E.; Munir, S.; Badshah, A.; Qureshi, R.; Muhammad, N.; Hussain, H. Characterization and DNA binding studies of unexplored imidazolidines by electronic absorption spectroscopy and cyclic voltammetry. J. Photochem. Photobiol. B Biol. 2013, 120, 90–97. [Google Scholar] [CrossRef]
  43. Nosheen, E.; Shah, A.; Badshah, A.; Hussain, H.; Qureshi, R.; Ali, S.; Siddiq, M.; Khan, A.M. Electrochemical oxidation of hydantoins at glassy carbon electrode. Electrochim. Acta 2012, 80, 108–117. [Google Scholar] [CrossRef]
  44. Nicholson, R.S. Theory and application of cyclic voltammetry for measurement of electrode reaction kinetics. Anal. Chem. 1965, 37, 1351–1355. [Google Scholar] [CrossRef]
  45. Shah, A.; Nosheen, E.; Qureshi, R.; Yasinzai, M.M.; Lunsford, S.K.; Dionysiou, D.D.; Siddiq, M.; Badshah, A.; Ali, S. Electrochemical characterization, detoxification and anticancer activity of didodecyldimethylammonium bromide. Int. J. Org. Chem. 2011, 1, 183. [Google Scholar] [CrossRef]
  46. Munir, S.; Shah, A.; Zafar, F.; Badshah, A.; Wang, X.; Rehman, Z.-U.; Hussain, H.; Lunsford, S.K. Redox behavior of a derivative of vitamin K at a glassy carbon electrode. J. Electrochem. Soc. 2012, 159, G112. [Google Scholar] [CrossRef]
  47. Munir, S.; Shah, A.; Rauf, A.; Badshah, A.; Hussain, H.; Ahmad, Z. Redox behavior of juglone in buffered aq.: Ethanol media. C. R. Chim. 2013, 16, 1140–1146. [Google Scholar] [CrossRef]
  48. Munir, S.; Shah, A.; Rauf, A.; Badshah, A.; Lunsford, S.K.; Hussain, H.; Khan, G.S. Redox behavior of a novel menadiol derivative at glassy carbon electrode. Electrochim. Acta 2013, 88, 858–864. [Google Scholar] [CrossRef]
  49. Golea, D.; Diculescu, V.; Enache, A.; Butu, A.; Tugulea, L.; Brett, A.O. Electrochemical evaluation of dsDNA—Liposomes interactions. Dig. J. Nanomater. Biostruct. 2012, 7, 1333–1342. [Google Scholar]
  50. Shah, A.; Khan, A.M.; Qureshi, R.; Ansari, F.L.; Nazar, M.F.; Shah, S.S. Redox behavior of anticancer chalcone on a glassy carbon electrode and evaluation of its interaction parameters with DNA. Int. J. Mol. Sci. 2008, 9, 1424–1434. [Google Scholar] [CrossRef]
  51. Yardim, Y.; Şentürk, Z. Voltammetric behavior of indole-3-acetic acid and kinetin at pencil-lead graphite electrode and their simultaneous determination in the presence of anionic surfactant. Turk. J. Chem. 2011, 35, 413–426. [Google Scholar] [CrossRef]
Scheme 1. Structures and names of studied ferrocenyl derivatives.
Carbon 08 00045 sch001
Figure 1. CVs of 2 mM ferrocene derivatives in pH 7 at 0.1 V/s.
Carbon 08 00045 g001
Figure 2. CVs of 2 mM FBA at different scan rates.
Carbon 08 00045 g002
Figure 3. Plot of log Ipa vs. log ν for (A) FBA (B) FA (C) CFA (D) FMA.
Carbon 08 00045 g003
Figure 4. CVs of FMA showing scan rates effect.
Carbon 08 00045 g004
Figure 5. (A) DPV of FBA obtained at 0.1 V/s in different pH media and (B) plot of Epa vs. pH of FBA.
Carbon 08 00045 g005
Figure 6. (A) DPVs obtained at 0.1 V/s in different pH media and (B) plot of Epa vs. pH of FMA.
Carbon 08 00045 g006
Figure 7. SWV indicating net, forward and reverse current for (A) FBA and (B) FA.
Carbon 08 00045 g007aCarbon 08 00045 g007b
Figure 8. SWV Consecutive scans of (A) FBA and (B) FMA without cleaning electrode.
Carbon 08 00045 g008aCarbon 08 00045 g008b
Figure 9. Concentration effect recorded in pH-7 at scan rate 0.1 V/s and inset plot of concentration (mM) vs. peak current (µA) for (A) FBA and (B) FA.
Carbon 08 00045 g009aCarbon 08 00045 g009b
Scheme 2. Proposed redox mechanism of FBA at pH 3 to 10 for oxidation/reduction peak.
Carbon 08 00045 sch002
Scheme 3. Proposed redox mechanism of 4-Ferrocenyl,3-methyl aniline (FMA).
Carbon 08 00045 sch003
Table 1. Summary of electrochemical data obtained from CV.
CompoundRedox SignalVoltammetric Parameter
Ipa
(µA)
Ep
(V)
EpEp1/2
(V)
Ep
(V)
Ipa/ IpcD/10−7 cm2 s−1H+sReversibility
FMA1a13.20.31-0.124.129.03-QR
1c−3.20.23-
2a150.840.08-- 1IR
CFA1a14.60.27-0.132.929.18-QR
1c−50.11-
2a160.850.07-- IR
FA1a8.320.17-0.072.975.53-QR
1c−2.80.1-
2a180.850.07 IR
FBA1a9.900.360.050.071.55.64-QR
1c6.220.270.06
Table 2. Summary of important electrochemical parameters obtained for all compounds.
CompoundΔEp (V)ψksh × 10−4
(cm/sec)
α = (E1/2−Epc)/Epa−Epc
FMA1150.3948.90.476
CFA1500.2124.80.453
FA1050.4968.71.1
FBA0.0731.516.75.69
Table 3. D and ksh values for quasi-reversible and irreversible systems for all studied ferrocenyl derivatives.
CompoundsSignal 1aSignal 2a
D (cm2/s)ksh (cm/s)D (cm2/s)ksh (cm/s)
FMA9.03 × 10−78.90 × 10−48.92 × 10−64.66 × 10⁻⁴
CFA9.18 × 10−78.47 × 10−46.79 × 10−61.40 × 10⁻⁴
FA5.53 × 10−75.45 × 10−45.752 × 10−61.30 × 10⁻⁴
FBA5.64 × 10−76.74 × 10⁻⁴--
Table 4. The values of LOD and LOQ calculated for all compounds.
CompoundssR2mLOD (µA)
(1a)
LOD (µA)
(2a)
LOQ (µA)
(1a)
LOQ (µA)
(2a)
FMA0.4320.977.100.1830.1120.610.028
CFA0.2690.975.720.1410.1130.540.094
FA0.2090.973.670.1710.1190.560.390
FBA0.2380.944.580.113-0.52-
Publisher’s Note: MDPI stays neutral with regard to jurisdictional claims in published maps and institutional affiliations.

